Temporal Dynamics of Coordinated Online Behavior:
Stability, Archetypes, and Influence
Abstract
Large-scale online campaigns, malicious or otherwise, require a significant degree of coordination among participants, which sparked interest in the study of coordinated online behavior. State-of-the-art methods for detecting coordinated behavior perform static analyses, disregarding the temporal dynamics of coordination. Here, we carry out the first dynamic analysis of coordinated behavior. To reach our goal we build a multiplex temporal network and we perform dynamic community detection to identify groups of users that exhibited coordinated behaviors in time. Thanks to our novel approach we find that: (i) coordinated communities feature variable degrees of temporal instability; (ii) dynamic analyses are needed to account for such instability, and results of static analyses can be unreliable and scarcely representative of unstable communities; (iii) some users exhibit distinct archetypal behaviors that have important practical implications; (iv) content and network characteristics contribute to explaining why users leave and join coordinated communities. Our results demonstrate the advantages of dynamic analyses and open up new directions of research on the unfolding of online debates, on the strategies of coordinated communities, and on the patterns of online influence.
Introduction
Online platforms offer unprecedented opportunities to organize and carry out large-scale activities, defying the constraints that limit physical interactions. A wide range of activities benefit from such opportunities, including legitimate information campaigns and political protests (Steinert-Threlkeld et al. 2015; Francois, Barash, and Kelly 2021), as well as potentially nefarious ones such as disinformation campaigns and targeted harassment (Mariconti et al. 2019; Di Pietro et al. 2021). A common characteristic of large-scale online campaigns is the significant degree of coordination among the users involved, which is needed to spread content widely and to let the campaigns obtain significant outreach, ultimately ensuring their success (Nizzoli et al. 2021).
Due to the pervasiveness of coordinated online behavior and its relevance for the effectiveness of both benign and malicious campaigns, the topic gained much scholarly attention. For example, a few methods were recently proposed for detecting coordinated communities (CCs) and for measuring the extent of coordination between users and CCs (Pacheco et al. 2021; Nizzoli et al. 2021; Weber and Neumann 2021). These define coordination as an unexpected or exceptional similarity between the actions of two or more users. The analysis is carried out by building a user similarity network based on common user activities (e.g., co-retweets) and by studying it with network science techniques. A limitation of the existing methods is that they are based on static analyses. For example, Nizzoli et al. (2021); Pacheco et al. (2021); Weber and Neumann (2021) each build a single aggregated network that encodes user behaviors occurred throughout many weeks. However, online behaviors are dynamic (i.e., time-varying) (Weber and Falzon 2021). As such, aggregating behaviors over many weeks (or months) of time represents an oversimplification that risks overshadowing important temporal dynamics. On the contrary, a minority of detection methods solely model time (Sharma et al. 2021; Zhang, Sharma, and Liu 2021), disregarding other important facets of online coordination such as the interactions between users. Due to the above methodological limitations, the temporal dynamics of coordinated behavior are, so far, essentially unexplored.
Contributions. In this work we carry out the first dynamic analysis of coordinated behavior. Instead of working with static networks, we build and analyze a multiplex temporal network (Mucha et al. 2010) and we leverage state-of-the-art dynamic community detection algorithms (Rossetti and Cazabet 2018) to find groups of users that exhibited coordinated behaviors in time. We apply our method to a reference dataset of coordinated behaviors occurred on Twitter in the run up to the 2019 UK general elections (Nizzoli et al. 2021; Hristakieva et al. 2022). In this way we are able to compare the results of our novel dynamic analysis to the static ones, demonstrating the advantages of the former. Most importantly however, our innovative approach opens up new directions of research and allows answering to the following research questions:
RQ1 – To what extent are coordinated communities stable over time? So far, coordinated behavior has been studied with static methods. However, some CCs might exhibit temporal instability, meaning that, through time, a significant portion of members leave the community while others join it. In this case, time-aggregated static analyses would yield unreliable results by overshadowing the temporal variations. Here, we compare static and dynamic results, and we shed light on the stability of CCs.
RQ2 – What are the temporal dynamics of user behavior with respect to the evolving coordinated communities? In case a certain degree of instability existed, some users would belong to different CCs at different points in time. This phenomenon has never been observed before, let alone studied. Here, we investigate the dynamics with which user membership to CCs changes through time and their implications on the effectiveness of online campaigns.
RQ3 – Why do users belong to different coordinated communities through time? Different patterns of user membership to CCs are indicative of markedly different situations. For instance, users who remain in the same community for a long time might be strong supporters of that community. Conversely, users who abandon a community in favor of another might have been disappointed by the former or persuaded by the latter. In any case, investigating the possible reasons for user shifts between CCs (or lack thereof) is a novel direction of research with important practical implications (e.g., the study of online influence). Here, we analyze users who exhibit different behaviors and we compare them to their respective CCs, gaining insights into why some users change community at times.
Based on the results to the aforementioned RQs, our main contributions are summarized as follows:
-
•
We carry out the first dynamic analysis of coordinated online behavior.
-
•
We show that the communities involved in the 2019 UK electoral debate featured variable degrees of instability, which motivates dynamic analyses.
-
•
We find that the majority of user shifts from a community to another occurred between similar (like-minded) communities, while only a minority involved very different communities.
-
•
We define and characterize three archetypes of users with markedly different behaviors, namely: (i) stationary, (ii) influenced, and (iii) volatile users.
-
•
We find that content and network characteristics are useful for understanding why users move between communities.
Related Work
The majority of existing approaches for detecting coordinated behavior are based on network science. These works model common activities between users (e.g., co-retweets, temporal and linguistic similarities, etc.) to build user similarity networks and to subsequently analyze them, for example by means of community detection algorithms (Cao et al. 2015; Weber and Neumann 2021; Pacheco et al. 2021; Nizzoli et al. 2021; Magelinski, Ng, and Carley 2022). The typical output of these methods is a network where the CCs are identified. Some network-based methods do not only detect coordination as in a binary classification task, but also quantify the extent of coordination between users and communities, thus providing more nuanced results (Nizzoli et al. 2021). Notably, all aforementioned methods build static networks and employ static community detection algorithms. So far, the dynamic analysis of coordinated behavior is essentially unexplored. To this end however, several advances were proposed to model time-varying behaviors with multiplex temporal networks (Mucha et al. 2010) and to employ dynamic community detection algorithms (Rossetti and Cazabet 2018). Our work applies these techniques – for the first time – to the study of coordinated behavior, thus moving beyond the current state-of-the-art. In addition to network-based approaches, others proposed to detect coordination with temporal point processes where user activities are modeled as the realization of a stochastic process (Sharma et al. 2021; Zhang, Sharma, and Liu 2021). These methods are capable of modeling the latent influence between the coordinated accounts, their strongly organized nature, and possible prior available knowledge. Finally, others adopted traditional feature engineering approaches to find similarities between users (Francois, Barash, and Kelly 2021), or focused on specific user behaviors such as URL sharing (Cao et al. 2015; Giglietto et al. 2020).
Once coordinated behaviors are detected, subsequent efforts are devoted to characterizing CCs. Characterization tasks are typically aimed at distinguishing between malicious (e.g., disinformation networks) and genuine (e.g., fandoms, activists) forms of coordination (Vargas, Emami, and Traynor 2020; Mendoza, Tesconi, and Cresci 2020; Hristakieva et al. 2022). This can be achieved by analyzing the content shared by the CCs, as done by Cao et al. (2015) that considered the reliability of the shared news, or by Hristakieva et al. (2022) that estimated the amount of shared propaganda. Others analyzed the structural properties of the coordination networks, finding differences between malicious and benign CCs (Vargas, Emami, and Traynor 2020; Nizzoli et al. 2021). Finally, another interesting direction of research revolves around estimating the influence that CCs have on other users. However, existing results in this area are still scant and contradictory. For example, Cinelli et al. (2022) studied network properties of information cascades on Twitter, finding that coordinated users have a strong influence on the non-coordinated ones that participate in the same cascade. Contrarily, Sharma et al. (2021) found that coordinated users have a strong influence on other coordinated users and only a small influence on non-coordinated ones. Here, we show that temporal coordination networks are a valuable tool towards assessing the influence that CCs exert on the users in a network.
Dataset
| leaning | hashtag/account | tweets |
| labour | @jeremycorbyn | 2,422,162 |
| @UKLabour | 668,264 | |
| #VoteLabour | 1,051,204 | |
| #VoteLabour2019 | 272,975 | |
| #ForTheMany | 42,486 | |
| #ForTheManyNotTheFew | 42,403 | |
| #ChangeIsComing | 15,903 | |
| #RealChange | 314,279 | |
| neutral | #GE2019 | 3,006,685 |
| #GeneralElection19 | 335,202 | |
| #GeneralElection2019 | 855,162 | |
| conservative | @BorisJohnson | 973,546 |
| @Conservatives | 592,068 | |
| #VoteConservative | 338,689 | |
| #VoteConservative2019 | 35,272 | |
| #BackBoris | 186,794 | |
| #GetBrexitDone | 204,368 |
We leverage a publicly available111http://doi.org/10.5281/zenodo.4647893 reference dataset related to the online Twitter debate about the 2019 UK general elections. This dataset is relevant for our present study since it has already been the subject of static analyses of coordinated behaviors (Nizzoli et al. 2021; Hristakieva et al. 2022). The dataset was built by Nizzoli et al. (2021) via the Twitter Streaming API during the last month before the UK 2019 election day, namely between November 12 and December 12, 2019. The data collection process was based on a combination of election-related hashtags, party hashtags, as well as party and leader accounts. Specifically, all tweets containing at least one of the hashtags shown in Table 1 were collected. In addition, all tweets produced by the two main parties and their leaders, as well as all interactions (i.e., retweets and replies) they received, were also collected. Table 1 reports the number of tweets collected for each hashtag and account. Overall, the dataset contains 11,264,820 distinct tweets about the 2019 UK general election published by 1,179,659 distinct users. As a result of the choice of hashtags and accounts, the dataset contains both partisan (left- and right-leaning) and neutral tweets, as shown in Table 1.
Method
To detect and study coordinated behavior we broadly follow the state-of-the-art network analysis frameworks recently proposed by Nizzoli et al. (2021); Pacheco et al. (2021); Weber and Neumann (2021), which consider repeated similarities in user behaviors as a proxy for coordination. However, we differentiate from the existing methods by building a dynamic multiplex network instead of a static one, and by analyzing it with a dynamic community detection algorithm. Our detailed methodology is presented in the following:
-
1.
Preliminaries. To enable comparisons with previous works who analyzed this dataset we compute user similarity based on co-retweets – the action of retweeting the same tweet by different users; and we analyze superspreaders – the top 1% users with the most retweets.222Despite accounting for only 1% of all users, superspreaders produced 39% of all tweets and 44% of all retweets in the dataset.
-
2.
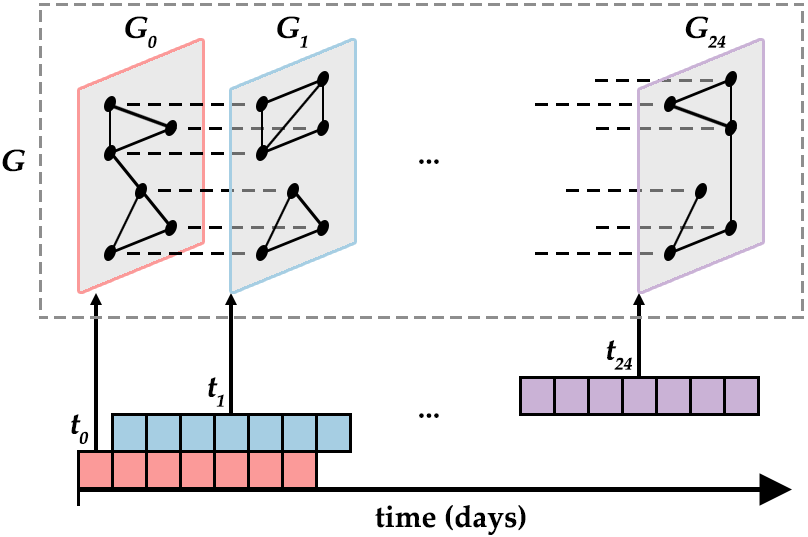
Dynamic network modeling. We build our dynamic user similarity network as a multiplex temporal network where each layer models user behaviors occurred during a given time window . We work with a sequence of discrete and overlapping time windows: each has a duration days and an offset day from . As sketched in Figure 1, we end up with time windows that cover the one month-long time span of the dataset. For each we build a weighted undirected user similarity network . To obtain we first model each user with the TF-IDF weighted vector of the tweets it retweeted during . An edge between two users exists if they retweeted at least one common tweet during . Edge weights are computed as the cosine similarity between pairs of user vectors. The TF-IDF weighting scheme discounts retweets of viral tweets and emphasizes user similarities due to unpopular tweets, contributing to highlighting interesting behaviors. Finally, for each network we retain only the statistically significant edges by computing its multiscale backbone (Serrano, Boguná, and Vespignani 2009).
-
3.
Dynamic community detection. The multiplex temporal network is suitable for being analyzed with a dynamic community detection algorithm. Leiden is a state-of-the-art community detection algorithm for multiplex networks that improves the well-known Louvain algorithm by identifying higher quality and well-connected communities (Traag, Waltman, and Van Eck 2019). It allows community detection on multiplex networks by jointly considering the internal edges in each layer (solid edges in Figure 1), as well as the edges that connect nodes across layers (dashed edges in Figure 1). Leiden is therefore a cross-time algorithm that identifies communities based on the full temporal evolution of the network (Rossetti and Cazabet 2018). An important implication is the possibility to assign nodes to different communities depending on the time window. As such, it is particularly suitable for studying the temporal evolution of user behaviors and of the CCs.
Results
The application of our method to the 2019 UK general elections dataset produced a multiplex temporal network comprising 277K nodes and 4.1M edges. On average, a layer contains 11K nodes () and 164K edges (K). In total, different CCs were part of for at least one time window. However, only a limited number of such CCs persisted for all of the time. These also include the vast majority of all users in the network. For this reason, in the following we present detailed results for the top-10 largest CCs, which account for of all users in .
Dynamic vs. static communities
We begin by presenting the results of our dynamic analysis of coordinated behaviors and we subsequently compare them with the static analyses from the existing literature.
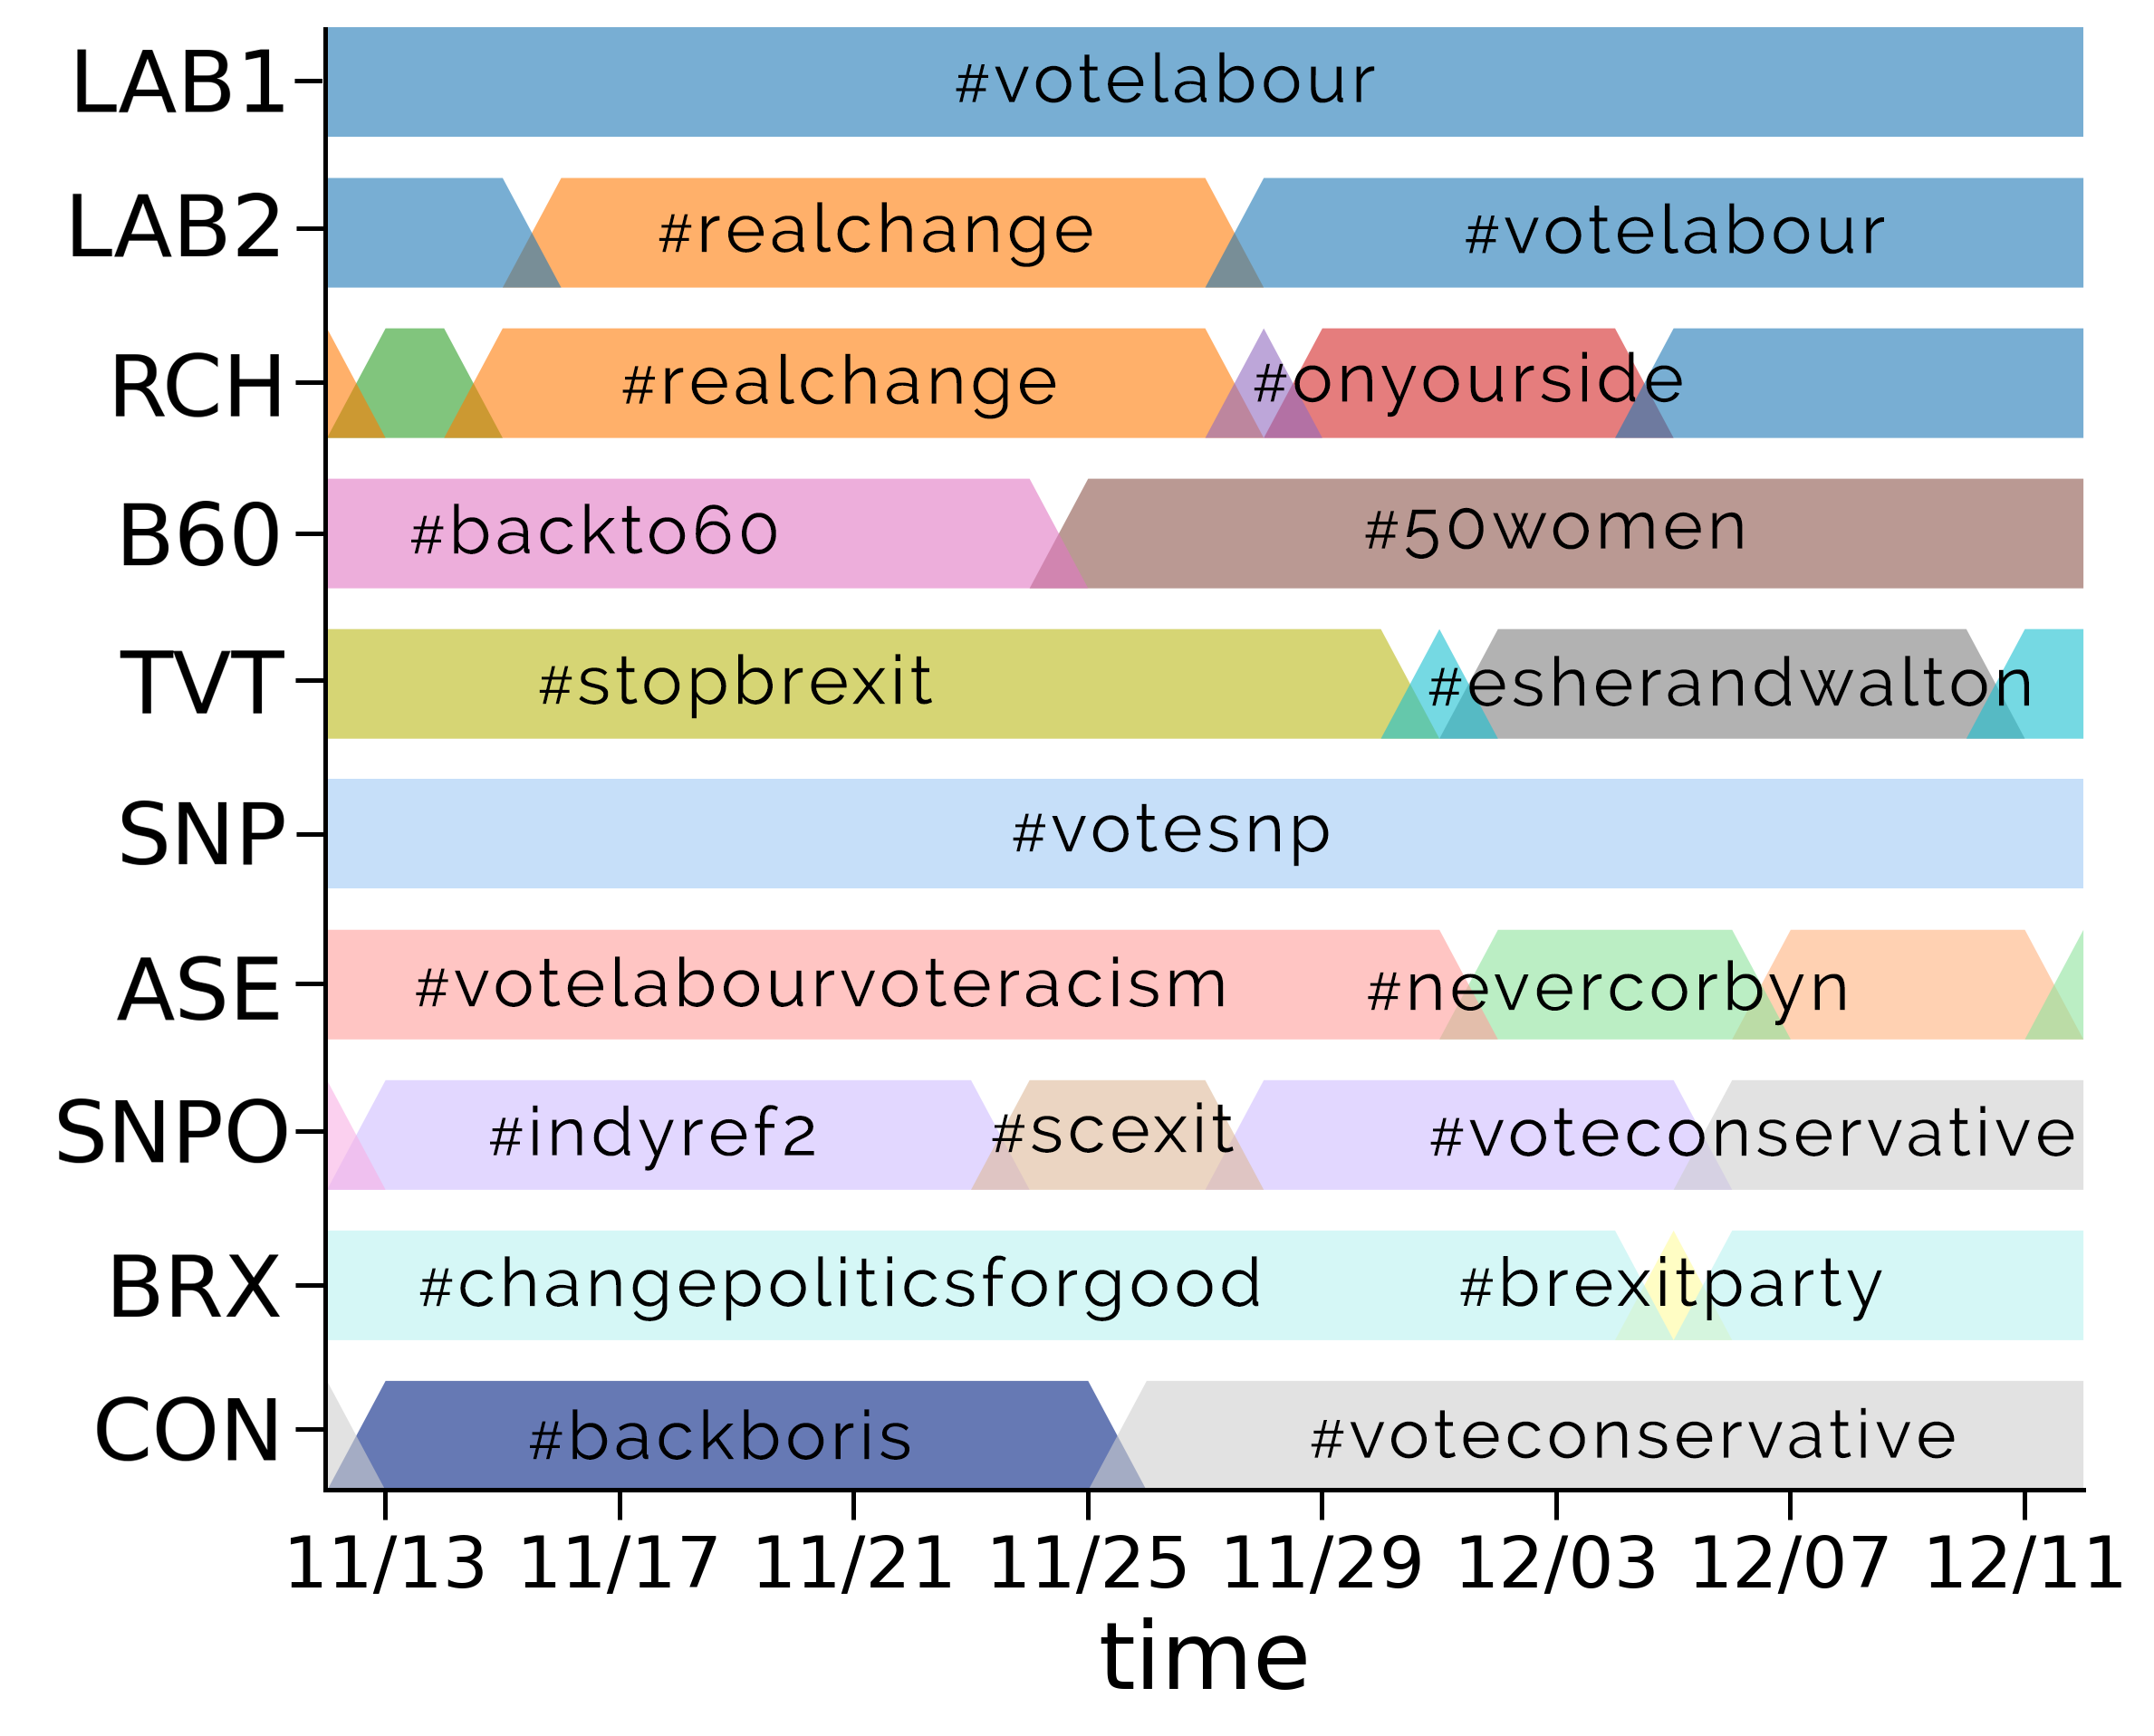
Characterization of dynamic CCs. We characterize the top-10 dynamic communities by analyzing the temporal trends of the hashtags used by their members, which allows identifying the key issues and the predominant themes of each CC. Figure 2 shows an excerpt of this analysis by highlighting the most frequent hashtag used by each CC at each point in time. The dynamic communities that dominated the 2019 UK electoral debate are as follows:
-
•
LAB1: Labourists that supported the party and its leader Jeremy Corbyn, in addition to traditional Labour themes such as healthcare and climate change.
-
•
LAB2: Another community of labourists. Their themes were similar to those of LAB1, but their members exhibited different temporal behaviors, as shown in Figure 2.
-
•
RCH: Users who spread the labourist manifesto and urged others to register for the vote. As also visible in Figure 2, RCH is mostly similar to LAB2 but, again, featured different temporal behaviors.
-
•
B60: Activists that used the electoral debate to protest against a pension age equalisation law to the detriment of women born in the 1950s.333http://pensionsage.com/pa/Backto60-granted-leave-to-appeal.php
-
•
TVT: A community comprising multiple political parties that pushed for a tactical vote in favor of the labourists, to oppose the conservative party and to stop the Brexit.
-
•
SNP: Supporters of the Scottish National Party (SNP), in favor of the Scottish independence from the UK.
-
•
ASE: Conservative supporters that were mainly engaged in attacking the labour party and Jeremy Corbyn for antisemitism.444http://www.thetimes.co.uk/article/revealed-the-depth-of-labour-anti-semitism-bb57h9pdz
-
•
SNPO: Users that debated and opposed Scotland’s intention of pushing for a second independence referendum.
-
•
BRX: A community in support of the former Brexit Party.
-
•
CON: Conservatives that supported the party and its leader Boris Johnson, as well as Brexit.
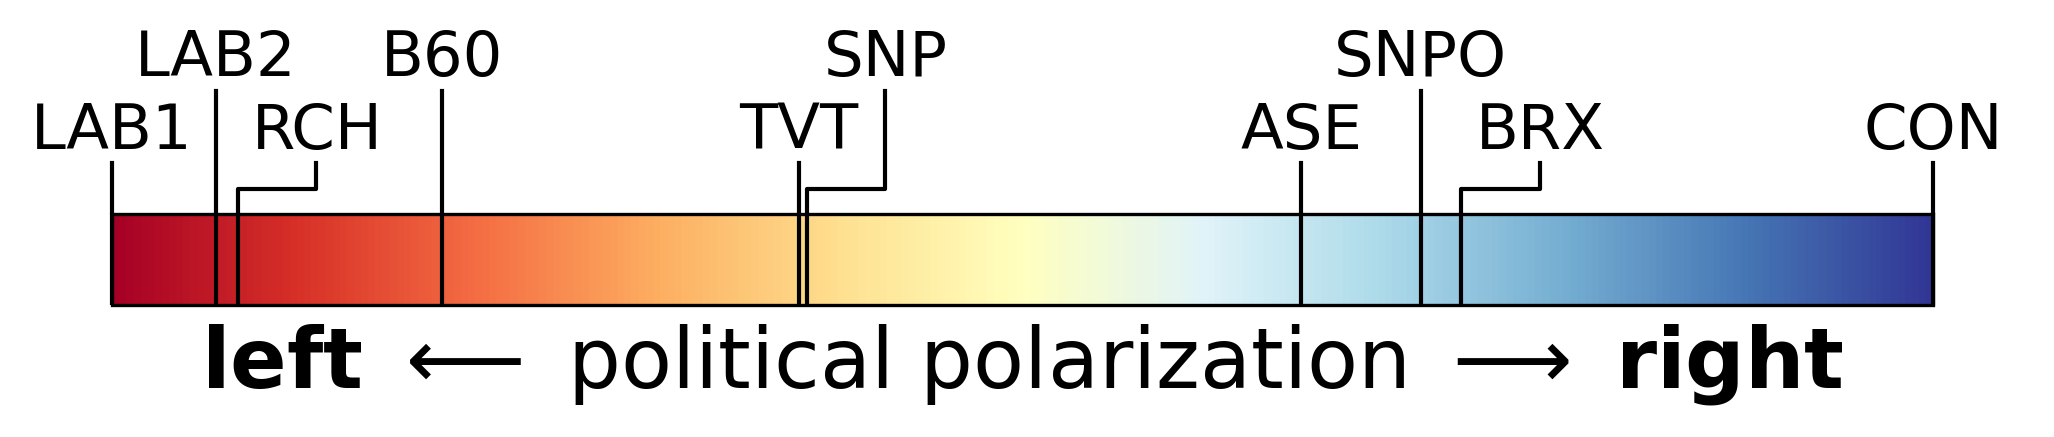
Adding to the content analysis of the themes discussed by each community, we also characterize CCs by their political orientation. To this end we compute a polarization score for each CC based on the political polarization of the hashtags used by its members. We obtain a polarization score for each hashtag in the dataset by applying a label propagation algorithm. In detail, the score for any given hashtag is iteratively inferred from its co-occurrences with other hashtags of known polarity. We initialize the algorithm with the hashtags in Table 1 as the seeds of known polarity. Once hashtag polarities are computed, the polarity of a CC is obtained as the TF weighted average of the polarities of the hashtags used by members of that community. As a result, each CC is assigned a polarity score , which we further normalize so that the rightmost-leaning CC (CON) has and the leftmost-leaning one (LAB1) has . Figure 3 shows the position of each CC within the continuous political spectrum.
Overall, the dynamic CCs identified with our method are in line with the 2019 UK political landscape and with the development of the electoral debate (Jackson et al. 2019). CCs represent both large and strongly polarized parties (e.g., labourists and conservatives), as well as smaller ones that teamed up against conservatives with tactical voting. As shown in Figure 3, each CC also appears to be correctly positioned within the 2019 UK political spectrum, with LAB1, LAB2, and CON holding the extremes of the spectrum, and parties such as liberal democrats and Scottish nationalists (TVT and SNP, respectively) laying towards the middle.
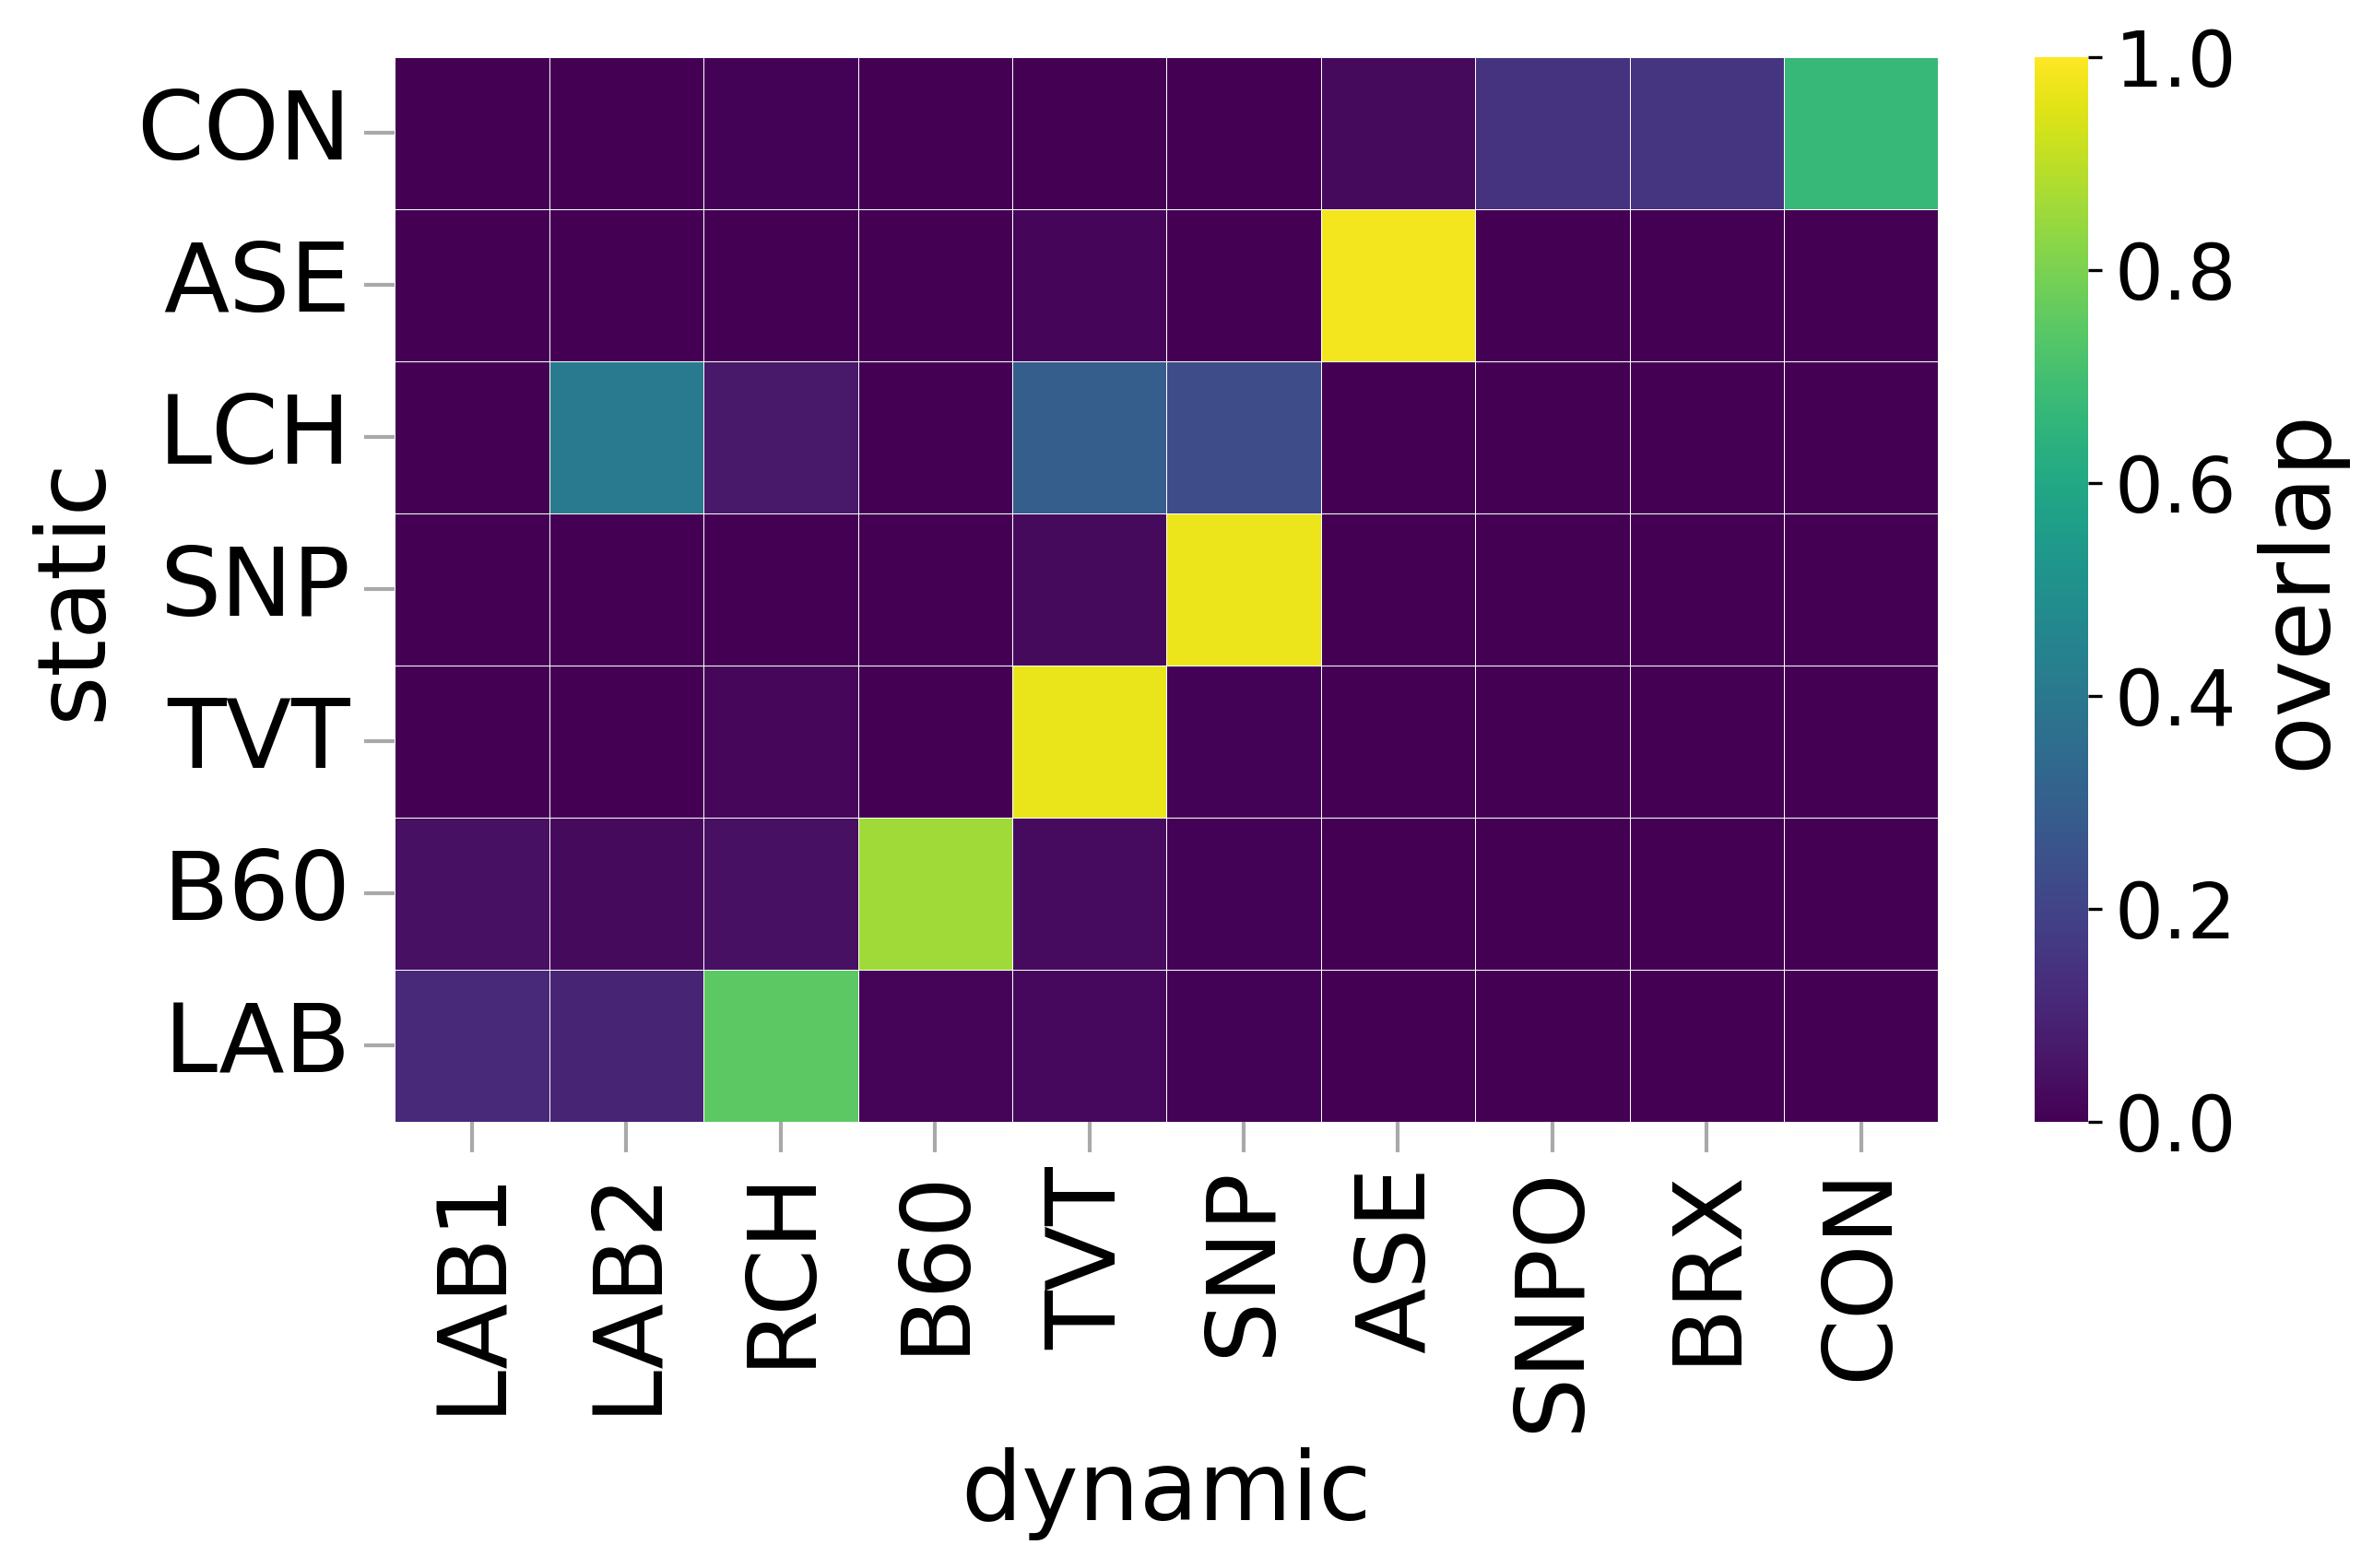
Comparison with static CCs. Here we compare the results of our dynamic analysis with those obtained with static analyses on the same dataset. Nizzoli et al. (2021) found 7 static CCs in this dataset. Figure 4 presents a heatmap of the overlap between the static CCs (y axis) discussed by Nizzoli et al. (2021) and Hristakieva et al. (2022), and the dynamic ones (x axis) found with our method. In figure the overlap expresses the fraction of users from a static CC that are members of a dynamic one. As shown, there is overall a very good match between static and dynamic CCs. On one hand indeed, 5 out of 7 static CCs have overlap with a dynamic CC. This finding supports the accuracy and representativeness of our dynamic analysis. On the other hand however, the CON, LCH (a small community of activists protesting against an unfair taxation), and LAB static CCs were split into multiple dynamic communities. However, the results in Figure 2 show that each dynamic CC had distinctive temporal behaviors. As an example, users of the LAB static CC belong to the LAB1, LAB2, and RCH dynamic CCs, which all exhibit overall similar but temporally different behaviors. To this regard, the larger number of CCs found with the dynamic analysis are due to the better modeling of the temporal dimension, which in turn allows identifying behavioral differences that weren’t observable with static analyses.
RQ1: Temporal stability of coordinated communities
So far we highlighted that our dynamic analysis provided overall similar – yet more nuanced and fine-grained – results with respect to previous static analyses. Now we leverage our innovative dynamic model of coordinated behavior to evaluate the temporal stability of the CCs involved in the online electoral debate, by investigating the extent to which they underwent changes through time. This analysis is relevant for multiple reasons: (i) it sheds light, for the first time, on how CCs evolve in time, and (ii) it allows assessing how representative are static analyses of coordinated behavior, with respect to the temporal variations of the CCs.
Temporal evolution of CCs. To assess how CCs changed through time we measured, for each community , and for each with :
-
•
the size of relative to : ;
-
•
the Jaccard similarity of the membership of relative to : , where is the set of users that belong to at time ;
-
•
the influx and outflux of , respectively expressed as the cumulative number of users who joined and left the community up to .
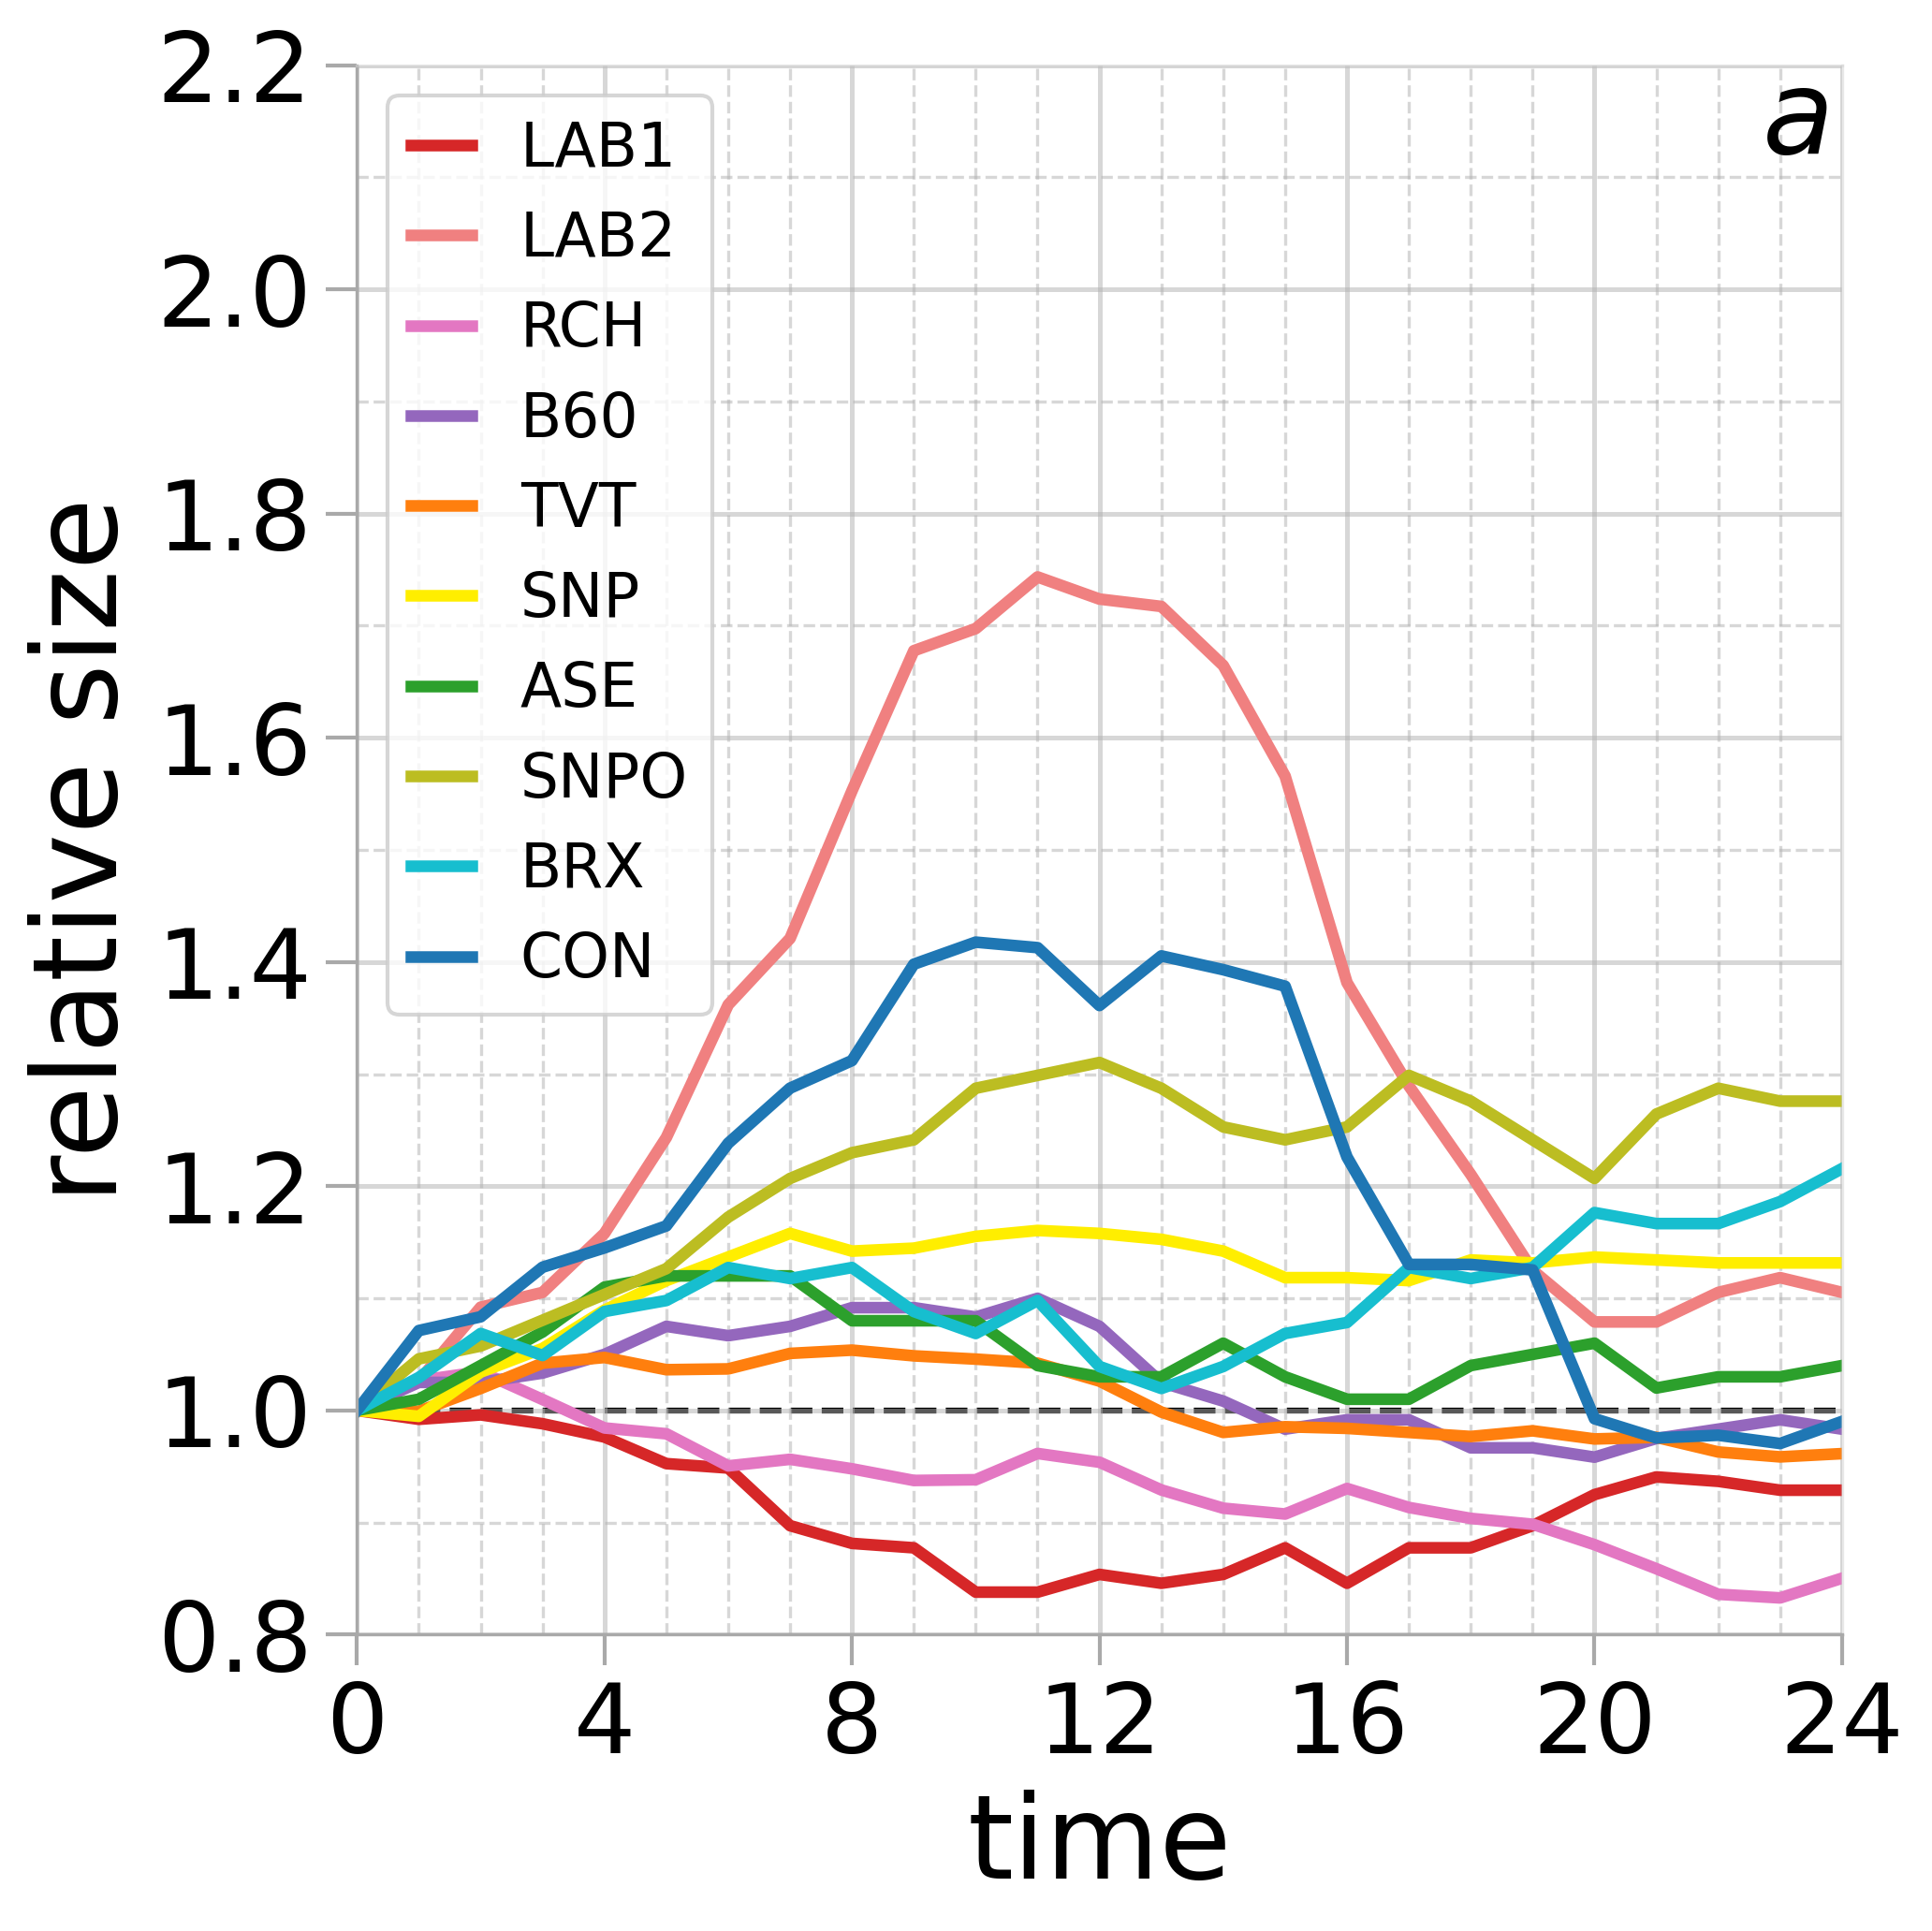
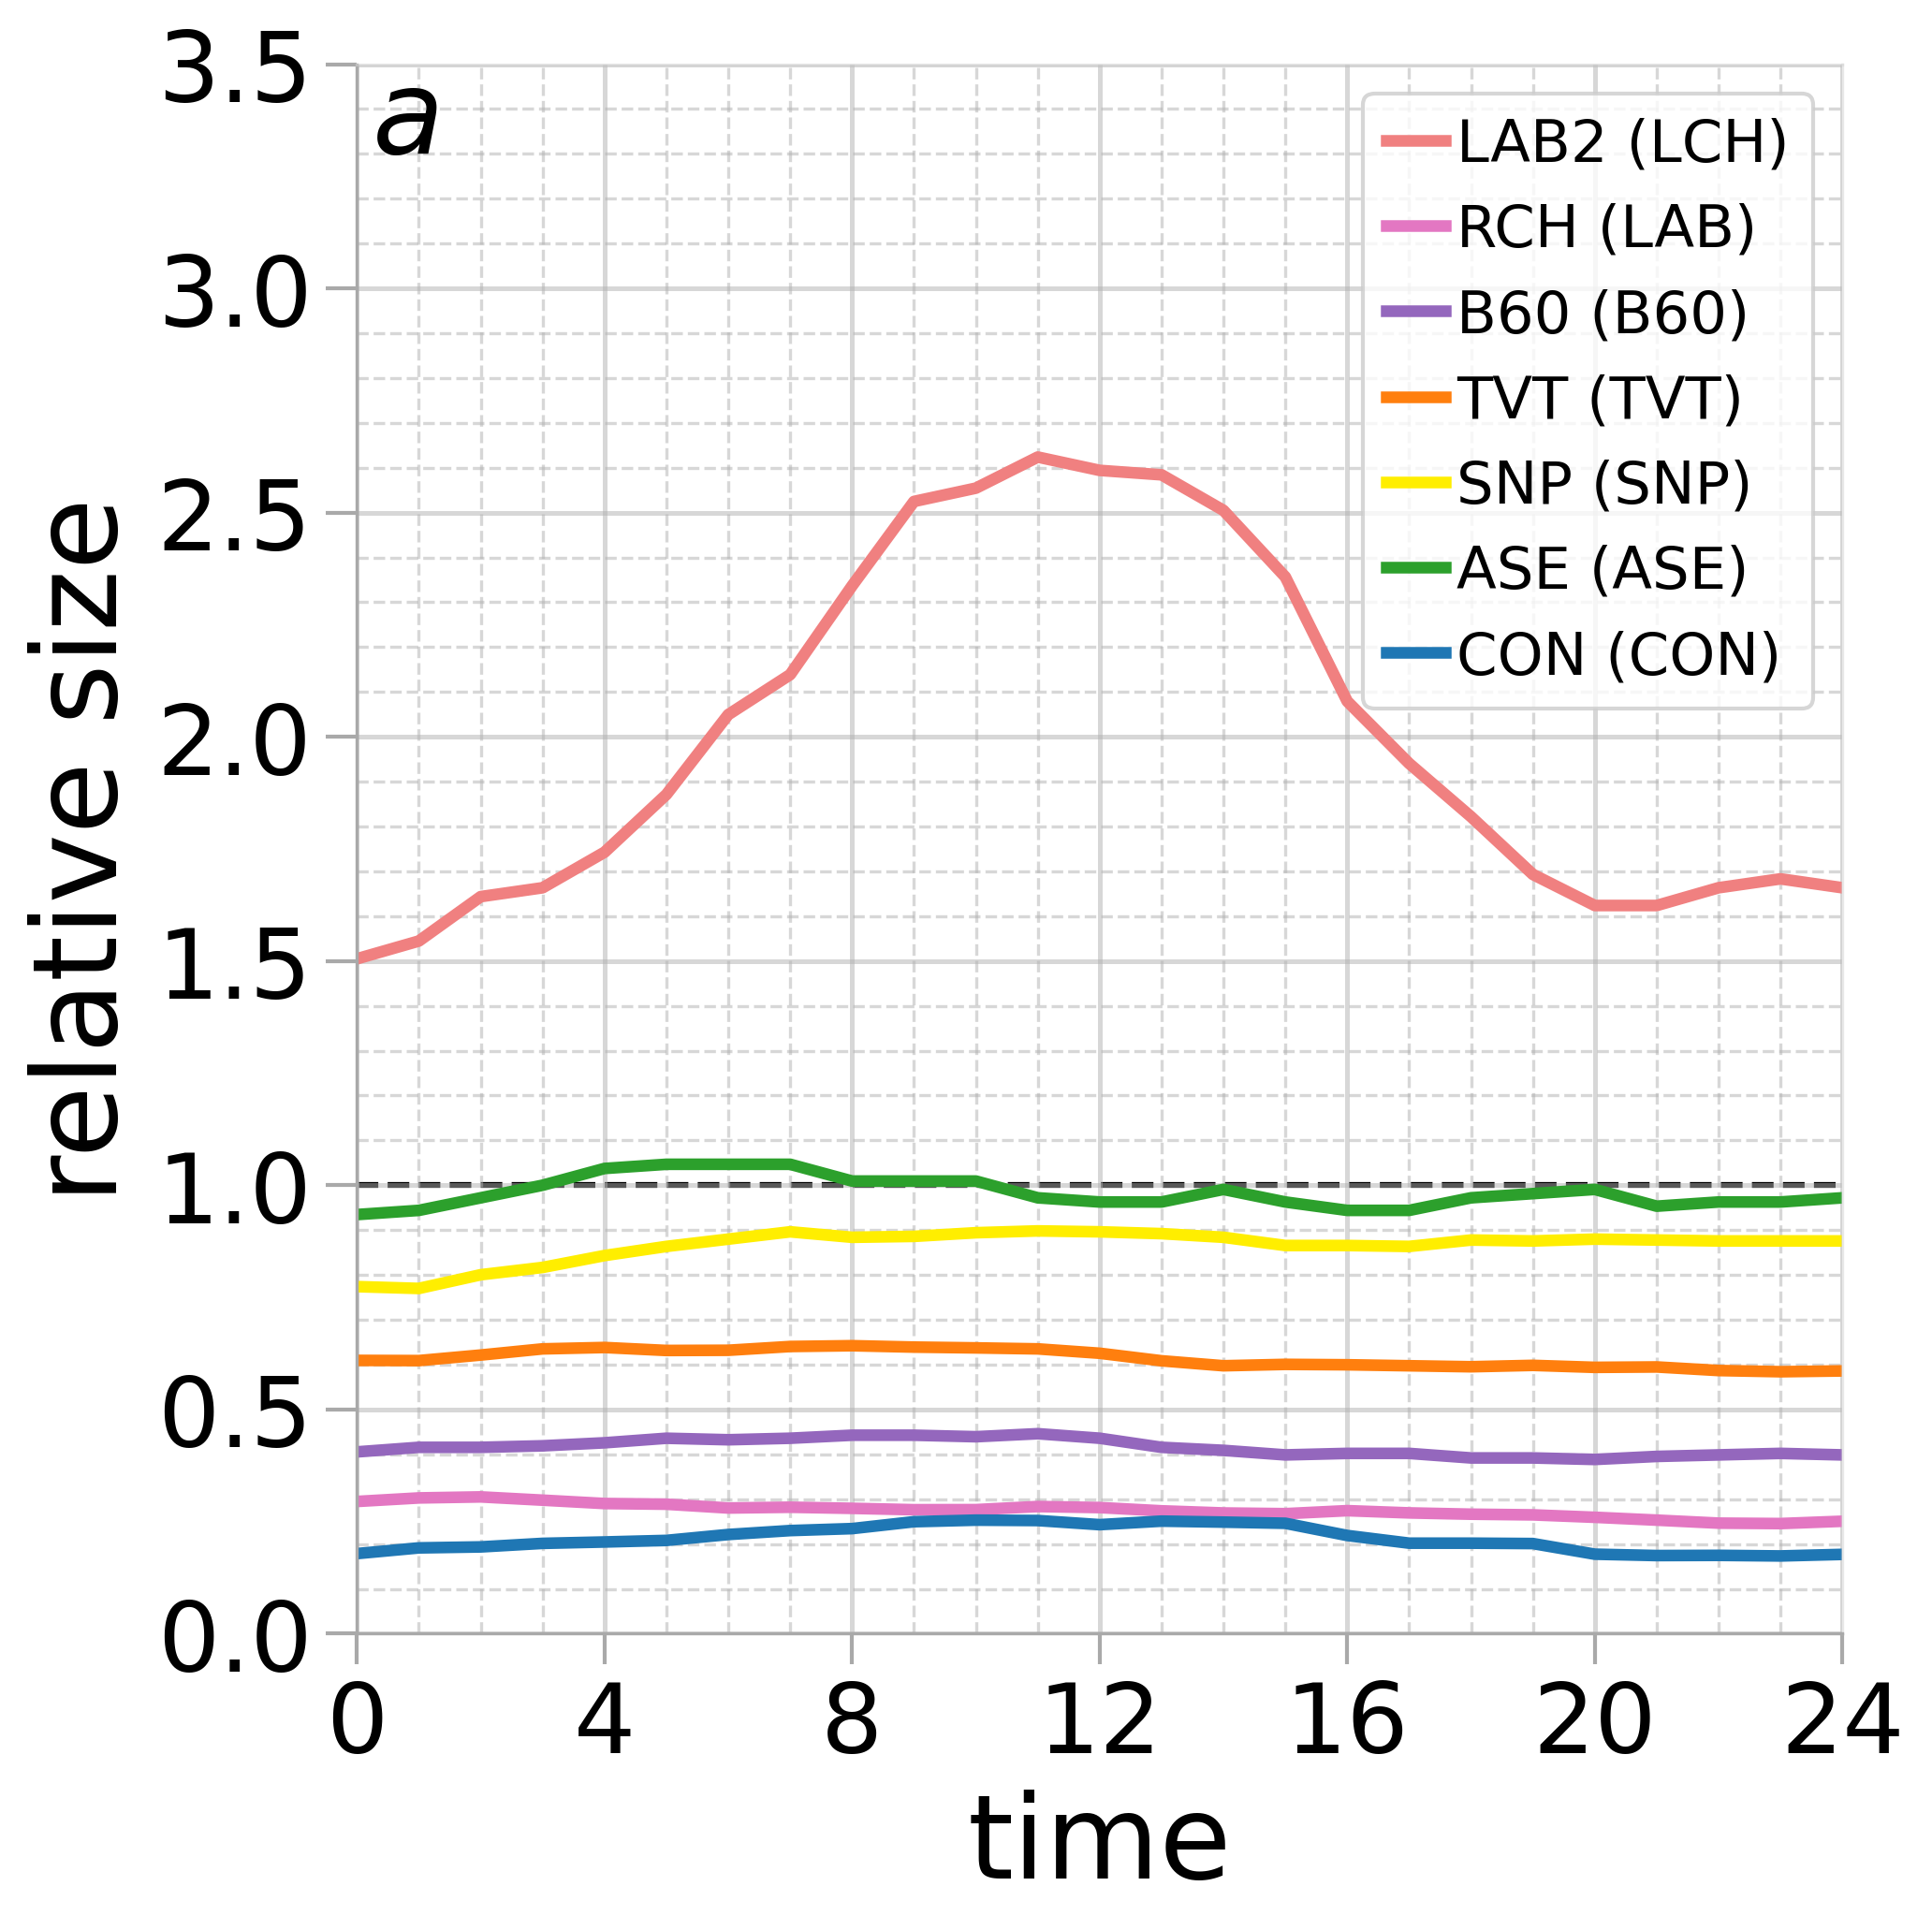
Figure 5 presents the results of these analyses. Regarding community size, Figure 5a highlights major differences in the temporal evolution of the CCs. Some communities such as SNP, TVT, and ASE appear as relatively stable in time, with only limited size fluctuations represented by mostly flat lines. Contrarily, other communities such as LAB1, LAB2, and CON exhibit marked variations. In particular, LAB2 almost doubled its initial size between and . CON exhibits a similar trend, albeit with reduced magnitude. This result demonstrates that some CCs were rather unstable, as they experienced major temporal variations in size. Moreover, our results also demonstrate that some CCs evolved in time in opposite ways. For example, while LAB2 and CON increased their size until around , LAB1 presents an opposite trend. Similar considerations can be made for SNPO, which increased its size until election day, with respect to RCH that progressively shrank.
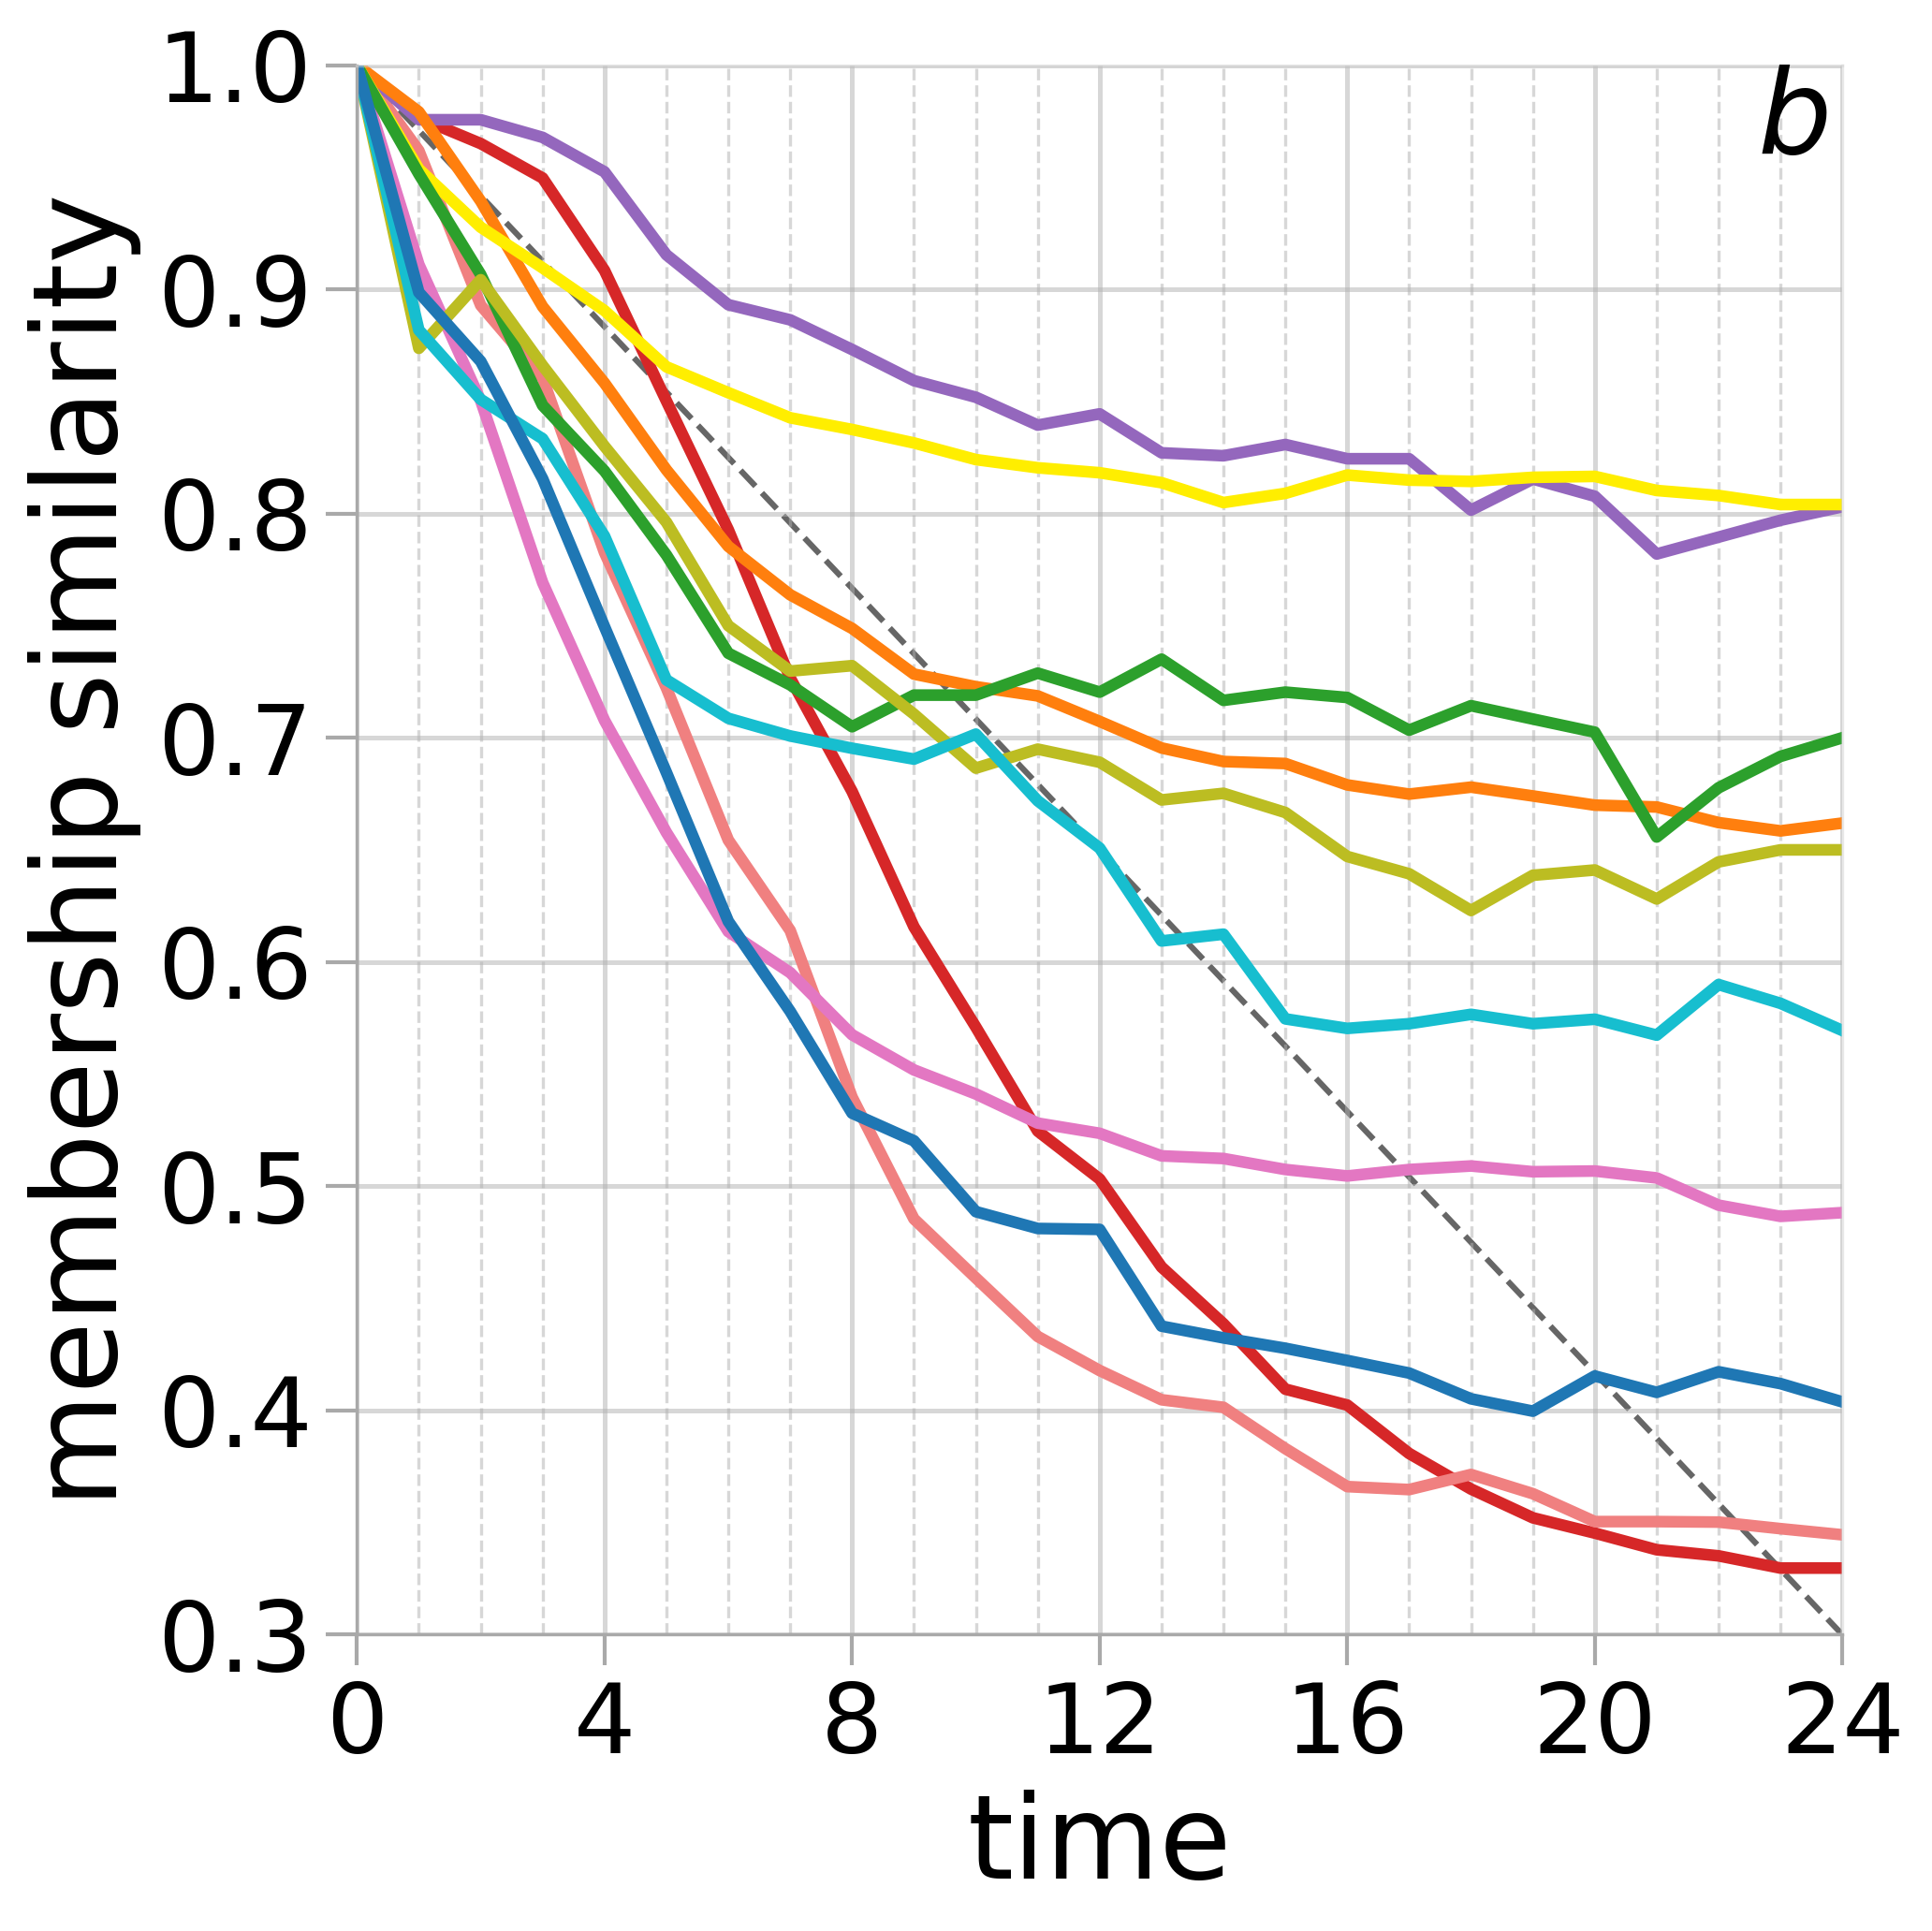
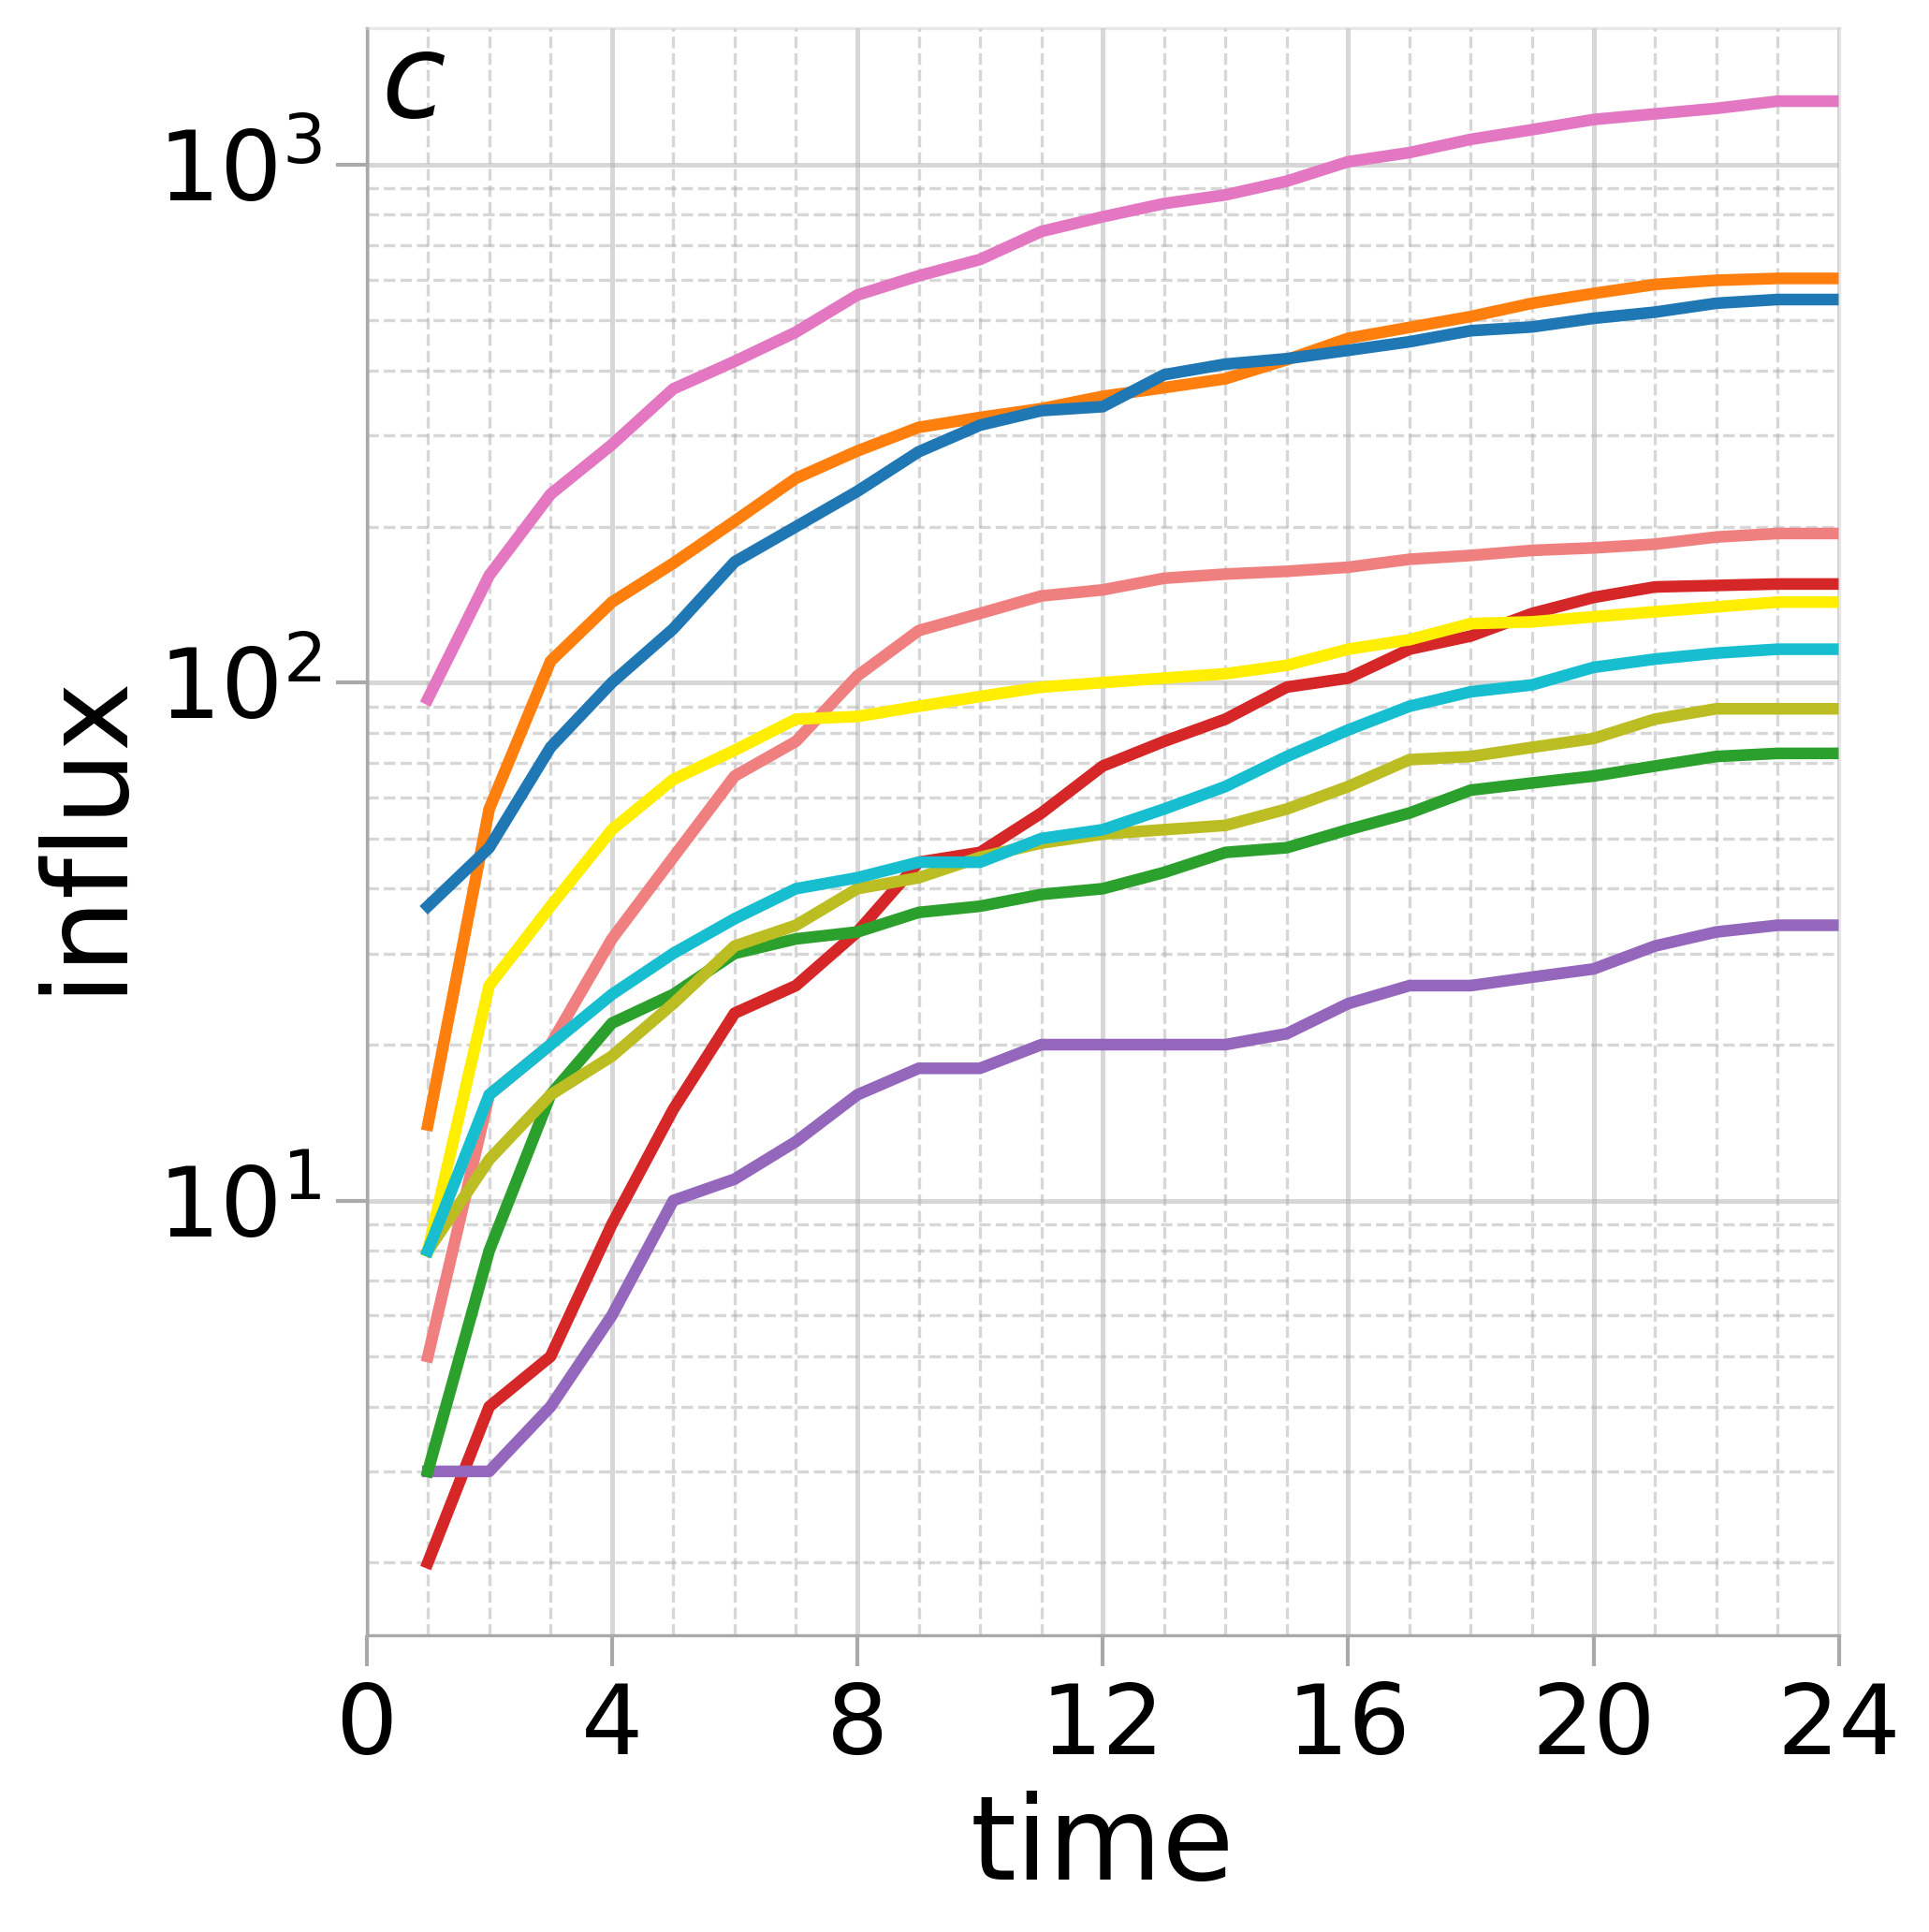
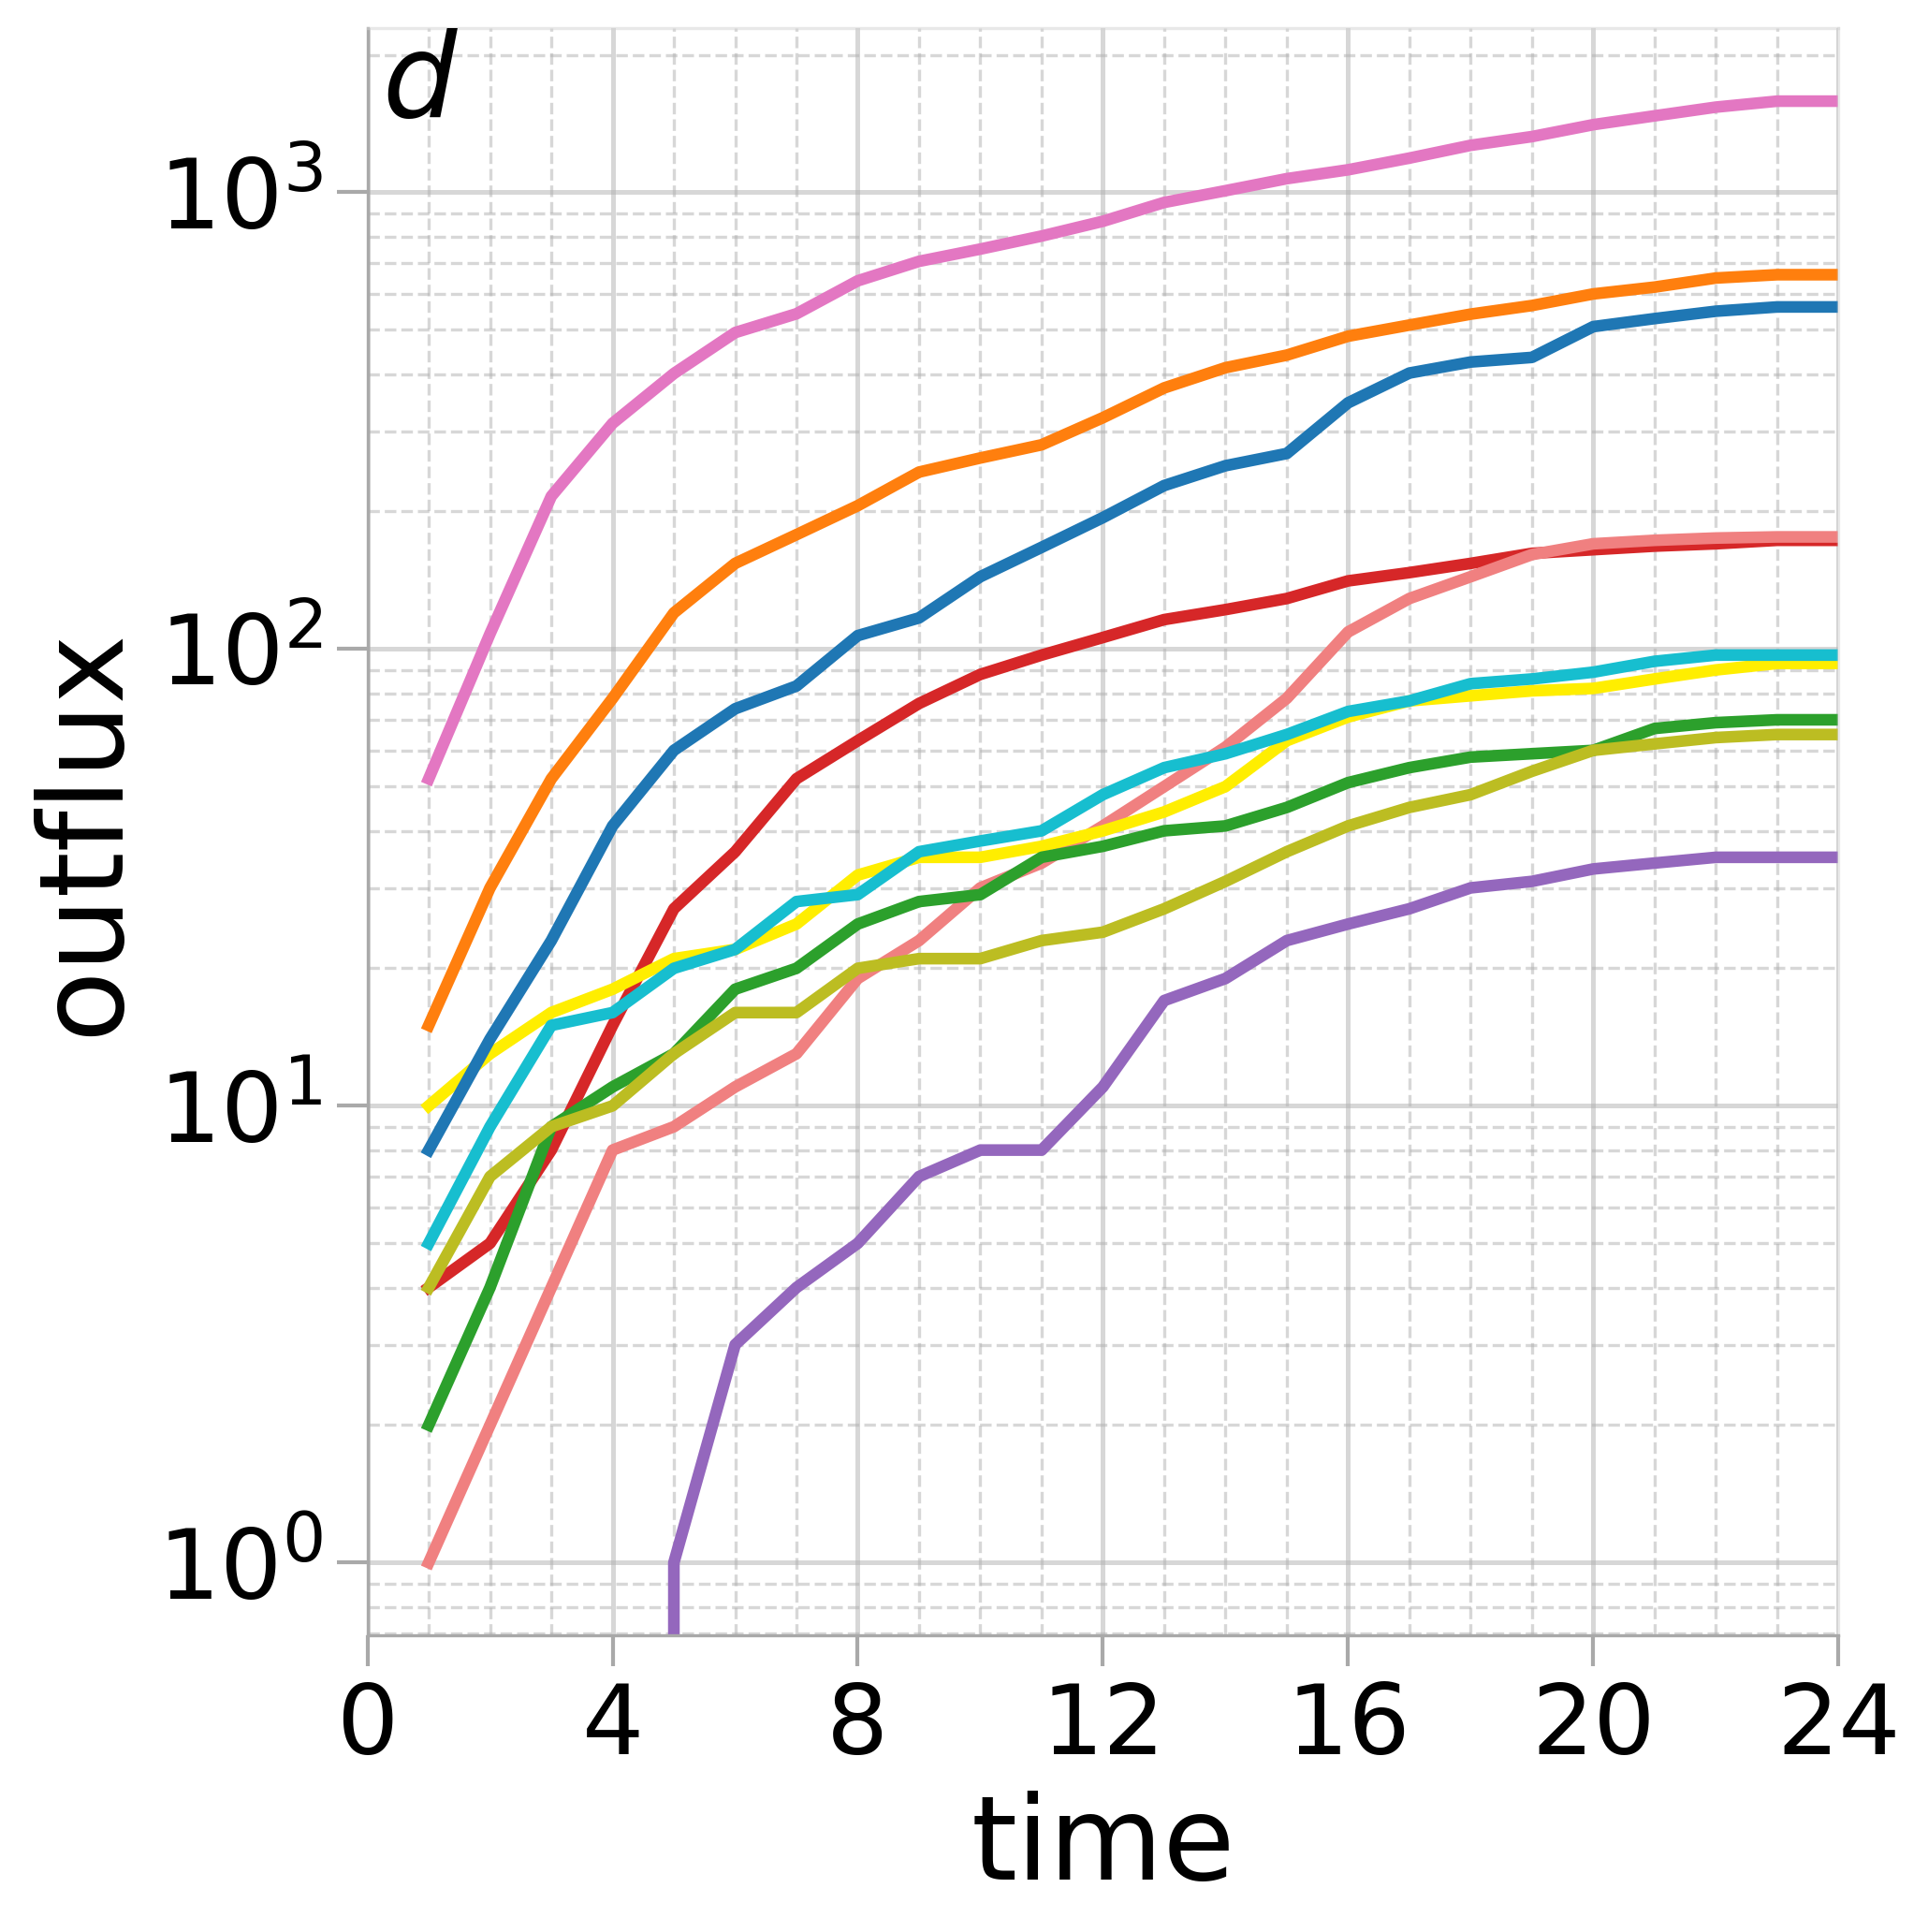
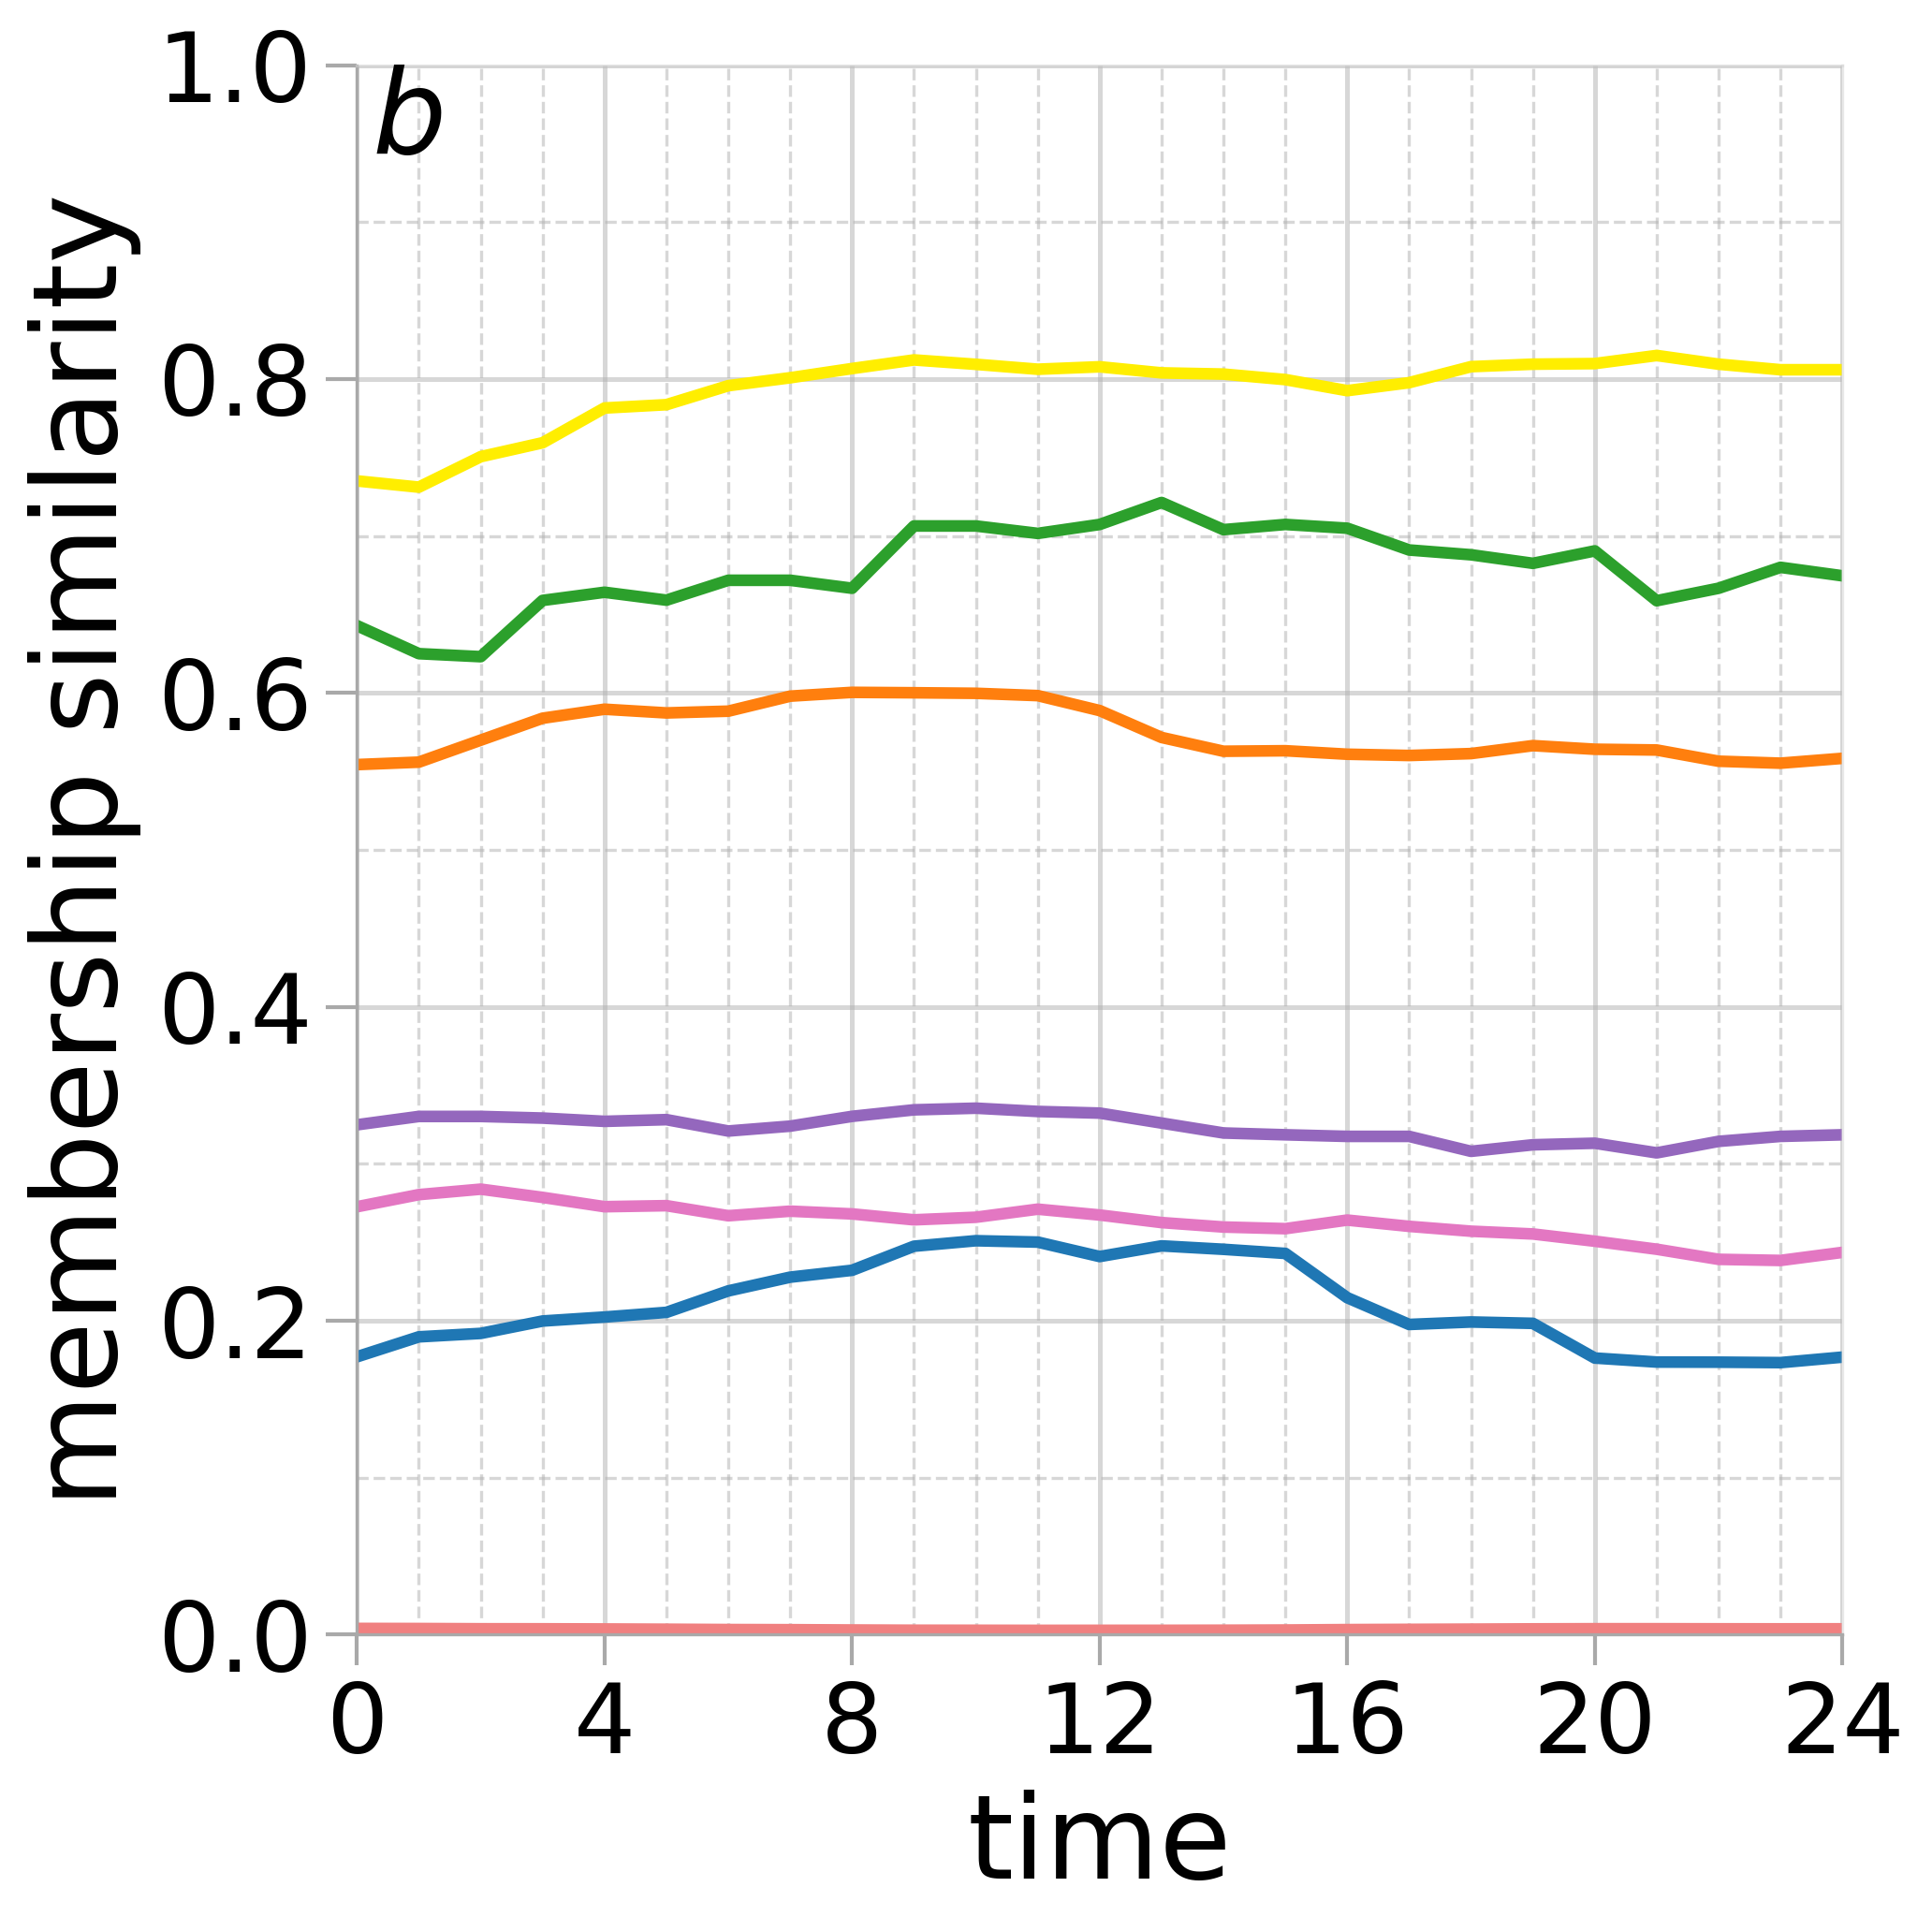
Figure 5b provides additional results by tracking how the membership – that is, the set of users that belong to a community at a given time – and not just the size, of each CC changes through time. As expected, CCs that experienced major size variations (e.g., LAB2, CON) present the largest differences in membership. Interestingly however, also CCs that exhibited moderate size variations (LAB1), or that appeared as overall stable when only considering their size (TVT and ASE), nonetheless feature marked membership differences in time. This result tells us that a stationary size does not necessarily imply stability in terms of members of the community. In fact, some CCs maintained a relatively stable number of members not because of lack of user shifts between CCs, but as a result of a balanced inflow and outflow of members. Figures 5c and 5d provide detailed results on this aspect. As shown, some CCs (B60) had a limited influx and outflux for all the time, which is reflected in Figure 5b by a relatively stable membership. On the flip side, other CCs (RCH, CON) were much more unstable, with a massive influx and outflux of users that translates into unstable membership. Interestingly, there also exist less straightforward situations, such as that of TVT that featured strong influx and outflux but a relatively stable size and membership. This result implies that many users joined and left TVT every time window, but that those who left were likely to come back at a later time and vice versa. In other words, TVT was characterized by a restricted set of users who repeatedly joined and left the community. Overall, our results provide evidence of temporal instability and highlight marked differences in the temporal dynamics of some CCs.
Representativeness of static CCs. We conclude our analysis of RQ1 by discussing the implications of our findings about the instability of the CCs, with respect to the static analyses of coordinated behavior. In particular, results in Figure 5 highlighted that some CCs underwent marked changes in time that cannot be captured with time-aggregated static analyses. Figure 6 digs deeper into this aspect by comparing the time-evolving size and membership of each dynamic CC to those of its corresponding static CC. In particular, to be strongly representative of a dynamic community, a static CC must have relative size and membership similarity both close to 1. The mapping between static and dynamic CCs is in Figure 4. The results in Figure 6 surface some of the drawbacks of static analyses. The only static CCs that are strongly representative of their dynamic counterparts are ASE and SNP, as reflected by relative size and membership similarity . The same can be concluded also for TVT, although to a lower extent. Instead, all other static CCs are weakly representative of the corresponding dynamic CCs. In fact, all have relative size far from 1 (e.g., for the LAB2/LCH pair, or for all other pairs), and membership similarity . Overall, we found several static CCs that are poorly representative of the temporal evolution of the corresponding communities, which could possibly lead to inaccurate or unreliable results.
RQ2: Temporal dynamics of user behavior
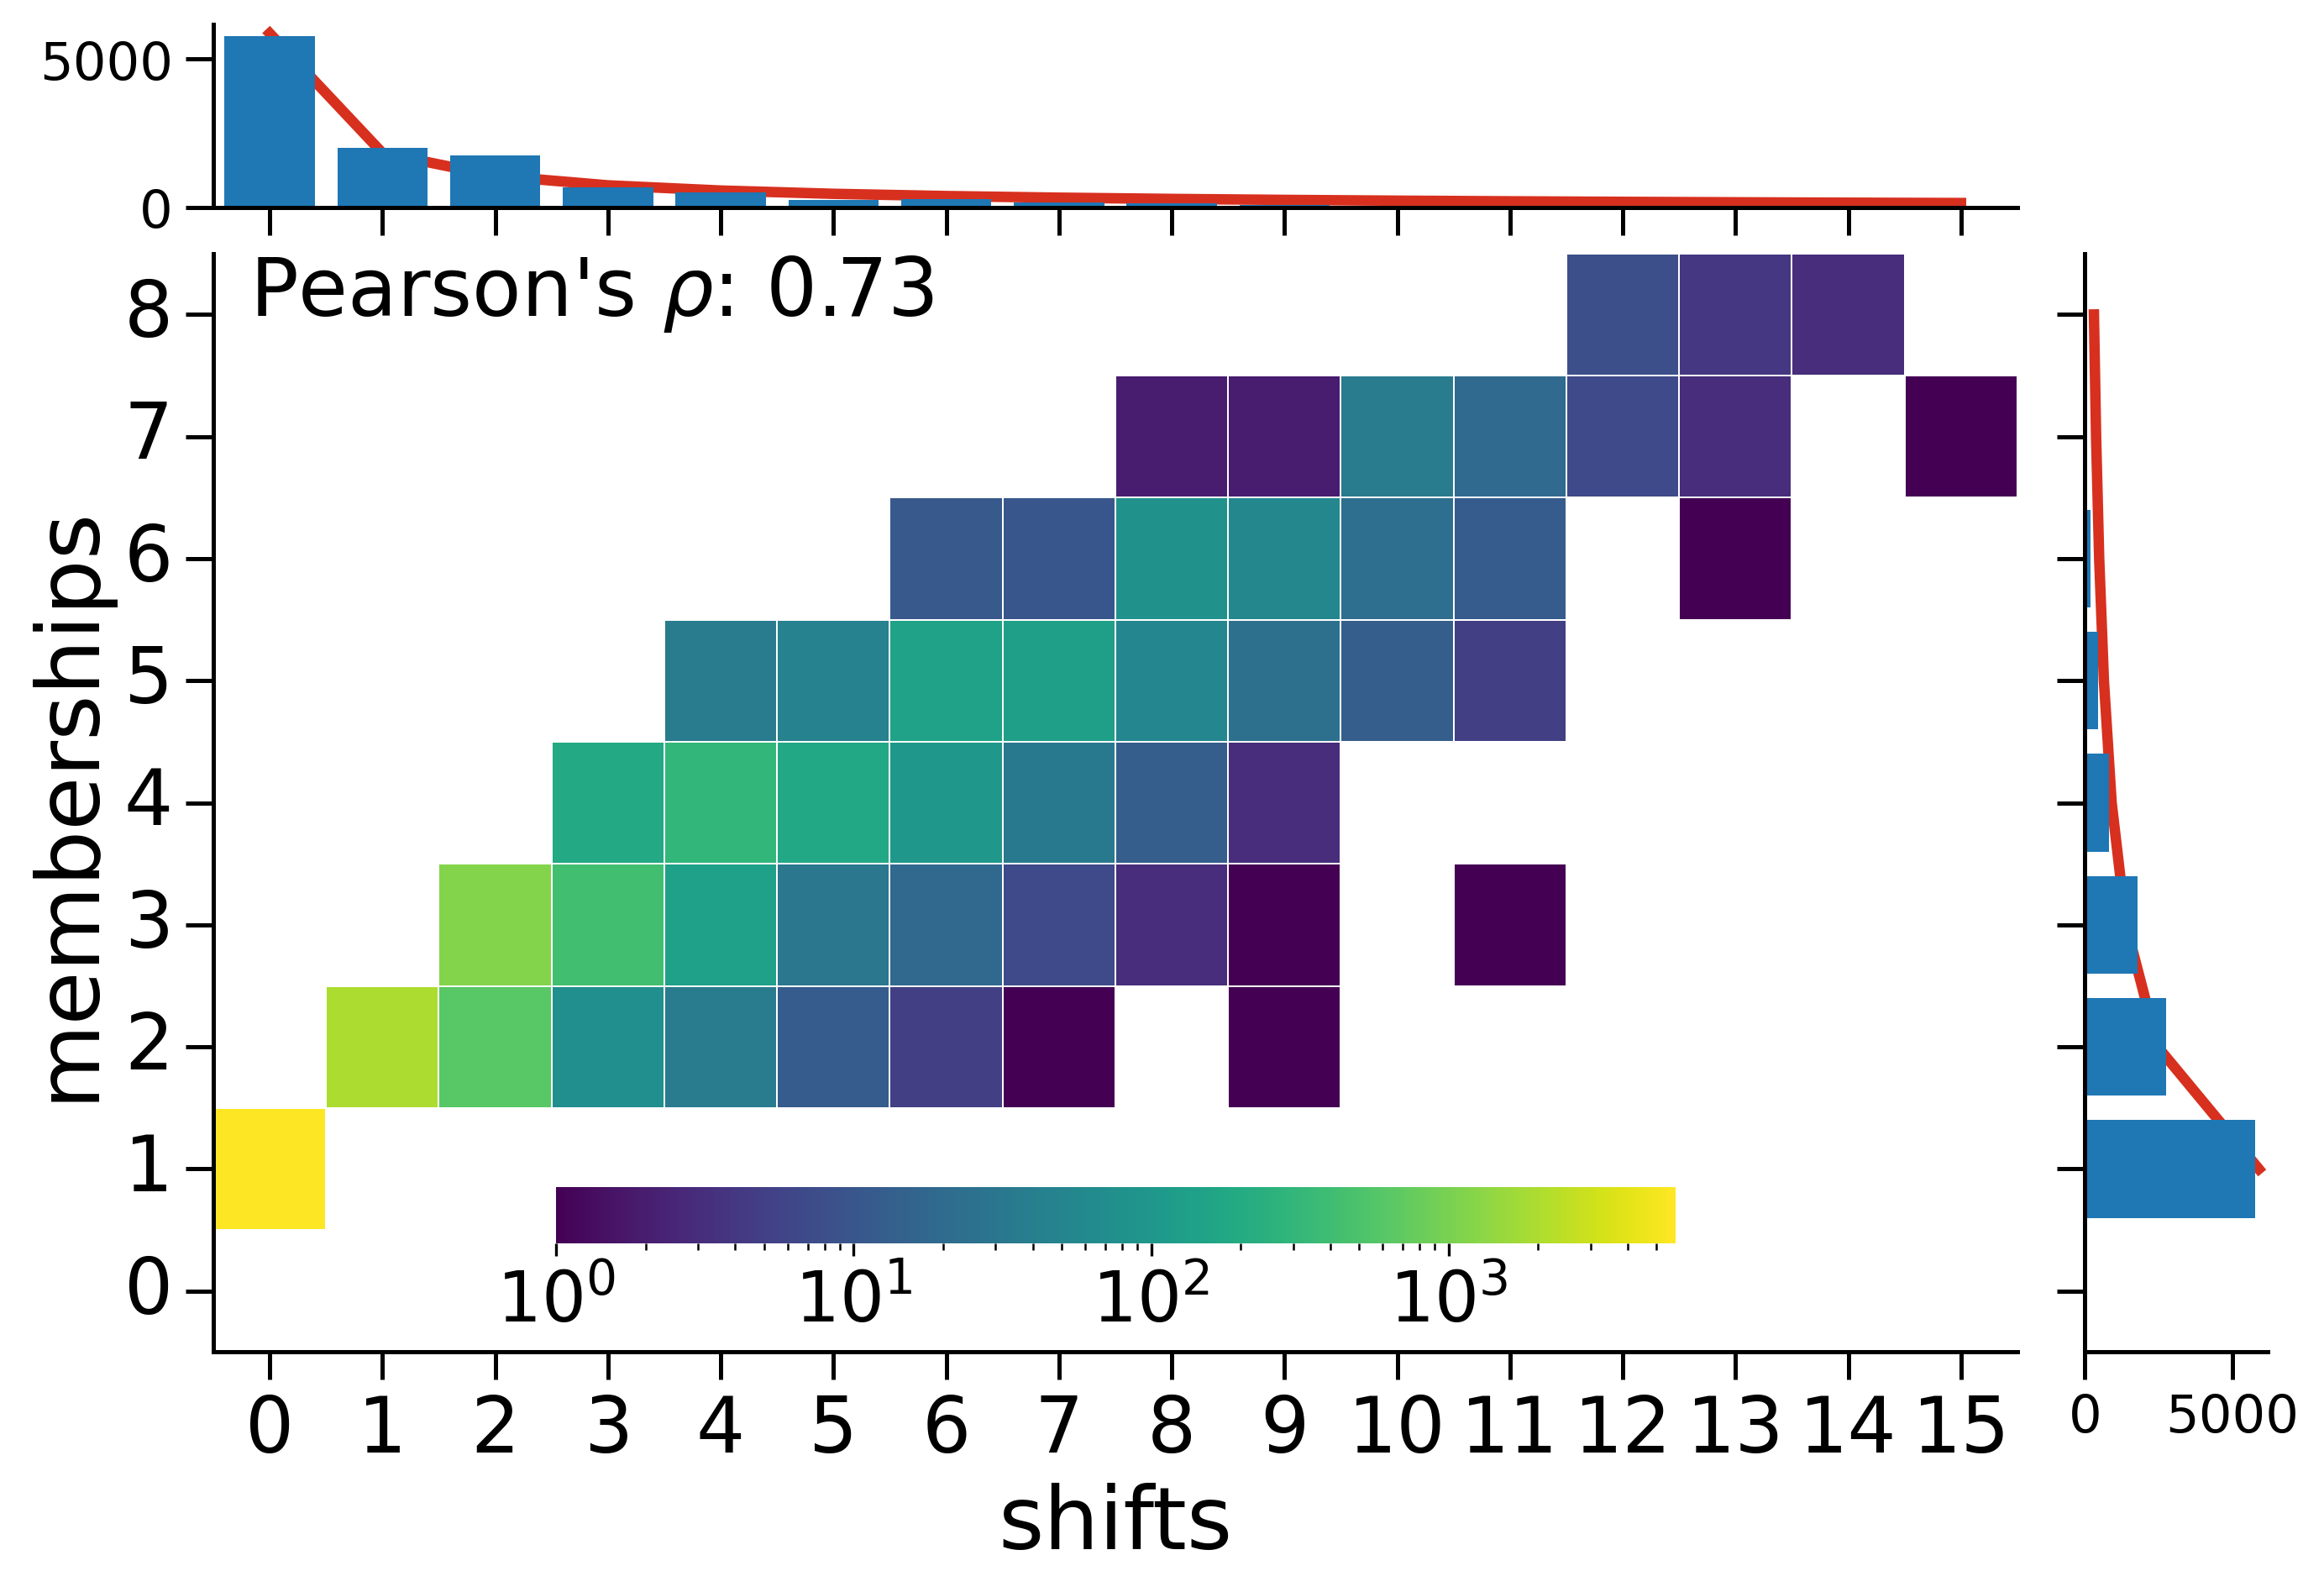
The different temporal evolution of the CCs that we observed in RQ1 are due to different user behaviors, which we investigate in this section. Figure 7 shows the joint and marginal distributions of the number of distinct CCs to which users belonged and the number of user shifts between CCs. As shown, of all users belonged to a single CC for all the time, which is also represented by both distributions being very skewed towards small numbers of distinct memberships and shifts. In fact, both marginal distributions in Figure 7 are heavy-tailed, as highlighted by the accurate power-law fitting shown with red lines in the marginal histograms. At the same time however, of users belonged to more than one CC, and a minority belonged to many, which explains our previous results on the instability of some communities. Figure 7 also allows evaluating the behavior that we observed in Figure 5 for TVT: users repeatedly leaving and re-joining the same community. Such behavior is reflected in Figure 7 with users having many shifts but few memberships. However, the figure shows few users with this behavior and, in fact, the distributions of memberships and shifts are strongly correlated (Pearson’s ) meaning that the behavior observed for members of TVT is overall marginal in the whole dataset.
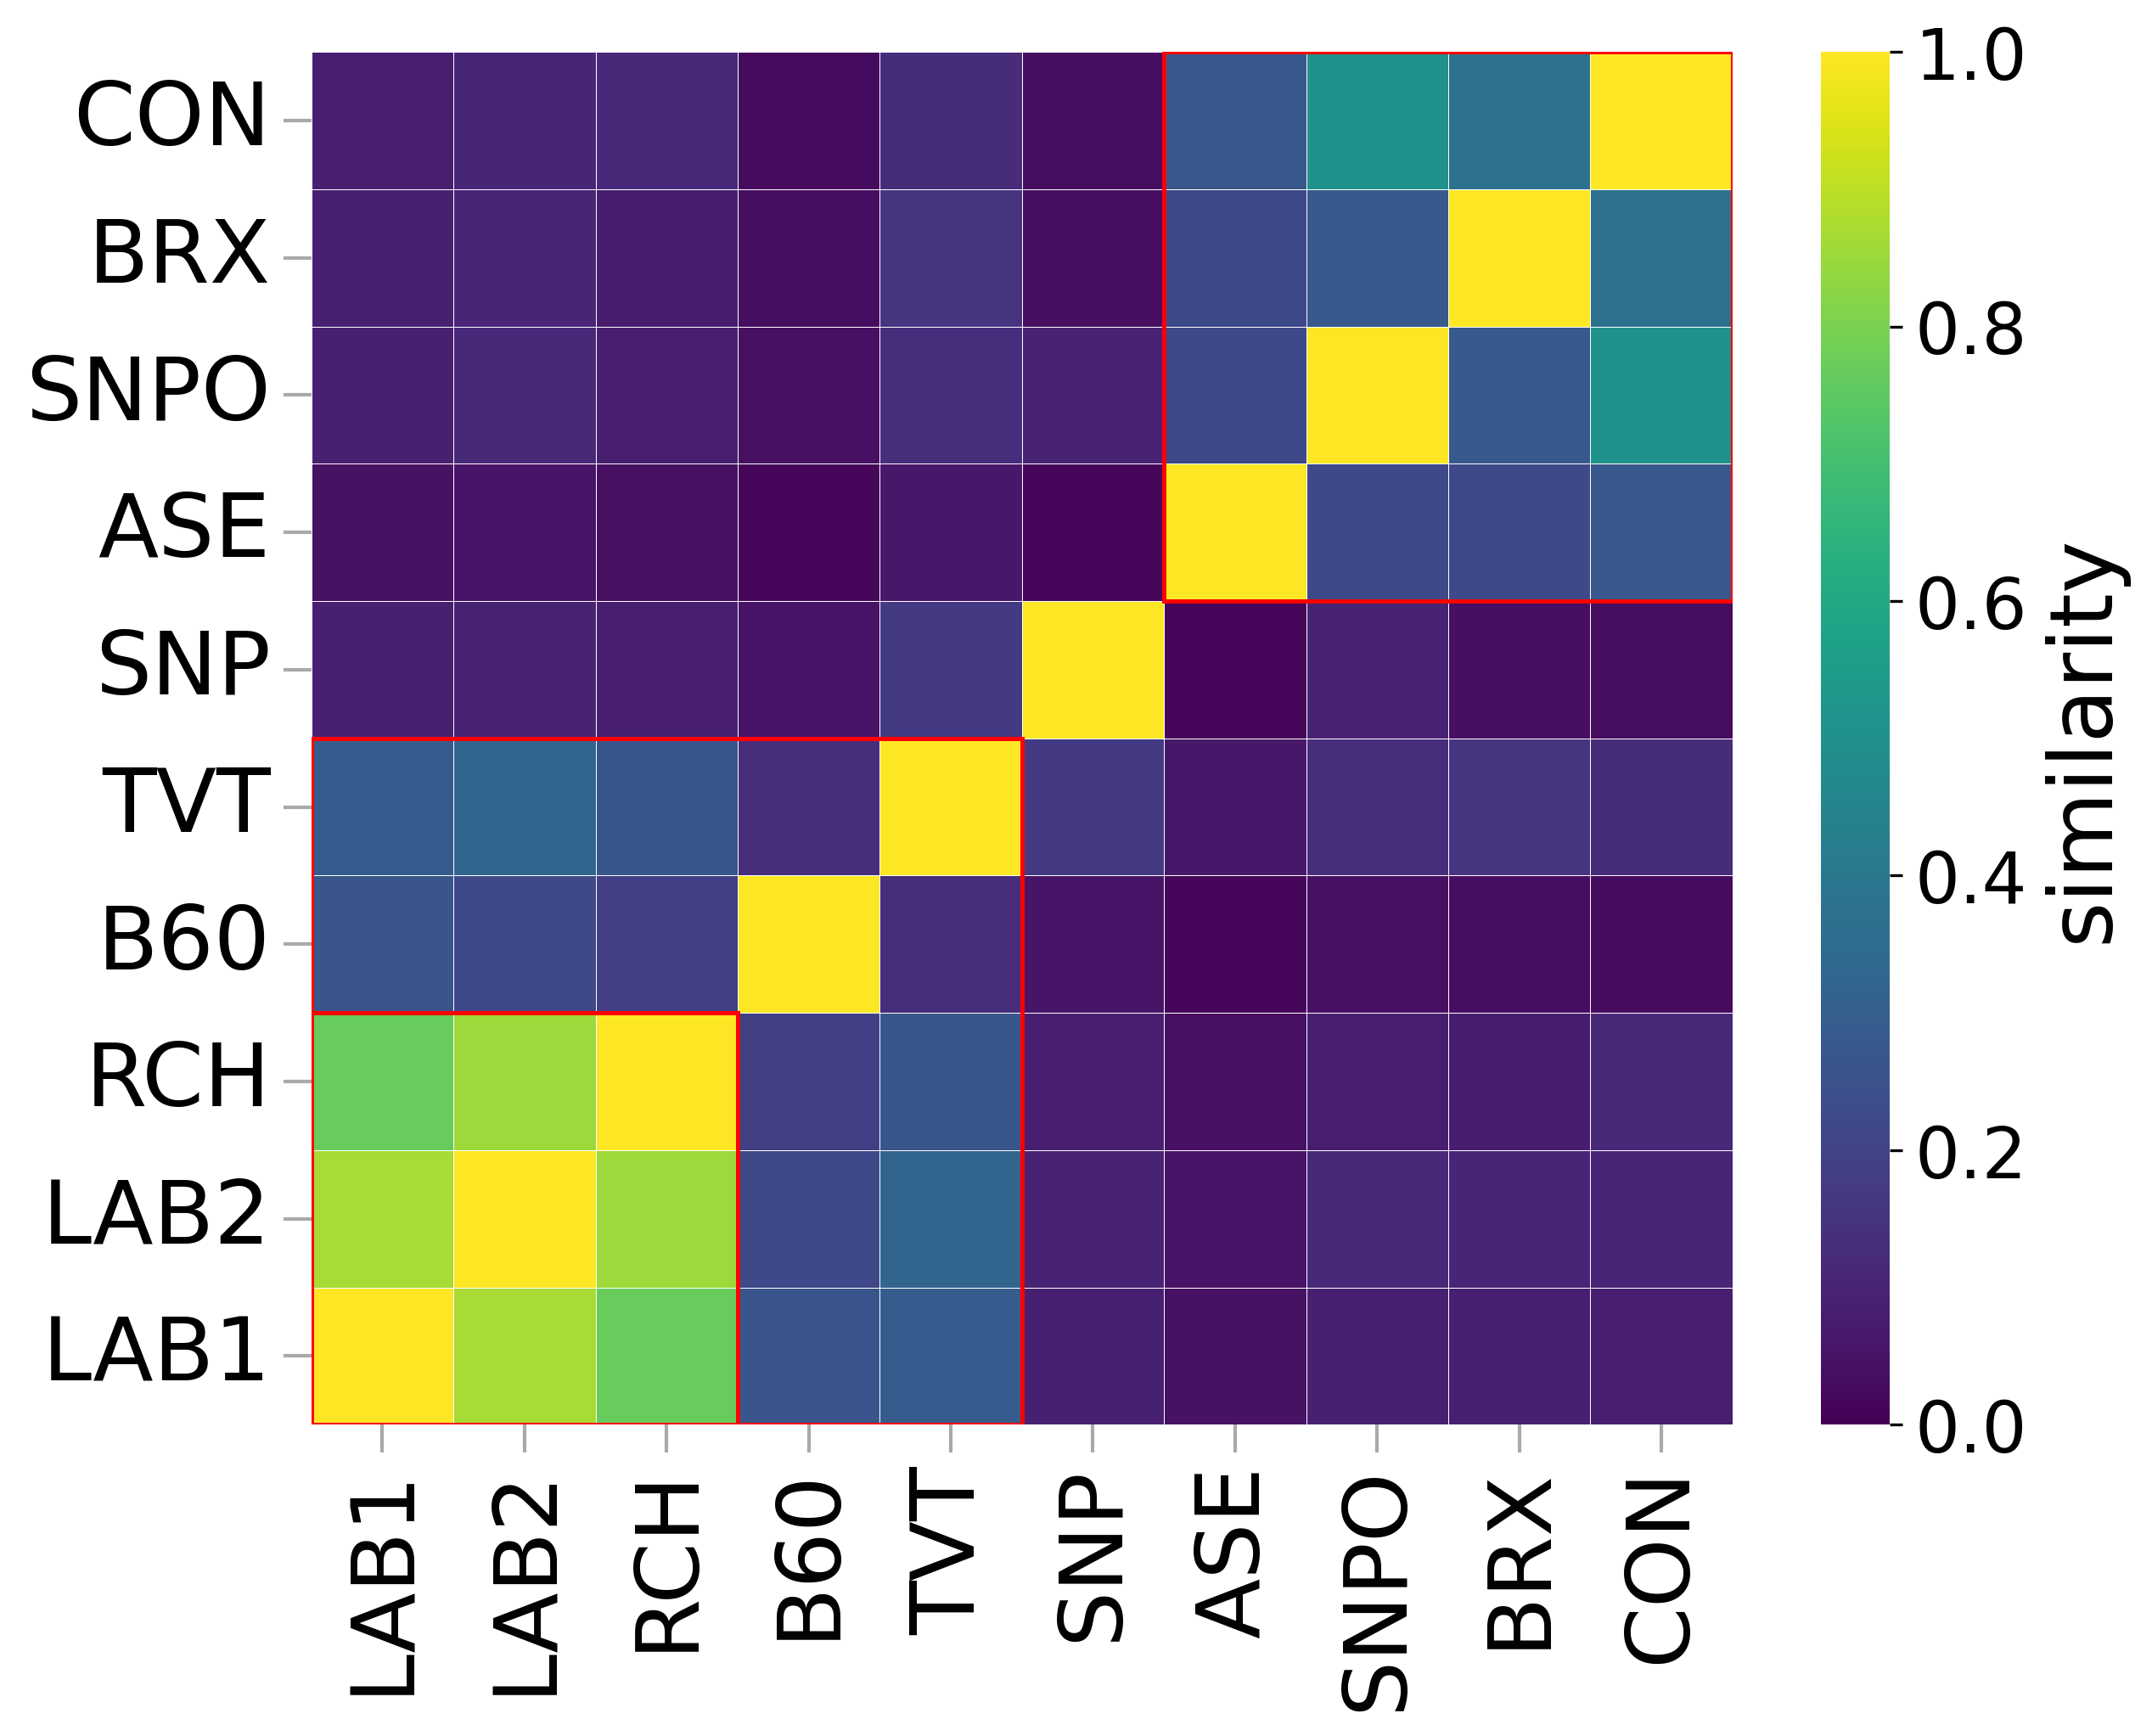
The analysis of Figure 7 only considers the number of memberships and shifts between CCs. However, not all shifts are the same, as moving between two opposite communities (e.g., at the extremes of the political spectrum) entails a much bigger change – a farther leap – than moving between two similar ones. To account for this facet we assign a weight to all shifts between any origin community and any destination community , based on the (dis)similarity between and . We compute the similarity between two CCs as the cosine similarity of the TF weighted vectors of the hashtags used by the communities. Then, we weight shifts proportionally to the dissimilarity of the involved CCs: . Finally, we analyze the patterns of user shifts between CCs. Figure 8 shows the similarity matrix obtained by computing the pairwise similarities between each CC. The figure highlights three clusters of similar communities, marked with red borders. A first cluster of highly similar communities comprises LAB1, LAB2, and RCH. A second cluster extends the previous one with B60 and TVT. Finally, CON, BRX, SNPO, and ASE form the last cluster, while SNP stands as largely dissimilar to all other communities. Overall, the clusters in Figure 8 closely resemble the UK political landscape in 2019 (Jackson et al. 2019) and the position of the CCs in the political spectrum of Figure 3.
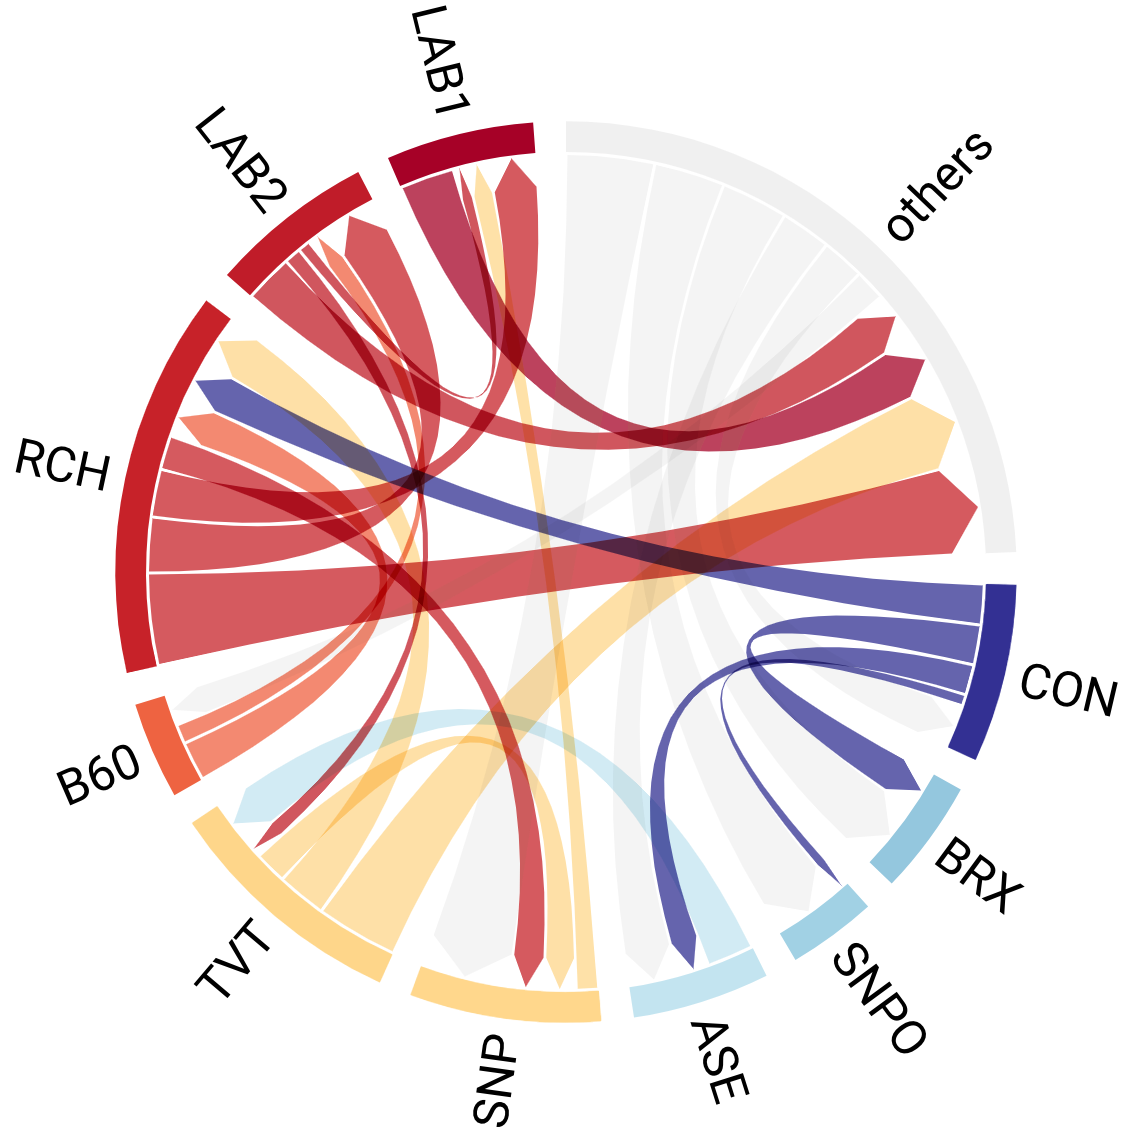
Figure 9 represents all weighted user shifts between CCs, also aggregating non top-10 communities as “others”, as a weighted directed radial node-link diagram with edge bundling (i.e., a chord diagram). In figure, only net shifts between CCs are shown. Specifically, an edge exists only if there is a positive net user flow from to : . Then, edge thickness is proportional to . Figure 9 provides interesting insights into the patterns of user shifts between CCs. In particular, it shows that the majority of shifts occurred between similar communities, such as between the communities on the same side of the political spectrum. This finding is in line with the theories about political polarization and echo chambers (Garimella et al. 2018). Nonetheless, Figure 9 also surfaces a net flow of users that moved across the political spectrum, specifically from CON to RCH, highlighting that major ideological shifts do occur, albeit infrequently with respect to all other shifts. Another interesting observation derived from Figure 9 is that the vast majority of shifts occurred towards the left of the political spectrum. This means that, overall, the users involved in the online electoral debate ideologically moved towards the left as the debate unfolded. We formalize this observation by leveraging the polarity score associated to each CC, with for left-leaning communities and for right-leaning ones, shown in Figure 3. In detail, we compute the difference in polarity entailed by each shift as: . Thus, a negative represents a change in polarization towards the left. Then, we derive the mean and total changes in political polarization resulting from all the shifts shown in Figure 9. On average, each user shift contributed to a change in polarization , which led to a total change . These results testify the strong pull exerted by the left-leaning CCs during the online debate.
RQ3: Archetypes and drivers of user behavior
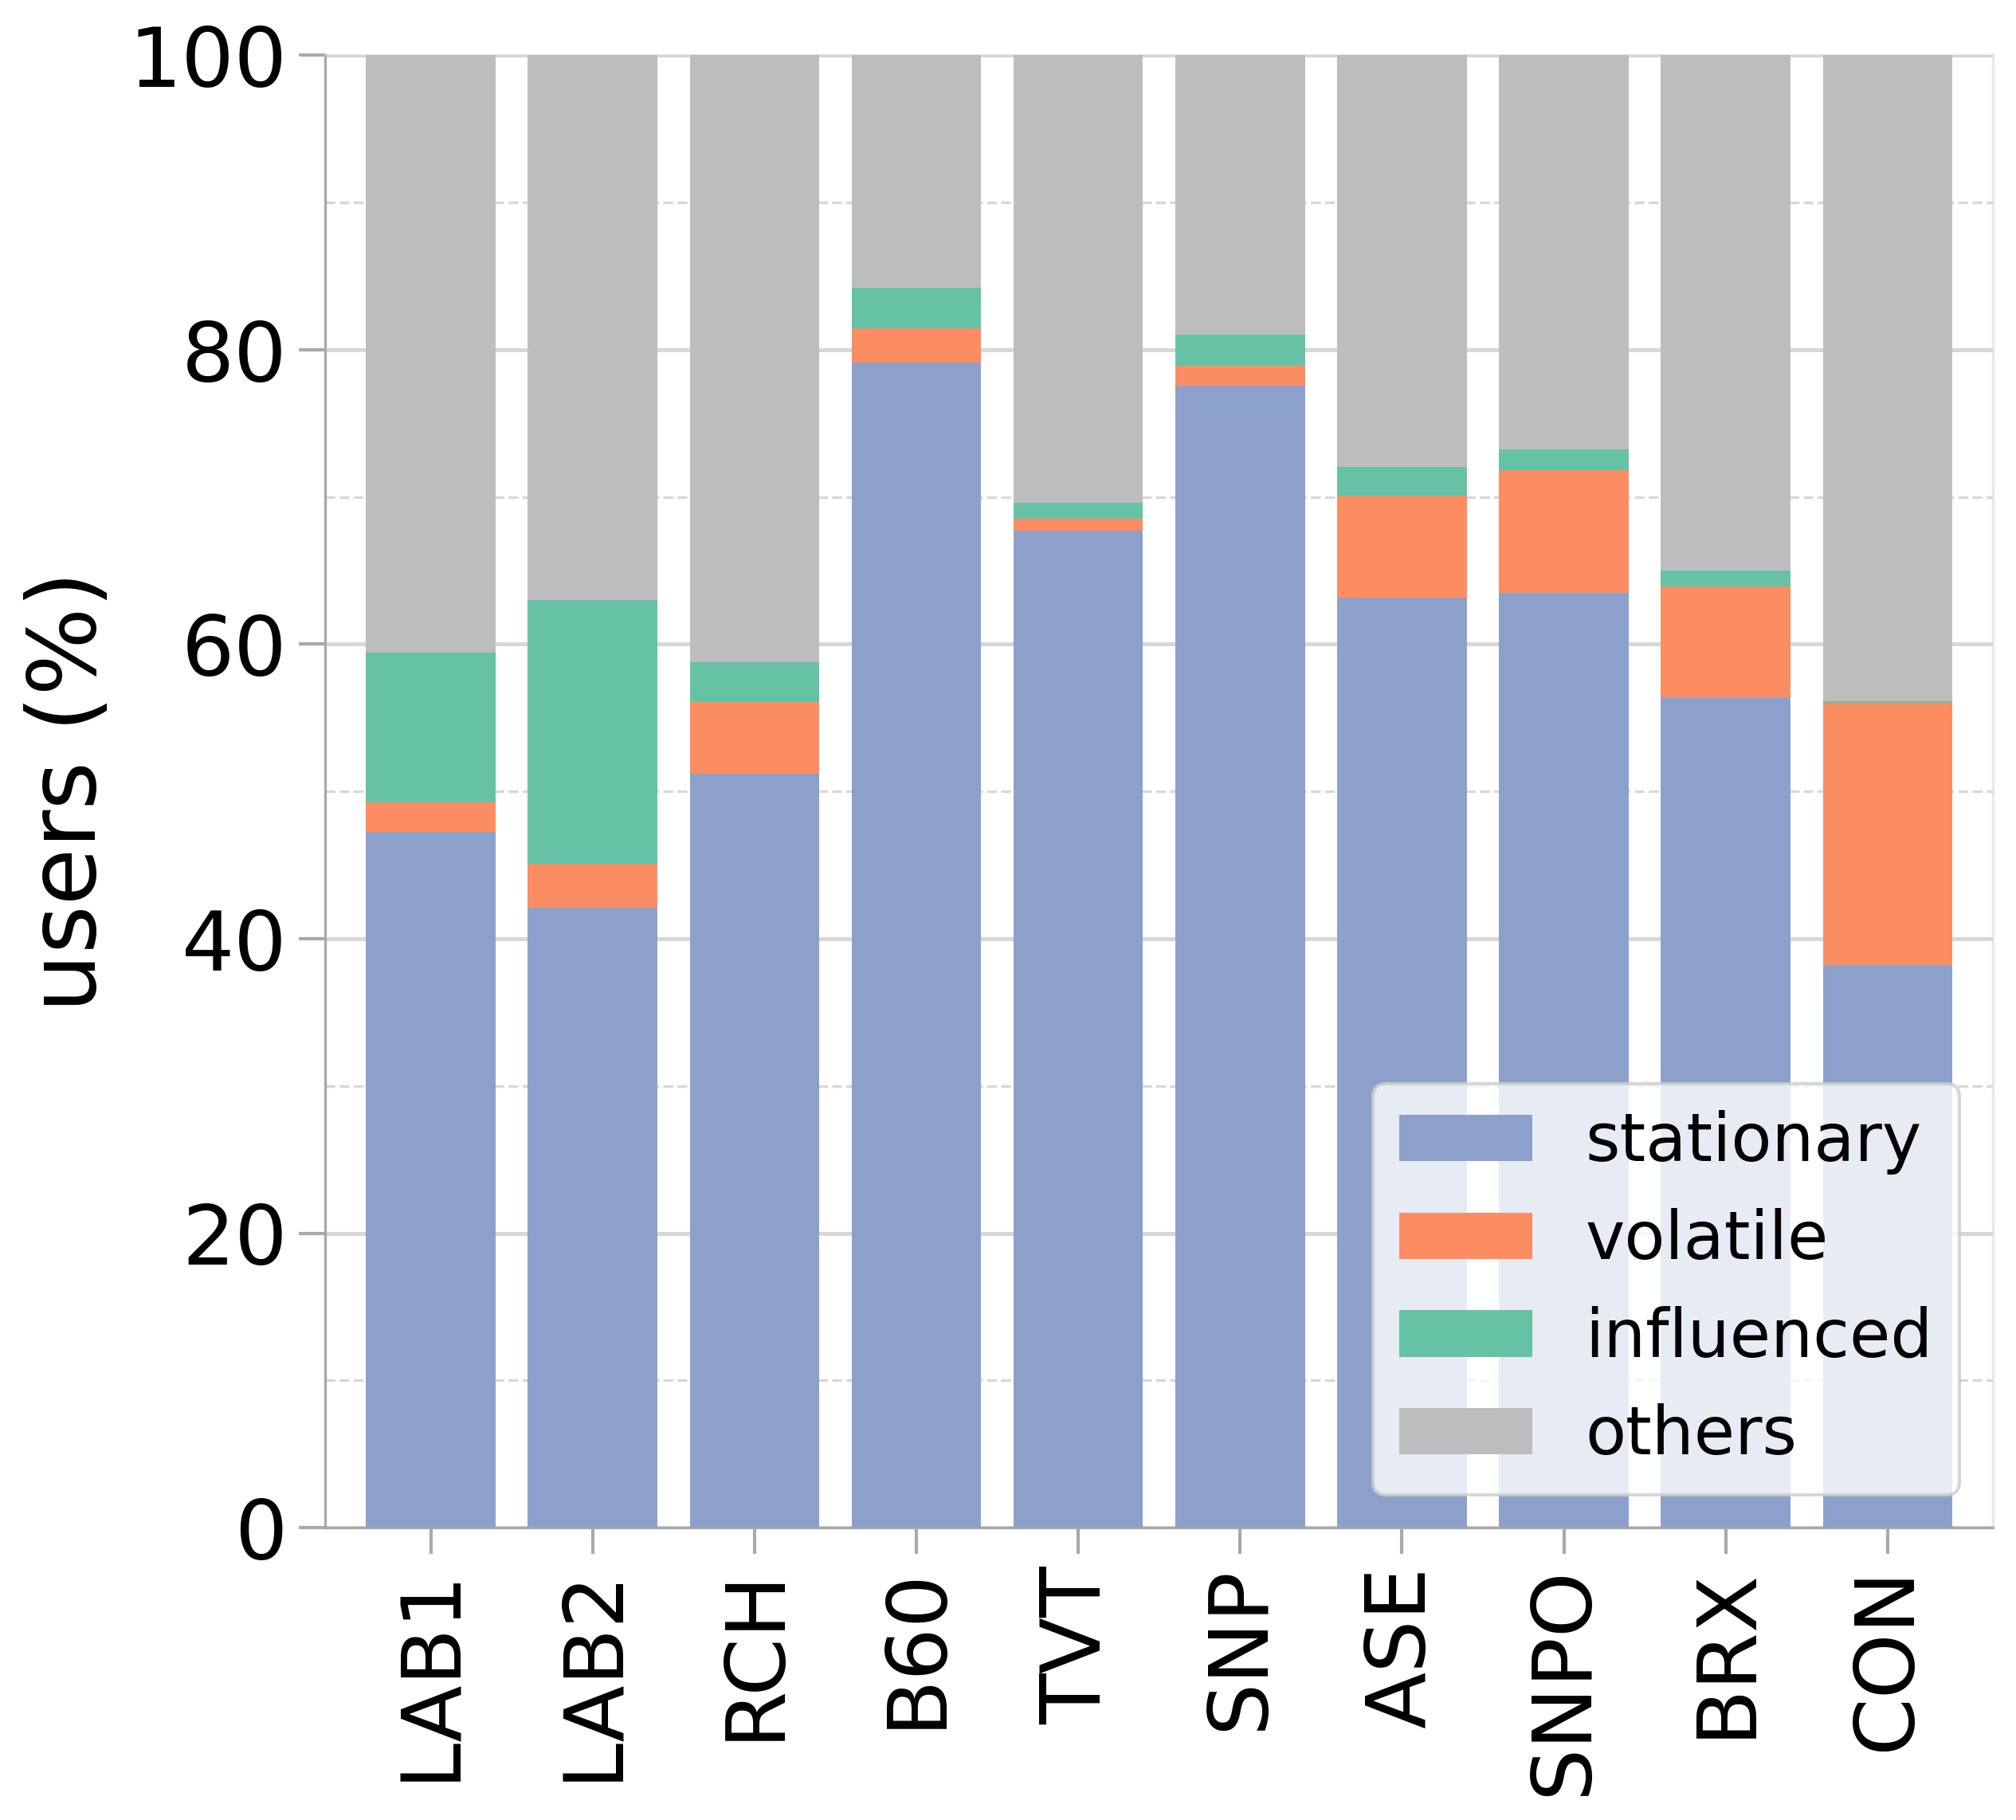
When investigating user behaviors as part of RQ2, Figure 7 surfaced heavy-tailed distributions for both user memberships to CCs and shifts between CCs, which imply heterogeneous user behaviors. On one hand these distributions represent a bulk of stationary users with no shifts and only one membership. On the other hand however, their long tails also admit the existence of a few volatile users characterized by a multitude of shifts, and of all other behaviors in between the “stationary” and “volatile” extremes. Following this observation, here we introduce three archetypes of users, each corresponding to different temporal behaviors with important practical implications. For each archetype, we (i) propose an operative definition, (ii) apply the definition to measure the presence of such users in our CCs, and (iii) explore possible motivations for their behavior.
Archetype 1: Stationary. Stationary users are those who belong to the same community for all the time. This archetype straightforwardly emerges from Figure 7 and the above discussion. The analysis of stationary users is relevant because their behavior could imply that they are strong supporters and core members of their CC (Trujillo and Cresci 2022). Figure 10 shows the proportion of stationary users, as well as of the users of the remaining archetypes, in the CCs. Users that do not match the definition of any archetype introduced in this section are grouped as “others”. As shown, the proportion of stationary users varies significantly. Center-leaning communities such as B60, TVT, and SNP featured a large share of stationary users: between 68% and 79% of all community members. Contrarily, stationary users constituted only of the strongly polarized CCs such as LAB1, LAB2, and CON. This finding suggests that politically polarized communities were more unstable than moderate ones. Interestingly, also our results in Figure 5 support this conclusion, with politically extreme CCs appearing as overall more unstable. This result is particularly relevant also in light of the many studies that specifically focus on strongly polarized communities, such as those on political polarization, fringe and extreme behaviors, and far-right online groups (Agathangelou et al. 2017; Zannettou et al. 2018; Morstatter et al. 2018).
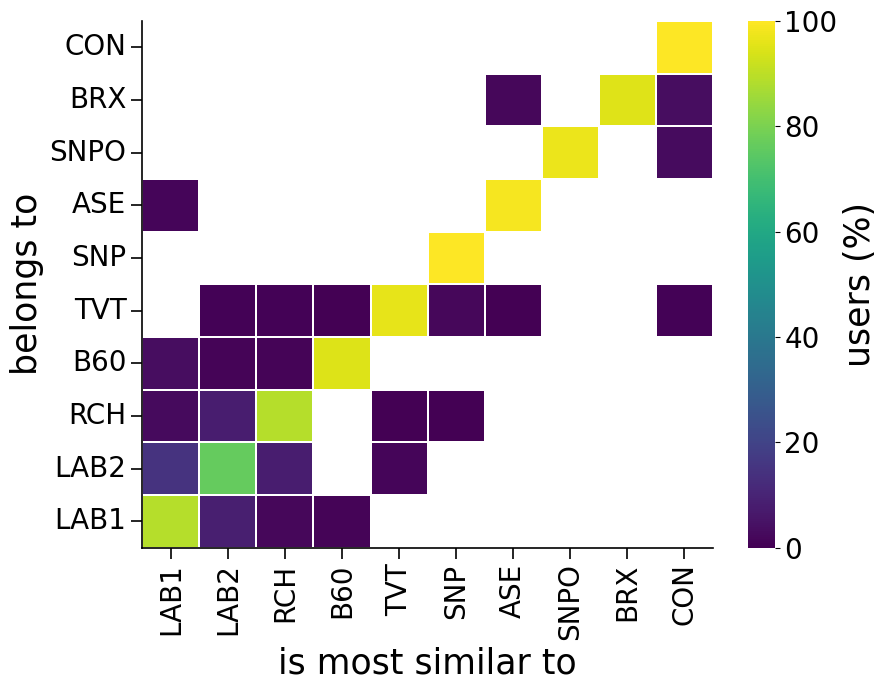
To gain insights into why stationary users never leave their CC, we analyze their use of hashtags as a proxy for their interests and viewpoints, in relation to those of their CC and of all other communities. The rationale for this analysis stems from the literature on echo chambers and political polarization as these users might be disincentivized to change community because they already belong to the CC that mostly represents their interests and viewpoints (Garimella et al. 2018). Operationally, we model each stationary user with the TF ordered ranking of the hashtags they used and each CC with the TF ordered ranking of the hashtags used by its members. Then, we compute the similarity between stationary users and all CCs as the Rank-Biased Overlap (RBO) of the respective rankings (Webber, Moffat, and Zobel 2010). RBO is a probabilistic measure of similarity based on the overlap between two rankings, which can handle tied ranks and rankings of different lengths, as in our case. Furthermore, it has a bias component that favors (i.e., weights more) overlaps between top items in the rankings (Trujillo and Cresci 2022). Once computed the RBO scores, we compare the CC to which each stationary user belongs with that to which it is mostly similar, as shown in Figure 11. Out of 2,639 stationary users, 2,484 (94%) are mostly similar to the CC to which they belong, as highlighted in figure by the great prevalence of users along the main diagonal. Instead, only 155 (6%) of them are more similar to a different CC than the one to which they belong. These cases mostly occur within the RCH and LAB2 CCs, which are anyway very similar as shown in Figure 8. Overall, our results confirm the similarity between the interests and viewpoints of stationary users and those of the CC to which they belong.
Archetype 2: Influenced. Influenced users are those who change community and remain in the destination community for a relatively long time. One of the advantages of our dynamic analysis lies in the possibility to investigate user shifts between CCs. In the case of polarized or controversial online debates, shifts – disregarded in previous studies – provide valuable information on the evolving stance of the users with respect the sides involved in the debate. To this end, users who abandon a community to join another one for a long time might have been persuaded or influenced by the latter. Hence detecting and characterizing influenced users could have important practical implications for the study of online campaigns. For our subsequent analyses we consider as influenced all those users who never left the destination community after a shift . Moreover, we also impose that each influenced user remained in for at least one third of the time covered in the dataset, so as to avoid considering as influenced those users who stayed in the destination community for just a few days before the election. Similarly to what we observed for stationary users, Figure 10 shows major differences in the proportion of influenced users. Out of all the CCs, LAB2 was the one with the highest share (18%), followed by LAB1, B60, and RCH. These are all left and center-left leaning communities. Opposite results emerge for right-leaning communities, where CON had the lowest share of influenced users, followed by BRX, TVT, and SNPO. These results extend and reinforce those related to the net flows of users between CCs, which we reported in Figure 9. Together, they surface a previously unknown strong political imbalance, in favor of the left, in the capacity to attract and hold users by the CCs involved in the electoral debate.
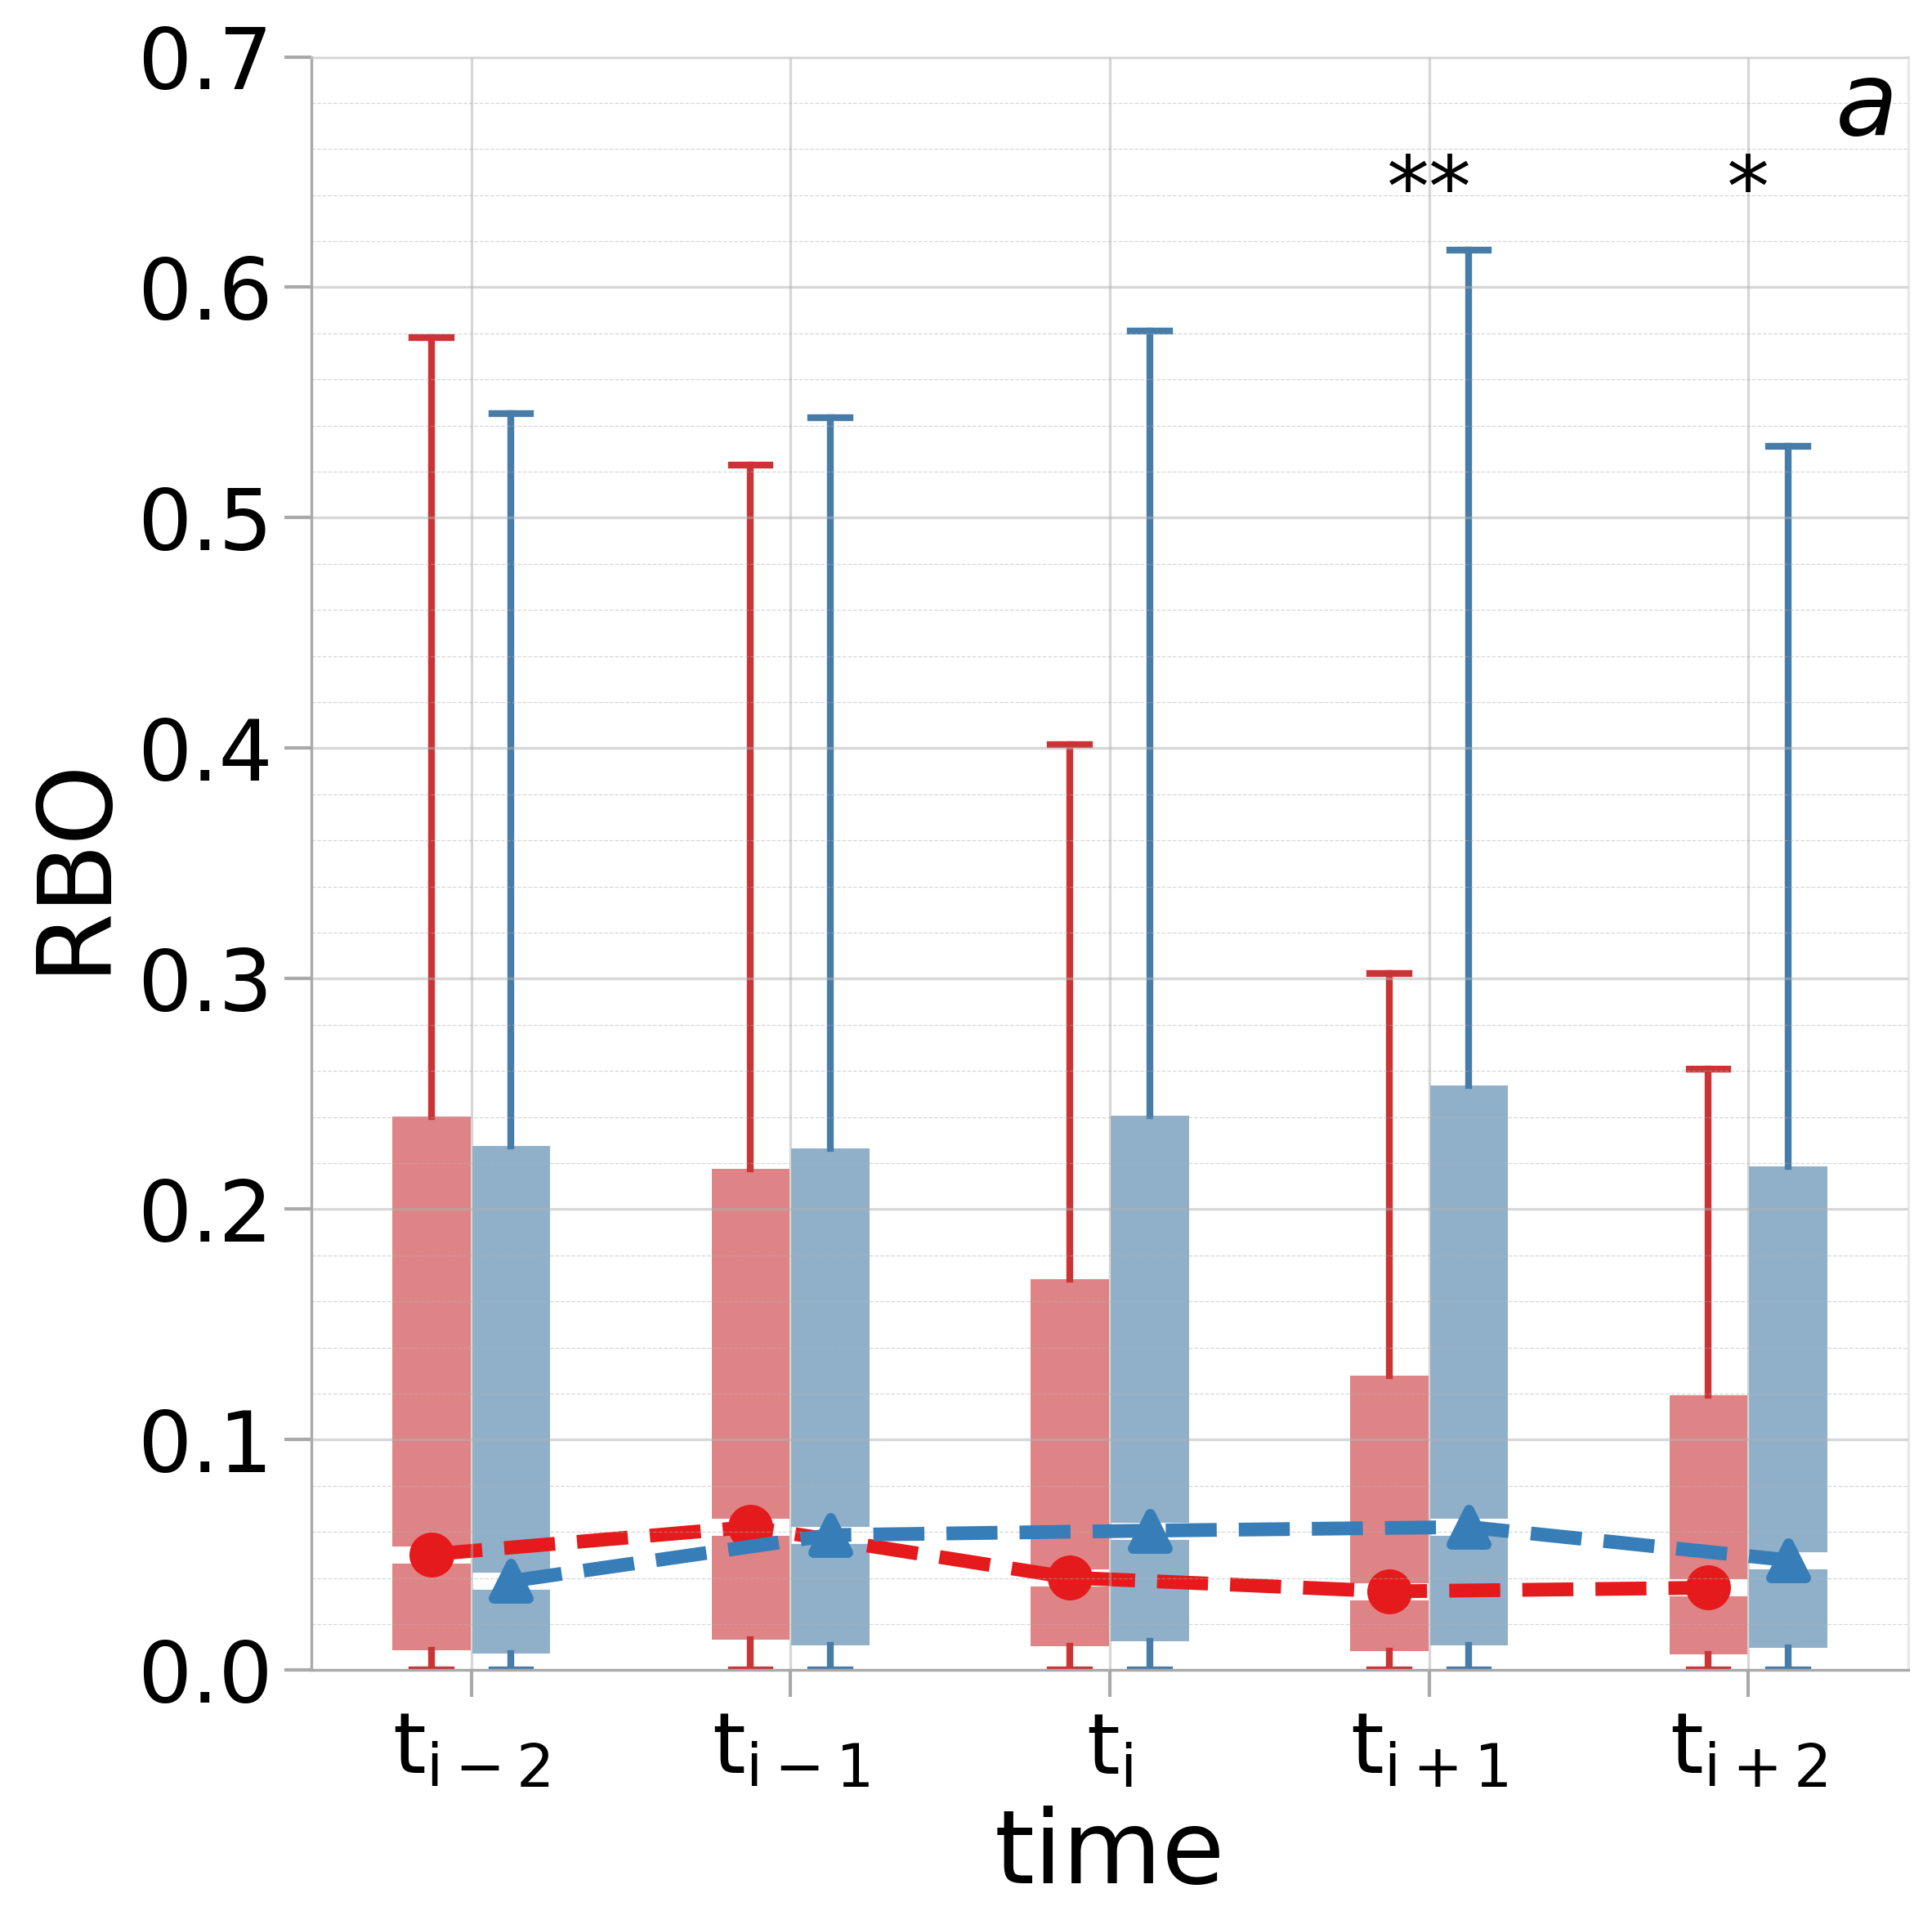
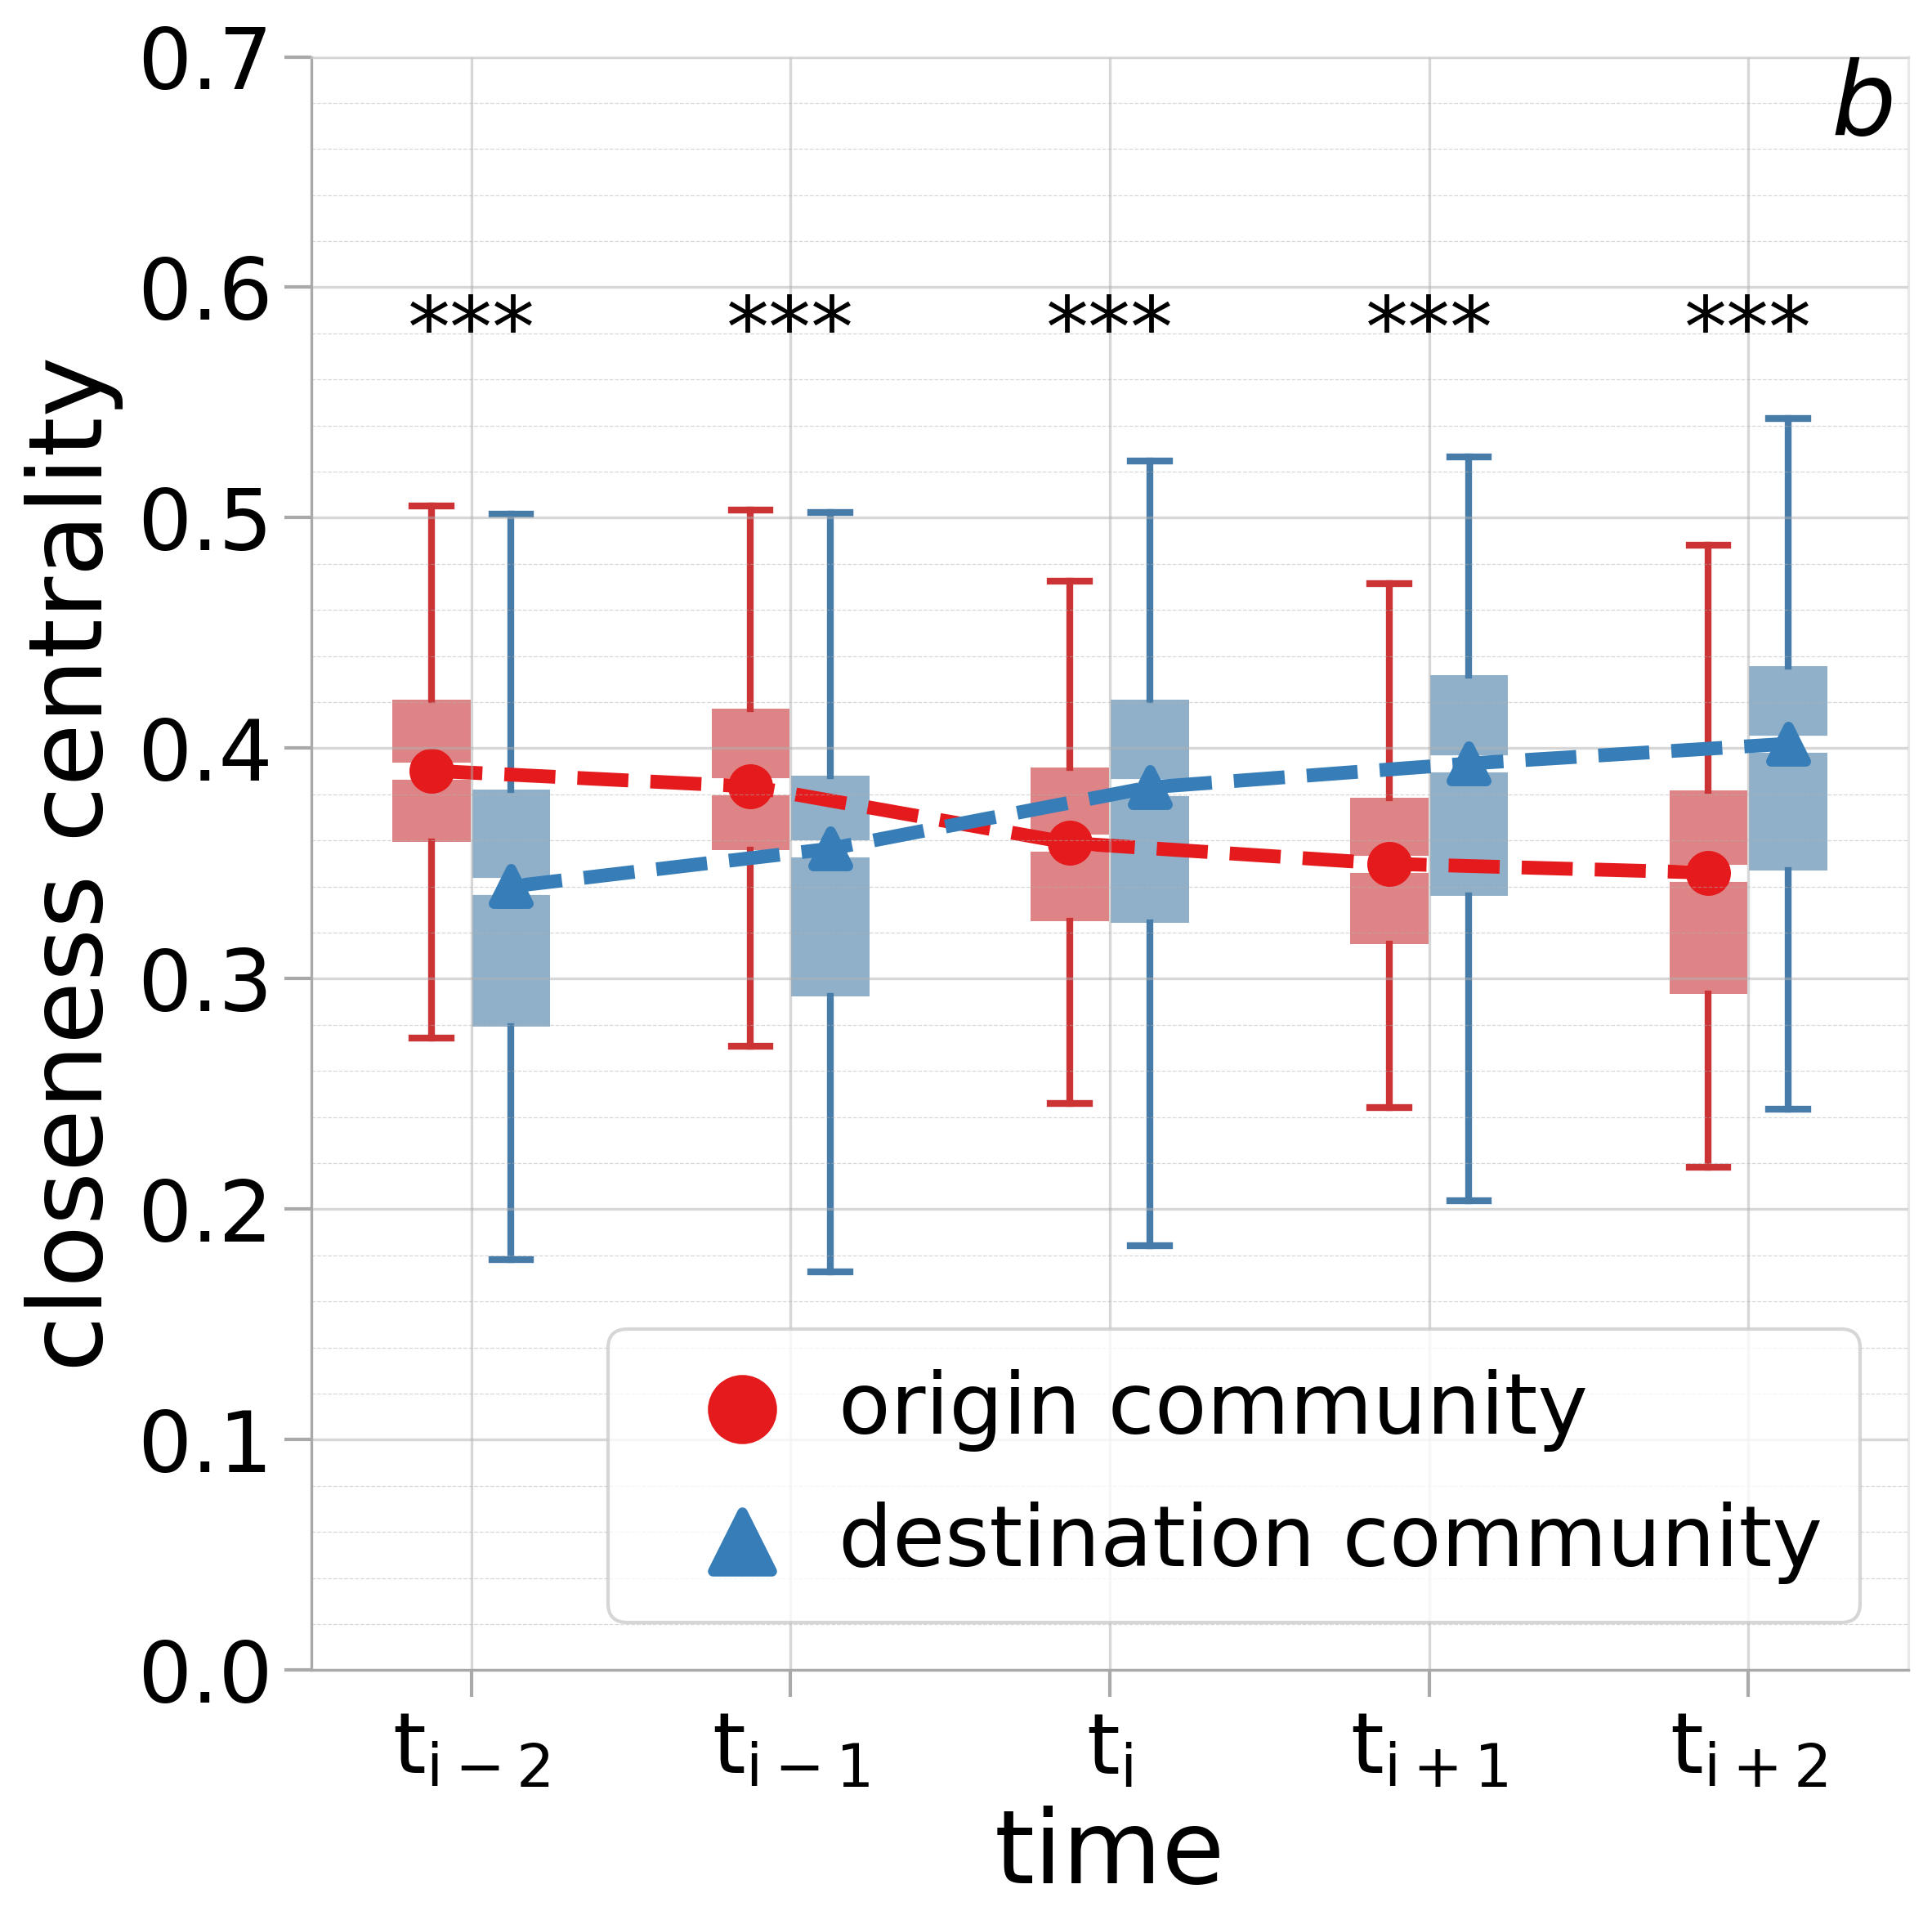
Next, we explore possible drivers for the behavior of influenced users. Specifically, for each influenced user we investigate whether there exist signals capable of explaining its shift from the origin community to the destination community . For this analysis we consider the time-evolving relationship between , , and from a twofold perspective: (i) topic-based similarity and (ii) topological position in the network. Specifically, with the former we assess whether influenced users exhibited a time-increasing topic-based similarity with their destination communities. Topic-based similarities are measured with the RBO scores obtained by comparing the hashtag rankings of influenced users to those of and . With the latter, we evaluate whether the position of the influenced users in the multiplex temporal network became gradually closer to their destination community. We operationalize this distance by computing the closeness centrality of the influenced users with respect to and . Before carrying out both analyses, we temporally align all influenced users so that their shifts all occur at time . Then, we evaluate topic-based similarities and closeness centralities before and after . The temporal trends shown in Figure 12 reveal that influenced users indeed exhibited an increasing similarity – be it topic- or network-based – to their destination community as time went by. Meanwhile, they also became increasingly dissimilar to their origin community. This behavior is observable both before the time of the shift as well as in its aftermath, denoting a clear behavioral trajectory. Furthermore, we note that the opposite similarity trends observed for the origin vs. destination communities cross just before , which might explain the subsequent shift. The above results are consistent for both topic-based similarity and closeness centrality. However, the latter provides a much stronger signal than the former, as reflected by the marked differences between the trends shown in Figure 12b with respect to those in Figure 12a, which also results in the differences in Figure 12b being statistically significant at each considered time step, according to a Kruskal–Wallis test.
Archetype 3: Volatile. Volatile users are those who repeatedly change community, staying in each community only for a limited amount of time. At the opposite of stationary users are those whose behavior is very erratic. Volatile users often shift between CCs without attaching to any, if not for a very limited time. The identification and characterization of volatile users in online debates is relevant, as they might represent undecided users who have not already taken a strong position about the discussed topic (Longpre, Durmus, and Cardie 2019; Lenti and Ruffo 2022). Here, we operationalize volatile users as those who performed three or more shifts, and that spent less than one third of the total time in each CC to which they belonged. Figure 10 shows that the proportion of volatile users in the CCs is skewed towards the right-hand side of the political spectrum. In detail, CON had by far the largest share of volatile users (18%), followed by SNPO, BRX, and ASE – which are all right-leaning communities. Volatile users in each of the remaining CCs accounted for less than 5% of each community’s members. This result is the counterpart of what we discussed about influenced users for the left-leaning CCs. In fact, while we previously found evidence of the effectiveness of the left-leaning communities in attracting (i.e., influencing) users as the electoral debate unfolded, here we find evidence of the weakness of the right-leaning CCs. Interestingly, this result appears to be in contrast to the majority of the existing literature on the use of online platforms by political groups, where right-leaning communities were described as tech-savvy and capable of making the most out of social media campaigning (Morstatter et al. 2018).
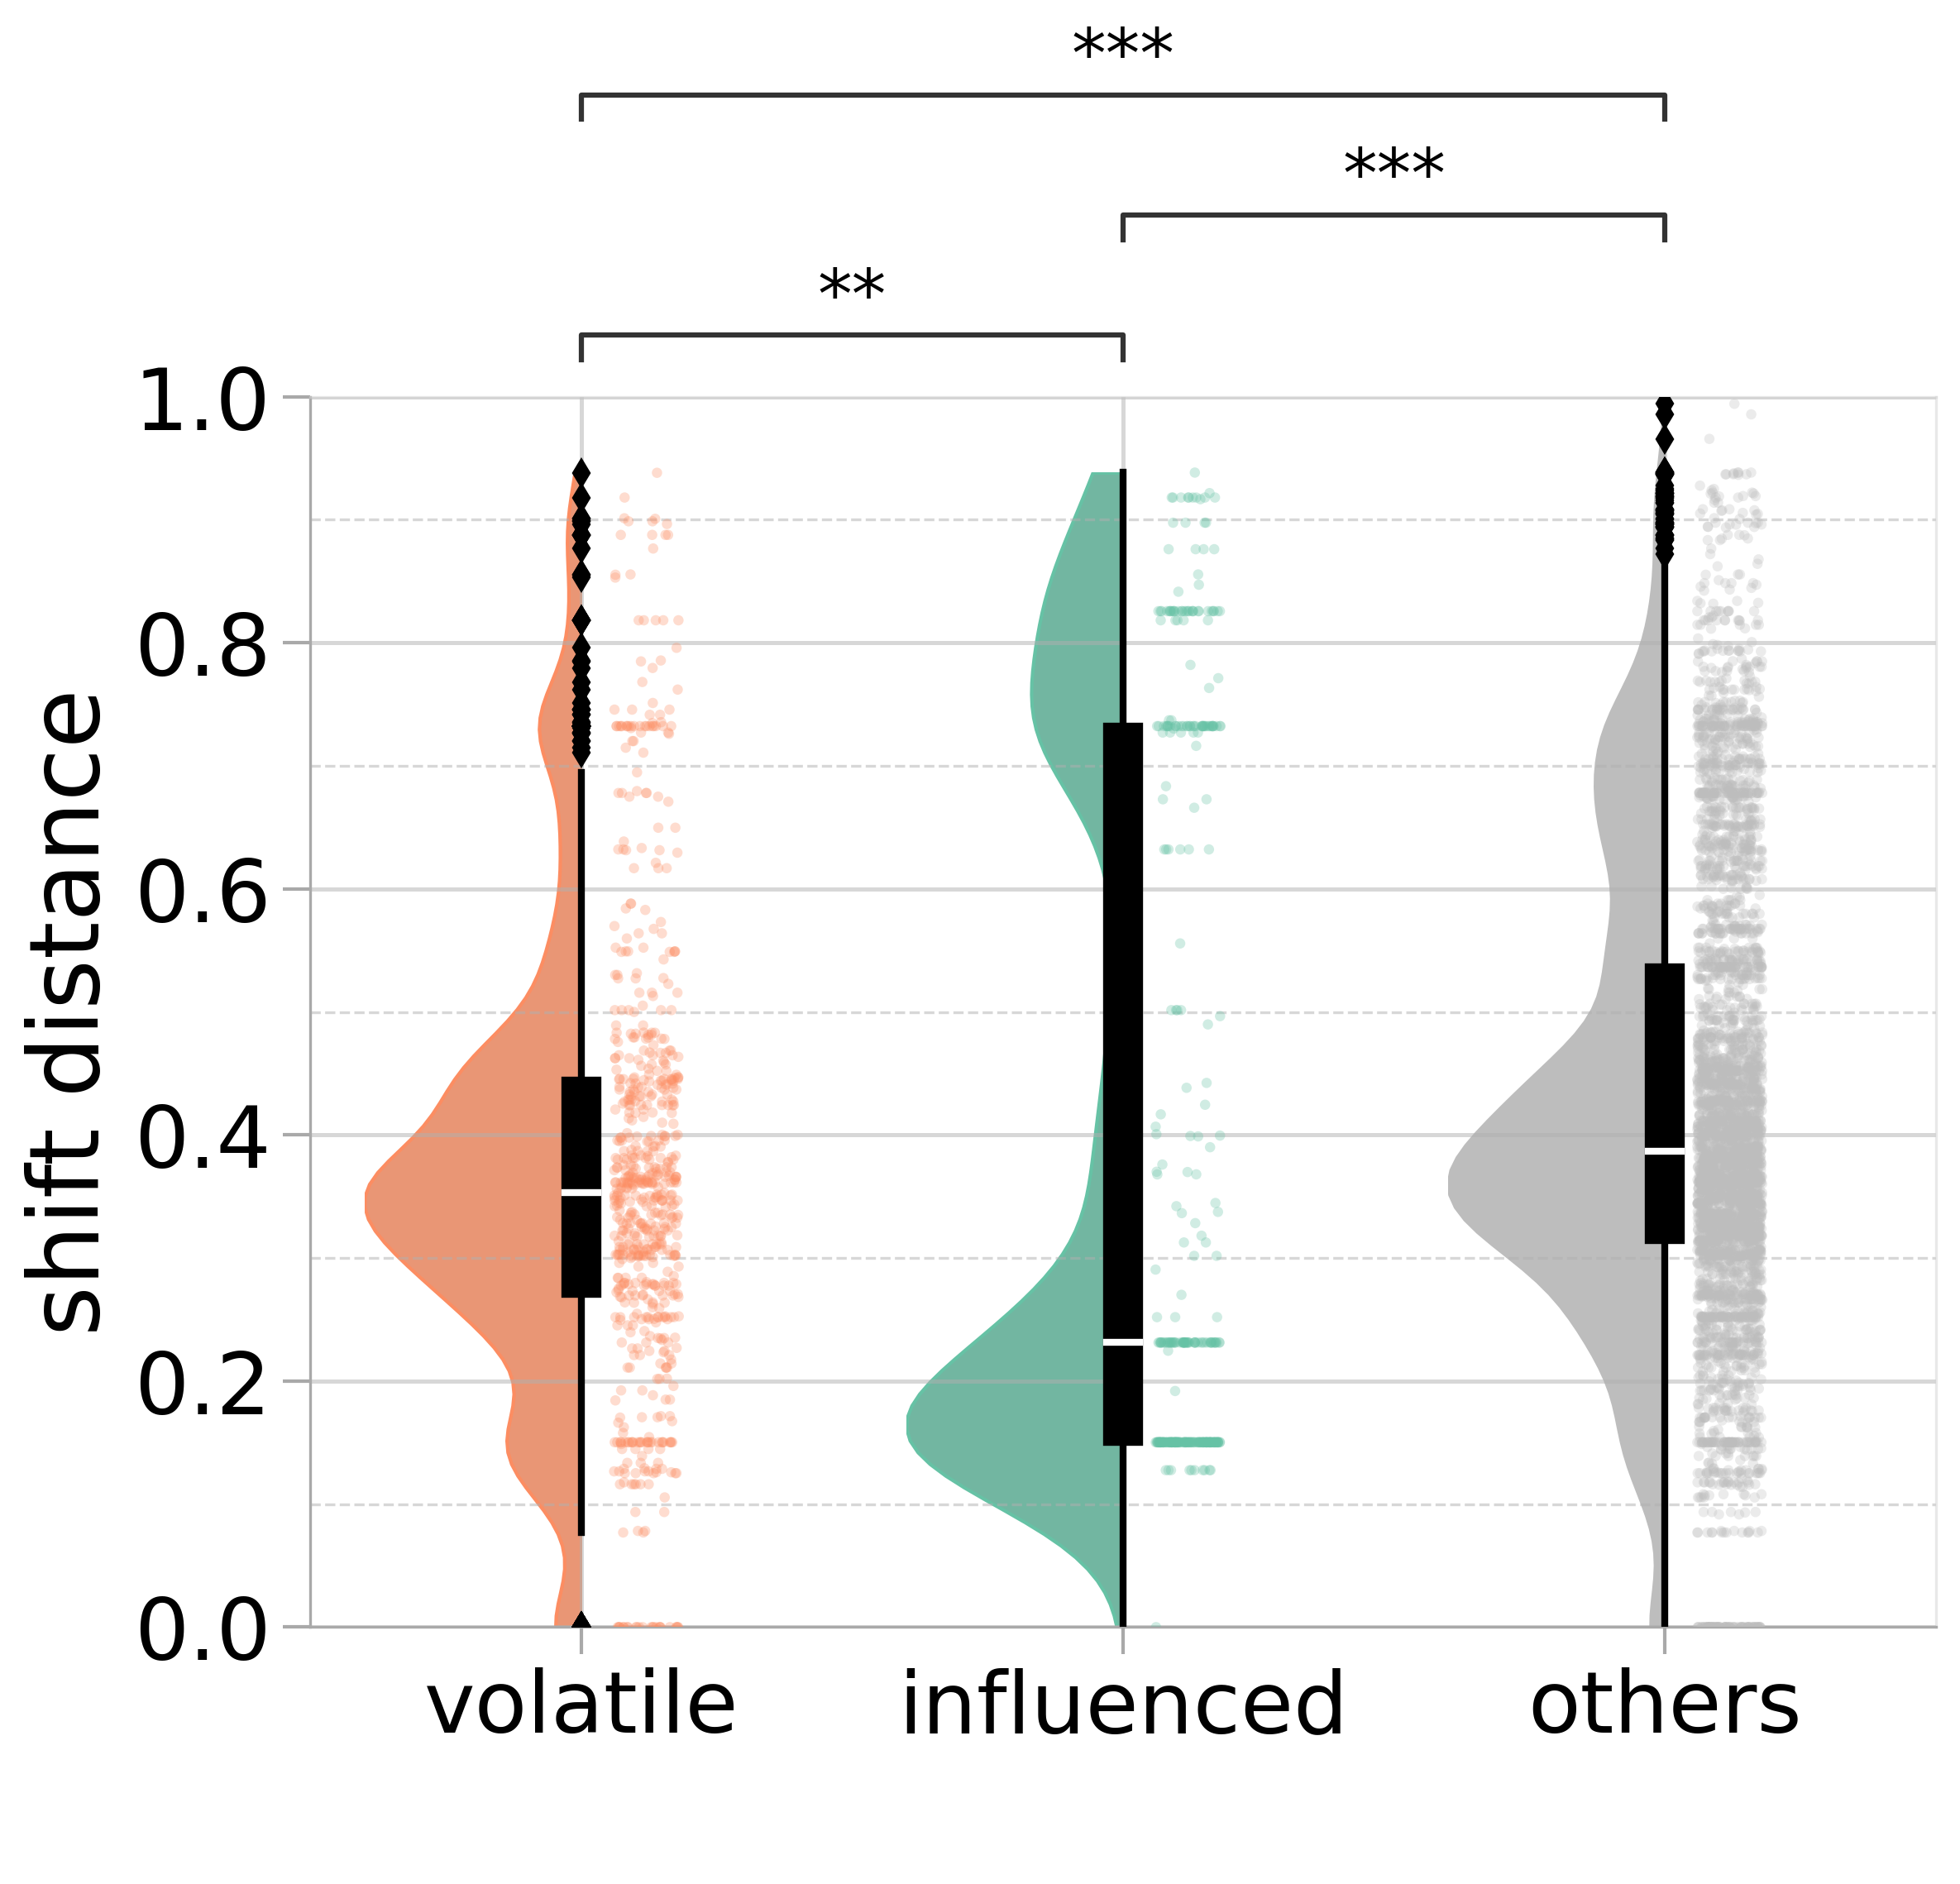
To further investigate the behavior of volatile users, we analyze the distance spanned by their shifts. Similarly to our analysis in RQ2, we measure the distance spanned by a shift based on the similarity between the communities and , so that shifts between similar CCs span a shorter distance than those between dissimilar ones. We thus operationalize shift distances with the weights that we computed based on the similarities between the CCs reported in Figure 8. Figure 13 shows the distribution of the shift distances for volatile users, influenced users, and for those users that do not match the definition of any archetype. As shown, the vast majority of shifts by volatile users are relatively short. Qualitatively, the distribution of shift distances for volatile users resembles that of the other generic users, suggesting that a simple analysis of shift distances is insufficient to explain the difference between volatile and others. Nonetheless, a Kruskal–Wallis test supports the difference between volatile and influenced () or other users (). Instead, much more evident is the difference between the distribution of shift distances for influenced users with respect to all other types of users, with the former being a bimodal distribution. This last observation is particularly interesting for the study of online influence as it suggests that a subset of users permanently joined a community that was politically far from their origin community.
Conclusions
We proposed a method for carrying out dynamic analyses of coordinated online behavior and we applied it to study the Twitter debate related to the 2019 UK general election. Our novel approach, grounded on a multiplex temporal network and dynamic community detection, identified more coordinated communities than those found in previous works, surfacing temporal nuances of coordination that would not be observable otherwise. Our analysis produced key findings in multiple areas. Regarding coordinated communities, we found that the majority were rather unstable and experienced significant changes in size and membership through time. Moreover, some communities evolved in time in opposite ways (e.g., some expanded while others shrank). Regarding user membership to coordinated communities, we found evidence of heavy-tailed distributions implying the existence of a bulk (49%) of users that belonged to a single community for all the time, and of a long tail (51%) that belonged to many. The majority of user shifts from a community to another occurred between politically-aligned communities, although we found a subset of users who crossed the political spectrum. Finally, we found that moderate communities were more stable than strongly polarized ones, and that left-leaning communities managed to attract many new members to the detriment of right-leaning groups.
Our dynamic analysis and results also open up multiple directions of future work. First, several of our results bear important implications, such as those about the instability of polarized communities. However, acting upon these results first mandates to assess the generalizability of our findings to other online debates. Then, the three behavioral archetypes (i.e., stationary, influenced, and volatile users) that we surfaced call for additional analyses. To this end, we aim to deepen our understanding of such users by investigating their peculiar characteristics and the role they have in their respective communities. Finally, our work also sets the stage for a number of novel predictive tasks, which we will tackle in our future work. Examples are the prediction of which users will join or leave a community, and the prediction of the time when a user will shift to a different community. These tasks are strictly related to the current studies of online influence, since our work provided seminal contributions towards nowcasting, or even forecasting, the trajectory of a controversial or polarizing online debate.
Ethics Statement
We strongly believe that this work will have a positive broader impact on the understanding of coordinated online behavior and on the unfolding of online debates. Among the ethical implications of our results is the possibility to predict, and thus act upon, the influence of certain online communities. In turn, this would open new intervention opportunities (e.g., content moderation) for online platforms. However, extreme care should be taken in order to avoid discriminating users and communities based on sensitive attributes (e.g., political leaning). Since this study is observational and retrospective, no users were harmed as part of the research. This work is entirely based on public Twitter data, which was enriched with indicators of coordination and political leaning. Given the sensitive information about user activities, the main ethical risk is the potential deanonymization of the dataset, which we mitigated via pseudonymization and aggregated analyses. Moreover, we remark that the base dataset we used fully abides by the FAIR principles, since it is published in an interoperable and machine-readable format, and under a reusable license. Further, it is indexed on the reference platform Zenodo, with an associated DOI.
References
- Agathangelou et al. (2017) Agathangelou, P.; Katakis, I.; Rori, L.; Gunopulos, D.; and Richards, B. 2017. Understanding online political networks: The case of the far-right and far-left in Greece. In SocInfo.
- Cao et al. (2015) Cao, C.; Caverlee, J.; Lee, K.; Ge, H.; and Chung, J. 2015. Organic or organized? Exploring URL sharing behavior. In ACM CIKM.
- Cinelli et al. (2022) Cinelli, M.; Cresci, S.; Quattrociocchi, W.; Tesconi, M.; and Zola, P. 2022. Coordinated inauthentic behavior and information spreading on Twitter. Decision Support Systems, 160.
- Di Pietro et al. (2021) Di Pietro, R.; Caprolu, M.; Raponi, S.; and Cresci, S. 2021. New Dimensions of Information Warfare, volume 84 of Advances in Information Security. Springer.
- Francois, Barash, and Kelly (2021) Francois, C.; Barash, V.; and Kelly, J. 2021. Measuring coordinated versus spontaneous activity in online social movements. New Media & Society.
- Garimella et al. (2018) Garimella, K.; De Francisci Morales, G.; Gionis, A.; and Mathioudakis, M. 2018. Political discourse on social media: Echo chambers, gatekeepers, and the price of bipartisanship. In ACM WWW.
- Giglietto et al. (2020) Giglietto, F.; Righetti, N.; Rossi, L.; and Marino, G. 2020. It takes a village to manipulate the media: Coordinated link sharing behavior during 2018 and 2019 Italian elections. Information, Communication & Society, 23(6).
- Hristakieva et al. (2022) Hristakieva, K.; Cresci, S.; Da San Martino, G.; Conti, M.; and Nakov, P. 2022. The spread of propaganda by coordinated communities on social media. In ACM WebSci.
- Jackson et al. (2019) Jackson, D.; Thorsen, E.; Lilleker, D.; and Weidhase, N. 2019. UK election analysis 2019: Media, voters and the campaign. Technical report, Bournemouth University Centre for Comparative Politics and Media Research.
- Lenti and Ruffo (2022) Lenti, J.; and Ruffo, G. 2022. Ensemble of opinion dynamics models to understand the role of the undecided in the vaccination debate. In arXiv:2201.08822.
- Longpre, Durmus, and Cardie (2019) Longpre, L.; Durmus, E.; and Cardie, C. 2019. Persuasion of the undecided: Language vs. the listener. In ACL ArgMining.
- Magelinski, Ng, and Carley (2022) Magelinski, T.; Ng, L.; and Carley, K. 2022. A synchronized action framework for detection of coordination on social media. Journal of Online Trust and Safety, 1(2).
- Mariconti et al. (2019) Mariconti, E.; Suarez-Tangil, G.; Blackburn, J.; De Cristofaro, E.; Kourtellis, N.; Leontiadis, I.; Serrano, J. L.; and Stringhini, G. 2019. “You know what to do”: Proactive detection of YouTube videos targeted by coordinated hate attacks. In ACM CSCW.
- Mendoza, Tesconi, and Cresci (2020) Mendoza, M.; Tesconi, M.; and Cresci, S. 2020. Bots in social and interaction networks: Detection and impact estimation. ACM TOIS, 39(1).
- Morstatter et al. (2018) Morstatter, F.; Shao, Y.; Galstyan, A.; and Karunasekera, S. 2018. From Alt-right to Alt-rechts: Twitter analysis of the 2017 German federal election. In ACM WWW Companion.
- Mucha et al. (2010) Mucha, P. J.; Richardson, T.; Macon, K.; Porter, M. A.; and Onnela, J.-P. 2010. Community structure in time-dependent, multiscale, and multiplex networks. Science, 328(5980).
- Nizzoli et al. (2021) Nizzoli, L.; Tardelli, S.; Avvenuti, M.; Cresci, S.; and Tesconi, M. 2021. Coordinated behavior on social media in 2019 UK general election. In AAAI ICWSM.
- Pacheco et al. (2021) Pacheco, D.; Hui, P.-M.; Torres-Lugo, C.; Truong, B. T.; Flammini, A.; and Menczer, F. 2021. Uncovering coordinated networks on social media: Methods and case studies. In AAAI ICWSM.
- Rossetti and Cazabet (2018) Rossetti, G.; and Cazabet, R. 2018. Community discovery in dynamic networks: A survey. ACM CSUR, 51(2).
- Serrano, Boguná, and Vespignani (2009) Serrano, M. Á.; Boguná, M.; and Vespignani, A. 2009. Extracting the multiscale backbone of complex weighted networks. PNAS, 106(16).
- Sharma et al. (2021) Sharma, K.; Zhang, Y.; Ferrara, E.; and Liu, Y. 2021. Identifying coordinated accounts on social media through hidden influence and group behaviours. In ACM KDD.
- Steinert-Threlkeld et al. (2015) Steinert-Threlkeld, Z. C.; Mocanu, D.; Vespignani, A.; and Fowler, J. 2015. Online social networks and offline protest. EPJ Data Science, 4(1).
- Traag, Waltman, and Van Eck (2019) Traag, V. A.; Waltman, L.; and Van Eck, N. J. 2019. From Louvain to Leiden: Guaranteeing well-connected communities. Scientific Reports, 9(1).
- Trujillo and Cresci (2022) Trujillo, A.; and Cresci, S. 2022. Make Reddit Great Again: Assessing community effects of moderation interventions on r/The_Donald. In ACM CSCW.
- Vargas, Emami, and Traynor (2020) Vargas, L.; Emami, P.; and Traynor, P. 2020. On the detection of disinformation campaign activity with network analysis. In ACM CCSW.
- Webber, Moffat, and Zobel (2010) Webber, W.; Moffat, A.; and Zobel, J. 2010. A similarity measure for indefinite rankings. ACM TOIS, 28(4).
- Weber and Falzon (2021) Weber, D.; and Falzon, L. 2021. Temporal nuances of coordination networks. arXiv:2107.02588.
- Weber and Neumann (2021) Weber, D.; and Neumann, F. 2021. Amplifying influence through coordinated behaviour in social networks. Social Network Analysis and Mining, 11(1).
- Zannettou et al. (2018) Zannettou, S.; Caulfield, T.; Blackburn, J.; De Cristofaro, E.; Sirivianos, M.; Stringhini, G.; and Suarez-Tangil, G. 2018. On the origins of memes by means of fringe Web communities. In ACM IMC.
- Zhang, Sharma, and Liu (2021) Zhang, Y.; Sharma, K.; and Liu, Y. 2021. VigDet: Knowledge informed neural temporal point process for coordination detection on social media. In NeurIPS.