The Collisional and Photoionized Plasma in the Polarized NLS1 galaxy Mrk 1239
Abstract
Mrk 1239 is a highly polarized NLS1 in the optical band, whose keV spectrum has remained remarkably consistent over more than two decades of observation. Previous analysis of this object suggested that the soft X-ray band was dominated by emission lines (collisionally and/or photoionized) from the distant host galaxy as the X-ray emission from the central engine was highly obscured. New XMM-Newton data of Mrk 1239 are presented here to investigate the soft X-ray band of this galaxy with high resolution. The first RGS spectra of this source reveal a plethora of ionized emission lines originating from two distinct plasmas, one collisionally ionized and the other photoionized at approximately equal brightness. The best fit model uses apec and xstar grids to account for the collisionally ionized and photoionized components, respectively. The fit improves significantly if the photoionized material is allowed to outflow at km s-1, matching the outflow velocity of the forbidden O vii emission line. From constraints on the ionization and density of the photoionized material we can estimate the location of it to be no further than a few pc from the central source, around the outer radius of the torus, which is consistent with the O vii emission line. Properties of the collisionally ionized plasma are consistent with star formation rate (SFR) of , which is comparable with several previous measurements of the SFR in this galaxy.
keywords:
X-rays: galaxies – galaxies: star formation – galaxies: nuclei – galaxies: Seyfert1 Introduction
Mrk 1239 is a Narrow Line Seyfert 1 galaxy (NLS1) located at a redshift of (Beers et al., 1995). The optical spectra of Mrk 1239 was first reported by Rafanelli & Bonoli (1984) and later used by Osterbrock & Pogge (1985) to define the subclass of galaxies known as NLS1s. They suggest a classification criterion for NLS1 to have H line widths less than 2000 km s-1. This is now commonly adopted by the community (see Komossa, 2008, for a complete review). These active galaxies are thought to be low mass counterparts of broad line Seyfert 1s (BLS1). They show intense X-ray variability on both long-term and rapid time scales (see Gallo 2018; Wilkins et al. 2017; Wilkins & Gallo 2015). These objects are seen through low column densities and often exhibit steep powerlaw continuum (Waddell & Gallo, 2020) and strong soft excesses (Waddell et al., 2019).
Mrk 1239 is a radio quite galaxy that shows evidence of non-stellar radio emission (Doi et al., 2015). This indicates the possible presence of a radio jet originating from the AGN in this galaxy. Mrk 1239 is also a highly polarized in the broad H and H emission lines, along with the continuum (Pan et al., 2019, 2021). The high levels of polarization in Mrk 1239 have previously been observed by Goodrich (1989) where Mrk 1239 was the highest polarized source in the sample. This suggests some amount of scattered emission in this source. Mrk 1239 is classified as a polar-scattered Seyfert 1 galaxy, meaning the line of sight is through the upper layers of the tours (Smith et al., 2004; Jiang et al., 2019). As well Goodrich (1989) found that the Balmer lines had a higher polarization than the forbidden [O iii] lines. This is strong evidence that the sources of these emissions lines is physically distinct.
Mrk 1239 was first observed in X-ray using ROSAT where a steep photon index was found (, Rush & Malkan, 1996; Jiang et al., 2021). Mrk 1239 was a serendipitous source in a 2001 observation by XMM-Newton and analysed by Grupe et al. (2004). They found the continuum was best fit using a powerlaw with two intrinsic absorbers: the first a direct, highly absorbed path and the second a less absorbed scattered path. They concluded that this was consistent with the distinct emitting/scattering regions found in Goodrich (1989). Finally, Grupe et al. (2004) found an excess of emission at 0.91 keV, which was attributed to a blend of the Ne ix triplet. However, the O vii triplet was not observed in the spectrum suggesting a super-solar ratio of Ne/O in Mrk 1239.
Mrk 1239 was revisited by Buhariwalla et al. (2020) with archival X-ray data from Suzaku and NuSTAR, obtained in the subsequent years since Grupe et al. (2004). With this broadband multi-epoch analysis some truly unique behaviour was revealed. First and foremost, across the 18 years of data analysed the shape and flux of the spectra below 3 keV remain remarkably similar. Meanwhile, the spectrum above 3 keV retained the characteristic NLS1 variability. This immediately indicated the presence of a strong absorbing feature that blotted out most of the emission from the central engine below 3 keV. The 0.91 keV feature was present in the 2007 Suzaku observation of Mrk 1239.
Continuum modelling of this source between 0.3 and 30 keV saw a ionized partial covering model compared to a blurred reflection model. The data were insufficient to significantly distinguish between the two models but their similarities proved to be more interesting. Both models required high levels of intrinsic absorption and both models required the presence of a collisionally ionized component to fit the spectrum below 3 keV. Buhariwalla et al. (2020) attributed this collisionally ionized emission (CIE) to the presence of star forming activity in this object. They proposed that the 0.91 keV feature found originally by Grupe et al. (2004) was not an overabundance of Ne, but a blend of Fe-L lines from the regions of star formation. Using a relationship between the of the CIE and star formation rate (SFR) (Franceschini et al., 2003), the SFR of Mrk 1239 was found to be . This is comparable with the SFR of measured using PAH signatures (Ruschel-Dutra et al., 2016), found using SED fitting (Gruppioni et al., 2016), and found using IR measurements (Smirnova-Pinchukova et al., 2022). To fully probe the soft band of this galaxy and determine the origin of the 0.91 keV feature conclusively deeper observations of Mrk 1239 were needed.
This paper presents the first high-resolution X-ray spectrum of Mrk 1239 in the Å band with the XMM-Newton RGS spectra. Limited MOS/PN spectra of a deep observation of Mrk 1239 and a Chandra image is also presented. In Section 2, the observations and data reduction techniques are summarized. Section 3 examines the Chandra image, emission line identification, possible outflow velocities, plasma diagnostics and the possibility of a Ne/O and in Section 4 the spectra are analyzed. A discussion of the results is given in Section 5, and conclusions are drawn in Section 6.
2 Observations and Data Reduction
A snapshot observation of Mrk 1239 was taken on 2021-04-11 with Chandra as part of a sample study exploring duel AGN (Foord, 2020). Several months later a deep observation of Mrk 1239 was taken on 2021-11-04 with XMM-Newton and NuSTAR, with each obtaining ks of on source time. During the second half of the NuSTAR observation Mrk 1239 entered a flaring state. To fully explore all facets of this object analysis of the NuSTAR and broad band XMM-Newton data is relegated to a second paper. The data for analysis are listed in Table 1. This section describes the observations and data reduction.
| (1) | (2) | (3) | (4) | (5) | (6) | (7) | (8) |
|---|---|---|---|---|---|---|---|
| Observatory | Observation ID | Instrument Name | Start date | Duration | Exposure | Counts | Energy range |
| (yyyy-mm-dd) | [s] | [s] | |||||
| XMM-Newton | 0891070101 | PN | 2021-11-04 | 105000 | 79175 | 1512 | keV |
| XMM-Newton | RGS | 2021-11-04 | 105000 | Å | |||
| Chandra | 23693 | ACIS-S | 2021-04-11 | 2100 | 2021 | 50 | keV |
2.1 XMM-Newton
Mrk 1239 was observed with XMM-Newton (Jansen et al., 2001) for 105 ks starting on November 2021. The XMM-Newton Observation Data Files (ODF) were processed to produce calibrated event lists using the XMM-Newton Science Analysis System, sas V17.0.0. The first order RGS data was extracted from the ODF using rgsproc. Upon analysis of the light curve a background flaring event was seen within the first 15 ks. tabgtigen was used to filter all instances where the was greater than or equal to 0.1. The spectra was then re-extracted using rgsproc. RGS1 and RGS2 were then combined using rgscombine, which produced a combined source spectra, background spectra, and response matrix. The source and background spectra were then optimally binned using ftgrouppha (Kaastra & Bleeker, 2016), the spectra were loaded into xspec where the background was modelled. Fits were evaluated using Cash-statistics (C-stat, Cash, 1979).
For the PN spectra an event list was created from the ODF using epproc. The lightcurve was generated using evselect and used to examine for background flaring. The same flare seen in the RGS data was present in the PN data, thus tabgtigen was used to filter all times when the were greater than or equal to 10. The spectra was also examined for pileup and was found to be satisfactory. The source spectra was extracted from a circular region 35" centred on Mrk 1239. A background region was extracted from a circular region with a radius of 50" on the same chip. rmfgen and arfgen were used to generate response files for the observation.
2.2 Chandra
Mrk 1239 was observed with Chandra in April 2021 for 2.1 ks, and the data entered the archive in April 2022. The image was captured using Chandra ACIS-S instrument and the data was processed using ciao 4.14111https://cxc.cfa.harvard.edu/ciao/. Initially a spectrum was extracted using dmextract. The spectrum was then loaded into Sherpa where a rough fit was obtained and saved over the energy region of interest, 0.2-2.0 keV. The spectral shape obtained by this rough fit was imputed in ChaRT 222https://cxc.cfa.harvard.edu/ciao/PSFs/chart2/runchart.html along with the nominal RA and DEC of the observation to generate a simulated PSF. The PSF was then projected in the detector plane using MARX via simulate_psf with a bin size of 1 pixel and a blur factor of 0.25. Next the image was exposure corrected using fluximage, where an exposure corrected map centred around the brightest pixel in the image with a 600 pixel box, with bin size of 1 pixel. The image was extracted with a minimum energy of 0.2 keV, a maximum energy of 2 keV, and an effective energy of 1 keV. Finally the image was deconvolved with the PSF generated previously using arestore with the Lucy-Richardson deconvolution algorithm and 100 iterations. The finial image presented is smoothed using a Gaussian interpolation method.
3 Analysis
3.1 Extended emission in 0.2-2 keV
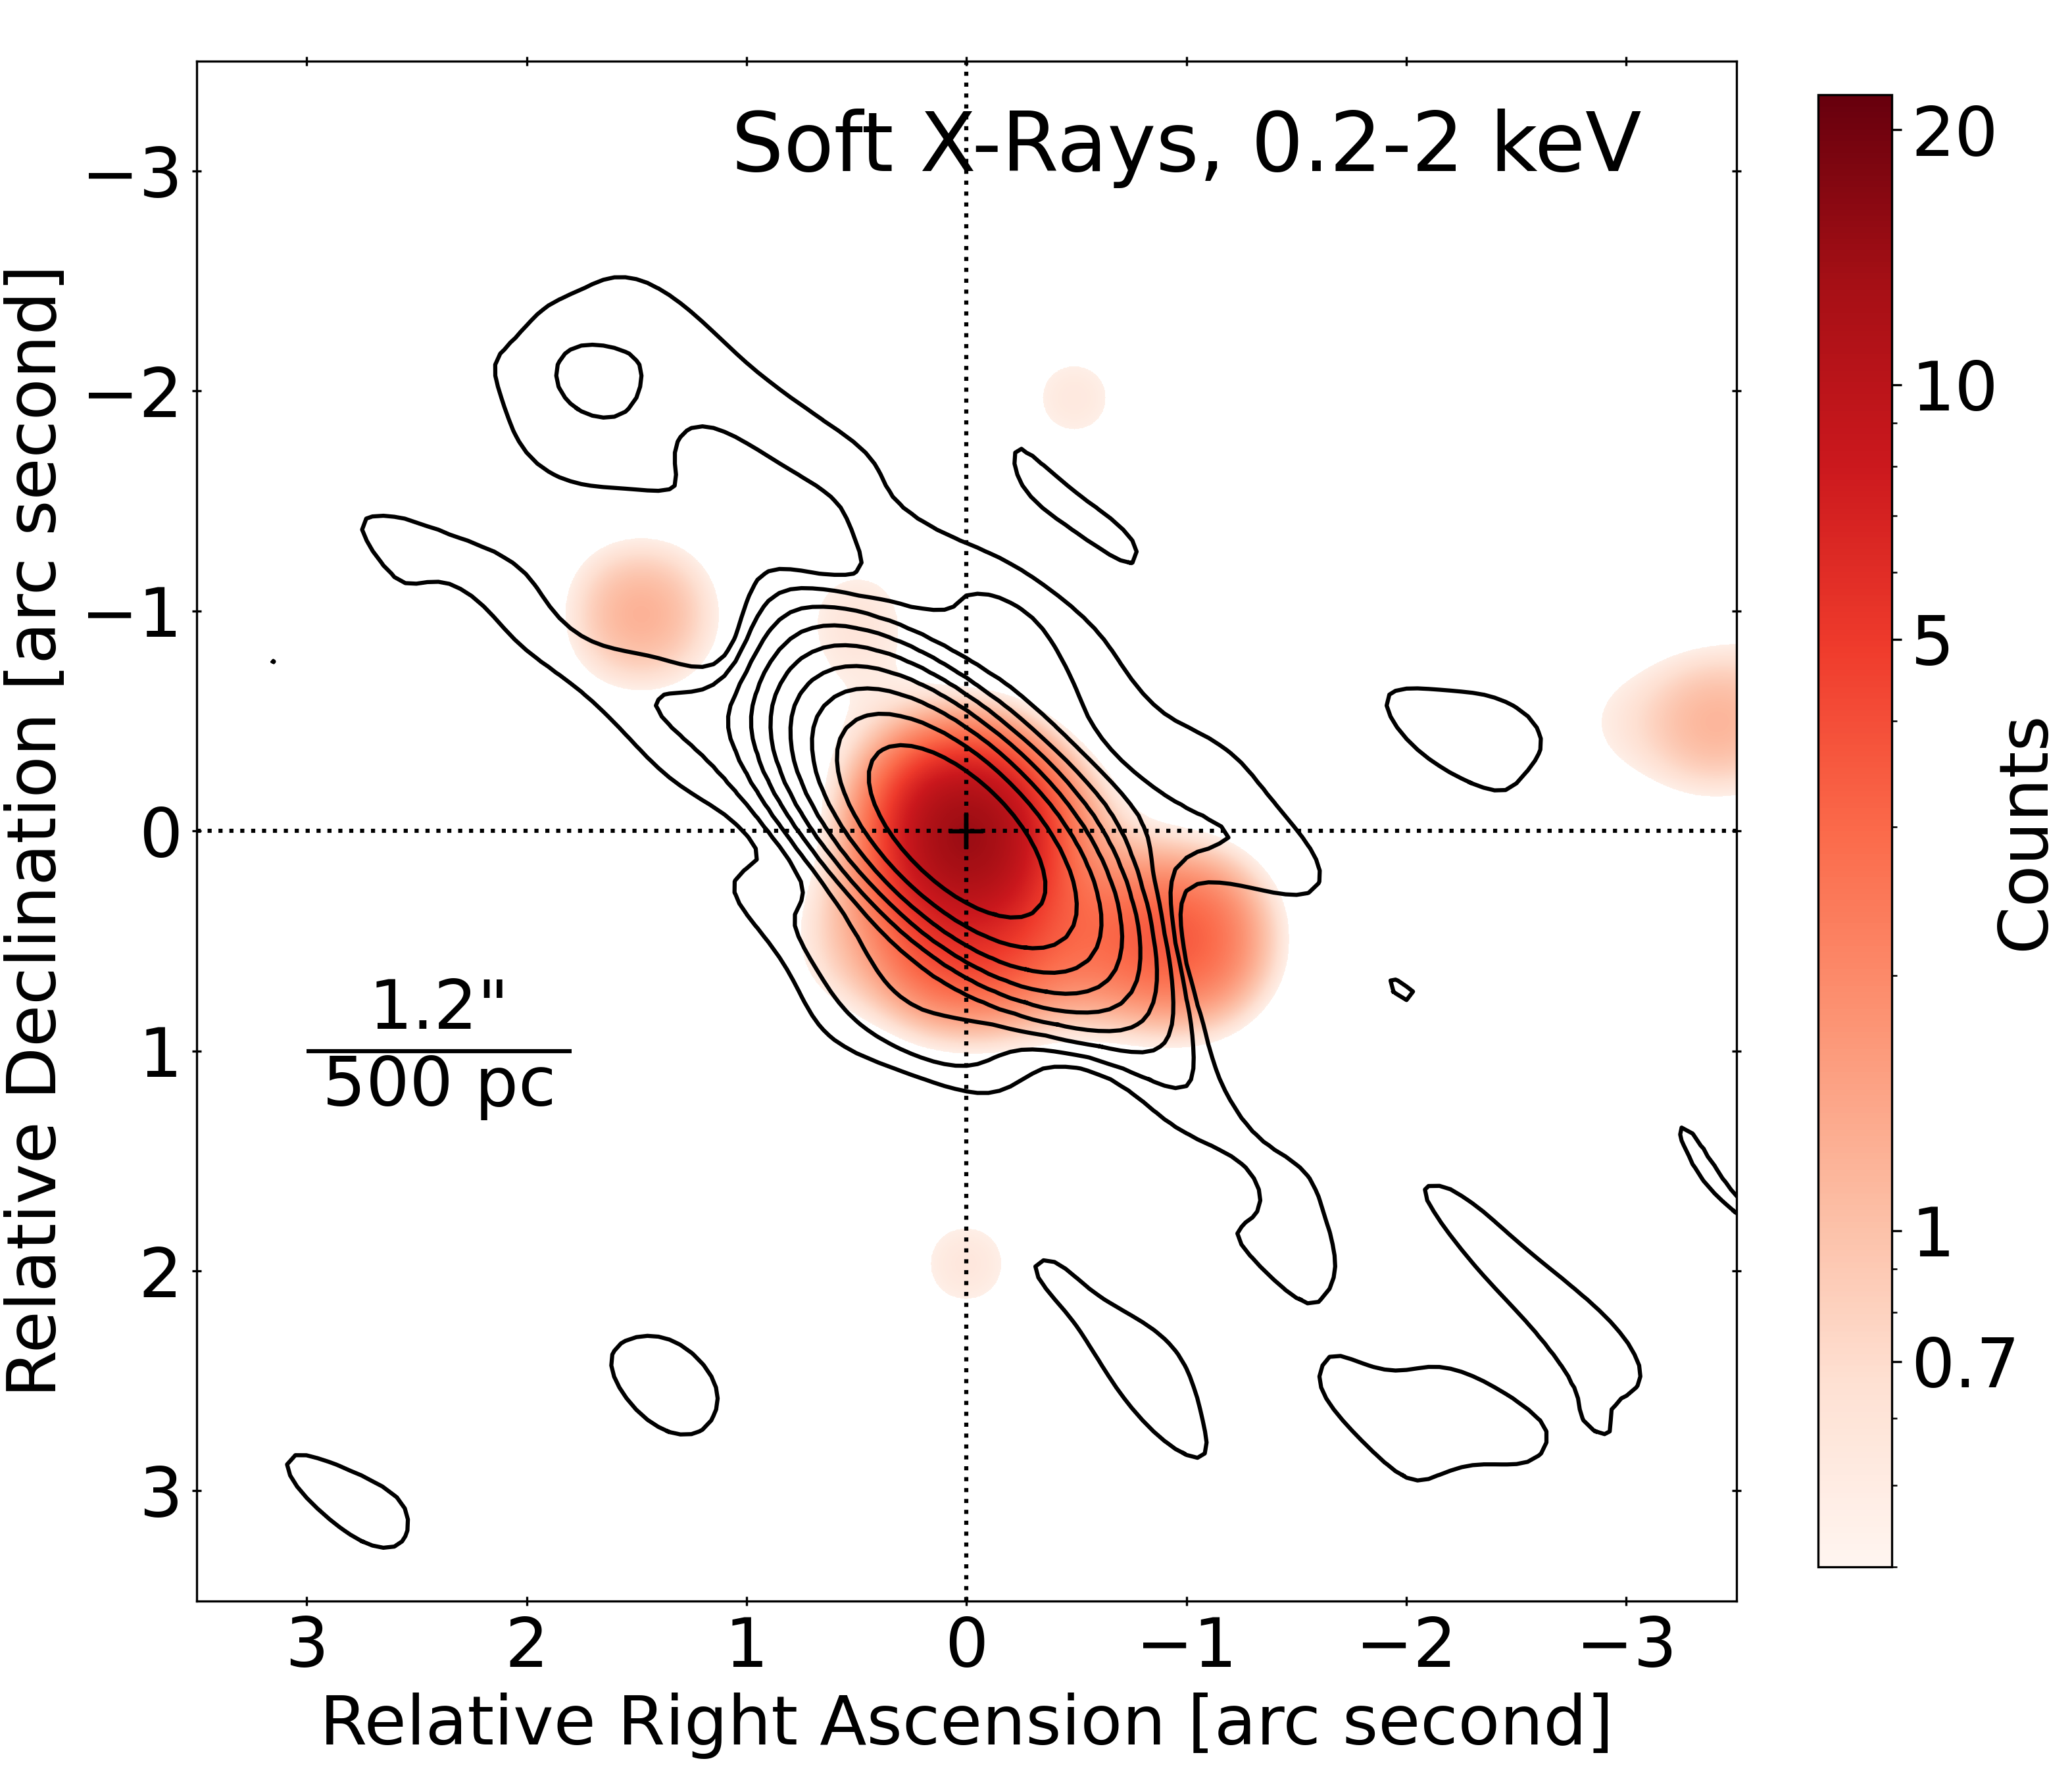
The 2.1 ks image of Mrk 1239 taken with Chandra ACIS-S is presented in Figure 1. The radio contours are taken from Järvelä et al. (2022) and are based on JVLA observations centred at 5.2 GHz with a 2 GHz bandwidth. They give a sense of size and shape of the extended radio emission region.
Most of the soft X-ray emission originates from the very central region of the galaxy, suggesting at least part of it is originating from the AGN. Previous studies have indicated that there is star formation present within the central 400 pc of nucleus of Mrk 1239 (Ruschel-Dutra et al., 2016). This appears comparable to the scale of the extended soft X-ray emission in the Chandra image thus some of the soft emission seen in the central region may be the result of this star formation. There appears to be asymmetry extending to the Southeast quadrant of Mrk 1239. Detailed analysis is limited by the short exposure time, and deeper observations would be needed to determine the exact location of the soft emission.
3.2 Emission Line Search
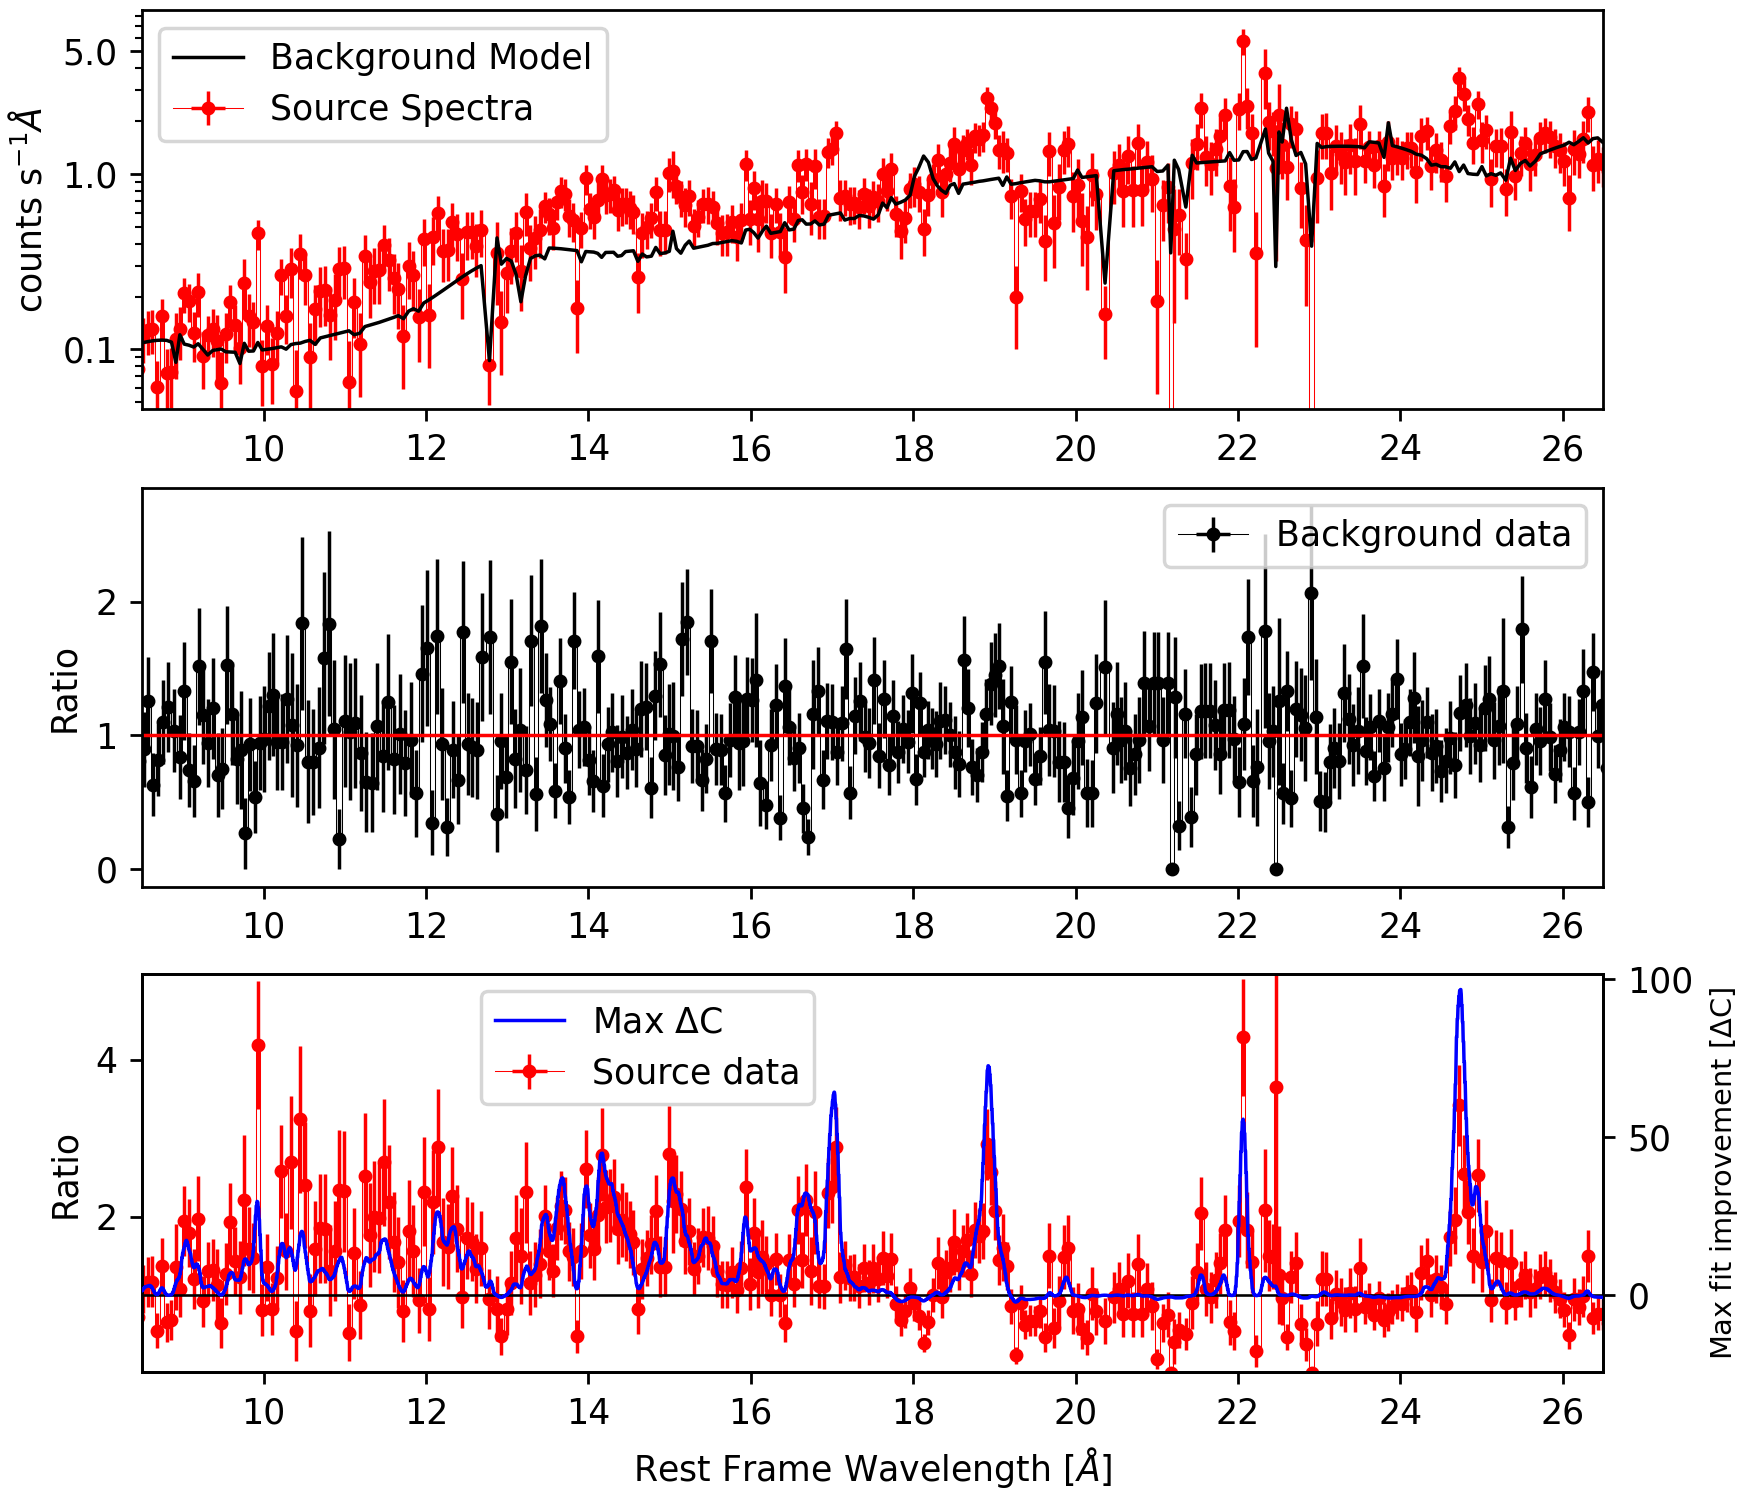
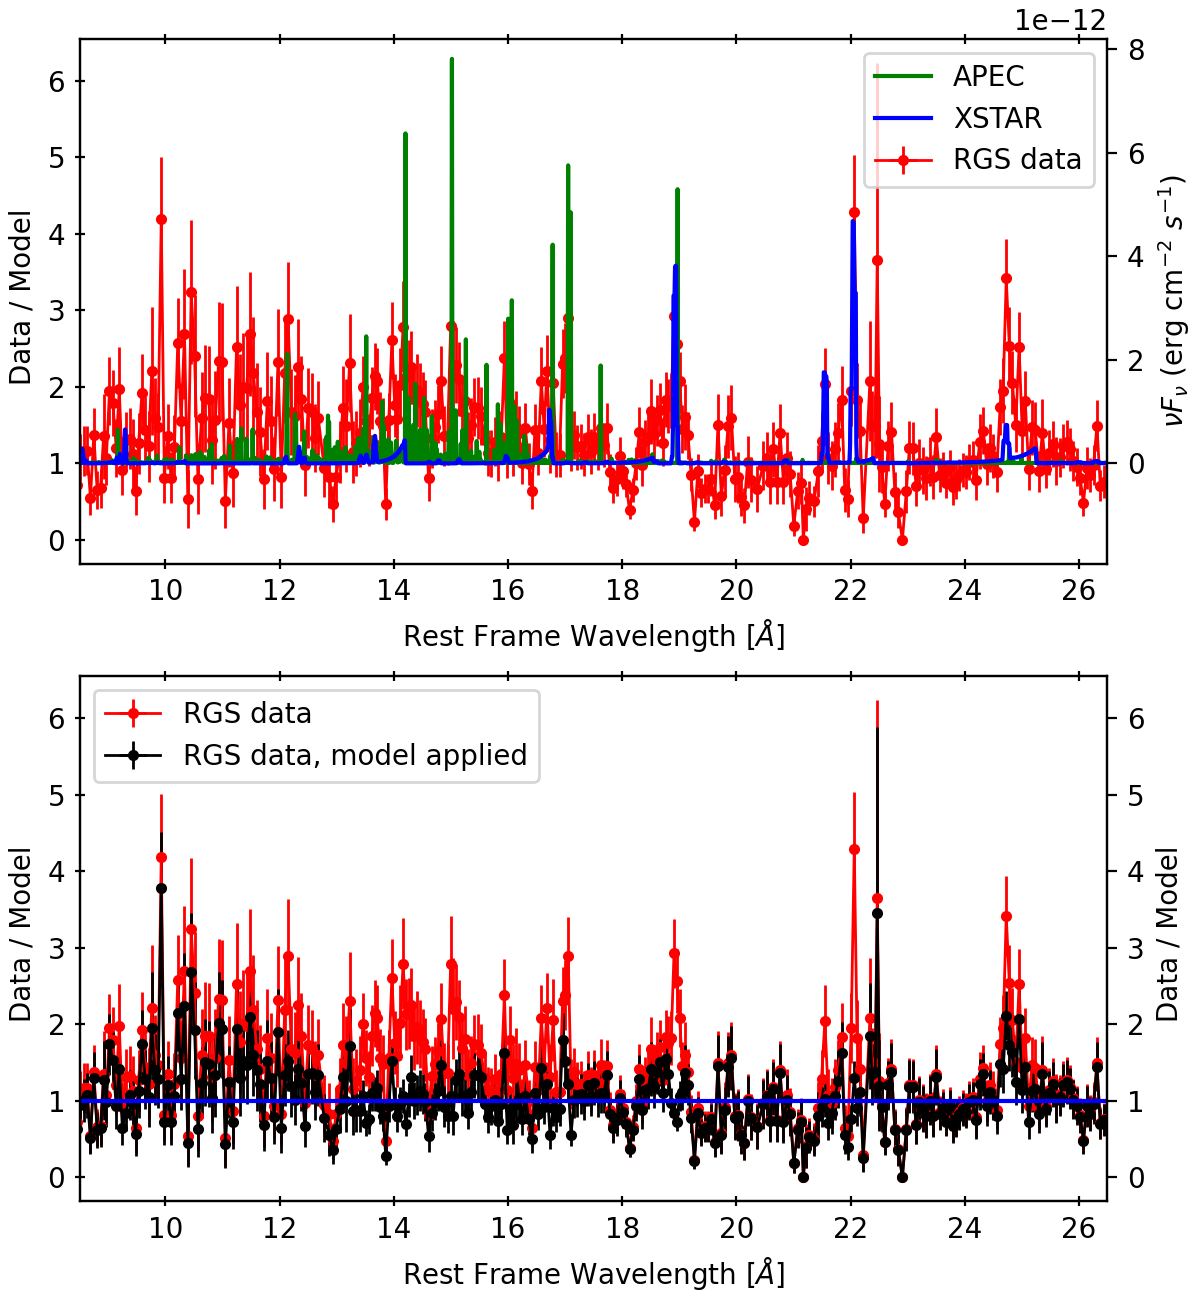
Mrk 1239 is not a particularly bright source, as such we cannot confidently identify the continuum level. Instead, we observe emission lines poking above the background (Figure 2 top panel). Due to the high background level it was imperative to find all regions where the data were significant over the background. This was achieved by modelling the background (see Figure 2 middle panel) and applying the model to the source spectrum.
A Gaussian profile with a width of Å was then applied beginning at 7 Å, The normalization was stepped through twenty values space evenly in log space between and photons/cm2/s using the xspec command steppar. For each normalization step the best fit improvement was recorded. When complete the Gaussian profile was moved 0.005 Å (an order of magnitude finer than the instrument resolution of RGS ) and the process was repeated, covering all wavelengths between 7 and 35 Å. This allowed for the spectra to be oversampled and provide a clear picture of where the source was detected above the background.
The maximum fit improvement was taken at each wavelength regardless of the normalisation required. The maximum fit improvement (Max ) verse wavelength was plotted as a visualization tool to more clearly identify the locations of possible lines. This max fit improvement line can be seen in the bottom panel of Figure 2. Forty-five line candidates were identified, all having a fit improvement of at least .
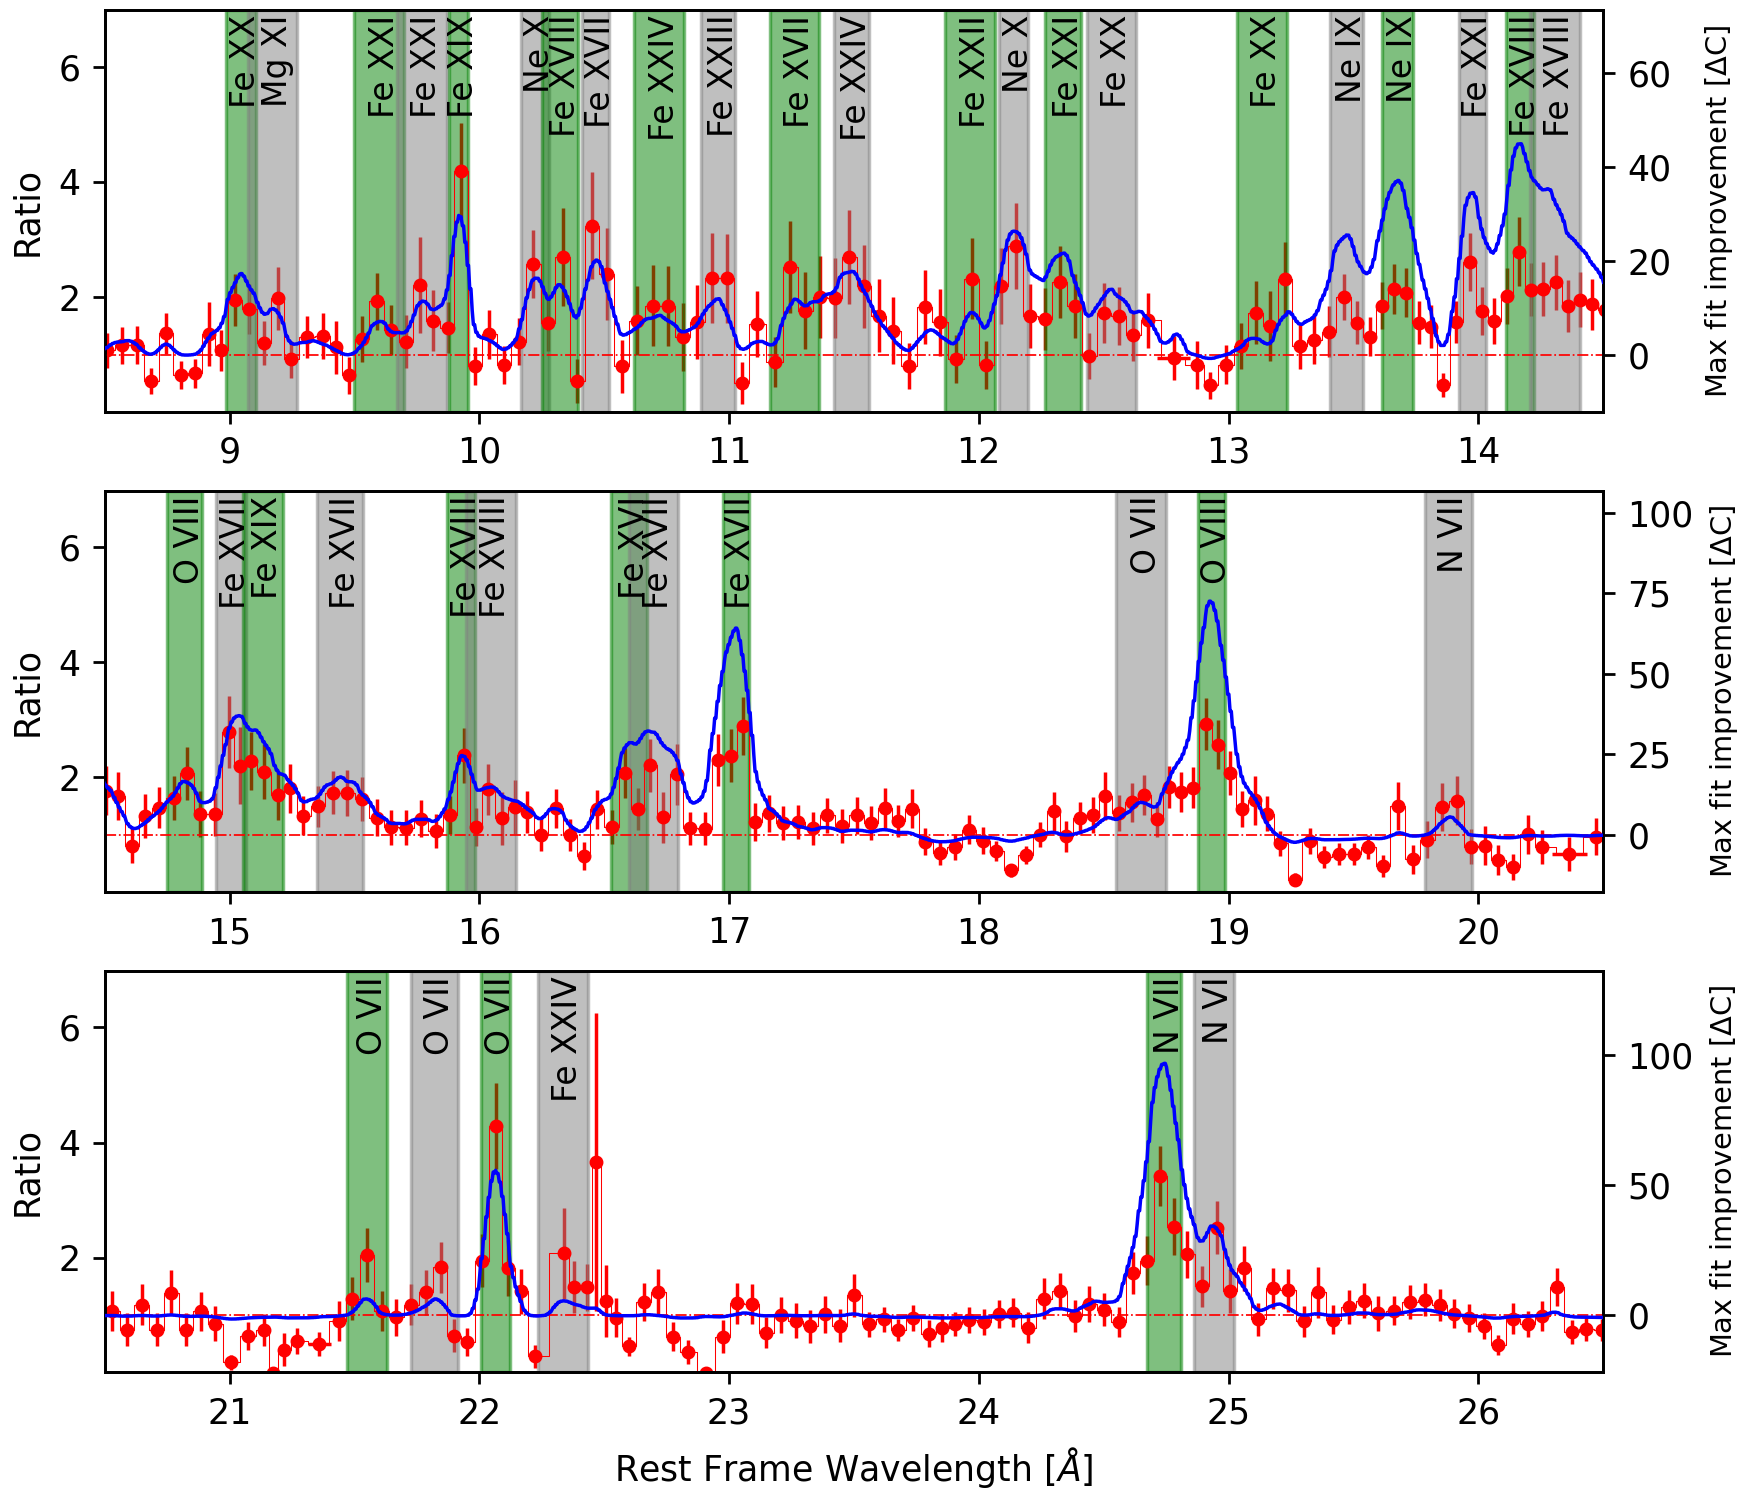
Next a Gaussian profile with a width of Å was applied for each of the 45 line candidates, the normalizations were fit and subsequently frozen. The error on the line energies was then calculated using the xspec error command. The uncertainty in the line energy, plus an outflow correction factor (see Sec. 3.3), was used as the search range up until a maximum search range of 0.1 Å. With the line wavelength and search range imputed in AtomDB, the most probable line candidate was identified.
Forty line candidates were recovered, they are detailed in Table 2, while the data and the search line are shown in Figure 3. No radiative recombination continuum (RRC) features were identified through this process as a continuum was not confidently identified. The search was preformed over the wavelength range Å, however lines were only significantly detected between Å.
| (1) | (2) | (3) | (4) | (5) |
|---|---|---|---|---|
| Observed | Search | Rest | ||
| Ion ID | wavelength | range | wavelength | C |
| [Å] | [Å] | [Å] | ||
| Fe xx | 0.059 | 9.066 | 17 | |
| Mg xi | 0.100 | 9.169 | 10 | |
| Fe xxi | 0.100 | 9.504 | 7 | |
| Fe xxi | 0.100 | 9.819 | 11 | |
| Fe xix | 0.038 | 9.945 | 30 | |
| Ne x | 0.057 | 10.238 | 16 | |
| Fe xviii⋆ | 0.072 | 10.360 | 15 | |
| Fe xvii | 0.053 | 10.504 | 20 | |
| Fe xxiv | 0.100 | 10.663 | 8 | |
| Fe xxiii | 0.069 | 10.981 | 12 | |
| Fe xvii | 0.100 | 11.254 | 12 | |
| Fe xxiv | 0.071 | 11.432 | 18 | |
| Fe xxii | 0.100 | 11.977 | 9 | |
| Ne x () | 0.059 | 12.132 | 26 | |
| Fe xxi | 0.072 | 12.284 | 22 | |
| Fe xx | 0.100 | 12.576 | 14 | |
| Fe xx | 0.100 | 12.864 | 9 | |
| Ne ix () | 0.067 | 13.447 | 25 | |
| Ne ix () | 0.061 | 13.699 | 37 | |
| Fe xxi | 0.053 | 14.008 | 34 | |
| Fe xviii | 0.055 | 14.208 | 45 | |
| Fe xviii | 0.100 | 14.373 | 35 | |
| O viii | 0.070 | 14.821 | 17 | |
| Fe xvii | 0.060 | 15.014 | 37 | |
| Fe xix | 0.081 | 15.079 | 33 | |
| Fe xvii | 0.092 | 15.453 | 18 | |
| Fe xviii | 0.057 | 15.931 | 25 | |
| Fe xviii | 0.100 | 16.071 | 15 | |
| Fe xvi | 0.072 | 16.567 | 29 | |
| Fe xvii | 0.099 | 16.780 | 32 | |
| Fe xvii | 0.052 | 17.051 | 64 | |
| O vii | 0.100 | 18.627 | 5 | |
| O viii () | 0.054 | 18.967 | 73 | |
| N vii | 0.094 | 19.826 | 6 | |
| O vii () | 0.079 | 21.602 | 6 | |
| O vii () | 0.096 | 21.804 | 6 | |
| O vii () | 0.059 | 22.098 | 56 | |
| Fe xxiv | 0.100 | 22.249 | 6 | |
| N vii | 0.067 | 24.779 | 97 | |
| N vii | 0.078 | 24.898 | 34 |
3.3 O vii Outflow velocity
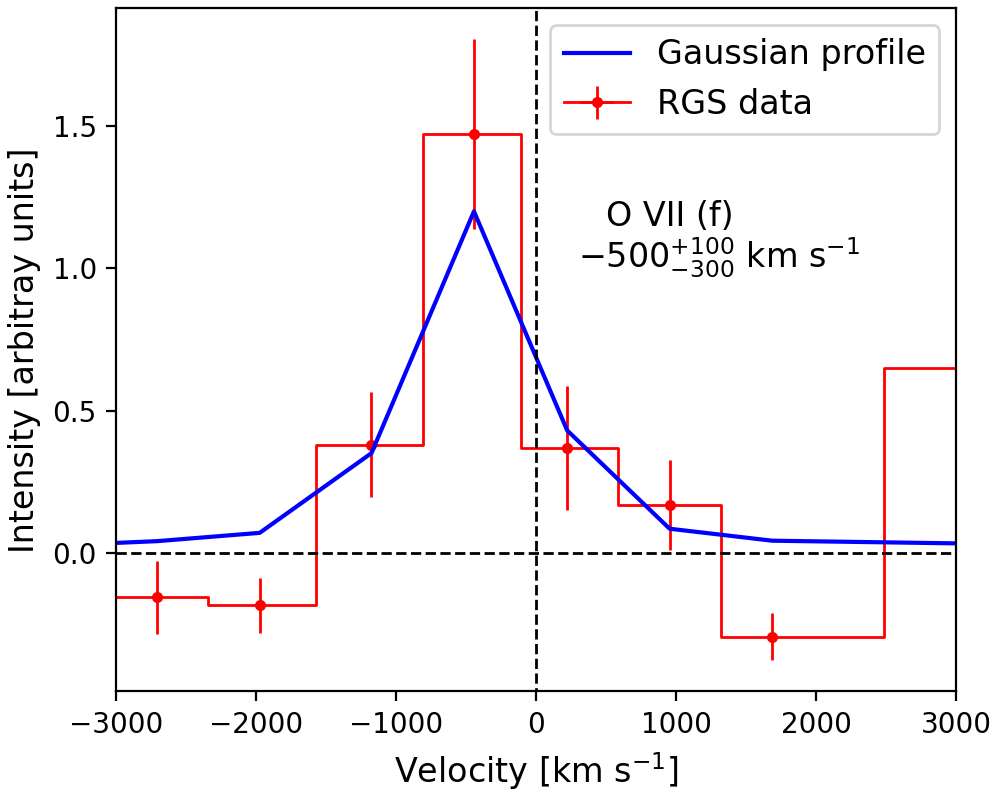
While examining possible line candidates it was found that several emission features exhibited slight blue shifts in their line energy. Figure 4 shows the velocity profile of the forbidden O vii line. This was the strongest isolated line. The rest frame wavelength of this line is Å while the laboratory measurement is 22.098 Å. The resultant outflow velocity is km s-1. The measured velocity is comparable to other outflows in Seyfert galaxies (see NGC 5548 Mao et al. 2018; NGC 4151 Armentrout et al. 2007; NGC 1068 Grafton-Waters et al. 2021). Outflow velocities from other emission lines were not as well constrained. As well, Mrk 1239 does show evidence for an outflow in the [O iii] line of km s-1, located between 10-100 pc of the SMBH (Pan et al., 2021).
3.4 Plasma Diagnostics
He-like ions produce very specific emission features dependant on the density, temperature and processes by which the atoms were ionized. A common method for determining the density and temperature of the emitting plasma is by using the and ratios defined in Equations 1 and 2. For these diagnostics is the forbidden line (), are the inter-combination lines (), and is the resonance line () (Porquet & Dubau, 2000).
| (1) |
| (2) |
For Mrk 1239 only the He-like triplet of O vii is strongly detected. There is some evidence of Mg xi and Ne ix, but the O vii triplet is clearly seen. This may be due to the blend of lines around Mg and Ne originating from other species and the relative lack of other lines around the O vii triplet. For this work both the O vii and Ne ix He-like triplets are explored.
Due to the weak intercombination lines in this spectra it was difficult to ascertain the uncertainties of the and ratios. To overcome this we implemented a model in xspec so that the values and their uncertainties might be directly outputted. This was achieved by re-writing the and ratio such that and could be expressed in terms of , and . To do this the first step is a simple rearrangement of the ratio:
| (3) |
Next the ratio:
| (4) |
Substituting in what we know about from Equation 3;
| (5) |
The subtlety of this method is revealed when we consider how to implement it directly in xspec. The expression would be: , where the subscripts denote the parameter the component represents. The correct normalization for is but the component is multiplied by therefore the normalization must be . Similarly the correct normalization on f is , because the component is already multiplied by we simply link the two components. This leaves , and free to fit the triplet. The added complication here is the outflow we see on O vii(), thus we have an addition component, vmshift, to account for the outflow. The outflow velocities are linked for the , and lines. The and ratio for O vii and Ne ix as well as their outflow velocities are displayed in Table 3.
| (1) | (2) | (3) | (4) | (5) |
|---|---|---|---|---|
| Model Component | Model Parameters | Short name | O vii | Ne ix |
| Resonance Line | Wavelength | 21.602 Å | 13.447 Å | |
| Normalization | ||||
| Intercombination Line | Wavelength | 21.804 Å | 13.553 Å | |
| Normalization | ||||
| Forbidden Line | Wavelength | 22.098 Å | 13.699 Å | |
| Normalization | ||||
| G | ||||
| constant | ||||
| R | ||||
| constant | ||||
| Outflow Velocity | km s-1 | km s-1 | ||
| vmshift |
Comparing the strength of the resonance line to the strength of the Ly line reveals that the ratio of H-like/He-like atoms for both the O vii and Ne ix atoms is of order unity. This allows us to use the G ratio to find a temperature of the order K (Porquet & Dubau, 2000). This estimation is not with out its caveats, as it assumes that the regions where the H-like ions are formed is the same as where the He-like ions are formed which is not necessarily the case according to Porquet & Dubau (2000).
Due to the weak intercombination line in both triplets the R ratio was not well constrained and we can only provide lower limits on it and the density estimations. Comparing the calculated values to the curves produced by Porquet & Dubau (2000) we gain limited information. For O vii, which has , this tells us that the plasma that produced these emission lines has a density less than cm-3. The plasma that produced the Ne ix emission lines has a density less than cm-3. Moreover, the outflow velocity of the O vii triplet is consistent with the velocities reported in Section 3.3. The outflow velocity of the Ne ix triplet agrees with that of the O vii triplet, and it also agrees with being at rest with the galaxy as a whole.
The finial piece of information we can deduce from the He-like ions is from the relative strength of the resonance line. In purely photoionized plasmas the resonance line is weaker compared to the intercombination and forbidden lines. Whereas, in mixed plasmas, containing both photoionized and collisionally ionized emission, the resonance line is relatively strong. If we look at the O vii triplet we see an incredibly strong forbidden line and weak intercombination and resonance lines. Assuming we are in the region where is very sensitive to density (which was allowed by the calculated ratio) than this is indicative to a photoionized plasma.
3.5 Neon Abundance
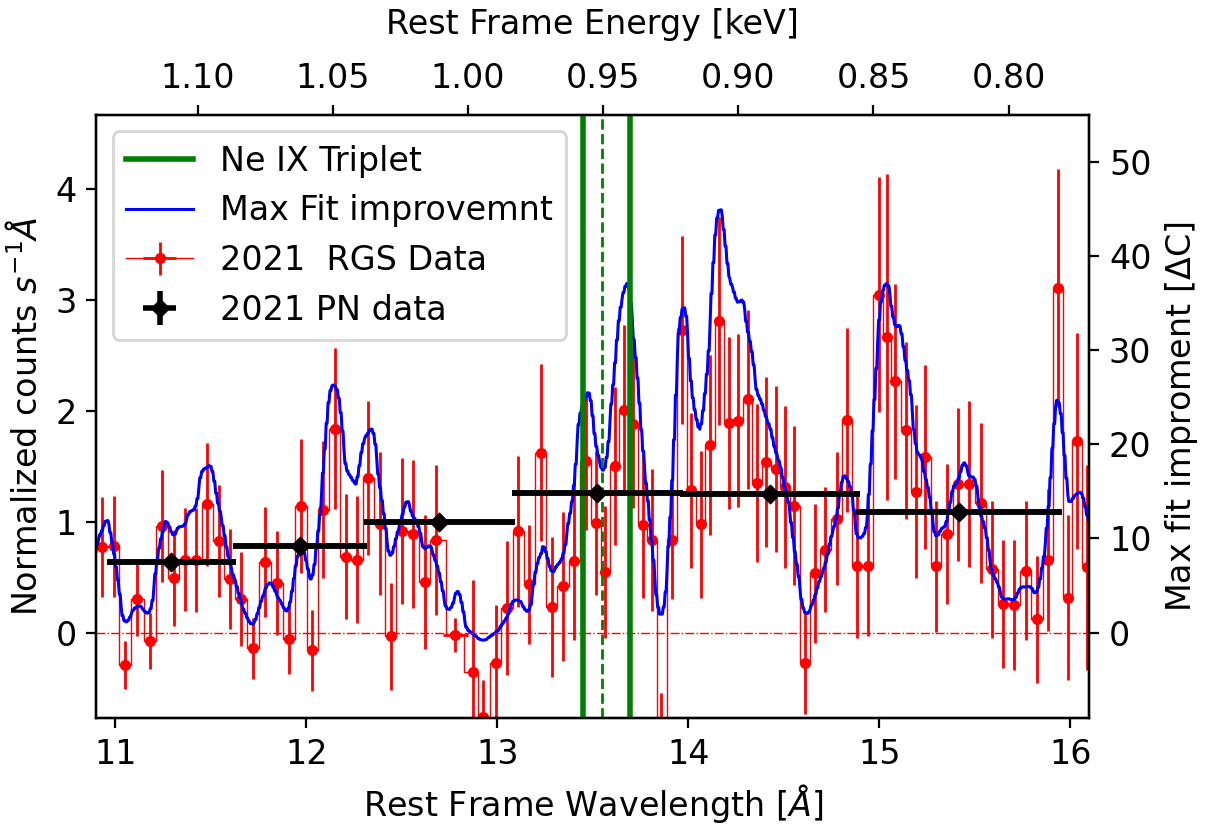
A neon overabundance was proposed in Grupe et al. (2004) to explain a feature they observed at 0.91 in the 5 ks PN data. The feature was attributed to the Ne ix triplet. They did not detect the O vii triplet located at 0.56 keV leading them to conclude that there was an overabundance of Ne in Mrk 1239. Subsequent works have used this overabundance while fitting the X-ray spectra (see Jiang et al. 2021).
The analysis of Buhariwalla et al. (2020) suggested the excess emission at 0.91 keV was in fact due to a blend of emission lines including the Ne ix triplet and Fe-L emission lines. In Figure 5 a comparison between the RGS spectra and the EPIC PN spectra is made. Here we see both the RGS (in red) and PN spectra (in black) compared from Å. Both spectra have been normalized by their mean in this region to ease the comparison.
The red RGS data points show a plethora of emission features while the black PN data show an excess emission between 0.85 and 1 keV, similar to what was seen in the original 2001 observation by Grupe et al. (2004). Even with the deep 2021 PN observation, the Ne ix emission lines remain unresolved. The RGS spectrum is required to resolve the Ne ix triplet and the surrounding features to state that the excess emission seen in this object at 0.91 keV is not due solely to the Ne ix triplet but instead a it is a blend of many emission features in this region.
Furthermore the overabundance described by Grupe et al. (2004) was reliant on the non-detection of the O vii triplet in addition to the enhancement of the Ne ix line by Fe-L emission. In the bottom panel of Figure 3 we can clearly see the O vii present in our RGS spectra. The detection of the O vii triplet and the confirmation that the Ne ix triplet was being enhanced by surrounding emission lines the shows a Ne overabundance is not needed in this source.
4 Spectral Modelling
The RGS data were background modelled in xspec, and C-statistics were used (Cash, 1979) to evaluate the fit quality throughout. Errors were calculated at the 90 % confidence level using the xspec error command. Based on the results of the plasma diagnostics we proceeded with the assumption that there were at least two ionized regions present in the spectra.
We tested collisionally ionized plasma with apec, version 3.0.9, (Smith et al., 2001) and a photoionized plasma using xstar grids, version 2.31 (Kallman & Bautista, 2001). The model mekal (Liedahl et al., 1995) was tested in this analysis as it was what was originally used to model the data in Buhariwalla et al. (2020). Ultimately apec was used as it contains more up to date atomic data, and produced better fit statistics. All fits were absorbed with a Galactic column density of (Willingale et al., 2013).
xstar grids were calculated with a covering fraction of 1, luminosity of and the turbulent velocity was fixed at 300 km s-1. The ionizing continuum was described by a powerlaw with . The column density was logarithmically sampled at five points between and cm-2. The density of the emitting material was logarithmically sampled at six points between and cm-3 The ionization parameter is defined as (Tarter et al., 1969; Kallman & Bautista, 2001) where is the ionizing luminosity, is the density of the material and is the distance between the ionizing source and the emitting material. The log ionization was sampled linearly at 6 points between 1 and 4 erg cm s-1. The column density, ionization and density were all interpolated for a total of a 300 step grid.
Seven subsequent grids were created with density at a fixed value ranging from to cm-3, log was linearly samples at 10 points between 0 and 5, the column density was logarithmically sampled at ten points between and cm-2. All other parameters were kept the same. These were 100 step grids. The and cm-3 grids were tested against the 300 step grid for consistency, they produced the same fit statistic and ionization parameters. All abundances were fixed at solar.
For apec the plasma temperature () and normalization remained free, while the abundances remained fixed at solar. The powerlaw, when included, had free photon index and normalization.
Initially, emission from only one plasma component (apec or xstar) was fitted to the RGS spectrum between Å. With each individual plasma, the addition of a powerlaw component was considered to account for the underlying continuum. Fitting each of these components individually was able to account for select emission lines, but not all the emission features. The fits were for apec and for xstar. The addition of a powerlaw (po) component had fit improvements of for apec+po for two additional free parameters. The addition of the powerlaw to xstar had a drastic fit improvement of for two additional free parameters, but this was due to the poor initial fit of the xstar model xstar+po results in a fit of .
Next two component plasmas were tested where both components were of the same type, this was done to explore the possibility of a single plasma with a gradient of temperature and/or ionization values. This produced slightly better fits than the addition of the powerlaw, with the fit improvement for apec+apec was the single component counterpart, for two additional free parameters. xstar+xstar resulted in a fit improvement of , producing a worse fit than a single component+powerlaw model. Jiang et al. (2021) fit the the soft band of Mrk 1239 with two collisionally ionized components. However their CCD spectra lacked the data quality to distinguish between a collisionally ionized and photoionized component.
4.1 Testing for Two Distinct Plasmas
A mixed plasma was tested such that it contained a collisionally ionized (apec) and a photoionized (xstar) component. This produced a fit of C/dof=1201/811. The apec component produces a better than the mekal component for the same degrees of freedom. The O vii line, which was outflowing with a velocity of km s-1, was produced by the photoionized plasma. Thus we test the xstar+apec models with the photoionized component allowed to outflow. The vmshift xstar + apec model produces a superior fit of C/dof=1156/810, for one additional free parameter. Similar fit improvements were seen in the xstar+xstar and apec+apec fits when one component is allowed to outflow. No significant fit improvement were seen in these fits when both components are allowed to outflow. The best fit model can be found in Figure 6, the best fit parameters can be found in Table 4.
| (1) | (2) | (3) |
|---|---|---|
| Model Component | Model Parameter | Value |
| apec | kT [keV] | |
| Abundance | ||
| Normalization [] | ||
| xstar | Column density [cm-2] | |
| Log Ionization [erg cm s-1] | ||
| Density [cm-3] | ||
| Redshift | ||
| Normalization [] | ||
| vmshift | Velocity [km/s] |
We can see that the photoionized material is outflowing with a velocity of km s-1 which is consistent with the outflow velocity that we saw with O vii() emission line. The density of the emitting material is cm-3, which is consistent with the density estimation found using the O vii ratio. The temperature of the emitting plasma is consistent with the temperature found in Buhariwalla et al. (2020), despite the difference in model component (apec vs mekal) and the difference in instrument (RGS vs MOS). There appears to be an excess of emission below 12 Å and the Å feature attributed to Nvii appears under fit.
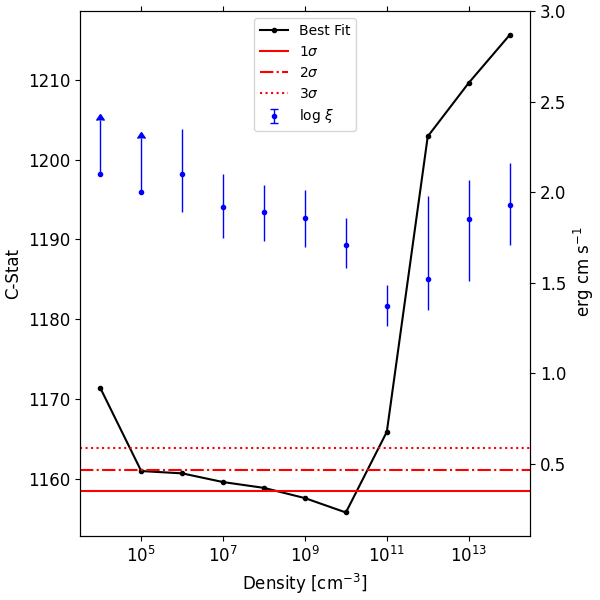
The best fit two component plasma gave an upper limit on density of less than cm-3, the xstar grid that gave this result was limited to densities above cm-3. Thus the lower limit of density was estimated using previously made grids with the same parameters. Figure 7 (left axis) shows the C-stat as a function of density, the minimum C-stat is 1156, given by the best fit model. 1, 2, and 3 lines are drawn to show the allowed density of the photoionized plasma. The allowed density is then between cm-3. Ionization as a function of density (Figure 7 right axis) will be discussed in section 5.1.
xtar grids with ionizing continuum described by a powerlaw with and were generated to test the effects of the continuum shape on the spectral appearance. They produced similar fit statistics as the best fit model, with . The measured properties of the xtar and apec components were consistent, within error, to those quoted in Table 4. This led us to conclude that the shape of the continuum has a minimal effect on the properties of the photoionized emitter. This does not seem unreasonable in Mrk 1239 due to the modest data quality and small number of emission lines fit by the xstar component.
xstar grids with variable abundances were generated to explore the possibility of an overabundance in Mrk 1239. To ease computational time the density was fixed at cm-3 and column density was fixed at cm-2. All other parameters remained the same. Grids with variable Ne, O, Fe, and N were generated. Variable Ne and Fe had no affect on the fit of the RGS spectrum. Variable O and N produced best fit models with super solar ratios of N/O. The best fit grid produced a relative abundance of , with a . After investigation it was found that the driving mechanism for this super solar abundance is the 25 Å Nvii feature that was under fit in Figure 6. When the variable N grids are fit to the data below 25 Å no overabundance or fit improvement is found. However when the data above 25 Å was included the overabundance is present. Mao et al. (2019) showed that the relative N/O abundance could be super-solar in the ICM due to enrichment from low and intermediate mass stars. Their measured N/O agree with the value found here. However it is not immediately clear if this enrichment effect could also be present in the photoionized material of Mrk 1239, or if some other processes is driving the excess emission at 25 Å.
The model under fits the data below 12 Å, and no combination of collisionally or photoionized plasma could sufficiently fit the data in this region. This excess emission is also seen in the PN spectrum from this observation (Buhariwalla et al. in prep.) indicating that the excess emission is probably not from statistical fluctuations. Instead it may be that the AGN continuum in Mrk 1239 is becoming visible at wavelengths less then 12 Å (energies greater than 1 keV). The RGS data are insufficient to make any inferences about the continuum. Thus this feature will be followed up in the future work on Mrk 1239 and its broadband spectra.
5 Discussion
5.1 The Origin of the Photoionized Plasma
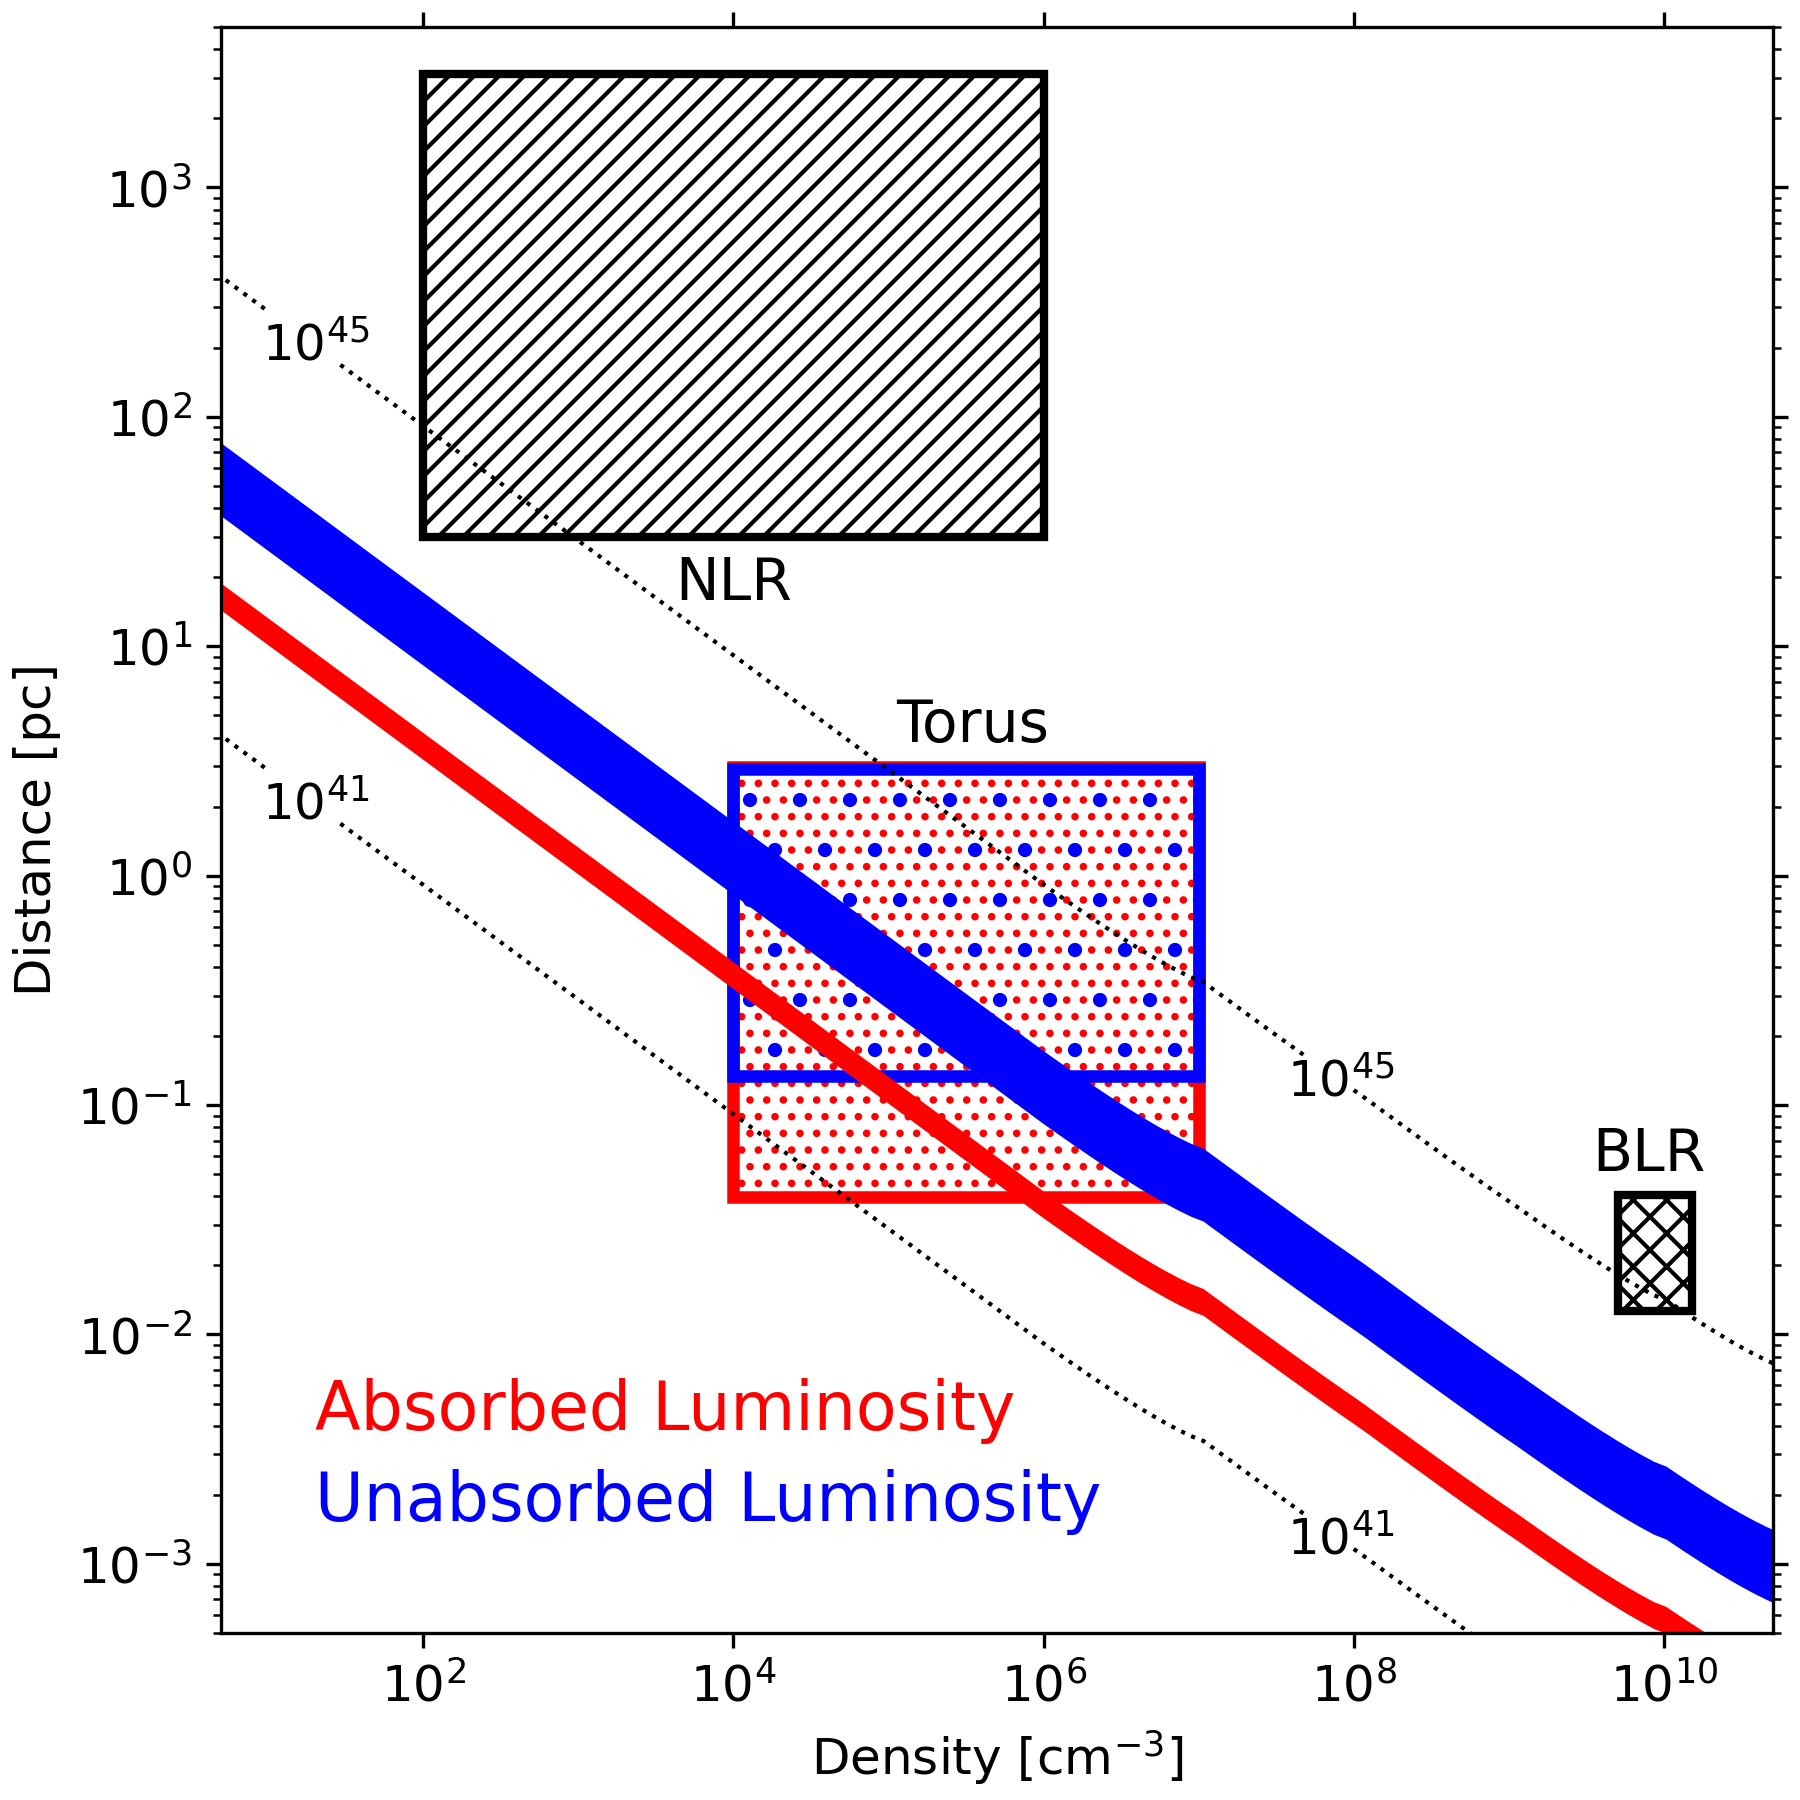
To explore the origin of the photoionized emitter we examined properties that could result in the measured ionization parameter. Recall the definition of the ionization parameter (see Sec. 4). This can be rearranged as , allowing us to plot distance as a function of density. The ionization parameter () is degenerate with the density of the emitting material. This degeneracy is mitigated with the use of multiple xstar grids generated at different plasma densities. The right panel (right axis) of Figure 8 shows as a function of density.
The ionizing luminosity () was estimated using the models in Buhariwalla et al. (2020), however due to the uncertainty in the location of the emission material it is undetermined if the photoionized emitter sees the absorbed or unabsorbed luminosity, thus both luminosities are tested. Although the shape of the ionizing continuum would change between the absorbed and unabsorbed scenarios we showed in Section 4 where dramatic changes in the continuum have a minimal effect on the properties of the photoionized emitter. Thus for this exercise both luminosities can be used to estimate the properties of the photoionized emitter. We caution that the solution for the unabsorbed luminosity is to be taken as approximate, as we did not re-run the models using the absorbed continuum to illuminate the emitting gas at all densities. A single xstar grid with density cm-3 was constructed using an absorbed ionizing continuum based on the absorbed continuum from Buhariwalla et al. (2020). It produced an ionization parameter greater than the unabsorbed scenario, however the difference was small on the distance-density plot. It resulted in a slight shift downward of the allowed regions for the absorbed luminosity.
The blue band in Figure 8 (left panel) shows where allowed combinations of distance and density lie for an unabsorbed source. The red band shows the same for an absorbed source. The variable has some influence on the plot, causing a small wave-like effect on the bands in Figure 8. To illustrate what kind of material would be able to produce these emission lines density and distance combinations of known AGN components are drawn in this plane.
The outer radius of the NLR was estimated using a relationship derived for a sample of quasars and Seyfert galaxies (Bennert et al., 2002). The value of kpc is consistent with the radius of the extended NLR in Mrk 1239 found by Husemann et al. (2022). We take the inner radius of the NLR to be 30 pc, obtained from multi-density photoionization modelling of the NLR of Seyfert galaxies that reproduces a large range of NLR emission line intensities (Komossa & Schulz, 1997). This is consistent with a sample of Seyfert 2s and intermediate Seyfert ( Sy1.5) galaxies (Vaona et al., 2012), and estimates using a second relationship for the effective radius of the NLR in Seyfert galaxies given by Schmitt et al. (2003). For Mrk 1239, comparable values of L are given by Rafanelli & Bonoli (1984) and Malkan et al. (2017). The density is estimated measurements of intermediate Seyfert, and Seyfert 2 galaxies (Bennert et al., 2006; Vaona et al., 2012). We note that the density and inner radius of the NLR may extend to lower values, but this provides a good order-of-magnitude estimate for our work.
The BLR size was estimated using R (Kaspi et al., 2005), with for Mrk 1239 taken from Grupe et al. (2004) and Pan et al. (2021). The density of the BLR is given by Netzer (2013); Arav et al. (1998).
The outer radius of the torus in Mrk 1239 is measured to be 3 pc based on 12 observations (Tristram & Schartmann, 2011). The inner torus radius (0.1-0.01 pc) is estimated by the dust sublimation radius with the luminosity estimated using models from Buhariwalla et al. (2020). The density of the torus is taken from Netzer (2013).
With all these components placed in the density - distance plane we begin to see what kind on material is producing the photoionized emission in Mrk 1239. A tours like structure produces the correct density - distance combination in both the absorbed and unabsorbed scenario. As discussed in section 4.1 the allowed density is between cm-3, which agrees with a tours like structure again. The farthest allowed emitting region would be dependant on the lowest allowed density () and it would be at most a few pc, around the measured outer edge of the torus in Mrk 1239 (Tristram & Schartmann, 2011).
If we analyses the full width half max (FWHM) of the O vii () line we fine that FWHM <520 km s-1. The Keplerian velocity of an object orbiting around the SMBH at the inner radius of the torus is 500 km s-1. We can then conclude that the photoionized emitting material cannot be located any closer than the inner radius of the torus.
In summary, the RGS data have greatly increased our knowledge of the photoionized plasma in Mrk 1239, allowing us to determine its ionization, density and location. We now know that the material exists within several parsec of the central engine. Previous to these results it was not abundantly clear that there were emission line features in Mrk 1239, let alone to the extent detected here. However, several questions about the physical descriptions of the few parsec surrounding the central engine of Mrk 1239 remain. Namely, is this photoionized material related to the absorbing material we know is present in this source? Modelling the broadband X-ray continuum of Mrk 1239 requires heavy absorption from neutral and warm absorbers (Buhariwalla et al., 2020). It is easy to image that a large cloud could be illuminated by the central engine obscuring our line of sight to the central engine, while other regions of the cloud are photoionized, producing the photoionized spectra we see here.
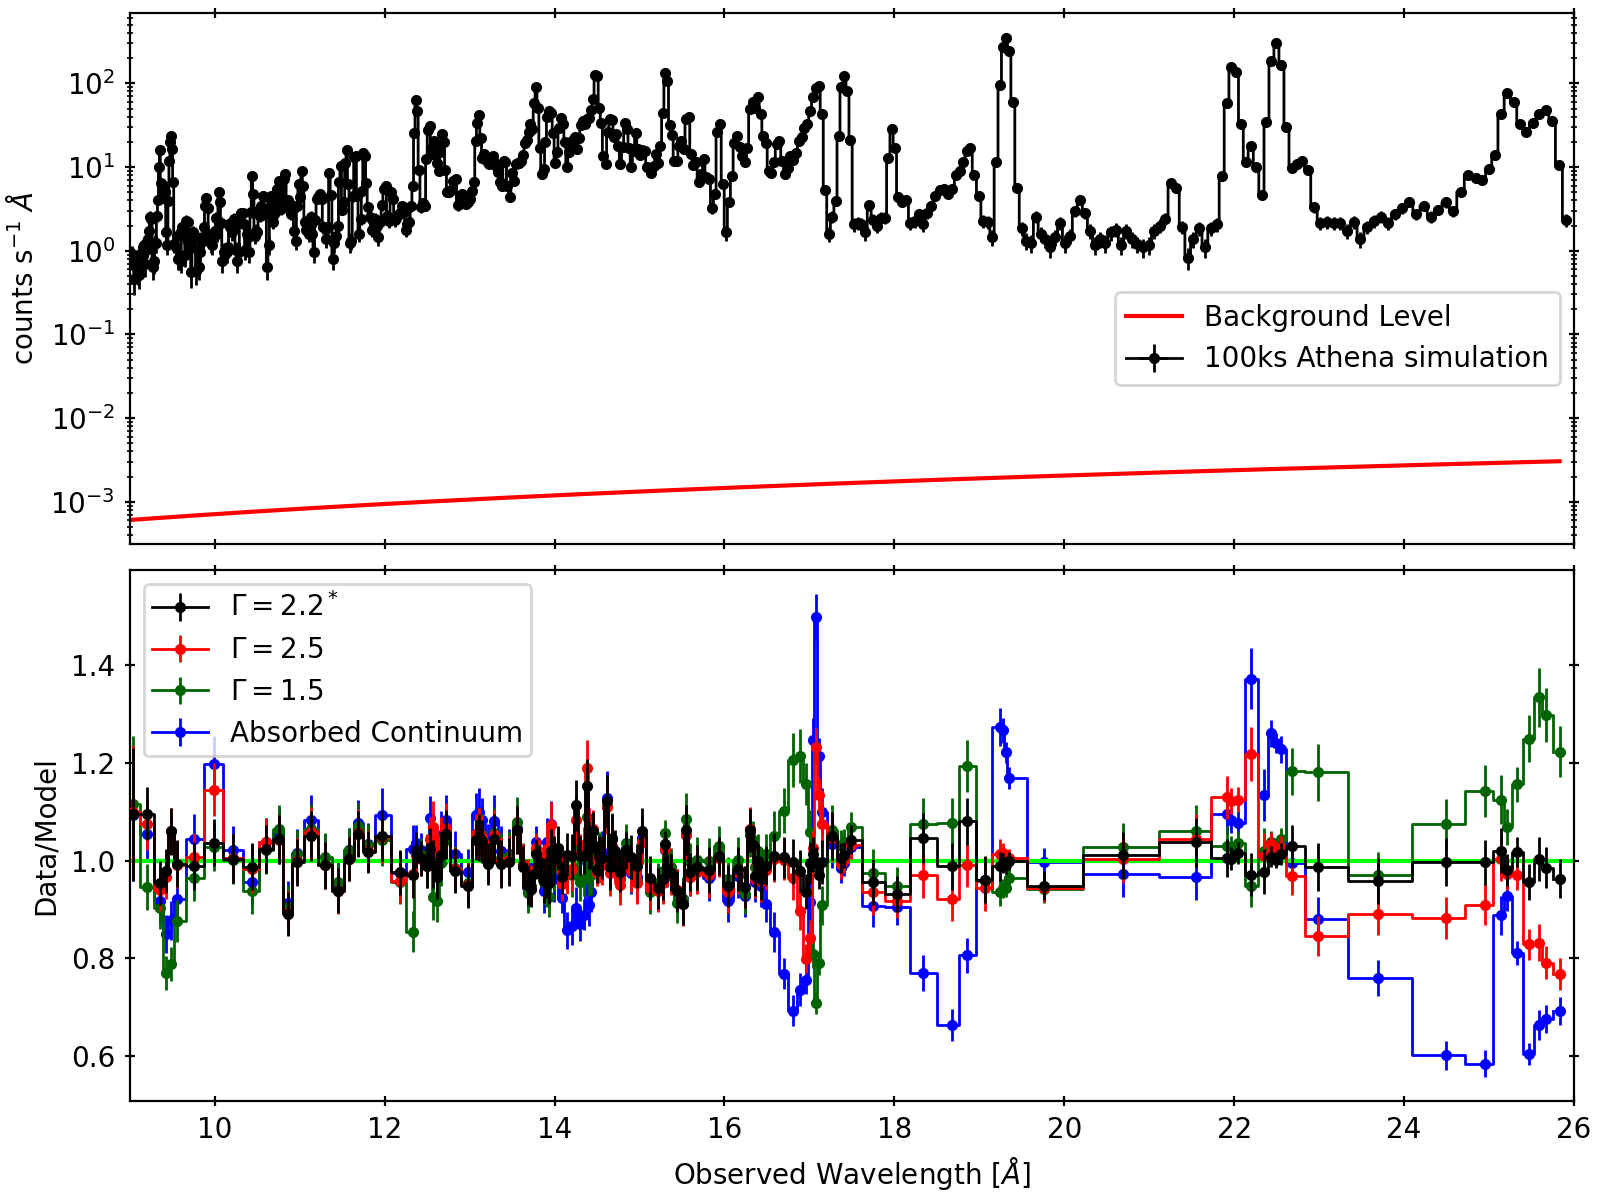
Broadband analysis will shed some light onto the physical description of this region. For future X-ray telescope missions this exercise may be trivial. The top panel of Figure 9 shows a simulated Athena-XIFU333XIFU response files used were XIFU_CC_BASELINECONF_2018_10_10, retrieved from http://x-ifu-resources.irap.omp.eu/PUBLIC/RESPONSES/CC_CONFIGURATION/ 100 ks observation (Barret et al., 2022), using the best fit xstar+apec model. Note that unlike with RGS, the XIFU spectrum is several orders of magnitude above the expected background. Most notably, XIFU data will distinguish between different ionizing continuum for the photoionized xstar grids. The data were simulated with an ionizing continuum of , equivalent to the continuum used for the majority of this work. The four grids fit to the XIFU data were ionized with: ; ; ; and an empirical continuum based on the best fit absorbed continuum given by Buhariwalla et al. (2020). The value between the best fit grid and the , , and absorbed continuum were , and , respectively. Thus with XIFU we easily place restrictions on the ionizing continuum for the photoionized material. This is not even taking into account that XIFU will have high resolution spectroscopy up to 10 keV allowing for direct testing of the link between the absorber and the photoionized emitter.
5.2 The Collisional Plasma in Mrk 1239
When testing spectral models no combination of photoionized emitters could fit the Å region well. Only the apec and mekal models could adequately fit the data in this region. Figure 6 shows that this is the region of the RGS spectra that is dominated by the apec component. The luminosity of each component was calculated using the XSPEC command clumin. The apec component had a luminosity of , the xstar had . The brightness of each feature was approximately equal.
Emission from Fe xvii at 16.777 Å (3F), 17.050 Å (3G), and 17.097 Å (M2) are commonly seen in collisionally ionized plasma. The 3G and M2 lines are blended due to instrument resolution. They are often labelled (17.076 Å) as they appear as one emission line feature at that wavelength. The O vii RRC is found at 16.769 Å which blends with the 3F line much the same way 3G and M2 blend ((16.777 Å)). Phillips et al. (1997) measured the ratios of 3G/3F and M2/3F lines in the spectrum of the solar corona. Using their data the average value of ratio (3F)/(3G + M2) was calculated to be . This suggests that if the ratio of (16.777 Å)/(17.076 Å) is measured to be above 1 then than 50% of the flux in the (16.777 Å) feature is contributed by the O vii RRC component.
Bianchi et al. (2010) found that the apec model produced a ratio of at varying plasma temperatures. They then measured the (16.777 Å)/(17.076 Å) ratio in Mrk 573 to be , concluding that the O vii RRC feature was contaminated by the 3F emission line. Similarly Marinucci et al. (2011) measured the ratio in NGC 424 to be , and stated that the RRC component dominated over the Fe xvii lines. In Mrk 1239, the ratio is measured at indicating that both the Fe xvii emission and O vii RRC are contributing to (16.777 Å).
Guainazzi & Bianchi (2007) studied obscured AGN (Sy 1.5 or greater) and found 16 of the 69 objects they investigated showed evidence of the O vii RRC feature. They took a ratio of 0.6 to indicate the RRC feature was dominate of the 3F emission line. Of those 16 galaxies, 15 had a ratio >0.6, and 13 were >1.2. Mrk 1239 () fits in the lower end of obscured AGN distribution and would be classified as having a dominate O vii RRC feature over the 3F line by Guainazzi & Bianchi (2007).
When the best-fit xstar model was applied to the data without the apec component and the (3F)/(3G +M2) ratio was measure it resulted in a value <0.5. This indicated that the photoionized emission was accounting for the O vii RRC feature and the remaining flux in this region was due to Fe xvii emission from collisionally ionized material.
Collisionally ionized emitters have been used to model the X-ray spectra of star forming regions in galaxies. Franceschini et al. (2003) approximated the SFR from the in ULIRGs without dominant AGN components. It is given by:
| (6) |
Using just the apec component allows us to estimate the non-AGN contribution of the 2-10 keV luminosity. We measure the apec contribution to be , resulting in a SFR of 3 . This is consistent with previous measurements SFR in Mrk 1239 such as X-ray measurements (; Buhariwalla et al., 2020), PAH measurements (; Ruschel-Dutra et al., 2016), SED fitting (; Gruppioni et al., 2016), and IR measurements (; Smirnova-Pinchukova et al., 2022) . In the sample by Ruschel-Dutra et al. (2016), the luminosity from the collisionally ionized component matched those galaxies whose X-ray spectra were dominated by starburst component rather than those dominated by AGN.
5.3 Mrk 1239 Compared to Seyfert Galaxies
In a sample of 21 bright ROSAT selected AGN viewed with XMM-Newton-EPIC, only 2 of the galaxies studied preferred a soft excess with a line emitting region over a smooth blackbody (Gallo et al., 2006). The sample included 19 Seyfert galaxies (from Seyfert 1s to Seyfert 1.9s) and 2 LINERs and it was the two LINERs that required the CI component (mekal).
The RGS spectrum of Seyfert 1 galaxies is typically dominated by features from photoionized plasma. This primarily includes emission from He-like ion triplets (e.g. O vii, Ne ix, N vi) and RRC features (O viii, Ne ix, C vi). NGC 5548 is among the first Seyfert galaxies studied (Seyfert, 1943), it possesses narrow and broad emission features in both the optical and X-ray bands (Cappi et al., 2016; Whewell et al., 2015). The RGS spectra of this object shows RRC features from Ne ix, O vii, O viii, C v, and C vi. In addition the spectra show a strong O vii line compared to the and lines. This galaxy shows strong evidence of several photoionized emitters and no evidence of any collisionally ionized material (Mao et al., 2018).
NGC 4151 is another well known Seyfert 1.5 galaxy. It shows many of the same features that NGC 5548 does including RRC and He-like triplets. The and ratios straddle the boarder between photoionized and collisional ionized plasma. However, the strength and shape of the RRC features in this galaxy point to a purely photoionized plasma (Armentrout et al., 2007).
The NLS1, Mrk 335 has been extensively studied with XMM-Newton. While early RGS spectra with low signal-to-noise supported a CI plasma (Grupe et al., 2008), theses were not confirmed in later works (e.g. Longinotti et al. 2013, 2019). Parker et al. (2019) examined the low continuum flux state when the emission lines were strongest and attributed them to photoionized emission.
Mrk 1239 shows strong evidence of collisionally ionized plasma, putting it at odds with the many of Seyfert 1 observations that favour photoionized emission. In Mrk 1239 the measured ratio of the forbidden O vii line to the O viii Lyα emission line is as is expected for an obscured AGN (Sy 1.5 or greater) compared to the lower ratio for starburst galaxy (Guainazzi & Bianchi, 2007).
NGC 1068 is a prototypical Seyfert 2 galaxy, and it shows a myriad of emission features stemming from multiple photoionized components. Based on visual inspection this galaxy has a spectrum that looks similar to Mrk 1239. The He-like triplets in NGC 1068 have similar appearances, with the Ne ix triplet showing equally strong and lines and no line matching Mrk 1239 completely (Grafton-Waters et al., 2021). However the Ne ix triplet is not as blended with other lines in NGC 1068 as in Mrk 1239.
Original analysis of NGC 1068 showed that the maximum strength of a collisionally ionized plasma would be an order of magnitude less than the photoionized plasma (Kinkhabwala et al., 2002). However, the photoionization models used to describe the RGS spectrum failed to properly account for Fe xvii at 15 Å and 17 Å, thus Grafton-Waters et al. (2021) used a collisionally ionized component to model these lines. They stressed that this was most likely not caused by starburst activity. Instead it may be due to incomplete photoexcitation information in spex, causing pion to under predict emission in these lines. As for Mrk 1239 this does not seem to be the case as no matter the number of photoionized components applied (in addition to powerlaw components) the spectra is still under fit between Å without the addition of apec.
Mrk 1239 is a polar scattered Seyfert 1 galaxy, meaning our line of sight (LOS) passes through the upper layers of the torus polarizing the optical emission (Smith et al., 2004; Jiang et al., 2021). ESO 323-G77, another polar scattered Seyfert1, presents an X-ray spectra similar to Mrk 1239. This object shows high levels of variable absorption, that leave the soft band remarkably consistent below 1.5 keV (Mrk 1239 is consistent below 3 keV) and the harder bands show typical Seyfert variability (the same in Mrk 1239). In the soft band of ESO 323-G77 excess emission is seen at 0.9 keV, and can be modelled using a collisionally ionized plasma. This plasma has been interpreted as a region of star formation activity, and a SFR can be extracted in much the same way as is done here in Mrk 1239 (Miniutti et al., 2014).
ESO 323-G77 has been interpreted to be obscured by a clumpy torus, BLR clouds and a warm outflowing medium (Miniutti et al., 2014). The soft X-ray band of this object has been modelled using two apec components, one with similar temperature to Mrk 1239 ( keV) , the other much cooler, keV. This is a difference in the modelling of these two objects, as the cool apec component in ESO 323-G77 takes the place of a photoionized emitter. This cool apec component fits a slight excess emission around keV, however it could be argued that the this excess emission could be originating from photoionized plasma (O vii triplet/N vii emission lines), but the CCD spectra lacks the resolution to distinguish between the components. Mrk 1239 could have a geometry similar to this object where the LOS is through the torus, creating a polarized BLR and absorbing the X-ray continuum, allowing for distant star forming regions to be visible in the soft X-ray band. ESO 323-G77 may exhibit a similar RGS spectrum as we have seen here in Mrk 1239.
If the soft X-ray band is Mrk 1239 is obscured in a similar manor as it is in ESO 323-G77, then an interesting avenue for analysis would be to investigate the connections with the photoionized emitter producing the O vii triplet and the obscuring torus. Both sources would benefit from much deeper observations to explore this connection.
6 Conclusions
In this work we present the first deep RGS spectrum of Mrk 1239, it shows a myriad of ionized emission lines originating from a blend of photoionized and collisionally ionized plasma. The collisionally ionized plasma dominates the RGS spectra below 17 Å, while the photoionized plasma dominates above 17 Å. The O vii triplet is detected for the very first time in this source. Our main conclusions are as follows:
-
i.
Based on a strong 0.91 keV feature interpreted as Ne ix triplet and the lack of O vii triplet, Grupe et al. (2004) concluded that there was a super solar abundance of Ne/O. We show that the Ne ix triplet is enhanced in a CCD spectra by Fe-L transitions, as proposed by Buhariwalla et al. (2020), and that the O vii triplet is present. All fits done in this work use a solar abundance of Ne/O, allowing us to conclude that Mrk 1239 does not have an over abundance of Ne.
-
ii.
Based on the line ratios of the O vii triplet and the variable density xstar grids, we can infer that the density of the photoionized material is between . Using the definition of ionization and luminosities estimated from Buhariwalla et al. (2020) we can estimate that the photoionized emitter is located within a few pc of the SMBH. Based in on the FWHM of the O vii emission line, the emitting material cannot be closer than the inner radius of the torus.
-
iii.
The collisionally ionized material is interpenetrated as a region of star forming activity. Based on relations from Franceschini et al. (2003) we estimate the SFR to be . This is consistent with the the SFR found by Buhariwalla et al. (2020) using the same method, and using PAH measurement of Mrk 1239 (Ruschel-Dutra et al., 2016).
-
iv.
Seyfert 1 galaxies typically show evidence of photoionized emission, it is uncommon for them to show evidence of collisionally ionized plasma in their X-ray spectra, placing Mrk 1239 in the minority along with ESO 323-G77.
The broadband spectrum Mrk 1239 will be presented in a future work. We will investigate any connection between the photoionized emitter and the highly absorbed continuum.
Acknowledgements
This work was based on observations obtained with XMM-Newton, an ESA science mission with instruments and contributions directly funded by ESA Member States and NASA. This research has also made use of data obtained from the Chandra Data Archive and the Chandra Source Catalog, and software provided by the Chandra X-ray Center (CXC) in the application packages CIAO and Sherpa. We thank the referee for comments that helped clarify the work. LCG acknowledges financial support from the Natural Sciences and Engineering Research Council of Canada (NSERC) and from the Canadian Space Agency (CSA). JJ acknowledges support from the Leverhulme Trust, Isaac Newton Trust, and St. Edmund’s College University of Cambridge.
Data Availability
All data will be available through the HEASARC archive after the proprietary period has ended.
References
- Arav et al. (1998) Arav N., Barlow T. A., Laor A., Sargent W. L. W., Blandford R. D., 1998, MNRAS, 297, 990
- Armentrout et al. (2007) Armentrout B. K., Kraemer S. B., Turner T. J., 2007, ApJ, 665, 237
- Barret et al. (2022) Barret D., et al., 2022, arXiv e-prints, p. arXiv:2208.14562
- Beers et al. (1995) Beers T. C., Kriessler J. R., Bird C. M., Huchra J. P., 1995, AJ, 109, 874
- Bennert et al. (2002) Bennert N., Falcke H., Schulz H., Wilson A. S., Wills B. J., 2002, ApJ, 574, L105
- Bennert et al. (2006) Bennert N., Jungwiert B., Komossa S., Haas M., Chini R., 2006, A&A, 456, 953
- Bianchi et al. (2010) Bianchi S., Chiaberge M., Evans D. A., Guainazzi M., Baldi R. D., Matt G., Piconcelli E., 2010, MNRAS, 405, 553
- Buhariwalla et al. (2020) Buhariwalla M. Z., Waddell S. G. H., Gallo L. C., Grupe D., Komossa S., 2020, ApJ, 901, 118
- Cappi et al. (2016) Cappi M., et al., 2016, A&A, 592, A27
- Cash (1979) Cash W., 1979, ApJ, 228, 939
- Doi et al. (2015) Doi A., Wajima K., Hagiwara Y., Inoue M., 2015, ApJ, 798, L30
- Foord (2020) Foord A., 2020, Dual AGN Across Cosmic Time, Chandra Proposal ID #22700153
- Franceschini et al. (2003) Franceschini A., et al., 2003, MNRAS, 343, 1181
- Gallo (2018) Gallo L., 2018, PoS, NLS1-2018, 034
- Gallo et al. (2006) Gallo L. C., Lehmann I., Pietsch W., Boller T., Brinkmann W., Friedrich P., Grupe D., 2006, MNRAS, 365, 688
- Goodrich (1989) Goodrich R. W., 1989, ApJ, 342, 224
- Grafton-Waters et al. (2021) Grafton-Waters S., Branduardi-Raymont G., Mehdipour M., Page M., Bianchi S., Behar E., Symeonidis M., 2021, A&A, 649, A162
- Grupe et al. (2004) Grupe D., Mathur S., Komossa S., 2004, AJ, 127, 3161
- Grupe et al. (2008) Grupe D., Komossa S., Gallo L. C., Fabian A. C., Larsson J., Pradhan A. K., Xu D., Miniutti G., 2008, The Astrophysical Journal, 681, 982
- Gruppioni et al. (2016) Gruppioni C., et al., 2016, MNRAS, 458, 4297
- Guainazzi & Bianchi (2007) Guainazzi M., Bianchi S., 2007, MNRAS, 374, 1290
- Husemann et al. (2022) Husemann B., et al., 2022, A&A, 659, A124
- Jansen et al. (2001) Jansen F., et al., 2001, AAP, 365, L1
- Järvelä et al. (2022) Järvelä E., Dahale R., Crepaldi L., Berton M., Congiu E., Antonucci R., 2022, A&A, 658, A12
- Jiang et al. (2019) Jiang J., et al., 2019, MNRAS, 489, 3436
- Jiang et al. (2021) Jiang J., Baloković M., Brightman M., Liu H., Harrison F. A., Lansbury G. B., 2021, MNRAS, 505, 702
- Kaastra & Bleeker (2016) Kaastra J. S., Bleeker J. A. M., 2016, AAP, 587, A151
- Kallman & Bautista (2001) Kallman T., Bautista M., 2001, ApJS, 133, 221
- Kaspi et al. (2005) Kaspi S., Maoz D., Netzer H., Peterson B. M., Vestergaard M., Jannuzi B. T., 2005, ApJ, 629, 61
- Kinkhabwala et al. (2002) Kinkhabwala A., et al., 2002, ApJ, 575, 732
- Komossa (2008) Komossa S., 2008, in Rev. Mex. Astron. Astrofis. Conference Series. pp 86–92 (arXiv:0710.3326)
- Komossa & Schulz (1997) Komossa S., Schulz H., 1997, A&A, 323, 31
- Liedahl et al. (1995) Liedahl D. A., Osterheld A. L., Goldstein W. H., 1995, ApJ, 438, L115
- Longinotti et al. (2013) Longinotti A. L., et al., 2013, ApJ, 766, 104
- Longinotti et al. (2019) Longinotti A. L., et al., 2019, ApJ, 875, 150
- Malkan et al. (2017) Malkan M. A., Jensen L. D., Rodriguez D. R., Spinoglio L., Rush B., 2017, ApJ, 846, 102
- Mao et al. (2018) Mao J., et al., 2018, A&A, 612, A18
- Mao et al. (2019) Mao J., et al., 2019, A&A, 621, A9
- Marinucci et al. (2011) Marinucci A., Bianchi S., Matt G., Fabian A. C., Iwasawa K., Miniutti G., Piconcelli E., 2011, A&A, 526, A36
- Miniutti et al. (2014) Miniutti G., et al., 2014, MNRAS, 437, 1776
- Netzer (2013) Netzer H., 2013, The Physics and Evolution of Active Galactic Nuclei.. Cambridge University Press, https://search.ebscohost.com/login.aspx?direct=true&db=nlebk&AN=527870&site=ehost-live
- Osterbrock & Pogge (1985) Osterbrock D. E., Pogge R. W., 1985, ApJ, 297, 166
- Pan et al. (2019) Pan X., et al., 2019, ApJ, 870, 75
- Pan et al. (2021) Pan X., et al., 2021, ApJ, 912, 118
- Parker et al. (2019) Parker M. L., et al., 2019, MNRAS, 490, 683
- Phillips et al. (1997) Phillips K. J. H., Greer C. J., Bhatia A. K., Coffey I. H., Barnsley R., Keenan F. P., 1997, A&A, 324, 381
- Porquet & Dubau (2000) Porquet D., Dubau J., 2000, A&AS, 143, 495
- Rafanelli & Bonoli (1984) Rafanelli P., Bonoli C., 1984, A&A, 131, 186
- Ruschel-Dutra et al. (2016) Ruschel-Dutra D., Rodríguez Espinosa J. M., González Martán O., Pastoriza M., Riffel R., 2016, MNRAS, 466, 3353
- Rush & Malkan (1996) Rush B., Malkan M. A., 1996, ApJ, 456, 466
- Schmitt et al. (2003) Schmitt H. R., Donley J. L., Antonucci R. R. J., Hutchings J. B., Kinney A. L., Pringle J. E., 2003, ApJ, 597, 768
- Seyfert (1943) Seyfert C. K., 1943, ApJ, 97, 28
- Smirnova-Pinchukova et al. (2022) Smirnova-Pinchukova I., et al., 2022, A&A, 659, A125
- Smith et al. (2001) Smith R. K., Brickhouse N. S., Liedahl D. A., Raymond J. C., 2001, ApJ, 556, L91
- Smith et al. (2004) Smith J. E., Robinson A., Alexander D. M., Young S., Axon D. J., Corbett E. A., 2004, MNRAS, 350, 140
- Tarter et al. (1969) Tarter C. B., Tucker W. H., Salpeter E. E., 1969, ApJ, 156, 943
- Tristram & Schartmann (2011) Tristram K. R. W., Schartmann M., 2011, A&A, 531, A99
- Vaona et al. (2012) Vaona L., Ciroi S., Di Mille F., Cracco V., La Mura G., Rafanelli P., 2012, MNRAS, 427, 1266
- Waddell & Gallo (2020) Waddell S. G. H., Gallo L. C., 2020, MNRAS, 498, 5207
- Waddell et al. (2019) Waddell S. G. H., Gallo L. C., Gonzalez A. G., Tripathi S., Zoghbi A., 2019, MNRAS, 489, 5398
- Whewell et al. (2015) Whewell M., et al., 2015, A&A, 581, A79
- Wilkins & Gallo (2015) Wilkins D. R., Gallo L. C., 2015, MNRAS, 449, 129
- Wilkins et al. (2017) Wilkins D. R., Gallo L. C., Silva C. V., Costantini E., Brandt W. N., Kriss G. A., 2017, MNRAS, 471, 4436
- Willingale et al. (2013) Willingale R., Starling R. L. C., Beardmore A. P., Tanvir N. R., O’Brien P. T., 2013, MNRAS, 431, 394