Computational Assessment of Hyperpartisanship in News Titles
Abstract
We first adopt a human-guided machine learning framework to develop a new dataset for hyperpartisan news title detection with 2,200 manually labeled and 1.8 million machine-labeled titles that were posted from 2014 to the present by nine representative media organizations across three media bias groups - Left, Central, and Right in an active learning manner. The fine-tuned transformer-based language model achieves an overall accuracy of 0.84 and an score of 0.78 on an external validation set. Next, we conduct a computational analysis to quantify the extent and dynamics of partisanship in news titles. While some aspects are as expected, our study reveals new or nuanced differences between the three media groups. We find that overall the Right media tends to use proportionally more hyperpartisan titles. Roughly around the 2016 Presidential Election, the proportions of hyperpartisan titles increased in all media bias groups where the relative increase in the proportion of hyperpartisan titles of the Left media was the most. We identify three major topics including foreign issues, political systems, and societal issues that are suggestive of hyperpartisanship in news titles using logistic regression models and the Shapley values. Through an analysis of the topic distribution, we find that societal issues gradually receive more attention from all media groups. We further apply a lexicon-based language analysis tool to the titles of each topic and quantify the linguistic distance between any pairs of the three media groups. Three distinct patterns are discovered. The Left media is linguistically more different from Central and Right in terms of foreign issues. For political systems, the linguistic distance between the three media groups becomes smaller over recent years. In addition, a seasonal pattern where linguistic difference is associated with elections is observed for societal issues.
Introduction
Online news consumption is found to be systematically and consistently associated with perceived polarization which is conceptualized as the difference between a respondent’s estimates of different parties’ attitudes on a range of political issues regardless of the actual level of disagreement (Westfall et al. 2015; Yang et al. 2016). Researchers have found that there might be three reasons. First, the media tends to highlight conflicts between political actors because this type of news is considered to have high news value (Fiorina, Abrams, and Pope 2005) and it is easier to convey complicated political stories to the general public when they are portrayed as largely confrontational (Bennett 1990). Second, because of the increasing usage of social platforms where local communities are formed based on members’ similar likes and dislikes, one-sided opinions are more likely to be viewed, discussed, and shared among homogeneous communities (Conover et al. 2011). Eventually, increasing exposure to media coverage of polarization could lead people to think that not only the political system, but the general public is polarized (Fiorina, Abrams, and Pope 2005).
In this study, we aim to understand the partisanship in news. To facilitate a quantitative understanding of the extent of partisanship, Vincent and Mestre (2018) and Kiesel et al. (2019) curated a hyperpartisan news dataset. According to their definition, hyperpartisan articles “mimic the form of regular news articles, but are one-sided in the sense that opposing views are either ignored or fiercely attacked”. In the same vein, Potthast et al. (2018) considered hyperpartisan news as “typically extremely one-sided, inflammatory, emotional, and often riddled with untruths.”
We think that a better understanding of hyperpartisanship can be achieved by considering not only (1) the news that contains one-sided opinions but also (2) the news that describes conflicts and the underlying politically polarized climate because both of them could lead to an increase in the public’s perceived polarization (Yang et al. 2016; Fiorina, Abrams, and Pope 2005; Levendusky and Malhotra 2016). Additionally, coverage quantity itself can be considered as a particular form of bias (Lin, Bagrow, and Lazer 2011). In particular, we seek to extend previous studies’ definitions of hyperpartisan news to include news that covers partisan conflicts and confrontations. To that end, we first develop a dataset to measure the partisanship in news titles. We focus on titles because it is easier for online users to access them on social platforms and decide whether to read the news content since they often summarize the opinions or events of the full article. Easily available titles that are circulated in like-minded online communities tend to become anchor points for individual opinions (Yang et al. 2016; Zillmann 1999), especially when individuals do not directly experience the covered events (Busselle and Shrum 2003).
Yang et al. (2016) conducted a questionnaire-based study on the relationship between media use and perceived political polarization. However, one of the limitations is the lack of examinations in real-world social platforms where media exposure is more complicated because of the combination of platforms’ recommendation algorithms and sharing behaviors of friends and followers (Bakshy, Messing, and Adamic 2015). In other words, respondents may behave differently when they are finishing a questionnaire than when they are exposed to news on social platforms without knowing they are surveyed (Krumpal 2013). A study on the relationship between their opinions and hyperpartisanship in news titles can be conducted given a dataset that quantitatively measures hyperpartisanship in news titles. Therefore, we first develop a new dataset that complements previous hyperpartisan news datasets and then conduct an initial quantitative comparative analysis of more generalized hyperpartisan news titles. To summarize, our study consists of two parts:
-
•
Hyperpartisan title detection Based on the experimental results of our preliminary study on an existing hyperpartisan news dataset (details in Material and Method), we find that class imbalance, task-label unalignment, and distribution shift issues may hinder us from directly applying it to hyperpartisan title detection. Therefore, we adopt a human-guided machine learning framework to develop a new hyperpartisan news titles dataset with 2,200 manually labeled and 1.8 million machine-labeled titles that were posted by nine representative media organizations across three media bias groups - Left, Central, and Right. The detection evaluated on an external validation set achieves an overall accuracy of 0.84 and an score of 0.78. We build it upon the ideas of a previously proposed hyperpartisan news dataset (Kiesel et al. 2019; Vincent and Mestre 2018) and further include a second type of news that could also affect perceived polarization. Another distinction between our dataset and the previous dataset is that we only focus on titles instead of full articles. Our dataset will be released for future studies.
-
•
Computational analysis of hyperpartisan titles We conduct a computational analysis of 1.8 million news titles that were posted by nine representative media organizations from 2014 to 2022. For simplicity, we categorize and refer to them as Left, Central, and Right media. However, additional attention should be paid when interpreting the results as they are based on nine instead of all media organizations. We find that overall Right media tends to use proportionally more hyperpartisan titles, followed by Left media and then Central media. Moreover, roughly before the 2016 Presidential Election, a rise in the proportion of hyperpartisan titles is observed in all three media bias groups. In particular, the relative increase in the proportion of hyperpartisan titles of Left is the greatest, while the relative changes of Right and Central are more similar and moderate. After Biden was elected the President, the proportions of hyperpartisan titles dropped and seemed to gradually return to the level before the 2016 Presidential Election. Moreover, three topics including foreign issues, political systems, and societal issues are important in understanding the usage of hyperpartisan titles. A topic divergence including the emphasis on the choice of topics and the linguistic differences is further observed among the media groups.
In the following sections, we summarize related work, discuss more details about our motivations, describe how we develop and label our dataset in Material and Method, provide the results of our computational analysis, and discuss the results, limitations, and directions for future work. Finally, we discuss broader perspectives and ethical considerations.
Related Work
Understanding partisanship in texts is an important research topic as it is closely related to the studies of political polarization (Monroe, Colaresi, and Quinn 2008; Gentzkow and Shapiro 2010). One of its subtasks - hyperpartisan news detection, has drawn great attention from the research community. Potthast et al. (2018) conducted an analysis of the writing style of 1,627 manually labeled hyperpartisan news articles and found that the writing style can help discriminate hyperpartisan news from non-hyperpartisan news. Kiesel et al. (2019) raised a contest in hyperpartisan news detection. They developed a hyperpartisan news dataset with 1,273 manually labeled and 754,000 machine-labeled news articles. Forty-two teams completed the contest. Deep learning methods as well as the more traditional models that use hand-crafted features show promising performance in hyperpartisan news detection.
More recently, researchers have discovered the dominant performance of transformer-based pretrained language models in a variety of natural language processing tasks (Devlin et al. 2019; Chen et al. 2021; Zhang et al. 2021). In this study, we intend to leverage the transformer-based language model to quantify the extent and dynamics of hyperpartisanship in news titles at a larger scale (1.8 million titles of nine representative news media from 2014 to 2022) compared to previous studies. Additionally, most studies focus on the comparison between left-leaning and right-leaning media. We include the comparison between them and central media.
Material and Method
Hyperpartisan Title Detection
Task Definition
Inspired by Kiesel et al. (2019), we define hyperpartisan title detection as “Given the title of an online news article, decide whether the title is hyperpartisan or not”. A news title is considered hyperpartisan if it either (1) expresses a one-sided opinion (e.g., denouncement, criticism) against a policy, a political party, or a politician in a biased and aggressive tone, or (2) describes a confrontation or a conflict between opposing parties indicating the underlying political climate is polarized.
Motivating Analysis
The most closely related task to our goal is hyperpartisan news detection as we have discussed in the Introduction Section. The hyperpartisan news dataset curated by Vincent and Mestre (2018) and Kiesel et al. (2019) contains 1,273 manually labeled news articles that were published by both active hyperpartisan and mainstream media outlets. The articles were labeled 1 if they contained a fair amount of hyperpartisan content, or 0 if not. For simplicity, we refer to this dataset as SemEval. One primary reason we cannot directly apply it to our task is that it only considers one type of hyperpartisan news which mainly conveys one-sided opinions. However, we aim to include an extra type of hyperpartisan news that describes an underlying politically polarized climate. Moreover, we perform a preliminary analysis on SemEval to show that there are three more major issues that prevent us from directly using it for hyperpartisan title detection. In all the experiments, we choose a transformer-based language model as our classifier.
-
•
Class imbalance Following the same train-test split of SemEval, we fine-tune a pretrained BERT-base model (Devlin et al. 2019) to predict whether or not a news title is hyperpartisan based solely on the title itself. However, it achieves a poor performance (Case 1 of Table 1). We hypothesize that one potential cause is the class imbalance issue as the positive samples only account for 36.90% in the training set. In Case 2, we downsample the data of the majority class in the training set and conduct the same experiment again. We observe that the performance improves when the imbalance issue is alleviated.
-
•
Task-label unalignment Even after we apply downsampling to SemEval, the improvement is still limited. One reason we hypothesize is that the task and label are unaligned. Our task is to predict whether or not a news title is hyperpartisan, however, the labels in SemEval are rated based on the entire article and its metadata (e.g., publisher).
-
•
Distribution shift A majority of the articles of SemEval were posted from 2016 to 2018. To verify if hyperpartisan title detection is robust across different years, we further conduct three experiments. For each experiment, we use the articles from one year as the testing set, and all the other articles as the training set. The same fine-tuning process is performed. Cases 3, 4, and 5 of Table 1 show the performance of using the articles posted in 2016, 2017, and 2018, respectively, as the testing set. The results suggest a poor and inconsistent performance across different years. We hypothesize that it may be because of a distribution shift in the textual patterns such as tones, context, and so on (which is later confirmed by our analysis results).
| Case | Accuracy | Precision | Recall | |
| 1 | 0.51 | 0.36 | 0.28 | 0.51 |
| 2 | 0.52 | 0.48 | 0.44 | 0.53 |
| 3 | 0.47 | 0.38 | 0.92 | 0.61 |
| 4 | 0.48 | 0.87 | 0.47 | 0.61 |
| 5 | 0.66 | 0.67 | 0.59 | 0.63 |
The experimental results provide insights into the construction of our dataset for hyperpartisan news title detection. The dataset should (1) be class-balanced in order to support robust learning for language models (Japkowicz et al. 2000; Chawla, Japkowicz, and Kotcz 2004); (2) have labels that are rated solely based on titles; and (3) contain titles of different years so that the prediction performance is consistent. Most importantly, the dataset should also consider both two types of hyperpartisan news. Next, we develop a dataset that satisfies these conditions.
Data collection
We collect news from nine representative media outlets of different media biases - Left, Central, and Right. The media bias is judged and assigned by allsides.com and mediabiasfactcheck.com. The New York Times, CNN, NBC, and Bloomberg are included in Left media. Wall Street Journal and Christian Science Monitor are included in Central media. The Federalist, Reason, and Washington Times are included in Right media. Fox is not included because access to its history news titles is not publicly available. As aforementioned, we focus on the titles of the articles. In total, we have collected over 1.8 million titles from January 2014 to September 2022.
Human-guided machine learning
After a pilot exploration of the collected titles, we also observe a class imbalance issue where only a small number of titles are hyperpartisan. Consequently, we will have to label more data to have enough hyperpartisan samples. To label titles more efficiently, we develop our dataset in an active learning manner where a machine learning model and human annotators are guided by each other to iteratively seek samples of the minority class and improve the performance of the machine learning model. We adopt this strategy since it has shown effectiveness in developing datasets and handling class imbalance in multiple studies (Sadilek et al. 2013; Lyu et al. 2022; Zhou et al. 2022).
| 2014 | 2015 | 2016 | 2017 | 2018 | 2019 | 2020 | 2021 | 2022 | ||
| Manually labeled | # hyperpartisan titles | 71 | 84 | 87 | 119 | 124 | 114 | 116 | 105 | 78 |
| # non-hyperpartisan titles | 149 | 173 | 171 | 143 | 130 | 132 | 140 | 127 | 137 | |
| Model labeled | # hyperpartisan titles | 24,258 | 24,706 | 34,626 | 34,181 | 32,259 | 33,326 | 34,766 | 28,075 | 22,495 |
| # non-hyperpartisan titles | 229,029 | 207,176 | 193,419 | 162,657 | 155,651 | 145,964 | 155,173 | 160,403 | 144,460 |
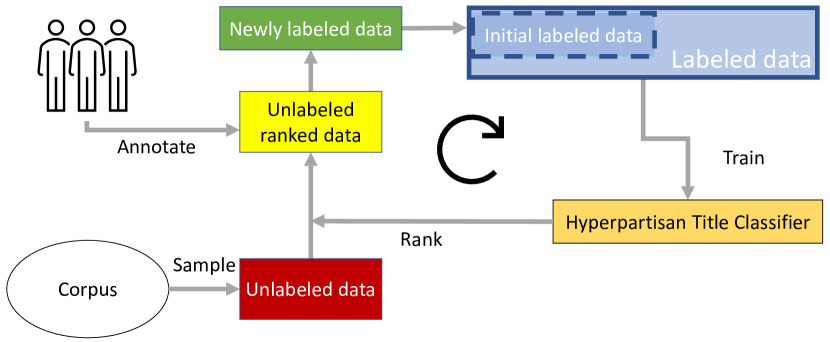
Figure 1 shows a diagram of the human-guided machine learning framework we adopt from Lyu et al. (2022). In general, the learning process is composed of multiple iterations. In iteration , annotators first manually label a small batch of data . Next, we add this new batch of labeled data into the labeled corpus and retrain the machine learning model . The trained model is used to look for the samples of the minority class - hyperpartisan titles from corpus . The samples that are rated as most likely hyperpartisan by the model make up which will be manually labeled by the annotators in the next iteration.
More specifically, is comprised of 1.8 million titles we collected. For each iteration, three researchers independently read a new batch of 500 titles and rate them as hyperpartisan or non-hyperpartisan. The label is assigned with the consensus votes from three researchers. We choose the pretrained BERT-base as our machine learning model .
In the first iteration, we fine-tune using SemEval and apply it to 2,000 titles we randomly sample from . These 2,000 titles are ranked based on the likelihood of being hyperpartisan predicted by . The new batch is composed of 90% () most likely hyperpartisan titles and 10% () randomly sampled titles. The 10% random samples are included for diversity. The specified proportions of the most likely hyperpartisan and random samples allow us actively look for the samples of the minority class which alleviates the class imbalance issue. Moreover, to address the potential distribution shift problem we discuss before, we add a time constraint. The 90% () titles are composed of the 90% most likely hyperpartisan titles of each year between 2014 to 2022. As a result, the number of potential hyperpartisan titles has a relatively uniform distribution across different years. In the following iterations, all settings are the same, except that we no longer need SemEval to fine-tune our model. Our model is fine-tuned iteratively with the aggregate labeled data from our own collected titles.
We conduct the labeling and model training for four iterations. We have also labeled an external validation set with 200 titles. Inter-annotator agreement measured by Cohen’s Kappa is 0.47, suggesting a moderate to substantial agreement (Landis and Koch 1977). Table 2 shows the summary statistics of the 2,200 manually labeled titles. The performance of is evaluated on the external validation set at each iteration (Table 3). We find that the performance on hyperpartisan title detection is improved iteration by iteration. After four iterations, the model achieves an overall accuracy of 0.84 and an score of 0.78.
Moreover, we compare the performance of other representative language models with the BERT-base model (Table 4). In general, the BERT-base model outperforms other language models. TF-IDF has a slightly higher recall score and a much lower precision score, suggesting a poor performance. The superiority of the BERT-base model over bag-of-words, TF-IDF, and word2vec is consistent with its performance in other classification tasks (Devlin et al. 2019; Zhang et al. 2021; Chen et al. 2021). The preprocessing procedures, implementation details, and hyperparameter settings are discussed in the appendix.
| Iteration | Accuracy | Precision | Recall | |
| 1 | 0.76 | 0.79 | 0.52 | 0.63 |
| 2 | 0.78 | 0.77 | 0.62 | 0.67 |
| 3 | 0.82 | 0.78 | 0.75 | 0.76 |
| 4 | 0.84 | 0.81 | 0.76 | 0.78 |
| Model | Accuracy | Precision | Recall | |
| Bag-of-words | 0.70 | 0.30 | 0.77 | 0.43 |
| TF-IDF | 0.73 | 0.39 | 0.79 | 0.52 |
| word2vec | 0.78 | 0.60 | 0.77 | 0.67 |
| BERT-base | 0.84 | 0.81 | 0.76 | 0.78 |
Inference
The model is fine-tuned using our labeled data and applied to the rest of the corpus. Table 2 shows the summary statistics of the titles that are labeled by our model. Overall, 14.7% titles are classified as hyperpartisan.
Important Term Identification
To identify the most important words that are suggestive of hyperpartisan and non-hyperpartisan titles used by Left, Central, and Right media across three periods, we train L1 regularized logistic regression models. The input is the words in each title. The output label - whether or not the title is hyperpartisan, is assigned based on the inference of our BERT-base model. We only include the words that at least appear in 0.5% of all collected titles. Stop words are removed using the nltk package. Word counts are binarized. The importance of each word is measured using the Shapley values (Lundberg and Lee 2017). Each model is trained and evaluated using 5-fold cross-validation. In each validation, the 50 most important features (i.e., words) are kept. After five validations, the features that occur the most are reported in Table 5.
Topic Analysis
Topic distribution
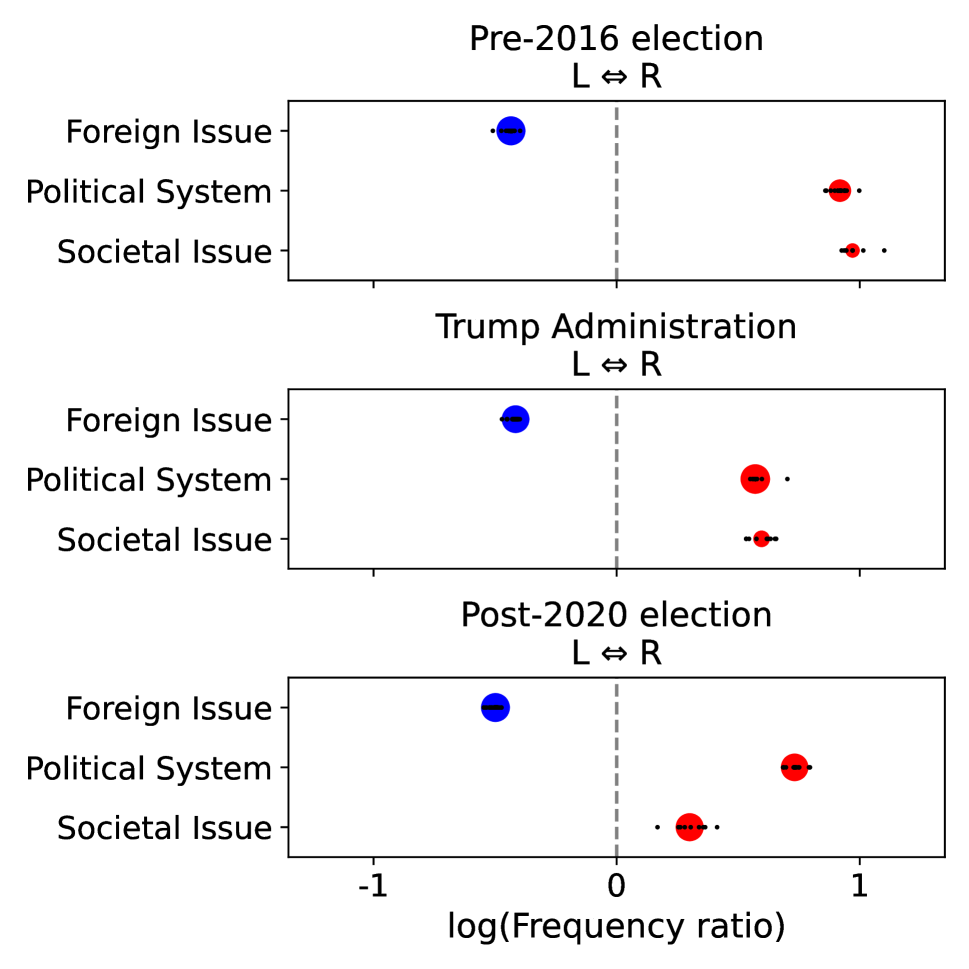
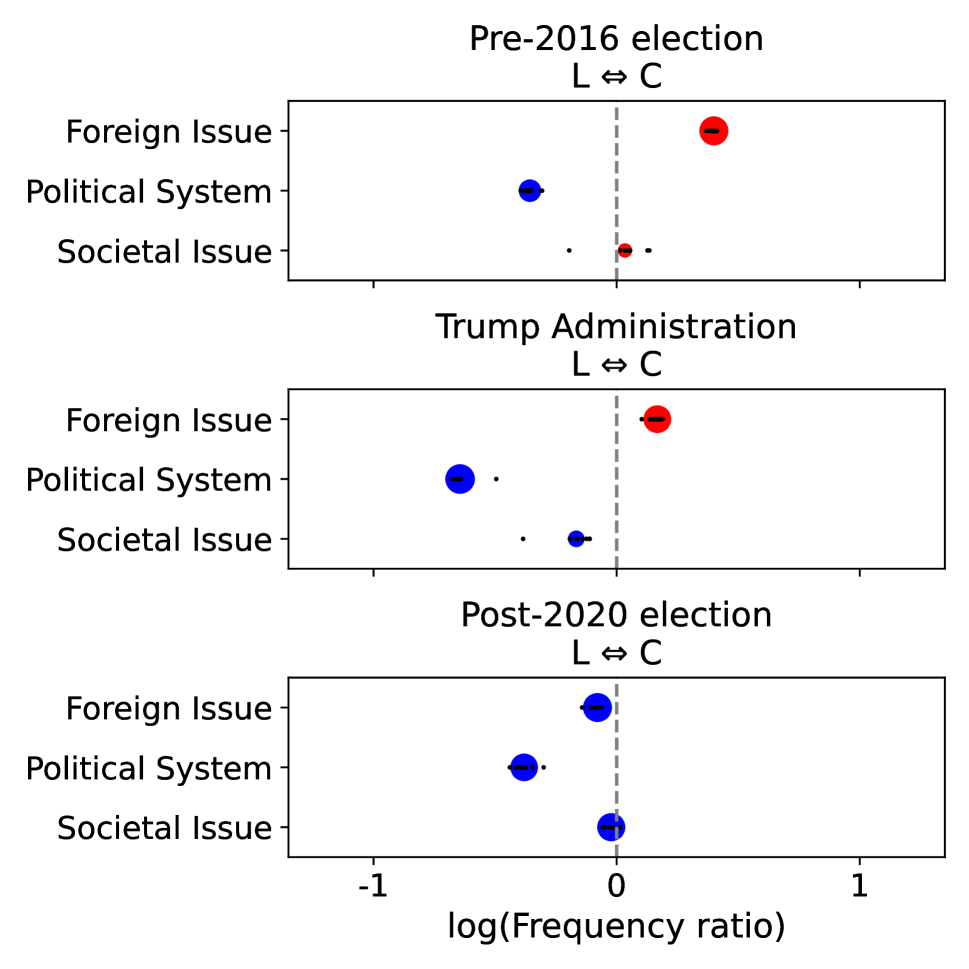
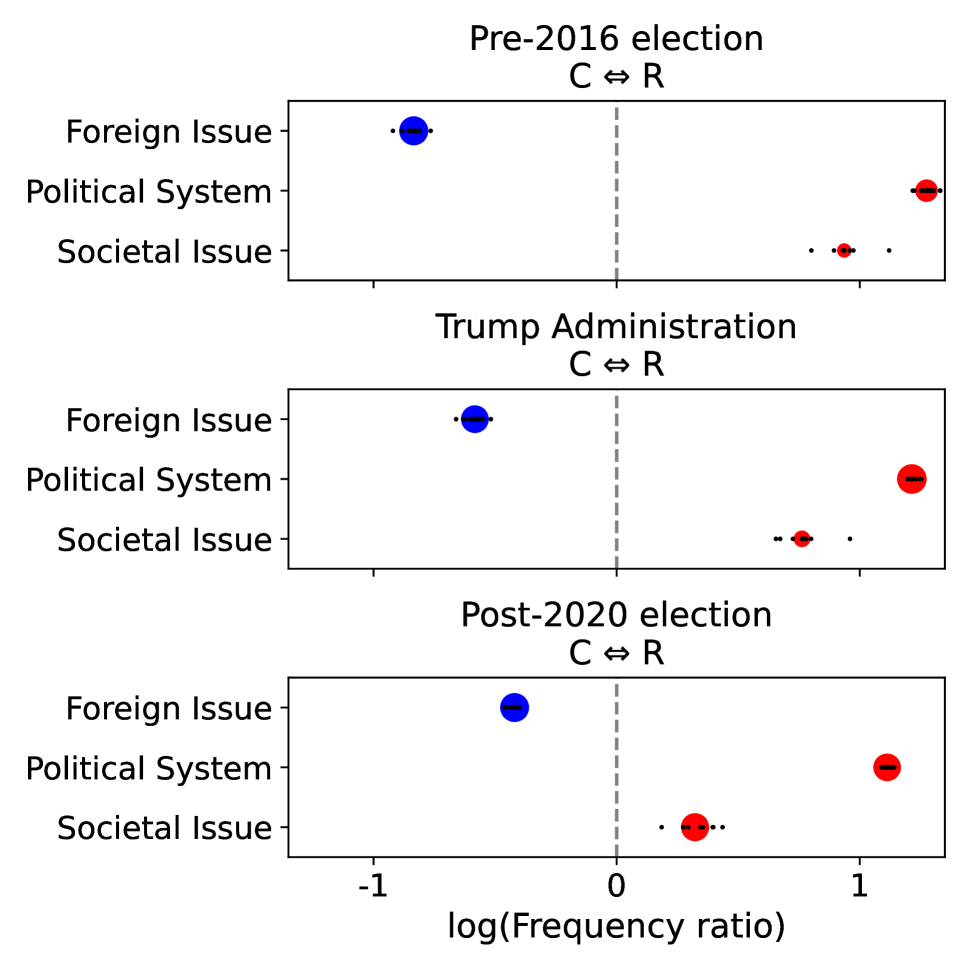
Based on the important terms we identify in Table 5, we discover three major topics - “foreign issue”, “political system”, and “society issue”, of three media groups across different periods. For each topic, we curate a list of keywords from the most important terms in Table 5 (see Appendix for details). We then use the keyword list to identify the corresponding topic of each news title. To analyze the distribution divergence among different media groups, the log of frequency ratio is calculated and shown in Figure 3. A larger value means that this topic is mentioned more frequently by the media on the right-hand side and vice versa. The circle size indicates the overall frequency of this topic. To ensure the robustness of our method, we leave one word out of the keyword list and conduct the same analysis again. The new values are plotted as black dots in Figure 3.
Linguistic difference
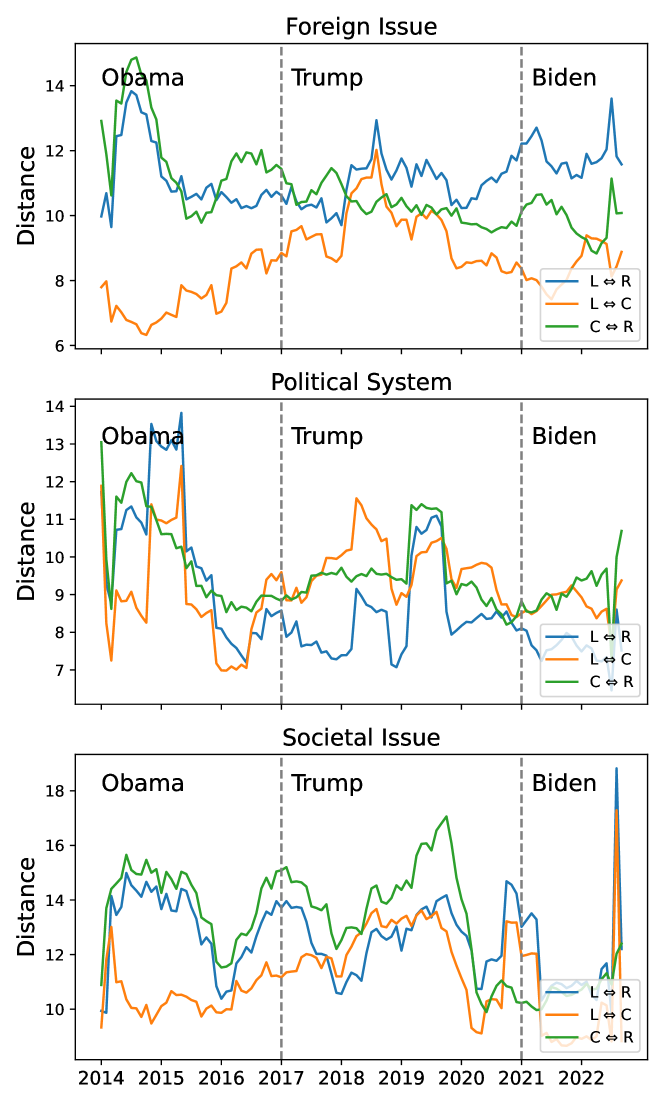
To estimate how different media groups portray the same topic, we leverage Linguistic Inquiry and Word Count (LIWC) (Pennebaker, Francis, and Booth 2001). LIWC is a lexicon-based language analysis tool that measures the linguistic features of people’s language. It captures authors’ psychological states, including their emotions, thinking styles, and social concerns (Pennebaker, Francis, and Booth 2001). To ensure the robustness of LIWC on short text such as news titles, we concatenate all the titles of one media group about one topic in a certain period, following Chen et al. (2021). Next, because of the scale differences among the linguistic features, we standardize the features. The linguistic difference between any pair of the three media groups is then measured using the Euclidean distance. The results smoothed using a 7-month moving average are shown in Figure 4.
Results
Hyperpartisanship in News Titles
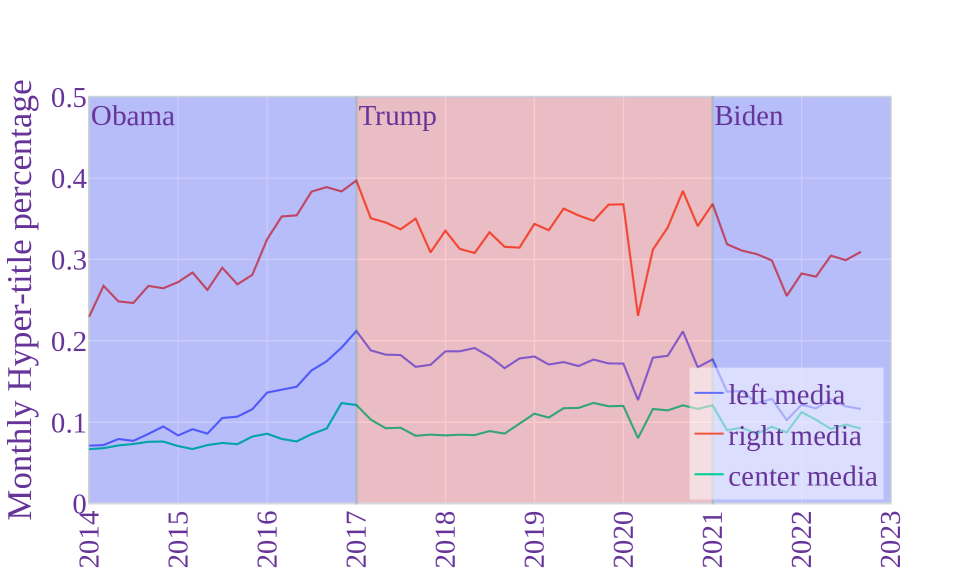
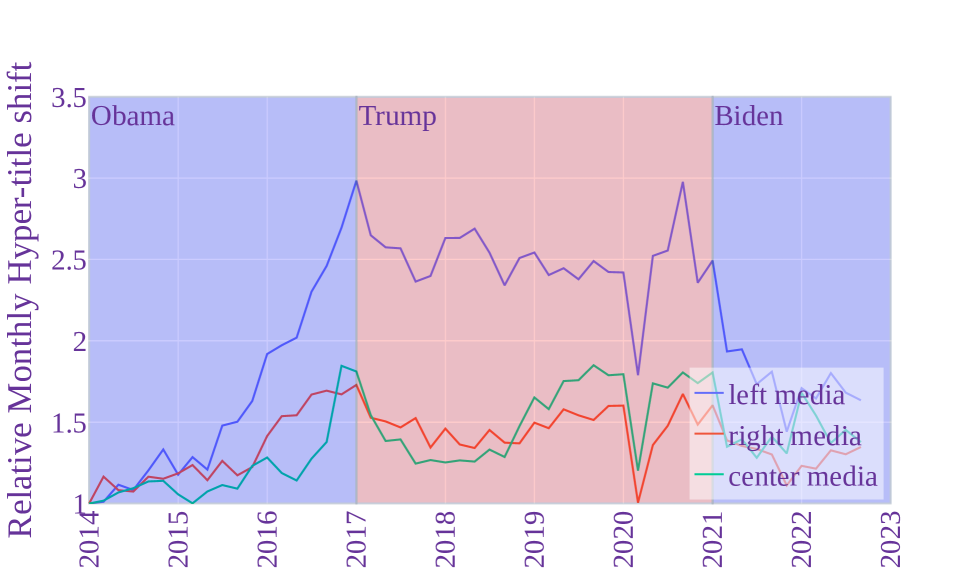
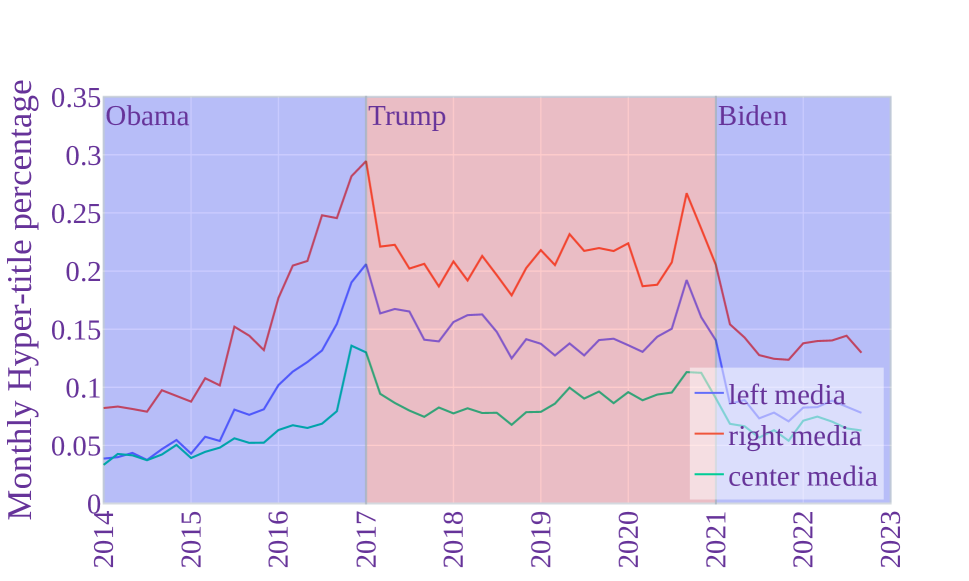
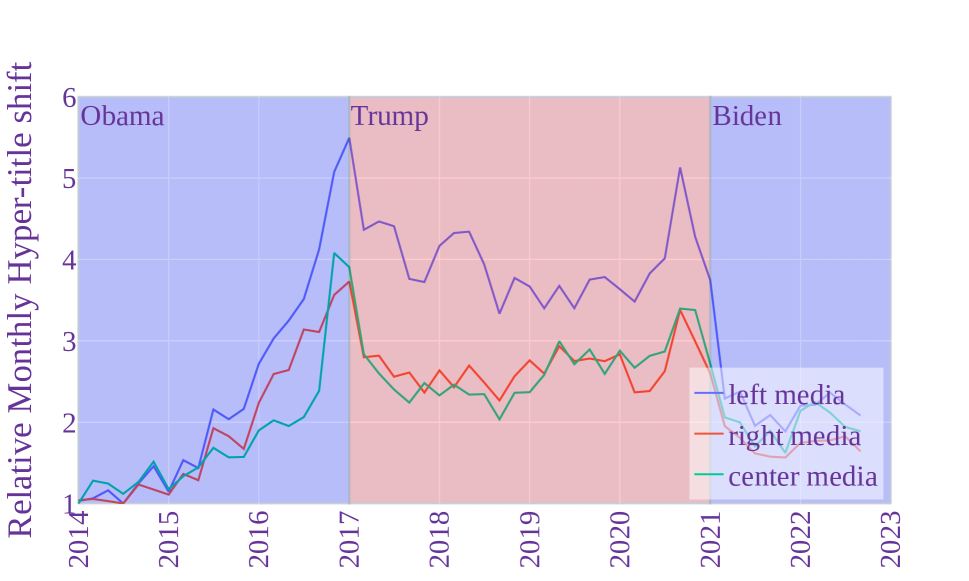
We apply the fine-tuned BERT-base model to 1.8 million titles that were used by Left, Central, and Right media between 2014 and 2022. Figure 2 shows the usage of hyperpartisan titles of these three media bias groups. Figure 2(a) shows the percentage of hyperpartisan titles. The relative change in percentage is shown in Figure 2(b). The appendix includes the results of an alternative model and a validity verification.
First, we find that overall Right media tends to use proportionally more hyperpartisan titles, followed by Left media and then Central media (Figure 2(a)). Of all the titles between 2014 to 2022, 14.20%, 8.91%, and 31.65% are hyperpartisan in Left, Central, and Right, respectively.
Second, we discover a rise in the proportion of hyperpartisan titles in all three media bias groups (Figure 2(b)). Specifically, the relative increase in the proportion of hyperpartisan titles of Left media is the greatest, while the relative changes of Right and Central media are more similar and moderate. Compared to 2014, the average proportion of hyperpartisan titles that Left used in 2016 increased by 101.77% (22.19% for Central and 43.53% for Right). The proportions of hyperpartisan titles remained high during the Trump Administration (2017-2020).
Third, after Biden was elected the President, the proportions of hyperpartisan titles dropped and seemed to gradually return to the level before the 2016 Presidential Election. For instance, the relative change in hyperpartisan title proportion of Left media dropped by 39.74% by comparing November 2020 and November 2021.
Influential Terms in Predicting Hyperpartisanship
Similar to Card et al. (2022), we train logistic regression models to estimate the predictions of our BERT-base models. The feature importance based on Shapley values (Lundberg and Lee 2017) is used to better understand the language that is suggestive of hyperpartisan or non-hyperpartisan titles. Based on the observations in Figure 2, we categorize the titles into three periods - before the 2016 Presidential Election, during the Trump Administration, and after the 2020 Presidential Election. The most important words for predicting hyperpartisanship are listed in Table 5.
|
|
|
||||||||||||||
| Left |
Hyperparisan |
|
|
|
||||||||||||
|
Non-hyperparisan |
|
|
|
|||||||||||||
| Central |
Hyperparisan |
|
|
|
||||||||||||
|
Non-hyperparisan |
|
|
|
|||||||||||||
| Right |
Hyperparisan |
|
|
|
||||||||||||
|
Non-hyperparisan |
|
|
|
Our first observation is that across three periods, three groups of words are found to be influential in predicting hyperpartisan and/or non-hyperpartisan titles. We find words representing foreign countries (e.g., “Russia” and “China”), domestic political systems (e.g., “Democrat” and “Republican”), and societal issues (e.g., “gun” and “school”). These three groups of words are indicated in different colors in Table 5.
Since the pre-2016 election period only covers the news posted between 2014 to 2016, it is expected the words that are suggestive of either hyperpartisanship or non-hyperpartisanship are election-related (e.g., “campaign” and “debate”), although there is a subtle difference where in spite of the similarity in terms of the election, “campaign” and “debate” are more important in hyperpartisanship prediction while “vote” and “election” are more important in the non-hyperpartisan prediction of Left. Another noteworthy finding is that “Biden” is important in predicting hyperpartisan titles of Right media while “Trump” is influential in predicting non-hyperpartisan titles.
During the Trump Administration, words indicating societal issues were more important in predicting hyperpartisan titles of Left. Interestingly, although COVID-19 was announced as a pandemic in 2020 (late in the Trump Administration), the related words (i.e., “coronavirus” and “covid”) are still influential at the aggregate level. Moreover, coverage of foreign issues becomes important in predicting hyperpartisanship of Right.
After the 2020 Presidential Election, some election-related words are still considered influential. However, it is not surprising as there is still an argument from Trump and his allies about the election result.
Topic Divergence among Media Groups
Distribution
To better understand the topic divergence among the three media groups, we first measure the difference in topic distributions. Figure 3 shows the relative frequency for each of the three topics - “foreign issue”, “political system”, and “societal issue” among different media groups (Figure 3(a): Left versus Right, Figure 3(b): Left versus Central, Figure 3(c): Central versus Right). In almost all comparisons, we find much difference in the topic distributions. Compared to Left and Central media, Right media pays more attention to the political system and societal issues between 2014 to 2022 (Figure 3(a) and Figure 3(c)). Central media emphasizes the coverage of foreign issues.
When comparing the difference in topic distributions across the three periods, we observe that the attentions to these three topics of all media groups tend to be more similar. There is a trend that the log of relative frequency is closer to zero.
In terms of the general topic distribution, we find all media groups cover more news about societal issues. More importantly, the difference among the distributions of societal issue topic is reduced in the post-2020 election period.
Language
Figure 4 demonstrates the linguistic difference among Left, Central, and Right media about the three major topics we identify. Overall, we find three distinct patterns in the linguistic difference between the titles of these topics.
With respect to foreign issues, we find that the linguistic difference between Right and Central media becomes smaller (green line) while both of them are linguistically more distinct from Left media. In contrast, around 2014-2015, there was a smaller difference between Left and Central than between either of them and Right.
We identify two major findings about the linguistic difference in the coverage of political systems. First, the linguistic difference among the three media groups gradually decreases over time. Second, roughly around the 2016 Presidential Election, the linguistic difference between Left and Right is almost consistently the lowest compared to the difference between either of them and Central, indicating a more similar linguistic style between Left and Right when they cover news about the political systems (e.g., election and politicians).
The linguistic difference in terms of societal issues demonstrates a seasonal pattern where the peak in the linguistic difference occurs approximately after each election (2015, 2017, 2019, 2021). We hypothesize that it is because the societal issues are mainly discussions about policies that are closely related to voters’ rights. The different focuses inside the policies are captured by LIWC through the titles. Further, the difference between Left and Center media is smaller before the 2016 Presidential Election (orange line) compared to the other two cases. However, since then, the differences between the three cases evolve similarly.
Discussions and Conclusions
Increased partisanship in news can result in enhanced polarization which undermines democracy and has a substantial negative impact across the entire society (Vincent and Mestre 2018; Minar and Naher 2018; Recuero, Soares, and Gruzd 2020; Conover et al. 2011; Weld, Glenski, and Althoff 2021; Lyu and Luo 2022). For instance, researchers found that online partisan media can lead to a lasting and meaningful decrease in trust in the mainstream media (Guess et al. 2021). Recuero, Soares, and Gruzd (2020) investigated the role of hyperpartisanship and polarization on Twitter during the 2018 Brazilian presidential Election and found that as the centrality of the hyperpartisan news outlets grows, the mainstream news organizations become more and more biased. Therefore, it is critical to measure hyperpartisanship in online news.
In this study, we have developed a new dataset for hyperpartisan title detection that allows us to quantify the extent and dynamics of hyperpartisanship in news titles. We consider two types of news titles: (1) the ones that express a one-sided opinion against a policy, apolitical party, or a politician in a biased, inflammatory, and aggressive tone, and (2) the ones that describe a confrontation or a conflict between opposing parties indicating the underlying political climate is polarized. Different from previous studies that only consider the first type of news (Kiesel et al. 2019; Vincent and Mestre 2018; Potthast et al. 2018), we include both types as they could both lead to an increase in perceived polarization (Yang et al. 2016; Fiorina, Abrams, and Pope 2005; Levendusky and Malhotra 2016).
We find that the Right media more often use hyperpartisan titles compared to the Left and Central media. The proportions of hyperpartisan titles of all media bias groups increased roughly around the 2016 Presidential Election and decreased after the 2020 Presidential Election. A strong association between elections and hyperpartisanship is observed, which is also reported by Lin, Bagrow, and Lazer (2011). Interestingly, the relative change in the proportion of hyperpartisan titles of the Left media is the most compared to the Right and Central media.
Using the logistic regression models with the Shapley values, we find that although the specific words that are suggestive of hyperpartisanship or non-hyperpartisanship in news titles across three media bias groups are not necessarily the same, three common topics are identified including foreign issues, political systems, and societal issues.
Comparisons between any pairs of the Left, Central, and Right media are made in terms of topic frequencies. Societal issues have drawn more attention from all media groups since the start of the Biden Administration. We hypothesize that it is related to the Biden-Harris Administration Immediate Priorities which is intended to address societal issues such as the COVID-19 pandemic, education, climate change, and so on.111https://www.whitehouse.gov/priorities/
Further linguistic analysis reveals three distinct patterns in how different media portrays these topics. First, when it comes to foreign issues, the linguistic difference between Left and either Right or Central media becomes larger while the difference between Right and Central media is smaller. We hypothesize that the linguistic difference may be suggestive of the conflicting partisan priorities for U.S. foreign policy. For instance, Republicans are more likely to prioritize reducing illegal immigration while Democrats tend to prioritize dealing with global climate change, according to a survey by Pew Research Center.222https://www.pewresearch.org/politics/2018/11/29/conflicting-partisan-priorities-for-u-s-foreign-policy/ Second, the linguistic difference in the titles about political systems becomes smaller among all media groups. Third, seasonality is observed in the linguistic difference when depicting societal issues. The difference grows around the start of elections and decreases after the election results are confirmed. We think it is expected since societal issues (e.g., education, health) are closely related to voters’ rights.
Our computational assessment reveals several new or nuanced aspects about both the extent and dynamics of hyperpartisanship in news titles. According to the results of the topic analysis, we derive insights into the reasons for the long- and short-term changes. Short-term changes are found related to elections while long-term changes might imply the underlying shifting priorities for the wide range of policies. We use mainstream media news as our study sample. It is worth noting that a similar divergence between different politically leaning entities is also identified in studies that are based on social media data (Waller and Anderson 2021) or congressional and presidential speeches (Card et al. 2022). Moreover, we will make our new dataset available. Future studies can investigate how hyperpartisan titles impact perceived polarization.
Broader Perspectives and Ethical Considerations
Different from previous studies of hyperpartisanship in news, we introduce a second type of news which describes events that indicate an underlying polarized climate. We choose to include this type of news because evidence has been found that it can also affect perceived polarization. The inclusion of such news may allow future studies to understand perceived polarization in a broader and more general way. One potential negative outcome could be that the findings of our study may be interpreted or quoted based on partial statements or without caution. Therefore, we discuss the limitations and how to interpret the results of our study. In terms of the ethical considerations about our dataset, all raw data from the selected mainstream media are publicly available. We develop this dataset to complement the hyperpartisan news datasets of previous studies.
References
- Bakshy, Messing, and Adamic (2015) Bakshy, E.; Messing, S.; and Adamic, L. A. 2015. Exposure to ideologically diverse news and opinion on Facebook. Science 348(6239): 1130–1132.
- Bennett (1990) Bennett, W. L. 1990. Toward a theory of press-state. Journal of communication 40(2): 103–127.
- Bird, Klein, and Loper (2009) Bird, S.; Klein, E.; and Loper, E. 2009. Natural language processing with Python: analyzing text with the natural language toolkit. " O’Reilly Media, Inc.".
- Busselle and Shrum (2003) Busselle, R. W.; and Shrum, L. 2003. Media exposure and exemplar accessibility. Media Psychology 5(3): 255–282.
- Card et al. (2022) Card, D.; Chang, S.; Becker, C.; Mendelsohn, J.; Voigt, R.; Boustan, L.; Abramitzky, R.; and Jurafsky, D. 2022. Computational analysis of 140 years of US political speeches reveals more positive but increasingly polarized framing of immigration. Proceedings of the National Academy of Sciences 119(31): e2120510119.
- Chawla, Japkowicz, and Kotcz (2004) Chawla, N. V.; Japkowicz, N.; and Kotcz, A. 2004. Special issue on learning from imbalanced data sets. ACM SIGKDD explorations newsletter 6(1): 1–6.
- Chen et al. (2021) Chen, L.; Lyu, H.; Yang, T.; Wang, Y.; and Luo, J. 2021. Fine-grained analysis of the use of neutral and controversial terms for COVID-19 on social media. In International Conference on Social Computing, Behavioral-Cultural Modeling and Prediction and Behavior Representation in Modeling and Simulation, 57–67. Springer.
- Conover et al. (2011) Conover, M.; Ratkiewicz, J.; Francisco, M.; Gonçalves, B.; Menczer, F.; and Flammini, A. 2011. Political polarization on twitter. In Proceedings of the international aaai conference on web and social media, volume 5, 89–96.
- Devlin et al. (2019) Devlin, J.; Chang, M.; Lee, K.; and Toutanova, K. 2019. BERT: Pre-training of Deep Bidirectional Transformers for Language Understanding. In Burstein, J.; Doran, C.; and Solorio, T., eds., Proceedings of the 2019 Conference of the North American Chapter of the Association for Computational Linguistics: Human Language Technologies, NAACL-HLT 2019, Minneapolis, MN, USA, June 2-7, 2019, Volume 1 (Long and Short Papers), 4171–4186. Association for Computational Linguistics.
- Fiorina, Abrams, and Pope (2005) Fiorina, M. P.; Abrams, S. J.; and Pope, J. C. 2005. Culture war. The myth of a polarized America 3.
- Gentzkow and Shapiro (2010) Gentzkow, M.; and Shapiro, J. M. 2010. What drives media slant? Evidence from US daily newspapers. Econometrica 78(1): 35–71.
- Guess et al. (2021) Guess, A. M.; Barberá, P.; Munzert, S.; and Yang, J. 2021. The consequences of online partisan media. Proceedings of the National Academy of Sciences 118(14): e2013464118.
- Japkowicz et al. (2000) Japkowicz, N.; et al. 2000. Learning from imbalanced data sets: a comparison of various strategies. In AAAI workshop on learning from imbalanced data sets, volume 68, 10–15. AAAI Press Menlo Park, CA.
- Kiesel et al. (2019) Kiesel, J.; Mestre, M.; Shukla, R.; Vincent, E.; Adineh, P.; Corney, D.; Stein, B.; and Potthast, M. 2019. SemEval-2019 Task 4: Hyperpartisan News Detection. In Proceedings of the 13th International Workshop on Semantic Evaluation, 829–839. Minneapolis, Minnesota, USA: Association for Computational Linguistics.
- Kingma and Ba (2014) Kingma, D. P.; and Ba, J. 2014. Adam: A method for stochastic optimization. arXiv preprint arXiv:1412.6980 .
- Krumpal (2013) Krumpal, I. 2013. Determinants of social desirability bias in sensitive surveys: a literature review. Quality & quantity 47(4): 2025–2047.
- Landis and Koch (1977) Landis, J. R.; and Koch, G. G. 1977. The measurement of observer agreement for categorical data. biometrics 159–174.
- Levendusky and Malhotra (2016) Levendusky, M.; and Malhotra, N. 2016. Does media coverage of partisan polarization affect political attitudes? Political Communication 33(2): 283–301.
- Lin, Bagrow, and Lazer (2011) Lin, Y.-R.; Bagrow, J.; and Lazer, D. 2011. More voices than ever? quantifying media bias in networks. In Proceedings of the International AAAI Conference on Web and Social Media, volume 5, 193–200.
- Lundberg and Lee (2017) Lundberg, S. M.; and Lee, S.-I. 2017. A unified approach to interpreting model predictions. Advances in neural information processing systems 30.
- Lyu and Luo (2022) Lyu, H.; and Luo, J. 2022. Understanding Political Polarization via Jointly Modeling Users, Connections and Multimodal Contents on Heterogeneous Graphs. In Proceedings of the 30th ACM International Conference on Multimedia, 4072–4082.
- Lyu et al. (2022) Lyu, H.; Wang, J.; Wu, W.; Duong, V.; Zhang, X.; Dye, T. D.; and Luo, J. 2022. Social media study of public opinions on potential COVID-19 vaccines: informing dissent, disparities, and dissemination. Intelligent medicine 2(01): 1–12.
- Minar and Naher (2018) Minar, M. R.; and Naher, J. 2018. Violence originated from Facebook: A case study in Bangladesh. arXiv preprint arXiv:1804.11241 .
- Monroe, Colaresi, and Quinn (2008) Monroe, B. L.; Colaresi, M. P.; and Quinn, K. M. 2008. Fightin’words: Lexical feature selection and evaluation for identifying the content of political conflict. Political Analysis 16(4): 372–403.
- Pedregosa et al. (2011) Pedregosa, F.; Varoquaux, G.; Gramfort, A.; Michel, V.; Thirion, B.; Grisel, O.; Blondel, M.; Prettenhofer, P.; Weiss, R.; Dubourg, V.; Vanderplas, J.; Passos, A.; Cournapeau, D.; Brucher, M.; Perrot, M.; and Duchesnay, E. 2011. Scikit-learn: Machine Learning in Python. Journal of Machine Learning Research 12: 2825–2830.
- Pennebaker, Francis, and Booth (2001) Pennebaker, J. W.; Francis, M. E.; and Booth, R. J. 2001. Linguistic inquiry and word count: LIWC 2001. Mahway: Lawrence Erlbaum Associates 71(2001): 2001.
- Potthast et al. (2018) Potthast, M.; Kiesel, J.; Reinartz, K.; Bevendorff, J.; and Stein, B. 2018. A Stylometric Inquiry into Hyperpartisan and Fake News. In Proceedings of the 56th Annual Meeting of the Association for Computational Linguistics (Volume 1: Long Papers), 231–240. Melbourne, Australia: Association for Computational Linguistics.
- Recuero, Soares, and Gruzd (2020) Recuero, R.; Soares, F. B.; and Gruzd, A. 2020. Hyperpartisanship, disinformation and political conversations on Twitter: The Brazilian presidential election of 2018. In Proceedings of the international AAAI conference on Web and social media, volume 14, 569–578.
- Rehurek and Sojka (2011) Rehurek, R.; and Sojka, P. 2011. Gensim–python framework for vector space modelling. NLP Centre, Faculty of Informatics, Masaryk University, Brno, Czech Republic 3(2).
- Sadilek et al. (2013) Sadilek, A.; Brennan, S.; Kautz, H.; and Silenzio, V. 2013. nEmesis: Which restaurants should you avoid today? In First AAAI Conference on Human Computation and Crowdsourcing.
- Vincent and Mestre (2018) Vincent, E.; and Mestre, M. 2018. Crowdsourced Measure of News Articles Bias: Assessing Contributors’ Reliability. In SAD/CrowdBias@ HCOMP, 1–10.
- Waller and Anderson (2021) Waller, I.; and Anderson, A. 2021. Quantifying social organization and political polarization in online platforms. Nature 600(7888): 264–268.
- Weld, Glenski, and Althoff (2021) Weld, G.; Glenski, M.; and Althoff, T. 2021. Political Bias and Factualness in News Sharing across more than 100,000 Online Communities. arXiv preprint arXiv:2102.08537 .
- Westfall et al. (2015) Westfall, J.; Van Boven, L.; Chambers, J. R.; and Judd, C. M. 2015. Perceiving political polarization in the United States: Party identity strength and attitude extremity exacerbate the perceived partisan divide. Perspectives on Psychological Science 10(2): 145–158.
- Yang et al. (2016) Yang, J.; Rojas, H.; Wojcieszak, M.; Aalberg, T.; Coen, S.; Curran, J.; Hayashi, K.; Iyengar, S.; Jones, P. K.; Mazzoleni, G.; et al. 2016. Why are “others” so polarized? Perceived political polarization and media use in 10 countries. Journal of Computer-Mediated Communication 21(5): 349–367.
- Zhang et al. (2021) Zhang, Y.; Lyu, H.; Liu, Y.; Zhang, X.; Wang, Y.; Luo, J.; et al. 2021. Monitoring depression trends on twitter during the COVID-19 pandemic: observational study. JMIR infodemiology 1(1): e26769.
- Zhou et al. (2022) Zhou, E.; Liu, Y.; Lyu, H.; and Luo, J. 2022. A Fine-Grained Analysis of Public Opinion toward Chinese Technology Companies on Reddit. arXiv preprint arXiv:2201.05538 .
- Zillmann (1999) Zillmann, D. 1999. Exemplification theory: Judging the whole by some of its parts. Media psychology 1(1): 69–94.
Appendix A Supplemental Material
Implementation Details
Text preprocessing
We clean our dataset with the following process. First, we remove all Unicode characters and punctuation symbols. We then transform all the text into lowercase. Additionally, we tokenize and lemmatize each word. Finally, the stop words are removed. Tokenization and lemmatization are integrated by using functions from the nltk library (Bird, Klein, and Loper 2009).
BERT-base model
We fine-tune a vanilla BERT-base model on 2,000 manually labeled titles for 15 epochs and evaluate our model on an external validation set with 200 titles. We choose 32 as the batch size for the training set and 200 as the batch size for the validation set. We select the Adam optimizer (Kingma and Ba 2014) with , , and . The learning rate is .
Bag-of-words model
We first identify all the bigrams in our training set. We then build the co-occurrence matrix. The feature of each title is represented by the mean of word vectors, which are the row vectors from the co-occurrence matrix. After extracting the feature representation of the title, we train the model using an XGBoost classifier with 200 estimators.
TF-IDF model
We exploit the TF-IDF feature extractor from the sklearn library (Pedregosa et al. 2011). Next, the TF-IDF features are calculated and fed into an XGBoost classifier with 200 estimators.
Word2Vec model
We implement the Word2Vec model using the Gensim library (Rehurek and Sojka 2011), which offers open-source natural language processing models. The title representation is the average of each word vector. We train the model using an XGBoost classifier with 200 estimators.
Validity Verification for Hyperpartisan Title Detection
Pretrained models may introduce unknown bias from the pretraining data (Card et al. 2022). To verify that our results (Figure 2 in the main paper) are not significantly influenced by BERT-base, we repeat the hyperpartisanship inference for all the 1.8 million titles using XGBoost classifiers with bag-of-words features and replicate Figure 2. The replication is shown in Figure 5. We find that the overall characteristics and trends do not change.
Search Keywords of Each Topic
The name and adjective of each foreign country are used as the search keywords to identify the foreign issue topic. For political system and societal issue, we only use the related words in Table 5. A manual verification of 50 samples of each topic is performed. Almost all identified titles are related to the topics we find.