2021
[1]\fnmChristopher Julian \surSchauerte
[1]\orgdivInstitute of Aerodynamics, \orgnameRWTH Aachen University, \orgaddress\streetWüllnerstraße 5a, \cityAachen, \postcode52062, \stateNRW, \countryGermany
Experimental investigation on the turbulent wake flow in fully-established transonic buffet conditions
Abstract
The transonic flight regime is often dominated by transonic buffet, a highly unsteady and complex shock-wave/boundary-layer interaction involving major parts of the flow field. The phenomenon is associated with a large-amplitude periodic motion of the compression shock coupled with large-scale flow separation and intermittent re-attachment. Due to the resulting large-scale variation of the global flow topology, also the turbulent wake of the airfoil or wing is severely affected, and so are any aerodynamic devices downstream on which the wake impinges. To analyze and understand the turbulent structures and dynamics of the wake, we performed a comprehensive experimental study of the near wake of the supercritical OAT15A airfoil in transonic buffet conditions at a chord Reynolds number of . Velocity field measurements reveal severe global influences of the buffet mode on both the surface-bound flow field on the suction side of the airfoil and the wake. The flow is intermittently strongly separated, with a significant momentum deficit that extends far into the wake. The buffet motion induces severe disturbances and variations of the turbulent flow, as shown on the basis of phase-averaged turbulent quantities in terms of Reynolds shear stress and RMS-values. The spectral nature of downstream-convecting fluctuations and turbulent structures are analyzed using high-speed focusing schlieren sequences. Analyses of the power spectral density pertaining to the vortex shedding in the direct vicinity of the trailing edge indicate dominant frequencies one order of magnitude higher than those associated with shock buffet () vs. ). It is shown that the flapping motion of the shear layer is accompanied by the formation of a von Kármán-type vortex street of fluctuating strength. These wake structures and dynamics will impact any downstream aerodynamic devices affected by the wake. Our study therefore allows conclusions regarding the incoming flow of devices such as the tail plane.
keywords:
Transonic buffet, Airfoil, Supercritical, Shock wave, SWBLI,Turbulent flow, Wake,Vortex shedding1 Introduction
The transonic flight regime is often characterized by the occurrence of local supersonic regions on the suction side of airfoils and wings, which are terminated by a shock wave (McDevitt1985, ). For sufficiently strong interactions, shock-induced flow separation may span the entire region from the shock to the trailing edge (Molton2013, ). For certain combinations of Mach number, Reynolds number, and angle of attack, the transonic flow about the airfoil becomes unsteady, and the compression shock and separated boundary layer carry out periodic oscillations (McDevitt1985, ). The resulting complex shock-wave/boundary-layer interaction involves major parts of the flow field (Jacquin2009, ) and is typically referred to as transonic buffet. The self-sustained dynamic back-and-forth motion of the shock wave is accompanied by strong variations of the shock strength, thus inciting a periodic thickening and shrinking of the separated shear layer Iovnovich_Raveh2012 . This self-excited periodic phenomenon is, inter alia, associated with a highly unsteady flow field (Molton2013, ), which results in low-frequency fluctuation of the integral aerodynamic quantities, i.e. the lift and drag coefficients (Crouch2008, ; Benoit_Legrain1987, ).
For specific frequencies of this periodic change between a severely separated boundary layer and periods of mostly reattached flow, the aerodynamic phenomenon and the aircraft structure may interact. This mechanical coupling with the airframe can lead to a resonance of the wing (the so-called buffeting), inciting a potentially deleterious effect on the structural integrity (Benoit_Legrain1987, ; Crouch2008, ).
As the buffet onset constrains the usable range of the flight envelope (Benoit_Legrain1987, ; Molton2013, ), its understanding is one of the major challenges in the design of modern civil aircraft (Crouch2019, ; Jacquin2016, ). The number of applications of supercritical airfoils increases with the increasing demand for fast air travel. Therefore, the overall efficiency of modern civil aircraft becomes more and more relevant and the significance of a thorough understanding of the buffet phenomenon increases, as it is a prerequisite to identify and potentially shift the limits of the flight envelope.
Several possible explanations for the underlying mechanisms of this oscillatory shock motion have been suggested. The well-established model proposed by Lee1990 and refined by Hartmann2013 describes this motion as a feedback loop. According to the model, two sequential phases of downstream and upstream propagation of disturbances form the recurring buffet cycle. The shock motion initiates pressure waves that subsequently propagate downstream to the trailing edge. The interaction with the latter emits disturbances that travel upstream along the airfoil surface. These disturbances provide the energy required to maintain the back and forth motion of the shock wave and thus close the feedback loop. Crouch et al. Crouch2008 linked the buffet onset with a global instability of the flow, and thus contributed significantly to the perception of the phenomenon and enhanced the prediction of the buffet onset.
The majority of studies concerned with transonic buffet aim at contributing to a profound understanding of the underlying mechanisms to mitigate buffet and finally prevent the structural response. Substantially less attention has been dedicated to the evolution of the buffet-induced turbulent wake. Regarding the practical implementation in civil aircraft, however, also the influence of the wake on aerodynamic devices downstream of the wing, such as tail plane control surfaces, is crucial, as it may affect their performance.
The formation of wakes downstream of airfoils has been studied for either low-Reynolds number flows Gunasekaran2018 , non-buffet conditions Epstein1988 ; AlshabuOlivier2008 , or mostly laminar flow configurations Zauner2020 . Only Szubert et al. Szubert2015 addressed fully-established shock buffet in turbulent flow at high-Reynolds number and replicated the conditions identified relevant for pronounced buffet by Jacquin et al. Jacquin2009 in terms of Mach number, angle of attack, and chord-based Reynolds number.
The suction-side-bound oscillatory flow mode of the airfoil and the complex dynamics inherent to the turbulent wake appear to be coupled Szubert2015 ; Zauner2020 . A similarly complex interplay between the two domains was also observed for other transonic flows that comprise pronounced vortex streets, e.g. double-wedge profiles with strong separation Franke1989 .
For flow configurations with large wake fluctuations in the context of unsteady shock motion, Lee et al. Lee1994 studied the formation of upstream traveling waves. These waves were advanced as an essential element to predict the periodic shock oscillation Lee1990 . Tijdeman Tijdeman1977 interpreted these waves as an immediate consequence to changes in the flow conditions at the trailing edge of the airfoil and denoted them as Kutta waves.
For laminar buffet conditions, Zauner and Sandham Zauner2020 identified a complex interplay between Kelvin-Helmholtz instabilities in the surface-bound flow towards the rear part of the airfoil, the formation of a von Karman vortex street aft of the trailing edge, and subsequently shed pressure waves traveling upstream towards to the shock wave. Based on a modal analysis of an established buffet flow using proper orthogonal decomposition, Szubert et al. Szubert2015 showed an interaction between the vortex shedding mode and the buffet mode. Events of massive flow separation – not necessarily driven by developed buffet – may thus give rise to von Kármán-like vortex shedding in the vicinity of the trailing edge and beyond in the near wake Szubert2015 . Pressure sensors placed along the airfoil upper surface and in the near wake captured strong secondary fluctuations (in addition to the primary buffet oscillation) over a broad range of chordwise stations. These fluctuations were attributed to a von Kármán mode and persisted throughout the entire near-wake domain downstream of the trailing edge Szubert2015 . Power spectra of the wall-pressure signals showed the characteristic low-frequency () footprint of shock buffet.
For a more global, integral perspective of an entire aircraft, it is necessary to also quantify the dynamics that the buffet phenomenon imposes on the aircraft structure and control surfaces via the wake of the wing or airfoil. The quantitative importance of the wake unsteadiness to the aerodynamic performance of a civil transonic aircraft has yet to be determined. As a first step, the present work assesses the region around the airfoil rear section and the near wake in detail for fully-established buffet conditions, since fully-established buffet represents the most severe dynamic conditions.
We characterize the temporal and spatial structure of the separated boundary layer and near wake with particular focus on the variation over the buffet cycle. A careful assessment of the wake structure and involved dynamics is the essential groundwork for understanding the complex interaction of a fully-established buffet configuration with a tail plane. To the authors’ knowledge, this is the first experimental investigation to focus explicitly to the evolution of the buffet-dominated periodic fluctuation of the near wake field by means of optical flow measurement techniques.
2 Experimental methods and setup
We briefly introduce the experimental facility and investigated airfoil models, before presenting an overview of the applied measurements arrangement. The section is complemented with fundamental considerations of vector field post-processing that form the basis for subsequent sections.
2.1 Wind-tunnel facility and model
Our experiments were conducted in the closed-circuit Trisonic Wind Tunnel at the Institute of Aerodynamics, RWTH Aachen University. The Trisonic Wind Tunnel is an intermittently-operated vacuum-type indraft facility. Based on interchangeable test sections and adjustable nozzle geometries, it can provide Mach numbers between . Continuously run screw-type compressors evacuate a vacuum chamber with a total volume of downstream of the test section and transport the air through a dryer bed before it enters a large air reservoir at ambient conditions. Turnaround times of approximately 7 minutes are achieved. The relative humidity of the air is kept below 4 % to preclude condensation effects and falsifications of the measured shock location (Binion1988, ). A measurement cycle is initialized by the actuation of a fast-acting valve that allows the high and low pressure sections to retrieve equilibrium conditions, thus drafting the measurement medium from the balloon through the test section into the vacuum tanks. In each measurement cycle, stable flow conditions are obtained for 2 to 3 seconds, depending on the configured Mach number. The obtainable Reynolds number is a function of the selected Mach number and the ambient conditions of the resting, pre-dried air in the reservoir. The turbulence intensity based on the freestream velocity fluctuation of the wind tunnel is below 1 %.
For the present study, measurements were conducted at , which is equivalent to a free-stream velocity of . For the investigated airfoil, a chord-based Reynolds number of is obtained. These conditions require the transonic operation mode. The transonic test section features a rectangular cross section of 400 mm x 400 mm and a total length of 1,410 mm.
It is equipped with flexible upper and lower walls to compensate the influence of solid walls confining the flow and to emulate conditions in terms of streamline contouring observed in the equivalent free, unconfined flow around the same airfoil geometry (McDevitt1982, ).
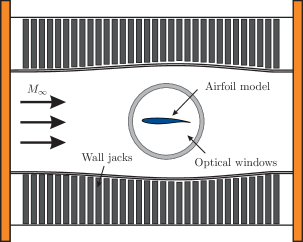
We studied buffet on the supercritical OAT15A airfoil. The two-dimensional wind tunnel model has a relative thickness of 12.3 % and features a total span of 399 mm, which is equivalent to the width of the test section. A chord length of was chosen, giving an aspect ratio of approx. 2.66. The upper and lower half of the model were manufactured from stainless steel, along with a trailing edge made of metal particle-filled epoxy resin. The center of rotation for the angle of attack is located at about mid-chord of the airfoil.
Fig. 1 shows a schematic representation of the airfoil installed in the optically accessible test section.
2.2 Measurement arrangement
Flow visualizations are obtained with a focusing schlieren setup, where extended grids illuminated by correspondingly large illuminated surfaces replace the point-shaped light sources used in classical schlieren arrangements Schardin1942 ; Settles2001 . A focusing schlieren system inspired by Weinstein’s approach Weinstein1993 has been developed by the authors (Schauerte_Schreyer2018, ) to explore flow configurations in the transonic and supersonic flow regime.
This system overcomes some of the limitations of classical schlieren configurations, in particular the close to infinite depth of focus that results in strong line-of-sight integration. We require the ability to focus on narrow slices of the flow to be able to analyze our highly unsteady and partially three-dimensional flow of interest.
The flow was illuminated by a 3x3 array of 15W high-power LEDs together with a constant-current source with an electric output adjustable between 50 W and 120 W. The source grid consists of CNC-machined alternating clear and opaque lines, the cutoff grid is an exact photographic negative of the source grid. A large 470 mm Fresnel lens, placed slightly ahead of the source grid, captures major portions of the light intensity, illuminates the source grid evenly bright by reshaping the light cone, and redirects the light beam through the test section past the model and onto the schlieren lens. The illuminated measurement area around the spanwise centerplane of the airfoil has a diameter of 280 mm. However, the outer edges are subject to vignetting due to the light beam passing through two consecutive circular windows. An effective field of view (FOV) without vignetting of was achieved, using a magnification of 0.2 between the two grids in conjunction with the relay optics and a 35 mm camera lens.
To temporally resolve the oscillatory motion of the shock, the schlieren visualizations were recorded with a Photron SA-5 CMOS high-speed camera at a frame rate of 20 kHz and with a short exposure of . For the high-speed recording, a FOV of width and height is projected on the camera sensor, yielding an effective resolution of 4.05 px/mm.
The focusing schlieren setup was operated with a horizontally aligned cutoff grid to capture vertical density gradients. From these measurements, we extracted the temporal development of the SWBLI and the near wake, the shock position and amplitude, as well as the shock oscillation frequencies.
To acquire detailed velocity data, we applied particle image velocimetry (PIV). Planar measurements are performed in a streamwise/wall-normal plane along the centerline of the airfoil model.
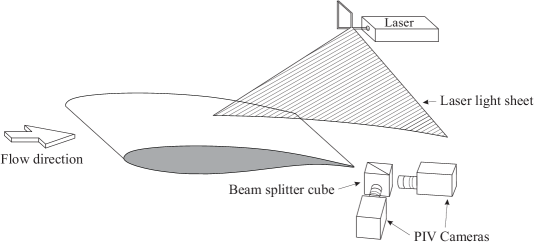
A Litron Nano PIV double pulsed Nd:YLF laser, operating at a wavelength of 527 nm, produces a light sheet of 1.5 mm thickness. The large laser-pulse energy of 200 mJ/pulse with a pulse duration of 4 ns ensures a high signal-to-noise ratio. The flow is seeded with di-ethyl-hexyl-sebacate (DEHS) tracer droplets with a mean diameter of 1 . Particle images are captured using two identical FlowSense EO 11M CCD cameras with a resolution of 11 megapixels, which corresponds to a sensor resolution of 4,008 pixels x 2,672 pixels at a pixel size of . Both cameras are focused on the same field of view (FoV) to increase the acquisition rate to 10 Hz. The FoV covers both the vicinity of the airfoil trailing edge and the near wake. It is wide and high, thus spanning a streamwise domain from 0.6 c to 1.7 c. Based on the magnification of 4.04, a spatial resolution of is obtained. With a final interrogation-window size of 16 px x 16 px at an overlap of 50 %, the resulting velocity maps feature a vector spacing of 0.29 mm. Relevant parameters of the focusing schlieren and PIV tests are summarized in table 1.
| Particle image velocimetry setup Focusing Schlieren setup | ||||||
| Sensor resolution | 4008 x 2672 | px x px | Sensor resolution | 704 x 520 | px x px | |
| FOV width | 150 | mm | FOV width | 180 | mm | |
| FOV height | 80 | mm | FOV height | 150 | mm | |
| Acquisition rate | 10 | Hz | Acquisition rate | 20,000 | Hz | |
| Exposure | 11 | Shutter speed | 1/525,000 | s | ||
| Spatial resolution | 27.56 | px/mm | Spatial resolution | 4.05 | px/mm | |
2.3 Identification of buffet phases
Preceding analyses of the buffet flow around the OAT15A airfoil (see Schauerte_Schreyer2022a ) with a field of view covering the entire suction side from 0.1 c to 1.1 c. revealed large-scale global modifications of the flow topology throughout the buffet cycle (see also Fig. 3).
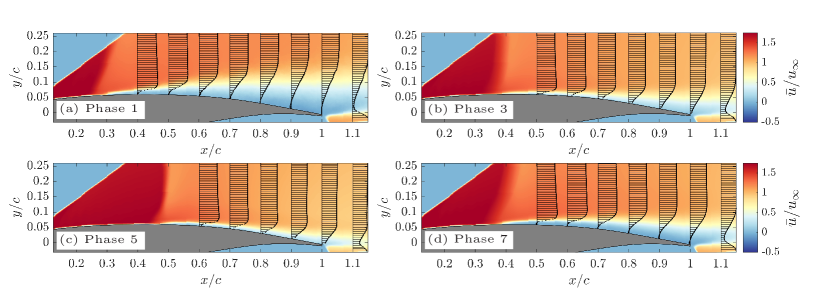
Since the shock motion covers almost of the chord and is coupled with intermittent flow separation and reattachment, statistics for discrete phases of the buffet cycle are more meaningful than a global mean. The contour maps in Fig. 3 show the shock’s most upstream location (a), an intermittent chord wise postion during downstream (b), and upstream (d) motion, as well as the shock most downstream location (c).
Individual buffet phases can be unambiguously assessed based on the instantaneous shock location, the shape of the shock front, and the shock inclination near the airfoil contour for each uncorrelated snapshot Schauerte_Schreyer2022a . Based on a sufficiently large overlap between the fields of view in the present and the earlier Schauerte_Schreyer2022a measurement campaign, the latter quantities were applied to the rear portion of the airfoil and the near wake, yet excluding the actual shock wave. The procedure and evaluated parameters are clarified in Fig. 4.
First, the integral velocity magnitude within the rectangular analysis window in Fig. 4 (4) is evaluated in terms of the percentage of vectors that exceed or stay below a certain threshold (). Threshold values were previously identified to uniquely describe the chordwise location of the shock and thus allow the definition of characteristic phases within the buffet cycle. This procedure allows to pre-assign the snapshots to the respective buffet phases. This criterion was complemented by considering the height of the low-momentum bubble (see Fig. 4 (5)). However, due to similar velocity defects for phases of final upstream motion and incipient downstream motion, some ambiguity remains in this first classification.
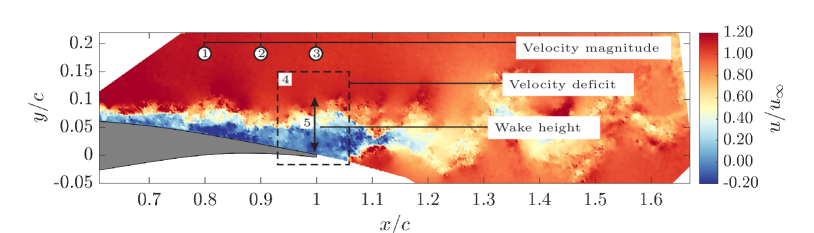
Second, the streamwise velocity magnitude at three chordwise stations (location (1), (2), and (3); Fig. 4) were compared with reference values from the predefined phase assignment (see Fig. 3) for each snapshot.
An analysis of the thus finally obtained phase assignment in the field of view covering the entire airfoil suction side (studied in Schauerte_Schreyer2022a ) revealed that each buffet phase induces characteristic velocity defects. These deficits are modulated by the direction of motion and strength of the shock wave. This third criterion is independent of the velocity deficit in the strongly separated region and can eliminate the last ambiguity in the phase assignment.
Finally, as a consistency check, the velocity profiles at the chordwise stations between to of the present case and the case studied in Schauerte_Schreyer2022a were examined for congruence. The results showed excellent agreement (less than deviation), which proofs that we can successfully identify the respective buffet phase of a snapshot without directly knowing the shock position.
3 Results and discussion
Since the flow varies considerably throughout a buffet cycle, and these variations have a strong impact on the wake of the airfoil, we begin this section with a short discussion of the flow topology on the airfoil suction side for fully-estasblished buffet conditions. We then briefly discuss the rear section of the airfoil and near-wake region () on the basis of ensemble-averaged velocity maps. Subsequently, we discuss the wake structure in detail, using phase-distinguished representations of instantaneous and averaged velocity fields in the streamwise and vertical directions. We also provide a discussion of turbulent quantities and the vorticity, as well as a spectral analysis of the vortex shedding at the trailing edge.
3.1 Shock-buffet induced variation of the flow topology
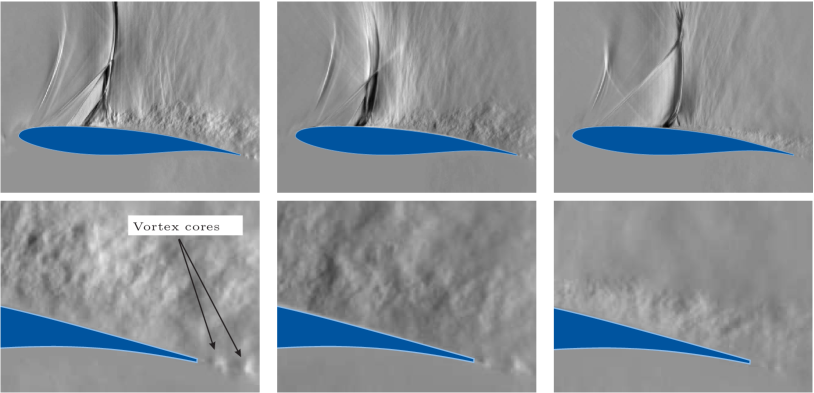
In our previous study Schauerte_Schreyer2022a ; Schauerte_Schreyer2022b , we acquired high-speed focusing schlieren sequences capturing the temporal evolution of the flow topology, in particular the low-frequency shock oscillation. An overview of selected phases of the buffet cycle is given in Fig. 5, which emphasizes the huge periodic variation of the flow, synchronized with a back and forth motion of the shock wave that covers approx. of the airfoil chord. The images indicate a strongly turbulent wake with numerous turbulent eddies of varying size.
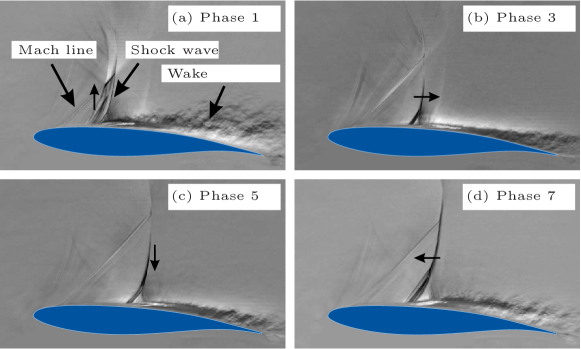
We identified eight characteristic phases throughout a buffet cycle, primarily determined by the respective shock location and direction of shock motion (either upstream or downstream). Phase 1 (Fig. 5 (a)) corresponds to the most upstream shock location close to the reversal point, for which the separated boundary layer thickens strongly and the wake is of large surface-normal extent. The downstream motion of the shock wave is accompanied by a continuous straightening of the shock and a successive reduction in separation Schauerte_Schreyer2022a ; Schauerte_Schreyer2022b , which can be seen in phase 3 according to Fig. 5 (b). The minimum extent of the separation region is reached in phase 5 (see Fig. 5 (c)), around the shock’s most downstream location. While the shock wave is oblique in phase 1 (shock is at an angle of about to the horizontal line), it is almost normal to the surface in phase 5 (Fig. 5 (c)). At the onset of the shock’s upstream motion in phase 7 (see Fig. 5 (d)), the shock starts to tilt back and the separation region increases. The distinct lambda shock pattern is characteristic of this type of flow and is discernible in all snapshots, however the vertical triple point location changes considerably with the current chordwise location of the shock wave and its direction of motion.
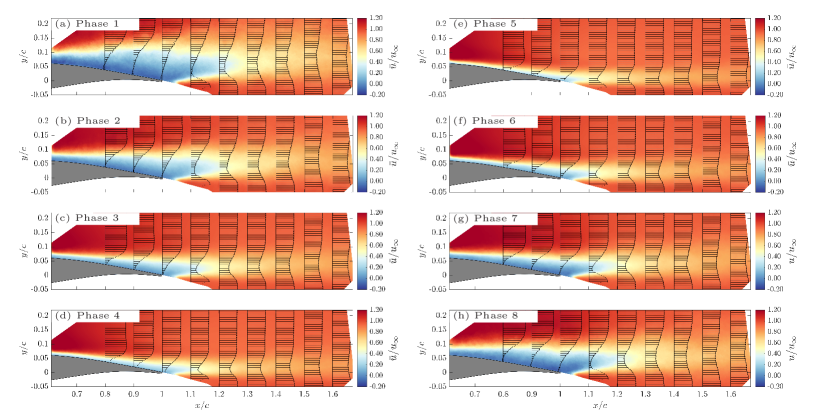
To account for the large-scale variation of the global flow topology, we carried out a phase-averaged description of the velocity fields from PIV according to the phases discussed in the previous paragraph and following the procedure outlined in Sec. 2.3. Fig. 3 shows the resulting phase-averaged streamwise velocity contours and profiles for the phases corresponding to the Schlieren visualizations shown in Fig. 5. We present a brief summary of the strongly varying flow topology and behavior throughout a buffet cycle here, since it lays the basis the subsequent exploration of the wake properties. An in-depth discussion of this data is provided in Schauerte_Schreyer2022a and Schauerte_Schreyer2022b .
The first phase includes all instantaneous flow representations with far upstream shock locations. It is characterized by massive flow separation (see Fig. 3 (a)). The severity of the flow separation is further substantiated in the great velocity deficit in the near-wake velocity profile at . Phase 2 (not shown) represents the phase of incipient downstream motion of the shock wave. Compared with phase 1, the shock line is less oblique. This trend is seen to continue in phase 3 (Fig. 3 (b)), in which the vertical extent of the wake and its related momentum deficit have reduced by almost compared with phase 1. The continued downstream displacement of the shock wave from to between phases 3 and 4 is accompanied by a further contraction of the turbulent wake, most apparent in fuller velocity profiles close to the wall (not shown here; see Schauerte_Schreyer2022a ; Schauerte_Schreyer2022b ). Phase 5 (see Fig. 3 (c)) denotes the most downstream shock location . The shape of the shock line is now exactly normal, and the -region has reached a minimal extent. The flow is completely attached all along the suction side, and the wake influence is only noticeable in the immediate vicinity of the airfoil contour. Phases 6 (not shown) and 7 (Fig. 3 (d)) capture the incipient upstream motion of the shock. The maximum upstream shock velocity is not yet reached, however, both wake size and the velocity deficit close to the wall are greater than in the corresponding equivalent shock location in phases 3 and 4 during the shock downstream motion. The velocity profiles of phase 7 are significantly less full than for phase 5, and the wake increases. The velocities therefore contain negative values all the way until the TE. The distinct obliqueness of the shock line and the large -structure are both finely reproduced in the PIV data. The final phase of the shock upstream motion is represented by phase 8 (not shown), in which the identified low-momentum wake protrudes even farther into outer flow field than in the previous phase, and the induced momentum deficit is significantly more severe. The deficit even results in a small region of reverse flow close to the airfoil surface with a vertical extent of above the trailing edge, comparable to phase 1 (Fig. 3 (a)).
3.2 Evolution of the shock-induced wake throughout the buffet cycle
The extent of the turbulent wake varies strongly throughout the buffet cycle (compare Fig. 5). Its extent is coupled with the direction of motion of the shock. Since the shock motion is periodic, we expected a phase coupling of the wake size with the shock position. To verify this assumption, we estimated the relative size of the turbulent shear layer and wake along the chord length throughout the buffet cycle. A gradient-based detection was applied to the time-resolved schlieren sequences to extract the respective edges of the shear layer. Then, the area enclosed by these edges was calculated and used as an estimate of the turbulent wake area . Overall, we evaluated 60 complete buffet cycles, i.e. over 10,000 images. The time history of the shock position (in relation to the chord length) and separated wake area (normalized with its temporal mean extent ) are shown in Fig. 6.
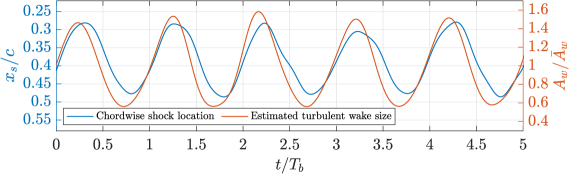
The quantities seem to be phase-locked and thus oscillate at an identical frequency, but at an almost constant small phase shift. The wake area precedes the shock motion by approximately 0.3491 rad at its most upstream, and by 0.5585 rad at its most downstream location. The wake size reaches its minimum extent shortly before the shock occupies its most downstream location. The wake size already begins to increase before the shock passes its reversal point, and reaches its maximum towards the final phase of the shock upstream movement. Overall, the wake area almost doubles its size within a full buffet cycle and performs a pronounced, recurrent flapping motion.
3.3 Mean velocity maps in the near wake
Before discussing the strong periodic variation of the wake flow field, we present ensemble-averaged velocity maps of the streamwise and vertical velocity components in Figs. 7 and 8, respectively. This global representation approximates the temporally-averaged flow physics and allows to assess the integral impact of the buffet state.
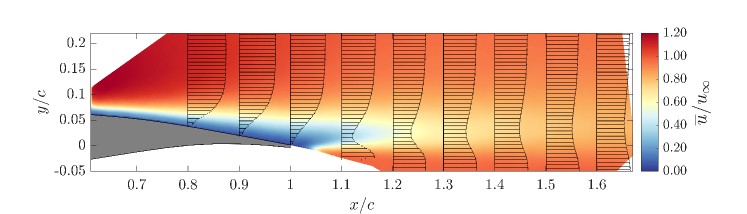
The mean streamwise contour map (Fig. 7) indicates a large region of intermittently separated flow: the momentum deficit near the trailing edge approaches . As will be shown later in the context of Fig. 10, this region is a result of the vigorous shock dynamics, in particular phases of upstream shock motion, for which reverse flow extends over large parts of the rear of the airfoil up until the trailing edge. The greatest velocity deficit occurs close to the surface and in the inner wake core region (visible as blue streak with in Fig. 7). The low-momentum dent increases with downstream development. Furthermore, the wake center shifts slightly upwards.
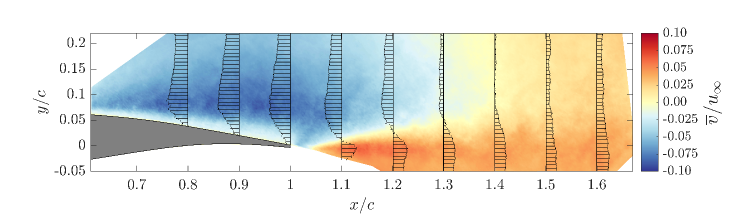
The wall-normal velocity field is structured into three characteristic subdomains (see Fig. 8): a pronounced downwash region along the aft section of the airfoil, an upwash region downstream of the trailing edge, which emanates from the pressure side, and a region of almost vanishing -component further downstream of the airfoil in the upper half of the wake. These regions are captured by the velocity profiles at chordwise stations to . At aft of the trailing edge, a sharp distinction between up- and downwash is dominant. The upwash from the pressure side seems to gradually overcompensate the downwash component, yielding a close-to-zero vertical flow component in the upper half of the captured domain at .
3.4 Modification of the wake velocity field by buffet
Despite the considerable level of turbulent perturbations in instantaneous flow representations, they convey important features characterizing the nature of the dynamic flow field that are precluded in phase- or ensemble-averaged velocity contours. These features include turbulent structures, shedding of vortices, and the overall extent of the turbulent wake.
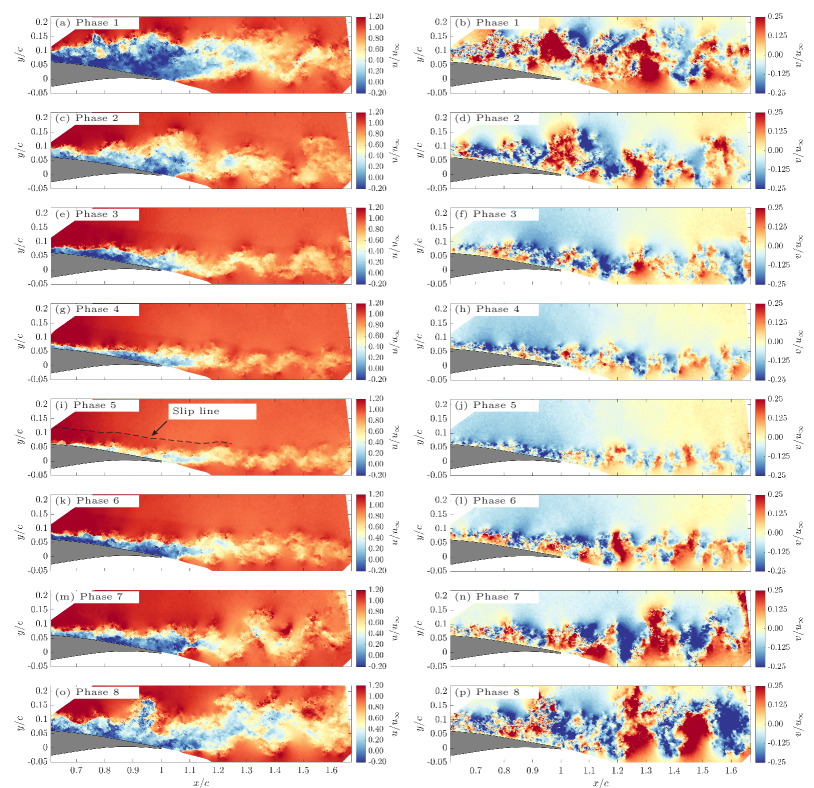
The instantaneous vertical velocity contours show a turbulent wake of large extent in all phases of far upstream shock locations, namely phases 1, 2, 7, and 8 (see Figs. 9 (b), (d), (n), (p)). In comparison, the flow topology gradually recovers when the shock progresses towards its most downstream location (phases 3, 4, and 5 in Figs. 9 (e), (h), and (k). Turbulent structures are confined to a narrow band, as most clearly visible in phase 5 (Fig. 9 (j)).
The slip line emanating from the triple point location of the lambda shock (marked with a dashed line in Fig. 9 (i)) is nicely captured in the streamwise component (left column of Fig. 9), and most clearly reproduced in phases 4, 5, and 6 (Fig. 9 (g), (i), and (k)) with smaller separation regions. The large separation in the remaining phases widens the lambda structure and pushes the triple point upwards.
Phases of pronounced momentum deficit and large-scale separation (phases 1, 2, 7, and 8) show concomitant intense perturbations in the wall-normal velocity. These manifest themselves in a regular pattern of alternating velocity regions of opposite sign, forming interlaced structures with positive (upwards) contributions from the pressure side and negative (downwards) contributions from the suction side.
The size and intensity of these velocity perturbations vary considerably in sync with the buffet cycle. Coherent patches of positive or negative wall-normal velocity fluctuation are largest when the shock is far upstream, and shrink with downstream shock displacement. The fluctuation magnitude of remains almost constant between and , which suggests a relevant influence of this phenomenon even farther downstream.
3.5 Phase-averaged organization of the wake velocity field
The large-scale variation of the global flow topology associated with the buffet mode in the present 2D configuration has been discussed in Sec. 3.1. In good agreement with these prior findings, the streamwise velocity contours in Fig. 9 clearly indicate the same buffet-governed variation across the near wake domain. To allow for a conclusive statistical evaluation of the velocity field and the inherent turbulent quantities, we provide a phase-related description of the wake velocity field analoguous to the discussion of the flow along the airfoil suction side following the procedure outlined in Sec. 2.3. Such representions are provided for the streamwise and wall-normal components in Figs. 10 and 11, respectively.
The contour maps in Fig. 10 show that the streamwise velocity maps vary periodically with the buffet cycle. The low-velocity wake core fluctuates strongly, which is predominantly dictated by the respective location and direction of motion of the shock wave Schauerte_Schreyer2022a ; Schauerte_Schreyer2022b . The buffet mechanism leads to a pronounced variation of the vertical and streamwise extent of the velocity-deficit region, which is associated with an intense flapping motion of the separated shear layer Schauerte_Schreyer2022a ; Schauerte_Schreyer2022b .
In the streamwise velocity magnitude, the greatest variation over the buffet cycle occurs with respect to its distribution the vertical direction (compare most extreme phases according to Figs. 10 (a) and (e)). In the wall-normal component, dominant changes are most evident in the streamwise direction (see Fig. 11) and are attributed to the interplay between up- and downwash from both sides of the airfoil downstream of the trailing edge.
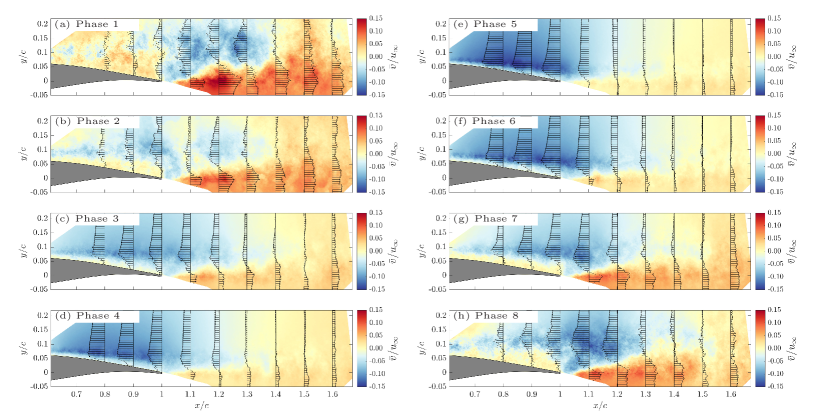
For the most upstream shock location (phase 1, see Fig. 10 (a)), the severe flow separation and thickening of the separated shear layer overcompensate the curvature-related downwash in the rear part of the airfoil. Consequentially, a region of mild upwash results between and .
Immediately downstream of the trailing edge, the flow fields from the upper and lower sides coalesce, and the pressure side induces an upwards deflection with adjacent to a region of downwards flow above the trailing edge. This patch of negative vertical velocity persists until the chordwise station , beyond which the transverse component is consistently positive. In phases with upstream shock locations, i.e. incipient downstream motion (phase 2) or final upstream motion (phase 8), the downwash along the airfoil suction side is still deficient and less pronounced compared to phase of widely attached flow (phases 4, 5, and 6).
Regarding the magnitude and spatial distribution, the organization of the wall-normal velocity maps in phases 3 and 7 are rather similar to the ensemble-averaged field shown in Fig. 8. This observation emphasizes the intermittent nature of this configuration.
3.6 Evolution of turbulent quantities
Considering the strong variations of the turbulent wake across the different buffet phases, a more detailed analysis of the buffet-related perturbations is required. The streamwise and transverse turbulent quantities and as well as the Reynolds shear stresses were computed for each phase individually (see Figs. 12 and 13) to assess their huge variations throughout the buffet cycle and further quantify their spatial structure.
The Reynolds shear stress contours in Fig. 12 are consistent with our with prior findings Schauerte_Schreyer2022a and agree with our observations above: intense turbulent mixing coincides with the incidents of large-scale flow separation, as is most clearly visible in phases 1 and 8 (Figs. 9 (b) and (p)).
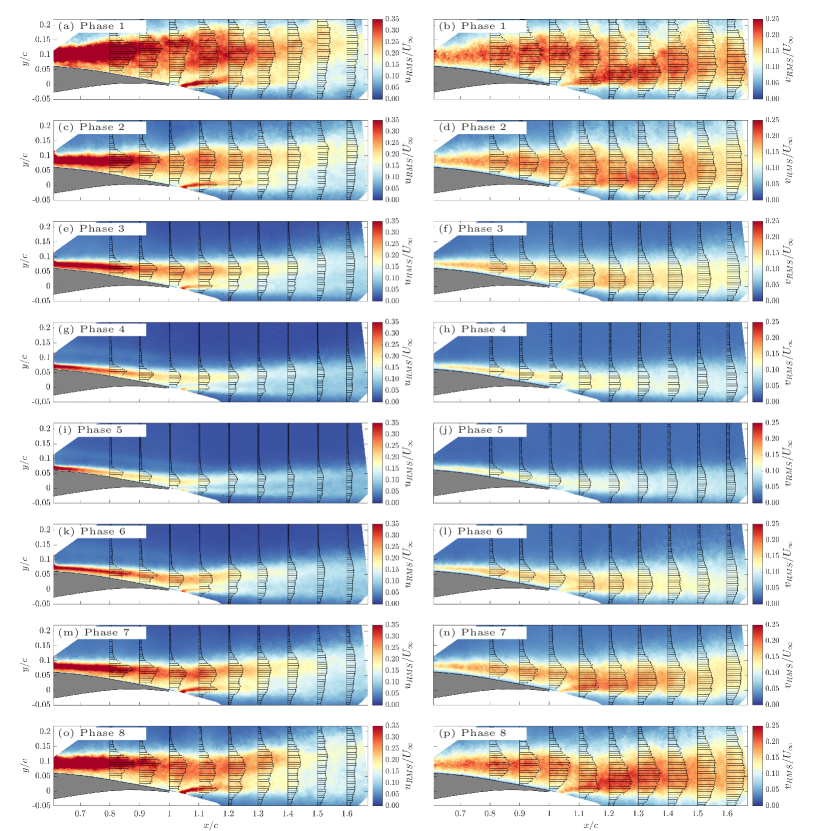
These effects are reflected in the shear-stress distributions of the same phases phases 1 (see Fig. 12 (a)) and 8 (see Fig. 12 (h)), whose respective maxima are located far above the TE at (phase 1) and (phase 8), and the wake influence is still noticeable until in both phases. Greatest maximum shear stress values of approx. occur in phase 1, which confirms the qualitative observations of the instantaneous vector field in Figs. 9 (a) and (b). As expected, the weakest shear stress of approx. occurs in phase 5, with a vertical peak location of This immense variation within the buffet cycle further illustrates that the wake carries out a strong flapping motion, as discussed in the context of Fig. 6 in Sec. 3.2 on the basis of the time history of the wake area estimate.
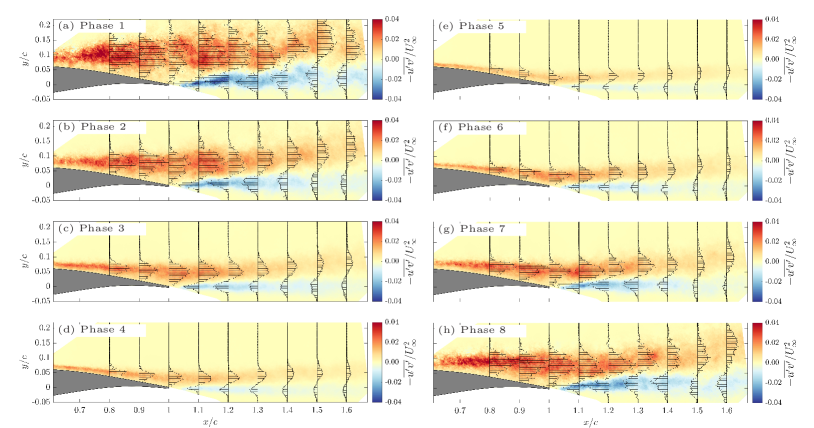
The streamwise and wall-normal turbulence components and show qualitatively similar distributions, although some distinct features are visible in the shapes of their profiles (see Fig. 13 left and right columns, respectively). Both quantities seem to emerge from two major source regions: from the suction-side shear layer downstream of the shock wave and from the lower side of the trailing edge. These contributions are reflected in the respective profiles near the airfoil trailing edge. At , as the flow of the suction and pressure sides coalesce for phases of far upstream shock locations (phases 1 and 8, see Figs. 13 (a), (b), (o), and (p)), the effect is most distinct: both and profiles exhibit two separate peak contributions (at and ), between which the turbulence intensity reduces. The distinctness of the peaks is much stronger for the streamwise component. is much more intense along the two wake main axes from the airfoil suction and pressure sides, whereas the wall-normal component is of more even magnitude across the width of the wake. This effect results in slightly M-shaped profiles for , e.g. at .
For , the contribution from the suction dominates: the overall levels and extent in the -direction at the location of the trailing edge are greater than the minor contribution from the pressure side. The vertical fluctuations (right column of Fig. 13) are equally strong on either side. Furthermore, the wake contribution from the pressure side to the component decays much faster than the contribution to (at approx. in phase 1, whereas the contribution in has not yet decayed at ).
3.7 Evolution of vortical structures in the wake
We explore the shedding of vortices, expressed by the vorticity, in detail, since the intermittently strongly separated flow field in transonic buffet is associated with the formation of vortex streets Zauner2020 . The vorticity field was computed on the basis of the streamwise and wall-normal components of instantaneous velocity fields according to eq. 1.
| (1) |
Fig. 14 displays the instantaneous vorticity distribution for three characteristic phases of the buffet period: for the most upstream shock location (a), the most downstream shock position (b), and the final phase of upstream motion (c). We observe the production of vorticity in the near wake and throughout the vortex shedding process at the trailing edge, as well as the strong variation of the regions with intense vorticity coupled with the buffet phase.
The slip line originating from the triple point of the lambda shock structure is well-resolved by the in-plane vorticity maps derived from PIV: it is visible as a thin streak of moderately positive vorticity that follows the vertical extent of the wake and is almost parallel to the edges of the turbulent wake (see e.g. Fig. 14 (b)).
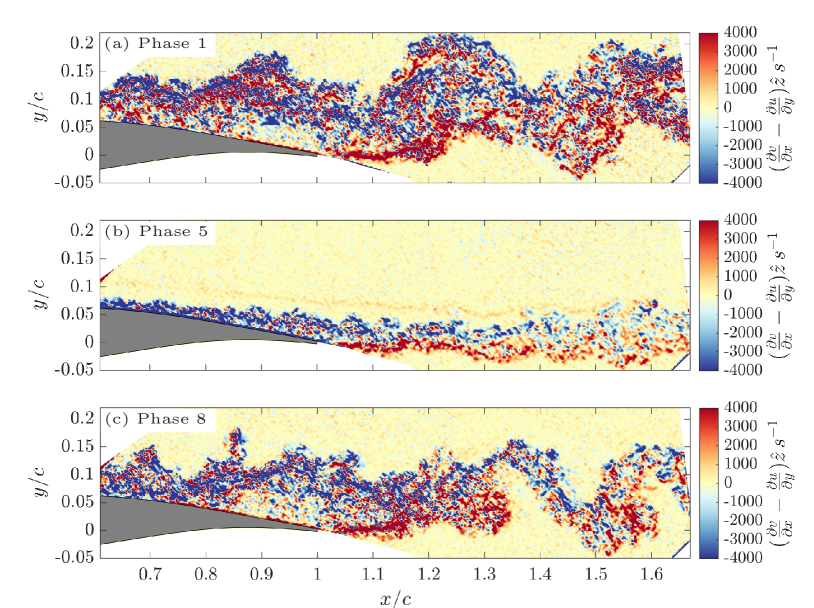
We observe coherent vortical structures across all phases of the buffet cycle, and they follow the expected cyclic variation. The contribution from the lower half of the wake is consistently positive, and negative vorticity is shed along the upper half. This tendency was previously observed by Szubert et al. Szubert2015 based on consecutive snapshots covering one vortex shedding period.
As discussed above, buffet phase 1 captures the most upstream shock locations and is associated with massive flow separation with a vertical extent of the turbulent wake of almost . The corresponding vorticity map in Fig. 14 (a) reveals two aspects of its macroscopic organization: first, Kelvin-Helmholtz-type instabilities develop downstream of the shock wave up to about ; second, a pronounced vortex roll-up is observed around the trailing edge and behind. We used an identical scaling of the colorbar as Szubert et al. Szubert2015 and observe almost perfect agreement with their case in terms of vorticity distribution and magnitude.
The quantitative differences between buffet phases are quite severe. In contrast to the widely separated shear layer and large coherent vortical structures in the wake of phase 1, phase 5 exhibits small-scale vortical structures confined to a narrow band. The vortical structures protrude less far into the vertical direction, which results in an almost sharp separation between positive contributions from the lower side of the wake and negative contributions from the upper side (compare Figs. 14 (a) and (b)). This observation is in good agreement with the findings of Epstein et al. Epstein1988 , that an unseparated transonic flow past an airfoil exhibits considerably reduced vortex shedding.
The massive thickening of the boundary layer in the aft section of the airfoil results in a pronounced de-cambering effect. Hence, the periodic variation between fully-separated and mostly reattached flow throughout a buffet cycle results in a continuous alteration of the integral circulation around the airfoil and therefore in continuous shedding of vorticity aft of the trailing edge. This effect presumably also contributes to the strongly alternating vortex-shedding intensity.
3.8 Spectral analysis of the vortex shedding
The vortex cores of the von Kármán vortex street induced upon the interaction of the flow with the trailing edge are resolved by alternating dark and bright spots in the Schlieren visualizations shown in Fig. 15. By tracking the time history of the dark/bright transition, we analyze the spectral content of the vortex shedding quantitatively. As visible in the detail views at the trailing edge (lower row of Fig. 15), both the distinctness and spatial extent of the resolved vortex cores decrease from phases 1 – 8 (Fig. 15 (a)-(c)). Assuming that the density gradient scales with the vortex strength, the strength decreases with increasing chordwise shock location. This observation is in good agreement with the shrinking of the vortex street (see Fig. 14).
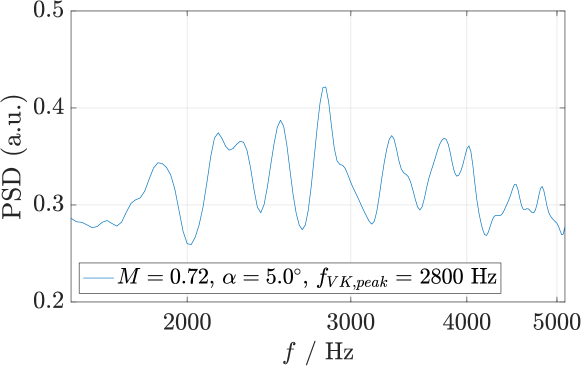
Szubert et al. Szubert2015 pointed out that events of massive flow separation – not necessarily driven by transonic buffet – may induce von Kármán-like vortex shedding in the vicinity of the trailing edge and the near wake. With pressure sensors placed along the airfoil upper surface and in the near wake, they captured strong secondary fluctuations (in addition to the primary buffet oscillation) over a broad range of chordwise stations. These fluctuations – attributed to a von Kármán mode – reach their maximum at , remain pronounced until , and only decay beyond one chord length downstream of the trailing edge Szubert2015 . In the wall-pressure spectra, Szubert et al. Szubert2015 observed distinct contributions at higher frequency () close to the trailing edge in addition to the characteristic low-frequency () footprint of shock buffet. Szubert et al. Szubert2015 verified the relation of the peak with the vortex shedding event on the basis of series of instantaneous vorticity maps with adequate temporal resolution.
Applying a similar analysis to the present data base yields the spectrum shown in Fig. 16. We observe high-frequency contributions peaking at , but with overall enhanced intensity between and . The peak frequency corresponds to , and is thus of the same order of magnitude as the study reported above Szubert2015 . We also observe a dominant buffet peak at , or (not displayed here to improve the visibility of the higher-frequency contributions). Considering the otherwise flat power spectrum, the pronounced bump can thus be attributed to the vortex shedding process and the incipient formation of a von Kármán vortex street.
Also Zauner and Sandham Zauner2020 showed similar alternating large-scale structures (as shown in the present study in instantaneous v velocity (see Fig. 9) and vorticity plots (see Fig. 14)) based on DMD modes representing both density and streamwise velocity in the wake field between and . The associated dynamics were centered around , which is a similar range as observed in the present case ( to ). This agreement is satisfactory, considering the slightly higher Strouhal numbers reported for the overall airfoil configuration in Zauner2020 , which also includes slightly higher values for the buffet-related peak (St=0.12 vs. St=0.07)).
4 Conclusions
Transonic buffet strongly affects the aerodynamic performance of passenger aircraft. Due to large-scale shock oscillations, the flow on the suction side of the airfoil is subjected to large-scale intermittent flow separation. Via the wake of the airfoil or wing, also aerodynamic components downstream of the wing, e.g. the tail plane, are strongly affected by this intermittent flow field. To shed light on the flow structure and characteristics impinging on the tail plane, we analyzed the effects of the buffet cycle on the wake in detail.
The buffet-dominated flow fields along the OAT15A-airfoil suction side and in the airfoil wake were presented and discussed in a complementary way to elucidate the coupling between the shock-induced unsteadiness, the disturbances incited at the trailing edge, and the vortical structures in the wake. The flow field on the airfoil suction side undergoes a strong periodic and global variation throughout the buffet cycle, and also the wake (shown until ) is dominated by pronounced periodicity. Owing to the large-scale shock displacement coupled with an intermittent separation, the flow topology both along the airfoil and in the near wake is modified on a global scale. The associated fluctuations remain at a constantly high level throughout the entire studied domain () and are suspected to persist also farther downstream.
On the basis of phase-averaged streamwise velocity maps, we showed the flow’s periodic variation, which is synchronized with the buffet cycle: the low-velocity wake core fluctuates strongly, dictated by the respective location and direction of motion of the shock wave. The wake is dominated by a pronounced variation of the vertical and streamwise extent of the velocity deficit associated with the flapping motion of the separated shear layer. Each buffet phase has a characteristic footprint of the flow topology, which is defined by the turbulent intensity and effective angular evolution of the main wake axis.
Downstream of the trailing edge, vortical structures form and are organized as large coherent streaks in phases where the wake is largest. They decrease substantially for phases of reattached flow. Positive vortical motion emanates at the lower edge of the wake and is intertwined with negative vorticity from the upper region. Consequently, Kármán vortex-street-like configurations form.
The low-frequency buffet unsteadiness modulates the vortex shedding, as it drastically modifies the circulation around and past the airfoil. Spectral analyses of the vortex shedding revealed that the associated frequencies are one order of magnitude larger than those of the buffet mode () and , respectively). These structures and associated frequencies will affect any downstream aerodynamic devices, such as the tail plane, on which the wake of the airfoil impinges. It is therefore to expect that the flow around the tail plane is also strongly periodic, with varying turbulent intensities associated with distinctly dominating peak frequencies in the range of the shock-buffet () and vortex shedding frequencies ().
Acknowldgements
The authors gratefully acknowledge the German Research Foundation (Deutsche Forschungsgemeinschaft DFG) for funding this work in the framework of the research unit FOR 2895 (project number 406435057). The authors thank ONERA for providing the OAT15A airfoil geometry for our wind tunnel model. We also gratefully acknowledge the contribution and support of Nick Capellmann and the workshop team of the Institute of Aerodynamics during the manufacturing process of the wind tunnel model.
References
- \bibcommenthead
- (1) J.B. McDevitt, A.F. Okuno, Static and dynamic pressure measurements on a naca 0012 airfoil in the ames high reynolds number facility. NASA Technical Paper 2485 (1985)
- (2) P. Molton, J. Dandois, A. Lepage, V. Brunet, R. Bur, Control of buffet phenomenon on a transonic swept wing. AIAA Journal 51(4), 761–772 (2013). 10.2514/1.J051000
- (3) L. Jacquin, P. Molton, S. Deck, B. Maury, D. Soulevant, Experimental study of shock oscillation over a transonic supercritical profile. AIAA Journal 47(9), 1985–1994 (2009). 10.2514/1.30190
- (4) M. Iovnovich, D.E. Raveh, Reynolds-averaged navier-stokes study of the shock-buffet instability mechanism. AIAA Journal 50(4), 880–890 (2012). 10.2514/1.J051329
- (5) J. Crouch, A. Garbaruk, D. Magidov, A. Travin, Origin and structure of transonic buffet on airfoils. 5th AIAA Theoretical Fluid Mechanics Conference (2008). 10.2514/6.2008-4233
- (6) B. Benoit, I. Legrain, Buffeting prediction for transport aircraft applications based on unsteady pressure measurements. AIAA 5th Applied Aerodynamics Conference (1987). 10.2514/6.1987-2356
- (7) J.D. Crouch, A. Garbaruk, M. Strelets, Global instability in the onset of transonic-wing buffet. Journal of Fluid Mechanics 881, 3–22 (2019). 10.1017/jfm.2019.748
- (8) L. Jacquin, V. Brion, P. Molton, D. Sipp, J. Dandois, S. Deck, F. Sartor, E. Coustols, D. Caruana, Testing in aerodynamics research at onera: the example of the transonic buffet. AerospaceLab 12 (2016)
- (9) B.H.K. Lee, Oscillatory shock motion caused by transonic shock boundary-layer interaction. AIAA Journal 28(5), 942–944 (1990). 10.2514/3.25144
- (10) A. Hartmann, A. Feldhusen, W. Schröder, On the interaction of shock waves and sound waves in transonic buffet flow. Physics of Fluids 25(2) (2013). 10.1063/1.4791603
- (11) S. Gunasekaran, D. Curry, On the wake properties of segmented trailing edge extensions. Aerospace 5(3) (2018). 10.3390/aerospace5030089
- (12) A.H. Epstein, J.B. Gertz, P.R. Owen, M.B. Giles, Vortex shedding in high-speed compressor blade wakes. Journal of Propulsion and Power 4(3), 236–244 (1988). 10.2514/3.23054
- (13) A. Alshabu, H. Olivier, Unsteady wave phenomena on a supercritical airfoil. AIAA Journal 46(8), 2066–2073 (2008). 10.2514/1.35516
- (14) M. Zauner, N.D. Sandham, Modal analysis of a laminar-flow airfoil under buffet conditions at re = 500,000. Flow, Turbulence and Combustion 104, 509–532 (2020). https://doi.org/10.1007/s10494-019-00087-z
- (15) D. Szubert, F. Grossi, A. Jimenez Garcia, Y. Hoarau, J.C. Hunt, M. Braza, Shock-vortex shear-layer interaction in the transonic flow around a supercritical airfoil at high reynolds number in buffet conditions. Journal of Fluids and Structures 55, 276–302 (2015). https://doi.org/10.1016/j.jfluidstructs.2015.03.005
- (16) T. Franke, Unsteady transonic flow around double-wedge profiles. Experiments in Fluids 8, 192–198 (1989). https://doi.org/10.1007/BF00195795
- (17) B.H.K. Lee, H. Murty, H. Jiang, Role of kutta waves on oscillatory shock motion on an airfoil. AIAA Journal 32(4), 789–796 (1994). 10.2514/3.12054. URL https://doi.org/10.2514/3.12054
- (18) H. Tijdeman, Investigation of the transonic flow around oscillating airfoils. Ph.D. thesis, Technical University of Delft, TU Delft (1977)
- (19) T.W. Binion, Potentials for pseudo-reynolds number effects. AGARDograph 303 (1988)
- (20) J.B. McDevitt, T. Polek, L. Hand, A new facility and technique for two-dimensional aerodynamic testing. 12th Aerodynamic Testing Conference (1982). 10.2514/6.1982-608
- (21) H. Schardin, Schlieren methods and their applications. Ergebnisse der exakten Naturwissenschaften 20 (1942)
- (22) G. Settles, Schlieren and Shadowgraph Techniques: Visualizing Phenomena in Transparent Media. Experimental Fluid Mechanics (Springer Berlin Heidelberg, 2001). 10.1007/978-3-642-56640-0
- (23) L.M. Weinstein, Large-field high-brightness focusing schlieren system. AIAA Journal 31(7), 1250–1255 (1993). 10.2514/3.11760
- (24) C. Schauerte, A.M. Schreyer, Design of a high-speed focusing schlieren system for complex three-dimensional flows. 5th International Conference on Experimental Fluid Mechanics ICEFM 2018 Munich (2018)
- (25) C.J. Schauerte, A.M. Schreyer, Characterization of shock buffet on a supercritical 2d airfoil in transonic flow. 20th International Symposium on Application of Laser and Imaging Techniques to Fluid Mechanics (2022)
- (26) C.J. Schauerte, A.M. Schreyer, Experimental analysis of transonic buffet conditions on a two-dimensional supercritical airfoil. AIAA Journal, under revision (2022)