Further author information: (Send correspondence to Jerry L. Prince <prince@jhu.edu>)
Segmenting thalamic nuclei from manifold projections
of multi-contrast MRI
Abstract
The thalamus is a subcortical gray matter structure that plays a key role in relaying sensory and motor signals within the brain. Its nuclei can atrophy or otherwise be affected by neurological disease and injuries including mild traumatic brain injury. Segmenting both the thalamus and its nuclei is challenging because of the relatively low contrast within and around the thalamus in conventional magnetic resonance (MR) images. This paper explores imaging features to determine key tissue signatures that naturally cluster, from which we can parcellate thalamic nuclei. Tissue contrasts include T1-weighted and T2-weighted images, MR diffusion measurements including FA, mean diffusivity, Knutsson coefficients that represent fiber orientation, and synthetic multi-TI images derived from FGATIR and T1-weighted images. After registration of these contrasts and isolation of the thalamus, we use the uniform manifold approximation and projection (UMAP) method for dimensionality reduction to produce a low-dimensional representation of the data within the thalamus. Manual labeling of the thalamus provides labels for our UMAP embedding from which nearest neighbors can be used to label new unseen voxels in that same UMAP embedding. -fold cross-validation of the method reveals comparable performance to state-of-the-art methods for thalamic parcellation.
keywords:
thalamus, magnetic resonance imaging, dimensionality reduction, UMAP1 INTRODUCTION
The thalamus acts as a neuro-architectonic relay station which passes sensory and motor signals between various structures of the human brain [1]. It is a bilateral gray matter structure located in the forebrain, with its medial surface adjacent to the superior portion of the third ventricle. The thalamus can be divided into several clusters known as nuclei; numerous diseases are associated with these nuclei including Parkinson’s disease [2], multiple sclerosis [3], epilepsy [4], and mild traumatic brain injury (mTBI) [5]. As such it is useful to identify these thalamic nuclei. Existing methods fail to take advantage of the diverse sources of imaging data that are available.
Magnetic resonance (MR) images (MRIs) provide a variety of tissue contrasts, each offering unique insights into the structure and nature of the human brain. The magnetization prepared rapid gradient echo (MPRAGE) image is a T1-weighthed (T1-w) sequence offering excellent gray matter to white matter (WM) contrast. The fast gray matter acquisition T1 inversion recovery (FGATIR) [6] image is a sequence that suppresses signal from WM. MPRAGE and FGATIR images scanned contemporaneously can be used to estimate synthetic multi-TI images, i.e., T1-weightings with different inversion times (TIs). Diffusion tensor imaging (DTI) is an MR modality that non-invasively acquires the bulk motion of water in the brain, representing white matter (WM) tracts by depicting the anisotropy of the underlying microstructure. The MPRAGE and DTI images allow identification of the thalamus boundaries, while the nuclei highlighting the ability of the multi-TI data allows for the identification of several individual thalamic nuclei.
Previous MR work in this area has begun with extracting the thalamus [7, 8] which itself is a difficult task. This is followed by parcellation of the thalamus using various methods and MR modalities [9]. These include diffusion tensor tracking of DTI [10], multi-vector random forest analysis [11, 12], probabilistic tractography [13], and others [14, 15, 16, 17, 18, 19, 20, 21, 22]. These prior works have two key limitations. First, they are limited in the number of nuclei they examine. Most of these methods use six labels per hemisphere, Lambert et al. [13] use nine per hemisphere. Iglesias et al. [16] discuss using 12 labels per hemisphere; however, they only report global metrics for their analysis. Second these methods do not use the full range of available MR contrasts.
We use a state-of-the-art dimensionality reduction method to create a latent space (also called an embedding) that captures the intrinsic tissue parameters of the nuclei. We build high-dimensional vectors at each voxel location from the available MR data to create this latent space. We also have some manual labels that identify certain thalamic nuclei. To label a new image, we map the MRI data of a new image into our latent space and then label the voxels based on their neighbors in our latent space.
2 METHOD
Multi-contrast MRI Data Forty-four subjects were imaged for a study of mTBI. Acquired images include MPRAGE, 3D T2-weighted, DTI, FGATIR, related multi-TI synthetic images, and a T1 map. The DTI data is processed to generate fractional anisotropy (FA), mean diffusivity (MD), radial diffusivity (RD), axial diffusivity (AD), mode, trace (Tr), Westin Indices, eigenvectors, and eigenvalues. The latter two are used to generate a 5D Knutsson vector and edge map [23]. All images are registered to the MPRAGE which has been resampled to be isotropic. Our MRI data is extracted at each voxel location which results in a D feature vector, including MPRAGE, T2-weighted, FGATIR, T1-map (2D), FA, MD, RD, AD, Tr, Westin Indices (3D), Knutsson vector (5D), and Knutsson edgemap; we refer to this D vector as our Base vector. The MPRAGE and FGATIR images combined with multi-TI synthetic equations generate unique images—TI images with different TI values—which we use as a D vector and refer to as the Multi-TI vector. Probabilistic tractography on the DTI gives us connectivity maps from thalamic voxels to the cortical mantle. These combined with a SLANT [24] segmentation of the cortical surfaces give us two connectivity maps: 1) a D vector called Conn6 corresponding to the SLANT lobe labels; 2) a D vector called Conn98 corresponding to the connectivity map for all SLANT labels. We also have the D coordinates of a voxel as an additional feature vector, using the center of the thalamus bounding box of each subject as the origin. We use combinations of these feature vectors in an ablation study to determine the most informative for thalamic parcellation.
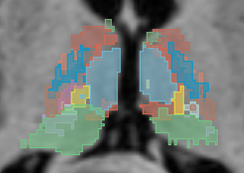
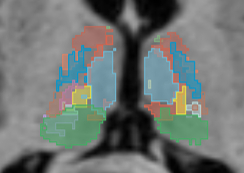
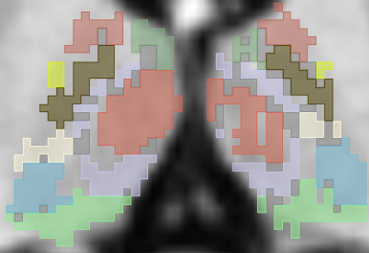
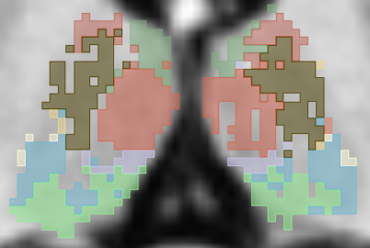
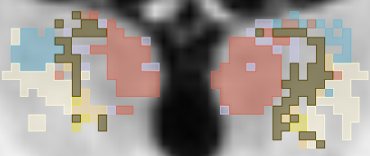
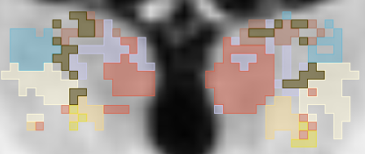
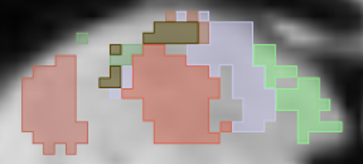
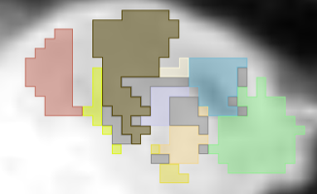
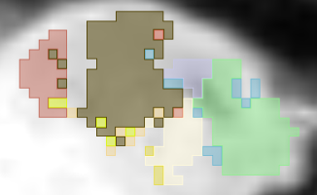
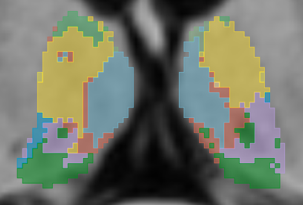
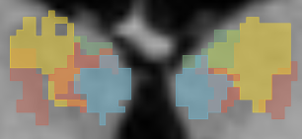
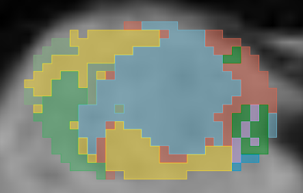
Thalamic Nuclei Delineation Protocol Thirty six subjects were semi-manually labeled as follows. The Morel atlas [25] (which has 19 labels per hemisphere) was registered to the MPRAGE. We reduced the 19 labels to 13 per hemisphere, by merging some smaller labels (see Table 2 for the list of 13 labels). We manually corrected the labels using multi-TI images, which helped to better identify individual nuclei and to reduce registration errors. Because nuclei were corrected separately, there might be thalamus voxels with no label and voxels with multiple labels—these we relabeled as “Conflicted” labels. An example of manually-delineated thalamic nuclei is shown in Fig. 1(a). Because the thalamus boundary is not clearly visible on T1-weighted images, voxels that are outside the thalamus might have been manually labeled. Labels that are masked by the automatically-computed thalamus mask (see above) are shown in Fig. 1(b).
Preprocessing Six of our subjects have incomplete MR data, leaving us with 30 viable subjects, which we separated evenly into five folds. We performed a five-fold cross-validation with a : training to testing split. The features were normalized in the range for non-directional features, while directional features were normalized in the range . For our normalization, we used a robust approach to reduce the effects of noise and outliers. To do this, we computed the 2.5% and 97.5% percentage values for each feature, and value of the data points between 2.5% and 97.5% range are linearly scaled to the range . Points outside that range are linearly scaled between for values below 2.5% and scaled between for values over 97.5%. Due to the varying thalamus sizes, we had –k vectors per fold.
 |
 |
 |
 |
| (a) | (b) | (c) | (d) |
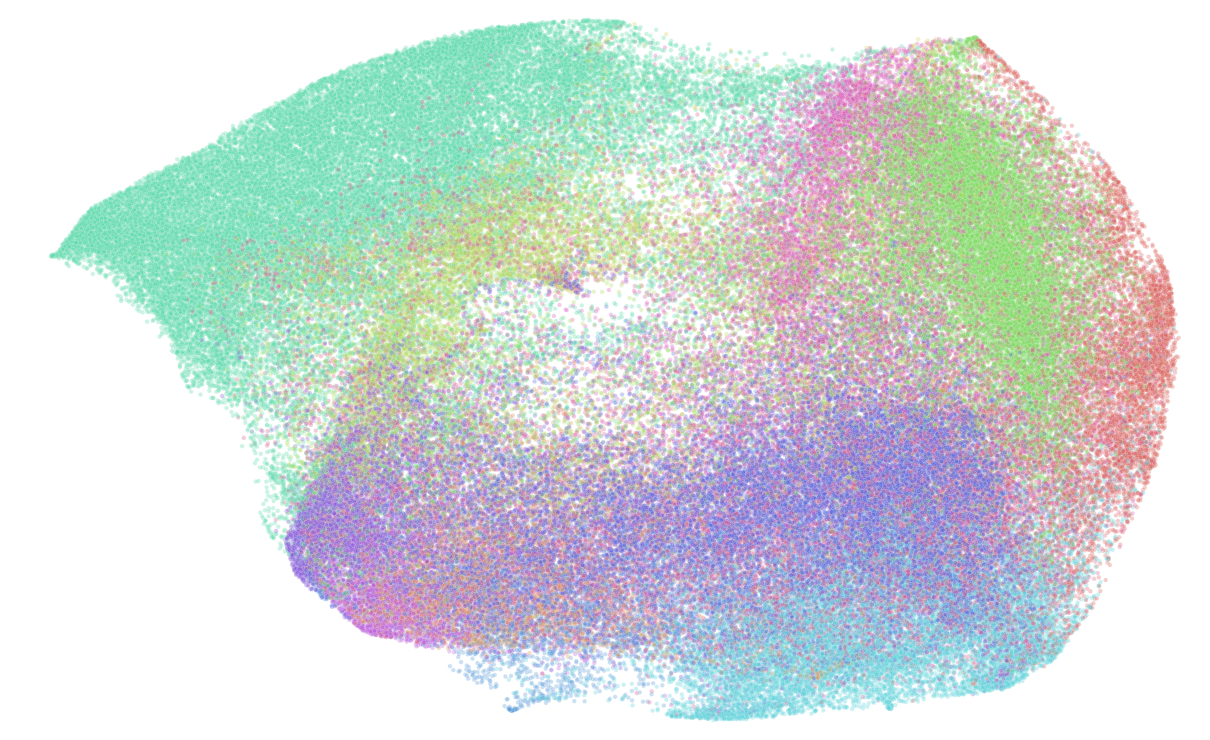
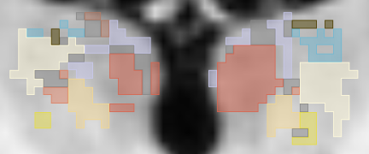
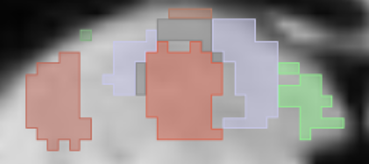
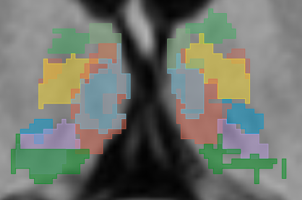
Dimensionality Reduction The uniform manifold approximation and projection (UMAP) [26] approach is a manifold learning technique which has been demonstrated to be a state-of-the-art [26] dimensionality reduction method. UMAP is based on a Riemannian geometry and algebraic topology framework that scales linearly with the input size. Unlike t-distributed stochastic neighbor embedding (t-SNE), UMAP produces consistent results on the same data and is generally insensitive to initialization and hyperparameter changes. Additionally, UMAP takes less than minutes to train on k data point in contrast to 8 hours for t-SNE. An example of a two-dimensional feature space generated by UMAP dimensionality reduction for one choice of features from our dataset is shown in Fig. 1(c). Note that this figure shows the thalamic labels as different colors, but these labels are not used as features for dimensionality reduction.
Training of the UMAP model The most important parameter of UMAP is n_neighbours; it is an initial guess of the size of each cluster that UMAP is trying to embed. Too small and we get more clusters than we should; while too large can cause all points to be condensed into one cluster. We have done extensive testing of multiple values and found a value of for n_neighbours offers the best performance (for our data). UMAP has a target dimension that is somewhat arbitrary, though theoretically the best separation of labels is achieved if the target dimension is close to the actual dimension of the underlying manifold. In Tables 2, 3, and 4, we include results for D, D, and D latent spaces and corresponding visualizations, respectively. We see diminishing returns for using embeddings with higher dimensions than D as the time for embedding will increase moderately, yet the classification accuracy hardly increases. During training, the UMAP model runs completely unsupervised; in particular, the model does not see any of the held-out testing data (-fold) or semi-manual labels in our cross-validation experiment. We note that we have not used a validation dataset to determine an early stopping criteria, and we use 1,000 epochs for all the data in the UMAP embedding. Thus, our UMAP embedding is data-driven and determined by the manifold that the input data is exhibiting.
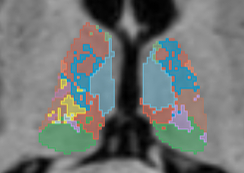
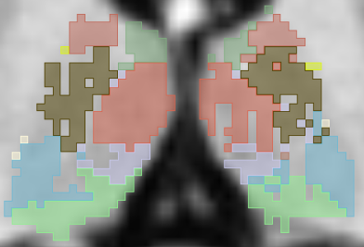
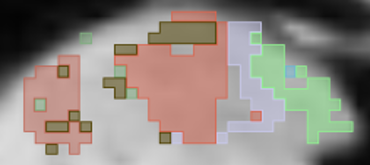
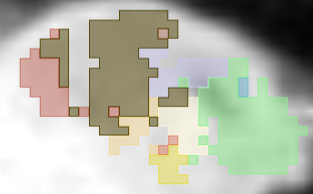
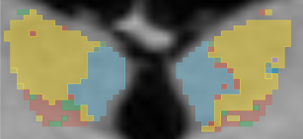
Nearest Neighbor Completion We use nearest neighbors (-NN) in the UMAP latent space to label new unseen data. Thus, at test time, a vector (pixel) is labeled based on its neighbors in our UMAP latent space. We use distance and a of in the D latent space, of in the D latent space, and of in the D latent space. In our semi-manual labels, it is possible for one voxel to have multiple labels as each nucleus has been labeled separately in separate files. Thus, we write a special version of the -NN algorithm to work with multiple labels, and multiple labels in one voxel are evenly weighted in the final voting. A typical example of a -NN segmentation result (defined only on the thalamus mask) is shown in Fig. 1(d). More results are presented below.
3 EXPERIMENTS and Results
| Dim. | Base | Coord | Multi-TI | Conn6 | Conn98 | Mean Std. Dev. | ||||||
|---|---|---|---|---|---|---|---|---|---|---|---|---|
| 19 | ✓ | |||||||||||
| 22 | ✓ | ✓ | ||||||||||
| 60 | ✓ | ✓ | ||||||||||
| 63 | ✓ | ✓ | ✓ | |||||||||
| 69 | ✓ | ✓ | ✓ | ✓ | ||||||||
| 161 | ✓ | ✓ | ✓ | ✓ | ||||||||
| 104 | ✓ | ✓ |
We first conducted an ablation study on the feature vectors by using various combinations of the groups of feature vectors across our five-fold cross-validation. The results reported in Table 1 are a volume-wise weighted mean and standard deviation for the thirteen thalamic nuclei across our five-folds. This ablation study uses a D UMAP embedding, and a similar result is found in both D and D UMAP embeddings. The best thalamic nuclei parcellation is achieved with a D feature vector that does not include any cortical surface connectivity information; which is counter to the prevailing ideas about how thalamus parcellation should be approached. However, we note that our semi-manual labels were created by observing multiple image contrasts within the thalamus without any knowledge of connectivity, which could be a potential explanation. In our study, adding connectivity information does not improve mean accuracy, but results in a slight decrease in mean accuracy which is not statistically significant as the standard deviation also increases. This result suggests another possible explanation that the additional information added by connectivity is not significant and it might be compromised by the “curse of dimension” as higher dimension data makes it harder to be embedded into a proper latent space that preserves useful information. We found both the spatial information and Multi-TI information useful as removing them significantly reduces performance; again, this may be a consequence of our manual delineation using the Multi-TI images. We also tested the performance using connectivity information only, and the performance was even worse than using only the 19D base vectors. In conclusion, we found connectivity information not useful in our parcellation approach, possibly due to the fact that they are not seen by the manual delineators.
We next report on the best-performing feature vector in our ablation experiment (i.e., the D feature vector made up of Base Coord Multi-TI) across the five-folds of our cross-validation and on all thirteen labels. The mean Dice scores across our labels are shown in Table 2, as well as an “Overall” label. The presented result in this table is for our D UMAP embedding. Then, in Table 3 and Table 4, we report the results of both the D and D latent space embeddings. We observe a clear improvement in the overall Dice score when the dimension of the latent space is increased from D to D, and D to D in all 5 folds. The Dice score for individual thalamic nucleus also increases. The improvement is most significant for those small nuclei with an initially low Dice score, and for larger nuclei which can be easily segmented out (such as MD and PuI nuclei in our data) the improvement is relatively small. As we mentioned in the Sec. 2, theoretically we could use higher dimensions for our latent spaces to achieve better result, but we only achieve a slight improvement of accuracy at the cost of much longer embedding time; a D latent space takes about 10 minutes to train, while D takes about 30 minutes, D takes about 2 hours, and D takes over 10 hours. Thus, a D latent space achieves a reasonable balance between time cost and performance.
Label Overall AN CL CM LD LP MD PuA PuI VA VLP VLa VPL VPM Fold 1 0.66 0.18 0.44 0.31 0.22 0.57 0.81 0.20 0.92 0.73 0.81 0.43 0.49 0.50 Fold 2 0.66 0.21 0.44 0.20 0.28 0.62 0.78 0.20 0.90 0.76 0.77 0.43 0.52 0.49 Fold 3 0.62 0.28 0.38 0.31 0.21 0.53 0.83 0.18 0.77 0.81 0.74 0.42 0.34 0.49 Fold 4 0.64 0.35 0.48 0.36 0.18 0.57 0.89 0.10 0.84 0.58 0.74 0.43 0.40 0.45 Fold 5 0.64 0.27 0.57 0.23 0.35 0.59 0.73 0.26 0.87 0.58 0.81 0.54 0.53 0.37
Label Overall AN CL CM LD LP MD PuA PuI VA VLP VLa VPL VPM Fold 1 0.68 0.26 0.45 0.39 0.23 0.63 0.81 0.24 0.93 0.76 0.82 0.42 0.49 0.50 Fold 2 0.68 0.27 0.46 0.29 0.31 0.70 0.79 0.28 0.91 0.73 0.81 0.49 0.53 0.51 Fold 3 0.64 0.35 0.40 0.39 0.21 0.59 0.80 0.26 0.77 0.83 0.75 0.41 0.37 0.55 Fold 4 0.66 0.37 0.52 0.50 0.21 0.58 0.89 0.22 0.86 0.59 0.71 0.43 0.38 0.52 Fold 5 0.67 0.29 0.60 0.36 0.35 0.65 0.70 0.36 0.88 0.65 0.82 0.55 0.54 0.44
Label Overall AN CL CM LD LP MD PuA PuI VA VLP VLa VPL VPM Fold 1 0.71 0.31 0.48 0.49 0.29 0.64 0.83 0.28 0.93 0.78 0.84 0.45 0.58 0.51 Fold 2 0.70 0.28 0.49 0.37 0.41 0.73 0.82 0.31 0.91 0.80 0.80 0.51 0.58 0.51 Fold 3 0.65 0.35 0.44 0.44 0.30 0.62 0.81 0.27 0.77 0.87 0.76 0.43 0.40 0.50 Fold 4 0.68 0.40 0.53 0.60 0.27 0.60 0.92 0.24 0.86 0.63 0.74 0.45 0.43 0.56 Fold 5 0.69 0.33 0.61 0.47 0.37 0.67 0.77 0.37 0.88 0.69 0.82 0.57 0.56 0.48
| Subject 1 | ||||
 |
 |
 |
||
 |
 |
 |
||
 |
 |
 |
||
| (a) | (b) | (c) | ||
| Subject 2 | ||||
 |
 |
 |
||
 |
 |
 |
||
| (a) | (b) | (c) |
 |
 |
|
 |
 |
|
 |
 |
|
| (a) | (b) |
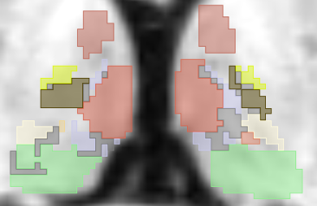
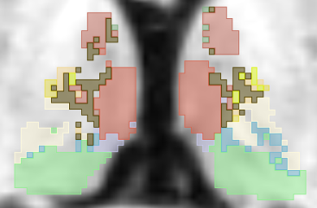
We also present visualizations of the final thalamus parcellation results in Fig. 2, and compare the manual labels with our D and D UMAP latent space embeddings for two subjects showing three different anatomical views (coronal, axial, & sagittal). Note that in order to calculate the Dice score, we only predict voxels that have a manual label to compare with, but in principle, our approach can predict any voxel given the feature vector of that voxel. Subject is a case with a relatively lower Dice score and Subject is a case with a higher Dice score. The central thalamic slices are used for each of the views. We observe that visually the result from our D UMAP is closer to the manual labels than that from our D UMAP, but the difference is only moderate. Thus using our D UMAP latent space is already sufficient to place all labels at the correct spatial positions, and increasing to D only refines some boundaries. As our approach largely depends on the natural clustering of feature vectors, with only weak spatial information, our result is evidence that feature vectors from different thalamic nuclei are naturally separated in that high-dimensional space, and we can project that manifold to a latent space as low as D and separate them without using supervised training and deep learning methods.
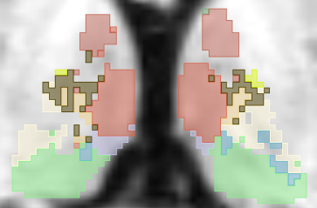
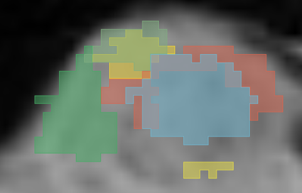
Lastly, we show that our approach can also be used to label other thalamic voxels not labeled by human labelers or an entirely new thalamus. In Fig. 3 we used our parcellation approach to label all voxels inside the thalamus region, and compare them with manual labels which have many overlaps and holes. We use a pre-generated thalamus mask to define the thalamus region, and label all voxels inside that region.
4 Conclusion
We have used a high-dimensional feature vector and an unsupervised dimensionality reduction technique to parcellate the thalamus. Our ablation study suggests that connectivity does not help in parcellating the thalamus; however, further research may support a more subtle relationship between intensities that indicate microstructure and connectivity to distal regions. We found evidence that feature vectors from multi-contrast MRI scans can be used to naturally separate different thalamus nuclei using unsupervised approaches, and the high dimensional feature space (maximum D in or experiment) can be reduced using unsupervised UMAP to as low as a 2D latent space, and is still able to classify new voxels using methods as simple as a -NN with an accuracy comparable to state-of-the-art results. Our performance on several nuclei is higher than other works: see the MD performance of Stough et al. [11]; the PuI, VA, and VLP performance of Su et al. [19], for examples. A higher accuracy can be achieved using a higher order latent space, but the embedding time will increase.
Acknowledgements.
This work was supported in part by the National Institutes of Health through the National Institute of Neurological Disorders and Stroke under grant R01-NS105503 (PI: R.P. Gullapalli) and grant R01-NS082347 (PI: P.A. Calabresi).References
- [1] Sherman, S. M. and Guillery, R., [Exploring the Thalamus ], Academic Press (2001).
- [2] Halliday, G. H., “Thalamic changes in Parkinson’s disease,” Parkinsonism & related disorders 15, S152–S155 (2009).
- [3] Glaister, J., Carass, A., NessAiver, T., Stough, J. V., Calabresi, S. S. P. A., and Prince, J. L., “Thalamus Segmentation using Multi-Modal Feature Classification: Validation and Pilot Study of an Age-Matched Cohort,” NeuroImage 158, 430–440 (2017).
- [4] Bertram, E. H., Mangan, P. S., Zhang, D., Scott, C., and Williamson, J. M., “The midline thalamus: alterations and a potential role in limbic epilepsy,” Epilepsia 42(8), 967–978 (2001).
- [5] Grossman, E. J. and Inglese, M., “The role of thalamic damage in mild traumatic brain injury,” Journal of Neurotrauma 33(2), 163–167 (2016).
- [6] Sudhyadhom, A., Haq, I. U., Foote, K. D., Okun, M. S., and Bova, F. J., “A high resolution and high contrast MRI for differentiation of subcortical structures for DBS targeting: The Fast Gray Matter Acquisition T1 Inversion Recovery (FGATIR),” NeuroImage 47, T44–T52 (2009).
- [7] Liu, L., Glaister, J., Sun, X., Carass, A., Tran, T. D., and Prince, J. L., “Segmentation of Thalamus from MR images via Task-Driven Dictionary Learning,” in [Proceedings of SPIE Medical Imaging (SPIE-MI 2016), San Diego, CA, February 27-March 3, 2016 ], 9784, 97843H–97843H–7 (2016).
- [8] Shao, M., Zuo, L., Carass, A., Zhuo, J., Gullapalli, R. P., and Prince, J. L., “Evaluating the impact of MR image harmonization on thalamus deep network segmentation,” in [Proceedings of SPIE Medical Imaging (SPIE-MI 2022), San Diego, CA, February 20 – 24, 2022 ], 12032, 115–121 (2022).
- [9] Tohidi, P., Han, S., Zuo, L., Zhuo, J., Roys, S. R., Carass, A., Gullapalli, R. P., and Prince, J. L., “Multiple Sclerosis brain lesion segmentation with different architecture ensembles,” in [Proceedings of SPIE Medical Imaging (SPIE-MI 2023), San Diego, CA, February 19 – 23, 2023 ], (2023).
- [10] Wiegell, M. R., Tuch, D. S., Larsson, H. B., and Wedeen, V. J., “Automatic segmentation of thalamic nuclei from diffusion tensor magnetic resonance imaging,” NeuroImage 19(2), 391–401 (2003).
- [11] Stough, J. V., Glaister, J., Ye, C., Ying, S. H., Prince, J. L., and Carass, A., “Automatic method for thalamus parcellation using multi-modal feature classification,” in [17 International Conference on Medical Image Computing and Computer Assisted Intervention (MICCAI 2014) ], Lecture Notes in Computer Science 8675, 169–176, Springer Berlin Heidelberg (2014).
- [12] Glaister, J., Carass, A., Stough, J. V., Calabresi, P. A., and Prince, J. L., “Thalamus parcellation using multi-modal feature classification and thalamic nuclei priors,” in [Proceedings of SPIE Medical Imaging (SPIE-MI 2016), San Diego, CA, February 27-March 3, 2016 ], 9784, 97843J–97843J–6 (2016).
- [13] Lambert, C., Simon, H., Colman, J., and Barrick, T. R., “Defining thalamic nuclei and topographic connectivity gradients in vivo,” NeuroImage 158, 466–479 (2017).
- [14] Yan, C., Shao, M., Bian, Z., Feng, A., Xue, Y., Zhuo, J., Gullapalli, R. P., Carass, A., and Prince, J. L., “Segmenting thalamic nuclei from manifold projections of multi-contrast MRI,” in [Proceedings of SPIE Medical Imaging (SPIE-MI 2023), San Diego, CA, February 19 – 23, 2023 ], (2023).
- [15] Feng, A., Xue, Y., Wang, Y., Yan, C., Bian, Z., Shao, M., Zhuo, J., Gullapalli, R. P., Carass, A., and Prince, J. L., “Label propagation via random walk for training robust thalamus nuclei parcellation model from noisy annotations,” in [20 International Symposium on Biomedical Imaging (ISBI 2023) ], (2023).
- [16] Iglesias, J. E., Van Leemput, K., Golland, P., and Yendiki, A., “Joint inference on structural and diffusion MRI for sequence-adaptive Bayesian segmentation of thalamic nuclei with probabilistic atlases,” in [26 Inf. Proc. in Med. Imaging (IPMI 2019) ], Lecture Notes in Computer Science 11492, 767–779 (2019).
- [17] Jonasson, L., Hagmann, P., Pollo, C., Bresson, X., Wilson, C. R., Meuli, R., and Thiran, J.-P., “A level set method for segmentation of the thalamus and its nuclei in DT-MRI,” Signal Processing 87(2), 309–321 (2007).
- [18] Stough, J. V., Ye, C., Ying, S. H., and Prince, J. L., “Thalamic Parcellation from Multi-Modal Data using Random Forest Learning,” in [10 International Symposium on Biomedical Imaging (ISBI 2013) ], 852–855 (2013).
- [19] Su, J. H., Thomas, F. T., Kasoff, W. S., Tourdias, T., Choi, E. Y., K.Rutt, B., and Saranathan, M., “Thalamus Optimized Multi Atlas Segmentation (THOMAS): fast, fully automated segmentation of thalamic nuclei from structural MRI,” NeuroImage 194, 272–282 (2019).
- [20] Wang, S. L., Han, S., Carass, A., Zhuo, J., Roys, S., Gullapalli, R. P., Jiang, L., and Prince, J. L., “Thalamus segmentation using convolutional neural networks,” in [Proceedings of SPIE Medical Imaging (SPIE-MI 2021), San Diego, CA, February 14 – 18, 2021 ], 11596, 1159634 (2021).
- [21] Ziyan, U., Tuch, D., and Westin, C. F., “Segmentation of Thalamic Nuclei from DTI Using Spectral Clustering,” in [9 International Conference on Medical Image Computing and Computer Assisted Intervention (MICCAI 2006) ], 4191, 807–814 (2006).
- [22] Ziyan, U., Tuch, D., and Westin, C. F., “Joint Segmentation of Thalamic Nuclei from a Population of Diffusion Tensor MR Images,” in [11 International Conference on Medical Image Computing and Computer Assisted Intervention (MICCAI 2008) ], 5241, 279–286 (2008).
- [23] Knutsson, H., “Producing a Continuous and Distance Preserving 5-D Vector Representation of 3-D Orientation,” in [IEEE Computer Society Workshop on Computer Architecture for Pattern Analysis and Image Database Management ], 175–182 (1985).
- [24] Huo, Y., Xu, Z., Xiong, Y., Aboud, K., Parvathaneni, P., Bao, S., Bermudez, C., Resnick, S. M., Cutting, L. E., and Landman, B. A., “3D whole brain segmentation using spatially localized atlas network tiles,” NeuroImage 194, 105–119 (2019).
- [25] Morel, A., Magnin, M., and Jeanmonod, D., “Multiarchitectonic and Stereotactic Atlas of the Human Thalamus,” J. Comp. Neurol. 387(4), 588–630 (1997).
- [26] McInnes, L., Healy, J., and Melville, J., “UMAP: Uniform Manifold Approximation and Projection for Dimension Reduction,” arXiv preprint arXiv:1802.03426 1802 (2018).