Molecular gas cloud properties at revealed by the superb angular resolution achieved with ALMA and gravitational lensing
Abstract
Current observations favour that the massive ultraviolet-bright clumps with a median stellar mass of , ubiquitously observed in galaxies, are star-forming regions formed in-situ in galaxies. It has been proposed that they result from gas fragmentation due to gravitational instability of gas-rich, turbulent, high-redshift discs. We bring support to this scenario by reporting the new discovery of giant molecular clouds (GMCs) in the strongly lensed, clumpy, main-sequence galaxy, A521-sys1, at . Its CO(4–3) emission was mapped with the Atacama Large Millimeter/submillimeter Array (ALMA) at an angular resolution of , reading down to 30 pc thanks to gravitational lensing. We identified 14 GMCs, most being virialized, with masses and a median molecular gas mass surface density, that are, respectively, 100 and 10 times higher than for nearby GMCs. They are also characterized by 10 times higher supersonic turbulence with a median Mach number of 60. They end up to fall above the Larson scaling relations, similarly to the GMCs in another clumpy galaxy, the Cosmic Snake, although differences between the two sets of high-redshift GMCs exist. Altogether they support that GMCs form with properties that adjust to the ambient interstellar medium conditions prevalent in the host galaxy whatever its redshift. The detected A521-sys1 GMCs are massive enough to be the parent gas clouds of stellar clumps, with a relatively high star-formation efficiency per free-fall time of per cent.
keywords:
gravitational lensing: strong – galaxies: high-redshift – galaxies: individual: A521-sys1 – galaxies: ISM – galaxies: star formation1 Introduction
The understanding of the process of star formation at high redshift, which drives the stellar mass build-up of galaxies across cosmic time, evolves in synergy with better observational facilities and not only the improvement of their sensitivity, but specifically their spatial resolution. The Hubble Space Telescope (HST) has delivered unprecedented, resolved near-ultraviolet (UV) to near-infrared (IR) images of high-redshift galaxies. They revealed that about 60 per cent of star-forming galaxies around the peak of the cosmic star-formation rate density () have perturbed morphologies, dominated by giant UV-bright star-forming knots/clumps (e.g. Cowie, Hu & Songaila, 1995; Conselice et al., 2004; Elmegreen et al., 2007, 2013; Livermore et al., 2012, 2015; Guo et al., 2012, 2015, 2018; Soto et al., 2017; Zanella et al., 2019). The origin and nature of these clumps have been debated over two decades now, while their understanding could provide key information on: the mass assembly of galaxies, via mergers or secular evolution, depending on whether the clumps we see are ’ex-situ’ satellites resulting from a merger event or are formed locally (’in-situ’) in galaxies; the structural evolution of the host galaxy if clumps contribute to the bulge growth when migrating toward the galactic center; the star-formation process of high-redshift galaxies if clumps are star-forming regions formed in-situ in galaxies; and the role clumps play in the galactic stellar feedback and Lyman continuum ionizing photons (Dessauges-Zavadsky et al., 2020).
Several observational findings currently support that the observed clumps are star cluster complexes/large star-forming regions formed in-situ in high-redshift galaxies. We can cite the study by Shibuya et al. (2016) of 17 000 galaxies from the HST legacy surveys, which evidenced that the redshift evolution of the clumpy galaxy fraction differs from the one of both minor and major mergers (Lotz et al., 2011). The same authors also showed that the bulk of the clumpy galaxies are disc-like systems with a Sérsic index close to 1. This is consistent with their kinematics found to be dominated by ordered disc rotation with high velocity dispersions, similarly to the majority of star-forming galaxies at (e.g. Förster Schreiber et al., 2009; Wisnioski et al., 2015; Turner et al., 2017; Simons et al., 2017; Übler et al., 2019; Girard et al., 2018, 2020). Moreover, Elmegreen et al. (2017) determined that the scale-heights of clumpy galaxies and those of normal spirals when seen edge-on are comparable, indicating that clumps are distributed within the disc thickness of the host galaxy (see also Elmegreen & Elmegreen, 2006). Finally, Dessauges-Zavadsky & Adamo (2018) reported that the stellar mass function of clumps at follows a power-law with a slope close to , similar to the one of local/nearby star clusters and H ii regions (e.g. Grasha et al., 2017; Adamo et al., 2017; Messa et al., 2018), and expected if clumps are formed via the turbulence-driven fragmentation process (Elmegreen et al., 2006; Guszejnov, Hopkins & Grudić, 2018; Ma et al., 2020).
The compilation of UV-bright clumps hosted the HST Ultra Deep Field galaxies and in the strongly lensed galaxies, now also imaged with the James Webb Space Telescope (JWST), which benefits from the best sensitivity and the best spatial resolution imaging, shows clump sizes and stellar masses ranging from to with a median of (Elmegreen et al., 2013; Dessauges-Zavadsky et al., 2017; Cava et al., 2018; Meštrić et al., 2022; Messa et al., 2022; Claeyssens et al., 2022). These revised clump properties, indicating sizes much smaller than 1 kpc and masses with a median lower than initially reported, nevertheless, confirm that the high-redshift clumps remain more massive by orders of magnitude than the local/nearby star clusters (e.g. Bastian et al., 2006; Adamo et al., 2013). They yet have stellar mass surface densities comparable to the average surface density of a nearby massive cluster (Brown & Gnedin, 2021; Messa et al., 2022; Claeyssens et al., 2022). They are very well reproduced by the high-resolution hydrodynamical simulations (e.g. Tamburello et al., 2015; Mandelker et al., 2017; Fensch & Bournaud, 2021), which have proposed that the high-redshift, gas-rich, rotation-dominated galaxies, characterized by highly turbulent gas discs, fragment because of violent gravitational instability driven by intense cosmic web cold gas inflows (e.g. Agertz, Teyssier & Moore, 2009; Dekel et al., 2009; Bournaud et al., 2010), and produce gravitationally bound gas clouds, the progenitors of the stellar clumps ubiquitously seen in high-redshift galaxies. If this scenario is correct, one should also observe the parent gas clouds.
The cold molecular gas in nearby galaxies is usually traced by the carbon monoxide (CO) and is structured in giant molecular clouds (GMCs). These GMCs with masses and pc radii contract and form star clusters (Bolatto, Wolfire & Leroy, 2013). Their detection at such a small scale in distant galaxies is observationally challenging even in interferometric data. Numerous studies searching for these clouds in the far-IR dust continuum images of high-redshift submillimeter galaxies (SMGs) led to non-detections showing essentially a smooth dust emission (e.g. Hodge et al., 2016, 2019; Gullberg et al., 2018; Rujopakarn et al., 2019; Ivison et al., 2020). Only a few studies reported GMC detections in the CO emission maps of SMGs (Swinbank et al., 2015; Cañameras et al., 2017; Tadaki et al., 2018). We obtained the first detection of GMCs in a clumpy, main-sequence, rotation-dominated galaxy—the strongly lensed Cosmic Snake galaxy at —characterized by a stellar mass of , a star-formation rate of , and a molecular gas to stellar mass fraction of per cent (Dessauges-Zavadsky et al., 2019). The kinematics, the metallicity, and the radial profiles of surface densities of , , molecular gas mass (), and dust mass of the Cosmic Snake galaxy were studied by Patrício et al. (2018, 2019), Girard et al. (2019), and Nagy et al. (2022), respectively. The combination of the superb angular resolution achieved with ALMA and gravitational lensing allowed to map the emission of the CO(4–3) line of this galaxy at the resolution of nearby galaxies (Sun et al., 2018; Rosolowsky et al., 2021), reading down to 30 pc, and to perform the GMC search in the velocity space (in channel intensity maps). We identified 17 GMCs with on average 100 times higher and 10 times higher surface densities than for most of the local/nearby GMCs (Dessauges-Zavadsky et al., 2019). The high masses of the identified GMCs are close to the stellar masses of the UV-bright clumps detected by Cava et al. (2018) in comparable numbers in the HST images of the Cosmic Snake galaxy at a similar spatial resolution to the ALMA images. In Dessauges-Zavadsky et al. (2019) we concluded that this corroborates the in-situ formation of high-redshift stellar clumps. Moreover, we proposed that the physical properties derived for the Cosmic Snake GMCs (high mass, high density, and high internal turbulence) suggest that, also at high redshift, GMCs seem to form with properties that adjust to the host galaxy’s ambient interstellar medium (ISM) conditions (pressure, turbulence, density, etc.), as observed for nearby GMCs (Hughes et al., 2013; Sun et al., 2018, 2020).
In this work we study another clumpy, main-sequence, proto-typical Milky Way galaxy—the A521-sys1 galaxy at —strongly lensed by the galaxy cluster Abell 521. Its kinematics is characteristic of rotation-dominated galaxies at cosmic noon, with a high velocity dispersion and a low rotation velocity over velocity dispersion ratio of (Patrício et al., 2018; Girard et al., 2019). Resembling the Cosmic Snake galaxy, in terms of redshift, , (Nagy et al., 2022), and per cent (this work), we seek to test and generalize the results found for the Cosmic Snake GMCs. A detailed analysis of the HST near-UV to near-IR images by Messa et al. (2022) allowed to identify 18 UV-bright clumps with stellar masses of . Here we analyse the ALMA CO(4–3) observations obtained at a spatial resolution close to the HST images, which we use to search for GMCs down to a physical scale of pc.
The paper is organized as follows. In Section 2 the lens model of Abell 521 is presented. Section 3 describes the ALMA observations, and the data reduction and imaging. In Section 4 we explain how the search for the molecular clouds was performed and how their physical properties were derived. We discuss the GMC physical properties and their implications in Section 5. Our conclusions can be found in Section 6. We adopt the -CDM cosmology with , , , and the Salpeter (1955) initial mass function.
2 Lens model
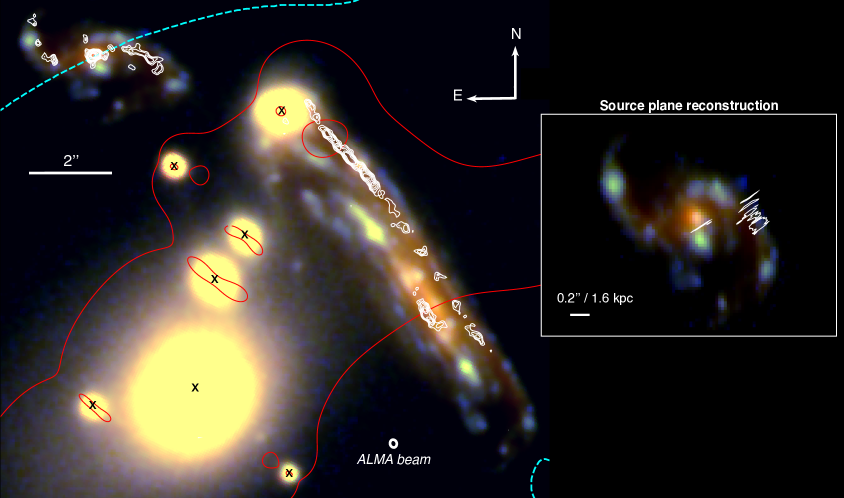
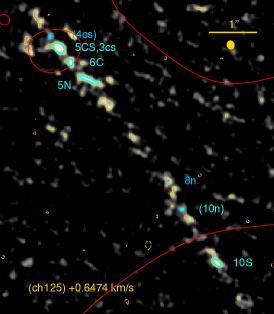
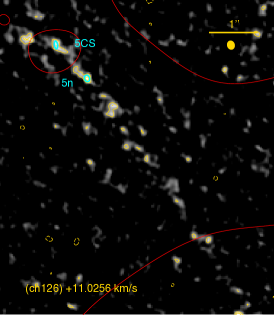
Lensed by the galaxy cluster Abell 521, the targeted galaxy A521-sys1 is multiply-imaged as illustrated in Fig. 1. There is one isolated and uniformly lensed image of the entire galaxy, magnified by a factor to 6, observed in the north-east; and five strongly magnified and stretched images, covering about 55 per cent of the galaxy, that form a wide arc in the western direction of 11 arcsec in length from north to south, with high ranging from 3 to and even in sub-regions close to the critical line (see Nagy et al., 2022, Fig. 2 for a magnification map). The former image reveals the spiral structure of the galaxy with two spiral arms, while the latter images provide a zoom-in on the internal structure of less than half of the galaxy including the western spiral arm of the former image. We use the tailored lens model of the A521 cluster from Richard et al. (2010), which was refined to better match the arc at by using 7 multiply-imaged UV-bright clumps as constraints (see Messa et al., 2022, for details). The resulting root-mean-square (RMS) noise between the observed and predicted locations measured in the image-plane is 0.08 arcsec, and is determined with a typical uncertainty of the order of per cent. The reconstructed source-plane image of the A521-sys1 galaxy is shown in the left inset of Fig. 1.
3 ALMA observations, data reduction, and imaging
The A521-sys1 galaxy was observed in Cycle 4 (2016.1.00643.S) in band 6 with 41 ALMA 12 m antennae in the C40-6 configuration (maximum baseline of 3.1 km) during 89 min of on-source time. The redshifted CO(4–3) line frequency at 225.6685 GHz was used to tune the spectral window 2, which spectral resolution was set to 7.8125 MHz (). We used the remaining three 1.875 GHz spectral windows for continuum emission. As described in Girard et al. (2019), the ALMA data were reduced following the reduction pipeline distributed within CASA (the Common Astronomy Software Application; McMullin et al., 2007). For the CO(4–3) line imaging, we used a pixel size of arcsec and the Briggs weighting with the robust factor of 0.5, and we cleaned all channels until convergence using the clean routine in CASA with a custom mask. According to the ALMA Technical Handbook, the adopted weighting scheme is known to deliver low sidelobe levels for h observations and to give a reasonable balance between spatial resolution and sensitivity. We finally applied the primary beam correction. The synthesized beam size of the resulting CO(4–3) line data cube is at the position angle of . The cube has an RMS noise of per channel. The calibrated visibilities of continuum over the four spectral windows, when excluding channels where the CO(4–3) emission was detected, were also imaged, but no 1.3 mm continuum was detected.
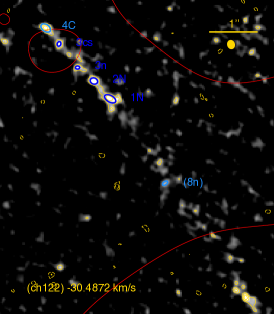
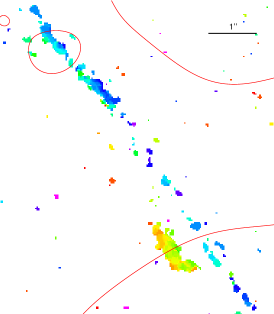
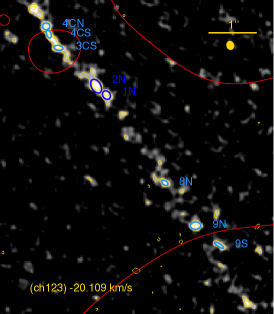
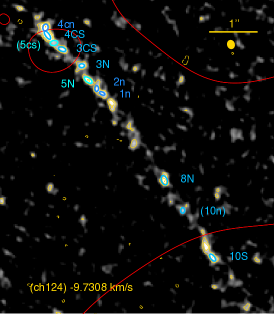
The immoments routine in CASA was used to obtain moment maps of the CO(4–3) emission. The threshold was fixed to RMS when computing the velocity first-moment and the velocity dispersion second-moment. We used the same routine to extract 12-channel intensity maps (zero-moment maps), at the native spectral resolution of , of the CO(4–3) emission covering the velocity range from to ; the zero velocity was set to . The respective channel maps are plotted in Fig. 8.
In Fig. 1 we overlay the contours of the CO(4–3) velocity-integrated intensity on the HST RGB-colour composite image of the A521-sys1 galaxy. The two spiral arms nicely visible in the HST near-UV to near-IR images of the north-east isolated and uniformly lensed image are also detected in the CO(4–3) emission, together with the CO-bright galactic central region. The western spiral arm is clearly more gas-rich than the eastern spiral arm. By chance, the western spiral arm is the arm that is multiply-imaged over the arc, where it benefits from high magnification factors. Nagy et al. (2022) showed that the CO(4–3) emission extends out to the galactocentric radius of kpc in the A521-sys1 source galaxy. This corresponds to of the radial extent of the stellar emission ( kpc) in the rest-frame optical HST F160W filter. Asymmetries in the molecular gas distribution between two spiral arms and in scale lengths of the stellar and molecular gas emission radial profiles are common in galaxies: they can be inherited from the cosmic web accretion pattern, but they can also be due to internal instabilities and the fact that dark matter halos are not spherical and can produce warps, bending modes, etc. Finally, asymmetries can be induced by interactions with (big) satellites. In the case of the A521-sys1 galaxy, there is no evidence of a massive satellite at small projected distance.
4 Analysis
4.1 Search for molecular clouds
To search for GMCs in the A521-sys1 galaxy, we considered only the multiple images within the arc, because there the magnification factors are the higher (yielding to a better spatial resolution) and because the arc is located close to the phase center, such that the RMS noise over the arc’s CO(4–3) emission is almost constant, affected by less than 4 per cent by the primary beam attenuation. We followed the methodology developed in Dessauges-Zavadsky et al. (2019) for the Cosmic Snake galaxy, which consisted in exploiting the three dimensions of the CO(4–3) data cube by searching for emission peaks of the molecular clouds in the 12-channel intensity maps extracted over the CO(4–3) emission (Fig. 8). The reliability of an emission detection against noise was evaluated by computing the fidelity of the detection at a given significance:
| (1) |
where and are, respectively, the number of positive and negative emission detections with a given signal-to-noise ratio (S/N) in the primary beam (Walter et al., 2016; Decarli et al., 2019). In individual channel maps the fidelity of 100 per cent was reached at , thus we first extracted, in the primary beam, all emissions per channel. Then, we considered emissions spatially overlapping in two adjacent channel maps, for which the fidelity of 100 per cent was reached at per channel (equivalent to for two adjacent channels). Therefore, we also extracted all emissions co-spatial in at least two adjacent channel maps111We considered two CO(4–3) emissions as co-spatial in two adjacent channel maps when their respective contours were overlapping over at least three pixels of 0.03 arcsec.. All the extracted CO(4–3) emissions were found to be distributed over the position of the detected CO(4–3) velocity-integrated intensity of the A521-sys1 multiple images, which contours are shown in white in Fig. 1. This provided support that the extracted emissions were detected at sufficiently high S/N to be real, and were not noise peaks since they were not randomly distributed. As an additional test, we also performed the search for cloud’s emission peaks in the ‘dirty’ channel maps (before the clean) that gave the same results as the emission search in the cleaned channel maps. This allowed us to establish that the clean did not give rise to noise peaks, or artificial cloud detections.
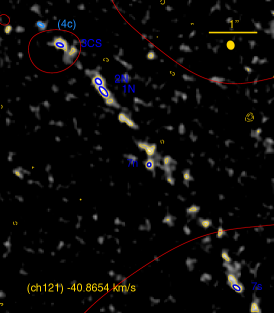
Similarly to the analysis performed for the Cosmic Snake galaxy (Dessauges-Zavadsky et al., 2019), we adopted the same definition of molecular clouds by considering CO(4–3) emissions as belonging to distinct clouds when their contours were not spatially overlapping in the same channel map, or when their contours were co-spatial, but not in adjacent channel maps (i.e. when separated by at least one channel). This allows clouds to overlap in either velocity or physical space, but not both. Following the above definition, with the help of the lens model, we could group the extracted CO(4–3) emissions spread over the A521 arc in 24 multiple images of 14 distinct GMCs. We found no GMCs overlapping along the same line of sight, and almost all GMCs (except the GMCs with IDs 1 and 2) are multiply-imaged (twice to three times) in the 12-channel intensity maps analysed as shown in Fig. 8. In fact, all the GMCs identified in one single channel map (the GMCs with IDs 7, 9, and 12), except the GMC 6, are detected in the two multiple images predicted by the lens model in the arc. The detection of these respective multiple images at the predicted locations reinforces the reliability of these GMCs, since it is unlikely to find two noise features sitting at these predicted locations. In the case of the GMC 6, we detect only one multiple image that, in reality, is a blend (within the synthesized beam) of two predicted multiple images because located almost on the critical line (see Fig. 8; same for the GMC 13). The detection of multiple images also enables us to alleviate the caveat of the possible effect of the Gibbs phenomenon, which is known to produce a non-trivial correlation across two adjacent channels resulting from the post-processing smoothing (e.g. Hanning; see the ALMA Technical Handbook). Again, all the GMCs identified over less than 3 adjacent channel maps that could be affected by the Gibbs phenomenon (the GMCs with IDs 10 and 14), are detected in two multiple images. Finally, in Appendix B we discuss the results of the CASA visibility simulations we performed that exclude the possibility that the identified GMCs are artificial clumpy features produced by lensing and interferometric effects out of a smooth exponential disc of CO(4–3) emission.
The significance level of the 14 identified GMCs ranges between and (Table 1) when integrated over their extent in velocity space from one to five adjacent channels. The GMCs with IDs 10 to 14 are found near the galactic center, and the GMCs with IDs 1 to 10 are spread along the spiral arm (the western arm of the uniformly lensed image; see Fig. 1).
The 14 GMCs are spatially offset from the 13 UV-bright stellar clumps detected over the arc by Messa et al. (2022, see their Fig. 2). The closest GMC/stellar clump pairs, located both near the galactic center and in the spiral arm, have a separation which ranges between and pc, with a median/mean of pc. This represents quite a large drift for the young stars from their birth place given the estimated ages of the stellar clumps < 100 Myr (the majority even have best-fit ages close to Myr, although with large uncertainties), much shorter than the dynamical time of the host galaxy (Messa et al., 2022). The association between the identified GMCs and stellar clumps can thus be questionable. Considering the typical lifetime of GMCs in local galaxies ( Myr; Kruijssen et al., 2019; Chevance et al., 2020; Kim et al., 2021), we can also wonder if the stellar clumps we are observing in A521-sys1 are not already old enough to have destroyed/dispersed their parent GMCs after the episode of star formation, unless high-redshift GMCs are more long-lived than the local ones given their different physical properties (see Sect. 5).
| GMC | Detection | |||||||||
|---|---|---|---|---|---|---|---|---|---|---|
| ID | pc | significance | ||||||||
| 1N | . | |||||||||
| 2N | . | |||||||||
| 3CS | . | |||||||||
| 4CS | . | |||||||||
| 5N | . | |||||||||
| 6C | . | |||||||||
| 7S | . | |||||||||
| 8N | . | |||||||||
| 9S | . | |||||||||
| 10S | . | |||||||||
| 11S | . | |||||||||
| 12S | . | |||||||||
| 13NS | . | |||||||||
| 14S | . | |||||||||
4.2 Physical properties of molecular clouds
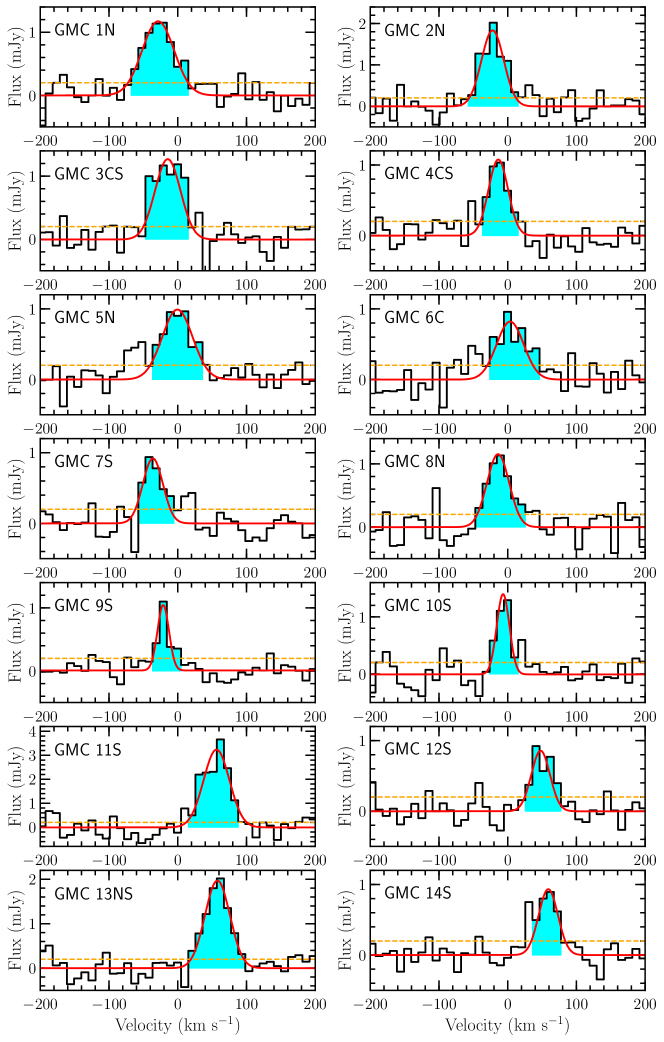
The molecular gas mass of each multiple image of a given GMC was derived by summing the lensing-corrected line-integrated fluxes of all the CO(4–3) emissions extracted for that image over a number of adjacent channels. To measure the fluxes, we used custom apertures per channel, large enough to include for each emission, all the signal above the local RMS noise level (no aperture correction was needed as the apertures used were all larger than the synthesized beam). To correct for the lensing, we considered the mean magnification factor computed over the area subtended by the intensity contour of each emission per channel222Given the small sizes of the intensity contours of the CO(4–3) emissions per channel, barely more extended in surface than the synthesized beam (at most by a factor of 1.7; see Table 1 and Fig. 8), the effect of differential magnification is negligible and is eventually accounted in the uncertainty on .; the standard deviation of the values within the intensity contour was used as the uncertainty on the mean magnification factor. When the intensity contours of emissions associated with different multiple images were spatially blended in a channel map, we tried at the best effort to deblend the signal by redistributing the blended flux among images proportionally to their respective fluxes measured above the threshold at which they were unblended. The lensing-corrected CO(4–3) line-integrated fluxes () derived for the different multiple images of the same GMC were reassuring, as they agreed within less than a factor of 2 ( flux error). We also extracted for each GMC image the integrated CO(4–3) line spectrum and performed a Gaussian function fit to the line profile, as illustrated in Fig. 9 for a sub-set of CO(4–3) line spectra. For the same GMC image, the corresponding flux was found in agreement, within measurement errors, with derived from channel intensity maps. A large flux difference (close to a factor of 3) was only obtained for two GMCs with IDs 6 and 7 that we detected at 100 per cent fidelity in one channel map. In what follows we considered for these two clouds the lower values measured from the channel maps.
Adopting the CO luminosity correction factor , as inferred for the Cosmic Snake galaxy (Dessauges-Zavadsky et al., 2019), and assuming a CO-to-H2 conversion factor (), of each multiple image of a given GMC was then calculated following:
| (2) |
where the CO(4–3) luminosity () was derived from measured for that image (Solomon et al., 1997).
The size of each multiple image of a given GMC was determined by first measuring in each channel map the radius of all the CO(4–3) emissions encompassed by that image. We then adopted the radius of the emission with the highest significance level (i.e. highest S/N) among the channels as the radius of that image, and used the standard deviation of all measured radii, added in quadrature to the measurement error, as the error on the radius. To derive the radius, we applied the method used for the Cosmic Snake GMCs (Dessauges-Zavadsky et al., 2019). As a first step, we measured the major () and minor () semi-axes of the elliptical region that best fits the area subtended by the intensity contour of the emission associated with a given multiple image, and obtained the equivalent circularized radius, . Considering a two-dimensional Gaussian distribution of the CO(4–3) emission, as it is generally assumed, we then derived the circularized radius at the full-width half-maximum (FWHM) as , where is the peak flux. Finally, to obtain the physical radius (), we deconvolved from the beam and corrected the deconvolved from the lensing using the same as for the lensing-correction of the corresponding . In the case of emissions, associated with different multiple images, having their contours spatially blended in a channel map, was derived by using the unblended higher S/N intensity contours. The resulting we measured for the different multiple images of the same GMC ended up to globally agree within less than a factor of 2 ( radius error).
The velocity dispersion of each multiple image of a given GMC was estimated by measuring in the CO(4–3) velocity dispersion second-moment map the mean velocity dispersion over the area subtended by the intensity contours of all the CO(4–3) emissions encompassed by that image. We adopted the largest velocity dispersion measured as the velocity dispersion () of the image, and used the standard deviation of all velocity dispersions, added in quadrature to the measurement error, as the error on . Here again, we got an agreement between derived for the different multiple images of the same GMC within less than a factor of 2 ( velocity dispersion error). However, as these were relying on the global second-moment map integrated over the whole (12-channels) A521-sys1 CO(4–3) emission, and not over the specific channels of the CO emission of the respective GMCs (which would have generated noisy second-moment maps), we also inferred the GMC measurements from the line FWHM obtained from the Gaussian fit of the integrated CO(4–3) line spectrum extracted for each GMC image (see a sub-set of those spectra and fits in Fig. 9), and corrected for the final channel spacing (see the ALMA Technical Handbook). We found consistent , within measurement errors, for the two methods. This consistency suggested that the measurements were not too affected by the beam smearing; as further supported by the fact that the GMCs with IDs 10 to 14, located near the galactic center where the beam smearing effect is expected to be the largest, were not found to be biased toward high .
The adopted physical properties – , , , , and – of the 14 GMCs identified in the A521-sys1 galaxy are listed in Table 1; we chose the measurements obtained for the less blended multiple images in channel maps of each GMC. The corresponding CO(4–3) emission line spectra are shown in Fig. 9. No specific difference is found between the physical properties of the GMCs located near the galactic center and those located in the spiral arm. The two sets of GMCs encompass the same range of , , and values.
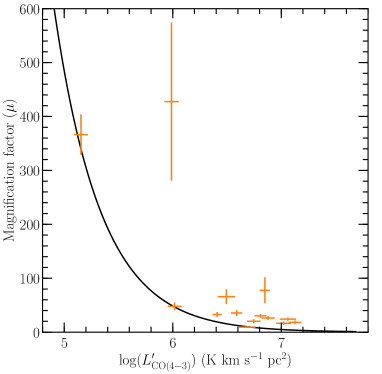
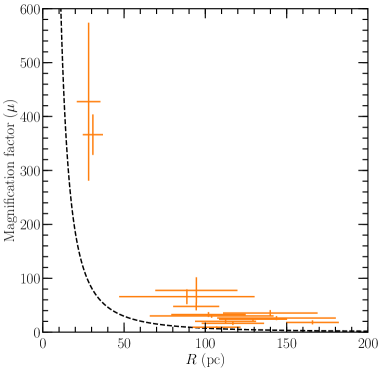
The 14 GMCs are spatially resolved, as their radii and masses are larger than, respectively, the magnification-dependent equivalent circularized beam resolution limit and the magnification-dependent flux detection limit (corresponding to the 100 per cent fidelity), as shown in Fig. 2. Nevertheless, we cannot exclude that some of the identified GMCs are not GMC associations, composed of several GMCs superposed along the line of sight that only observations with better spectral resolution () will resolve. Projection effects are indeed likely given the inclination of of the A521-sys1 galaxy (Patrício et al., 2018). Therefore, we should remember that the inferred GMC masses and radii can still be upper limits.
Altogether the 14 GMCs (corrected for lensing) account for about 11 per cent of the total lensing-corrected CO(4–3) velocity-integrated flux we measured in the A521-sys1 arc, where the GMCs were searched for and identified; about 55 per cent of the A521-sys1 source galaxy is imaged in the arc. This means there still is a substantial amount of CO(4–3) molecular gas in the galaxy beside the detected GMCs, which is an unresolved ‘background’. This gas can be in a diffuse phase, but we consider it is mostly made of sub-clouds, which are not resolved due to our limited angular resolution with ALMA. A hierarchical fragmentation over several orders of magnitude and well below pc is indeed expected, and is believed to result from the hierarchical nature of turbulence (Elmegreen & Efremov, 1997; Padoan & Nordlund, 2002; Hopkins, 2013a, b). As a result, the molecular gas follows a quasi-hierarchical structure, containing sub-clouds, clouds, and sub-clouds inside clouds. Therefore, in the same way as proceeded by Solomon et al. (1987) for local GMCs where they took all the mass above a certain level of integrated intensity, no background was subtracted when we measured the mass of GMCs in order to take all the mass within the boundary of a GMC including all sub-clumps.
Finally, we would like to stress that we did not find much smooth emission in our high-resolution ALMA data of A521-sys1. This is not due to the filtered out large-scale CO(4–3) emission, since the total integrated ALMA CO(4–3) emission flux333We integrated the ALMA CO(4–3) emission over all A521-sys1 multiple images, since they were all covered by the large IRAM 30 m beam. agrees with the fluxes inferred from the CO(2–1) and CO(3–2) lines detected with the IRAM 30 m single dish antenna (F. Boone, private communication), for a CO spectral line energy distribution typical of galaxies at (Daddi et al., 2015; Dessauges-Zavadsky et al., 2015).
4.3 Virial equilibrium and CO-to-H2 conversion factor
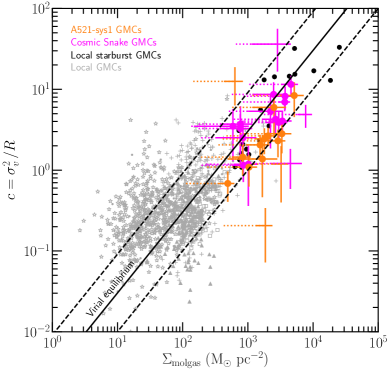
A way to give credit to the identified GMCs in the A521-sys1 galaxy is to determine whether they are gravitationally bound structures in virial equilibrium. Most of the GMCs in local/nearby galaxies, as well as in the Cosmic Snake galaxy at , are indeed virialized (Heyer et al., 2009; Sun et al., 2018; Dessauges-Zavadsky et al., 2019; Rosolowsky et al., 2021). A way to determine the dynamical state of GMCs is to consider the size-velocity dispersion coefficient () that is linearly proportional to the gas mass surface density () for a virialized GMC. In Fig. 3 we show that within a factor of 3 11 out of the 14 A521-sys1 GMCs are distributed around the one-to-one – relation, independently of the considered between the Milky Way value of and the starburst value of (Bolatto, Wolfire & Leroy, 2013). The factor of 3 uncertainty in this parameter space corresponds to the standard deviation of the local GMC distribution ( dex) and to measurement errors. Therefore, within this uncertainty GMCs are usually assumed to be in virial equilibrium, although some of them can be transient structures or collapsing.
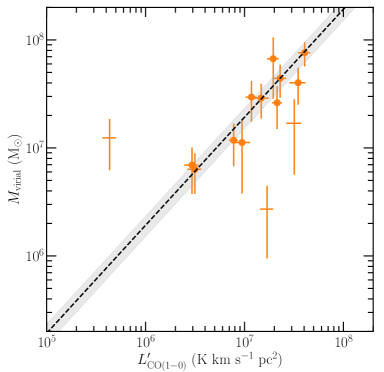
For virialized GMCs, their virial mass is expected to be linearly proportional to CO luminosity (Bolatto et al., 2008; Bolatto, Wolfire & Leroy, 2013). Therefore, we can obtain measurements from the GMC internal kinematics. As done for the Cosmic Snake GMCs (Dessauges-Zavadsky et al., 2019), to compute the virial mass () we assumed GMCs to be spherical and have their density profile inversely proportional to radius (Solomon et al., 1987; Hughes et al., 2013):
| (3) |
In Fig. 4 we show as a function of (lensing-corrected) of the 14 A521-sys1 GMCs at . The 11 GMCs, found in virial equilibrium (Fig. 3), are distributed about the mean with a standard deviation of . This suggests a lower than in the Cosmic Snake galaxy, where we determined, also from the GMC internal kinematics, (Dessauges-Zavadsky et al., 2019). Both galaxies at yet have a solar metallicity (Patrício et al., 2018) and a comparable SFR of (Nagy et al., 2022), what changes is the median of their respective GMCs. The significantly higher SFR of these galaxies than of the Milky Way galaxy implies a stronger photodissociating radiation, and explains their globally lower with respect to the Milky Way value. However, in the case of the Cosmic Snake galaxy the GMC happen to be so high, with a median value of (for the above cited ), that the GMCs are shielded from the ambient radiation. This is less the case for the A521-sys1 GMCs, which have a median (for the derived ), and therefore the CO-to-H2 conversion factor in A521-sys1 could have ended up to be lower. However, globally the factor of two difference in the values derived for the two galaxies at , both with about solar metallicities, is within the spread of the measurements obtained for nearby solar metallicity galaxies (e.g. Leroy et al., 2011; Sandstrom et al., 2013).
5 Discussion
5.1 Larson scaling relations
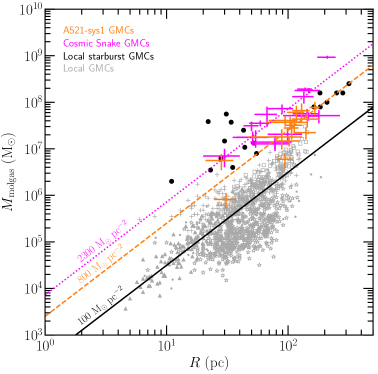
The GMCs hosted in the A521-sys1 galaxy have high 444Obtained by adopting derived in Sect. 4.3., with a median of . This is two orders of magnitude higher than the median of GMCs found in the Milky Way, local dwarf galaxies, and nearby spirals (; Bolatto et al., 2008; Heyer et al., 2009; Donovan Meyer et al., 2013; Colombo et al., 2014; Corbelli et al., 2017). With their , they also have a high median (see Sect. 4.3), almost 10 times higher than local GMCs (). Their are large enough to enable them to be in virial equilibrium.
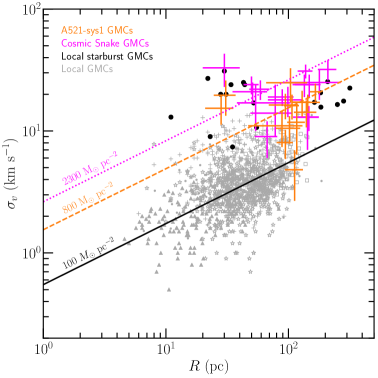
These measurements, together with the physical properties derived for the Cosmic Snake GMCs, confirm that GMCs hosted in main-sequence galaxies at differ from GMCs in the local Universe. This is very well assessed when considering the Larson scaling relations, used as the benchmark for the typical local GMC population (Larson et al., 1981; Bolatto et al., 2008). In Fig. 5 we plot, respectively, the first Larson scaling relation – that shows a constant at for local GMCs (grey data points; top panel), and the second Larson scaling relation – that calibrates of virialized local GMCs (grey data points; bottom panel). The GMCs at are clearly offset from these two relations. On the other hand, as already suggested in Dessauges-Zavadsky et al. (2019), the high-redshift GMCs very much resemble GMCs hosted in the Antennae galaxy merger (Wei et al., 2012) and the NGC 253 nuclear starburst (Leroy et al., 2015), which are also offset from the Larson relations because immersed in an ISM characterized by an enhanced SFR per unit mass of molecular gas and a strong ambient pressure (see also the GMCs hosted in the starburst galaxy NGC 4826; Rosolowsky & Blitz, 2005; Rosolowsky et al., 2021). It has now been evidenced by a number of studies of GMCs in nearby galaxies that the physical properties of GMCs are indeed dependent on their surrounding local environment (e.g. Hughes et al., 2013; Sun et al., 2018, 2020). The A521-sys1 GMCs further support the strong influence of the ambient ISM, which at clearly differs from the ISM of nearby quiescent galaxies as discussed in the next Sect. 5.2.
5.2 Pressure equilibrium
The internal kinetic pressure () of the A521-sys1 GMCs can be determined following Hughes et al. (2013):
| (4) |
As shown in Fig. 6, we found strong between , comparable to the distribution of the values determined for the Cosmic Snake GMCs at their low-pressure end. The measurements in the GMCs show a dependence on , which very well extends, toward higher , the – correlation reported for typical local GMCs (Hughes et al., 2013; Sun et al., 2018).
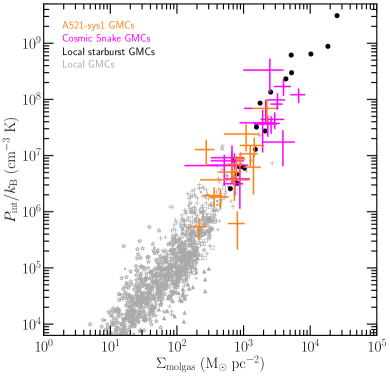
In Swinbank et al. (2015) and Dessauges-Zavadsky et al. (2019) it was argued that the strong of high-redshift GMCs is linked to the strong hydrostatic pressure at the disc midplane () observed in their host galaxies, which was suggested to approximate the pressure at the boundary of molecular clouds (Elmegreen, 1989; Blitz & Rosolowsky, 2004). For a two-component disc of gas and stars, can be estimated as:
| (5) |
where is the gravitational constant, and , , and , , respectively, are the neutral (atomic + molecular) gas and stellar mass surface densities and velocity dispersions (Elmegreen, 1989; Blitz & Rosolowsky, 2004). Similarly to Dessauges-Zavadsky et al. (2019) and Swinbank et al. (2015), we assumed the neutral gas of high-redshift galaxies to be dominated by the molecular gas, and . We derived and from the total molecular gas and stellar masses, respectively, measured in the uniformly lensed image of the A521-sys1 galaxy (see Fig. 1). This gave us , namely a factor of weaker than in the Cosmic Snake galaxy (Dessauges-Zavadsky et al., 2019), but a factor of stronger than the hydrostatic pressure of nearby quiescent galaxies, including the Milky Way disc (Hughes et al., 2013).
The results obtained for the A521-sys1 galaxy, showing a weaker (mostly because of the lower molecular gas mass surface density of A521-sys1; Nagy et al., 2022) together with slightly more moderate GMC physical properties (density, turbulence, internal pressure) than in the Cosmic Snake galaxy (see Figs. 5 and 6), bring an additional evidence that GMCs form with properties adjusted to the ambient ISM conditions particular to the host galaxy, and this not only in local galaxies but also in high-redshift galaxies. In summary, the GMCs of main-sequence galaxies at show variations in their properties from galaxy to galaxy. Their properties resemble those of local GMCs hosted in starbursting media, where the ambient pressure is comparable to the one observed in the ISM of high-redshift galaxies (Rosolowsky & Blitz, 2005; Hughes et al., 2013; Leroy et al., 2015; Sun et al., 2020). However, they are different from the properties of typical local GMCs, because the strong of distant galaxies exceeds the self-gravity of these local GMCs that would be rapidly compressed.
5.3 Efficiency of star formation
The Cosmic Snake GMCs at were found to be highly supersonic, with a median Mach number () of (Dessauges-Zavadsky et al., 2019), almost 10 times higher than that of typical local GMCs (Leroy et al., 2015). We suggested that such a highly supersonic turbulence may imply a particularly efficient formation of stars in these GMCs, given that star clusters form by gravitational collapse of shock-compressed density fluctuations generated from the supersonic turbulence in GMCs (McKee & Ostriker, 2007; Brunt, Heyer & Mac Low, 2009). And, indeed, we estimated the GMC star-formation efficiency () to be as high as per cent from the simple comparison of the mass distribution of GMCs and stellar clumps identified in the Cosmic Snake galaxy (Dessauges-Zavadsky et al., 2019). This is sensibly higher than % reported in nearby galaxies (Evans et al., 2009; Chevance et al., 2020; Kim et al., 2021), but consistent with the – scaling-relation predicted for molecular clouds by numerical simulations (Grudić et al., 2018, 2022).
The A521-sys1 GMCs discussed here and the stellar clumps analysed by Messa et al. (2022) offer a new opportunity to investigate in a galaxy at . We derived the GMC Mach number () following the prescriptions of Leroy et al. (2015):
| (6) |
where is the sound speed estimated for molecular hydrogen at K. We derived a high median for the 14 A521-sys1 GMCs, showing they are highly supersonic, as are the Cosmic Snake GMCs, and may hence potentially experience a high .
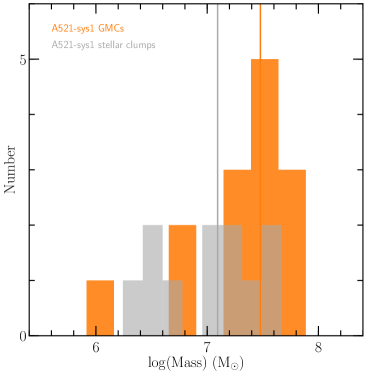
In Fig. 7 we compare the distributions of masses of the 14 GMCs and the 11 stellar clumps (Messa et al., 2022) identified in the A521-sys1 galaxy, all imaged over the arc within regions where 555We focussed only on stellar clumps imaged over the arc and that benefit from high (Messa et al., 2022).. This comparison can be used to estimate in the same way as for local galaxies via (Evans et al., 2009) given that: the identified stellar clumps are young, with ages mainly Myr, i.e. likely tracing the recent star-formation episodes as do the GMCs (Messa et al., 2022); and the stellar clumps and GMCs were identified at a similar spatial resolution, throughout, respectively, the HST near-UV to near-IR images (with the PSF varying from 0.10 to 0.24 arcsec; Messa et al., 2022) and the ALMA images (with the synthesized circularized beam of 0.17 arcsec). It appears that the most massive GMCs are only slightly more massive than the most massive stellar clumps, which suggests a relatively high . Considering the median values of the molecular gas masses of the GMCs and of the stellar masses of the stellar clumps, we get per cent in this galaxy, provided that the observed massive stellar clumps (star cluster complexes/associations) were formed within GMCs with comparable physical properties to those we identified.
We also estimated the star-formation efficiency per free-fall time ():
| (7) |
is the free-fall time defined as , where is the volume gas density, and is considered as the characteristic time-scale for the GMC gravitational free-fall collapse inducing the formation of stars (Krumholz, Dekel & McKee, 2012; Federrath & Klessen, 2012). A theoretical value of per cent is commonly accepted in the literature (especially in numerical simulations), meaning that each free-fall time a galaxy typically converts about 1 per cent of its dense gas into stars (e.g. Krumholz & Tan, 2007; McKee & Ostriker, 2007; Krumholz, Dekel & McKee, 2012). This value is globally supported by observations, although important deviations exist among different environments of nearby galaxies (e.g. Leroy et al., 2017; Ochsendorf et al., 2017; Utomo et al., 2018; Schruba, Kruijssen & Leroy, 2019; Kim et al., 2021).
Under the simple assumption that the detected high-redshift A521-sys1 GMCs are spherical (see also Sect. 4.3), their range between 1 and 6 Myr, with a median value of Myr, comparable to the free-fall times measured for GMCs in nearby galaxies (see references above). We carried out the estimation of in the A521-sys1 galaxy for three cases: (1) considering the total and the total 666Derived from the CO(4–3) line emission, and calculated by adopting and determined in Sect. 4.3. As mentioned in Sect. 4.2, the CO(2–1) and CO(3–2) emission lines, detected with the IRAM 30 m single dish antenna, give comparable total molecular gas mass estimates (F. Boone, private communication). integrated over the entire galaxy; (2) considering the radial measurements from Nagy et al. (2022), inferred in concentric elliptical rings centred on the galaxy center; and (3) considering the total galactic , but the contribution from the 14 GMCs only that means considering only the compact/dense CO gas that drives most of the star formation of the galaxy. For case (1) we found a low per cent, and for case (2) ranged between 0.9 and 4.3 per cent. For case (3) we obtained a much higher per cent, which is more in line with the estimation above. While the derived for cases (1) and (2) are in line with most of the measurements reported for nearby galaxies (Utomo et al., 2018, and references above), for case (3) stands out of the range. The difference between cases (1) + (2) and case (3) comes from the fact that the compact/dense molecular gas found in GMCs represents a small fraction of about 11 per cent in mass of the total molecular gas that is observed in the A521-sys1 galaxy (Sect. 4.2). In the definition of (equation (7)), the molecular gas mass precisely refers to the dense gas mass that is available for the star formation (Kim et al., 2021). Therefore, we believe that our estimate of per cent for case (3) is most likely characterising the more efficient star-formation process taking place in the A521-sys1 galaxy compared to nearby galaxies.
6 Conclusions
We present the analysis of the CO(4–3) molecular gas emission of the A521-sys1 main-sequence star-forming galaxy at . In the HST rest-frame UV to optical images, the galaxy is clumpy, showing several UV-bright clumps (Messa et al., 2022), and has a nice spiral structure, also traced by the CO(4–3) emission (see Fig. 1) that even exhibits a surface over-density of molecular gas mass in the galaxy radial profile at the location of the spiral arms (Nagy et al., 2022). The kinematics of both ionized ([O ii] emission) and molecular (CO(4–3) emission) gas reveals a rotating disc, with an inclination-corrected rotation velocity of (Patrício et al., 2018; Girard et al., 2019). The respective velocity dispersions significantly differ between for the ionized gas and for the molecular gas (Girard et al., 2019). We can determine the Toomre stability parameter (Toomre, 1964) for a constant rotation velocity as follows:
| (8) |
where is the molecular gas mass to total (including gas, stars, and dark matter) mass fraction (Escala & Larson, 2008; Genzel et al., 2011). With and , the A521-sys1 galaxy has smaller than 14 per cent as one also needs to account for the dark matter mass. The dynamical mass estimate, obtained under the disc-like potential hypothesis, does not show evidence for a large amount of dark matter ( per cent). Moreover, given that has not to be isotropic, is likely close to 1 for the molecular gas disc, as expected since once disc fragmentation occurred, should become to regulate the system. Numerical simulations indeed show that the UV-bright stellar clumps, ubiquitously observed in galaxies at cosmic noon (e.g. Guo et al., 2015; Dessauges-Zavadsky et al., 2017; Cava et al., 2018; Zanella et al., 2019), form in gas clouds produced from the fragmentation process of high-redshift gas-rich, turbulent discs (e.g. Dekel et al., 2009; Tamburello et al., 2015; Mandelker et al., 2017; Renaud, Romeo & Agertz, 2021). Feedback and molecular gas fraction play a key role here, since to undergo the phase of violent disc instability the feedback has not to be too strong (Mayer et al., 2016) and has to be at least per cent for fragmentation to happen and the formation of long-lived clouds (Tamburello et al., 2015; Fensch & Bournaud, 2021).
By combining the ALMA high angular resolution imaging capability with gravitational lensing, our study of the A521-sys1 strongly-lensed galaxy led to the second observational discovery of GMCs in a proto-Milky Way galaxy at , after the Cosmic Snake galaxy (Dessauges-Zavadsky et al., 2019). Fourteen GMCs were identified, with 11 found to be gravitationally bound structures in virial equilibrium. They provide additional clues that GMCs hosted in typical high-redshift main-sequence galaxies are different from local GMCs. They have, on average, 100 times higher , 10 times higher , almost 100 times stronger internal kinetic pressures, and 10 times enhanced supersonic turbulence, resulting in being located above the Larson scaling relations for local GMCs (Larson et al., 1981; Bolatto et al., 2008). Only GMCs hosted in nearby starbursting and merger galaxies (e.g. Wei et al., 2012; Leroy et al., 2015; Rosolowsky et al., 2021), sometimes considered as the high-redshift galaxy analogues, show comparable physical properties. These findings support that, now and at other look-back times, GMCs form with properties that adjust to the ambient ISM conditions (pressure, turbulence, density, etc.) prevalent in the host galaxy.
This picture is further validated by the variations in the physical properties we observe among local GMCs (Hughes et al., 2013; Sun et al., 2018, 2020), as well as among high-redshift GMCs hosted in different galaxies. Indeed, we may see that the 7 times weaker hydrostatic pressure that we estimated at the disc midplane of the A521-sys1 galaxy, in comparison to the one of the Cosmic Snake galaxy, seems to impact in cascade all the properties of the A521-sys1 GMCs with respect to those of the Cosmic Snake GMCs: it first implies a weaker GMC internal kinetic pressure, which yields on the one hand i) a lower gas mass surface density (Fig. 6) and on the other hand ii) a less extreme supersonic turbulence given the lower internal velocity dispersion (equation (6)). Because of i) GMCs results in being less shielded from the ambient photodissociating radiation and therefore we measured a smaller CO-to-H2 conversion factor from the virialized clouds (Sect. 5.2), and because of ii) GMCs are found to be slightly less efficient in forming stars (Sect. 5.3).
In summary, the GMCs, detected in the A521-sys1 galaxy and the Cosmic Snake galaxy, have masses high enough to support the in-situ formation of the massive stellar clumps (star cluster complexes/associations) we see in comparable numbers in the HST rest-frame UV to optical images of these two galaxies (Messa et al., 2022; Cava et al., 2018), as well as in up to per cent of galaxies at (Guo et al., 2015). Their similar molecular gas and stellar mass distributions suggest a relatively high star-formation efficiency of per cent in these GMCs. We estimated the star-formation efficiency per free-fall time to be per cent in the A521-sys1 galaxy. To confirm the possible trend of an enhanced star-formation efficiency in GMCs of high-redshift galaxies, high-resolution H observations, tracing the very recent () star formation, are needed, as motivated by the studies of GMC star-formation time-scales and efficiencies led in nearby galaxies (e.g. Kruijssen et al., 2019; Chevance et al., 2020), based on the statistical framework developed by Kruijssen & Longmore (2014) and Kruijssen et al. (2018), built on the spatial correlation/decorrelation of GMCs and young stars on small scales. Planned JWST Cycle 1 H integral-field NIRSpec observations of the Cosmic Snake galaxy will help to shed light on this important physical parameter so far usually fixed to per cent as measured in nearby galaxies (Krumholz, Dekel & McKee, 2012).
Acknowledgements
The data analysed in this paper were obtained with the ALMA Observatory, under the program 2016.1.00643.S. ALMA is a partnership of ESO (representing its member states), NSF (USA) and NINS (Japan), together with NRC (Canada), MOST and ASIAA (Taiwan), and KASI (Republic of Korea), in cooperation with the Republic of Chile. The Joint ALMA Observatory is operated by ESO, AUI/NRAO and NAOJ. M.M. and A.A. acknowledge the support of the Swedish Research Council, Vetenskapsrådet project grants 2019-00502 and 2021-05559, respectively.
Data Availability
The data underlying this article will be shared on reasonable request to the corresponding author.
References
- Adamo et al. (2013) Adamo A., Östlin G., Bastian N., Zackrisson E., Livermore R.C., Guaita L., 2013, ApJ, 766, 105
- Adamo et al. (2017) Adamo A. et al., 2017, ApJ, 841, 131
- Agertz, Teyssier & Moore (2009) Agertz O., Teyssier R., Moore B., 2009, MNRAS, 397, L64
- Bastian et al. (2006) Bastian N., Emsellem E., Kissler-Patig M., Maraston C., 2006, A&A, 445, 471
- Blitz & Rosolowsky (2004) Blitz L., Rosolowsky E., 2004, ApJL, 612, L29
- Bolatto et al. (2008) Bolatto A.D., Leroy A.K., Rosolowsky E., Walter F., Blitz L., 2008, ApJ, 686, 948
- Bolatto, Wolfire & Leroy (2013) Bolatto A.D., Wolfire M., Leroy A.K., 2013, ARA&A, 51, 207
- Bournaud et al. (2010) Bournaud F., Elmegreen B.G., Teyssier R., Block D.L., Puerari I., 2010, MNRAS, 409, 1088
- Brown & Gnedin (2021) Brown G., Gnedin O.Y., 2021, MNRAS, 508, 5935
- Brunt, Heyer & Mac Low (2009) Brunt C.M., Heyer M.H., Mac Low M.-M., 2009, A&A, 504, 883
- Cañameras et al. (2017) Cañameras R. et al., 2017, A&A, 604, A117
- Cava et al. (2018) Cava A., Schaerer D., Richard J., Pérez-González P.G., Dessauges-Zavadsky M., Mayer L., Tamburello V., 2018, NatAs, 2, 76
- Chevance et al. (2020) Chevance M. et al., 2020, MNRAS, 493, 2872
- Claeyssens et al. (2022) Claeyssens A., Adamo A., Richard J., Mahler G., Messa M., Dessauges-Zavadsky M., 2022, MNRAS, submitted [arXiv:2208.10450]
- Colombo et al. (2014) Colombo D. et al., 2014, ApJ, 784, 3
- Conselice et al. (2004) Conselice C.J. et al., 2004, ApJL, 600, L139
- Corbelli et al. (2017) Corbelli E. et al., 2017, A&A, 601, A146
- Cowie, Hu & Songaila (1995) Cowie L.L., Hu E.M., Songaila A., 1995, AJ, 110, 1576
- Daddi et al. (2015) Daddi E. et al., 2015, A&A, 577, A46
- Decarli et al. (2019) Decarli R. et al., 2019, ApJ, 882, 138
- Dekel et al. (2009) Dekel A. et al., 2009, Nature, 457, 451
- Dessauges-Zavadsky et al. (2015) Dessauges-Zavadsky M. et al., 2015, A&A, 577, A50
- Dessauges-Zavadsky et al. (2017) Dessauges-Zavadsky M., Schaerer D., Cava A., Mayer L., Tamburello V., 2017, ApJL, 836, L22
- Dessauges-Zavadsky & Adamo (2018) Dessauges-Zavadsky M., Adamo A., 2018, MNRAS, 479, L118
- Dessauges-Zavadsky et al. (2019) Dessauges-Zavadsky M. et al., 2019, NatAs, 3, 1115
- Dessauges-Zavadsky et al. (2020) Dessauges-Zavadsky M., Richard J., Combes F., Schaerer D., Rujopakarn W., Mayer L., 2020, IAU 352, p. 269
- Donovan Meyer et al. (2013) Donovan Meyer J. et al., 2013, ApJ, 772, 107
- Elmegreen (1989) Elmegreen B.G., 1989, ApJ, 338, 178
- Elmegreen & Efremov (1997) Elmegreen B.G., Efremov Y.N., 1997, ApJ, 480, 235
- Elmegreen & Elmegreen (2006) Elmegreen B.G., Elmegreen D.M., 2006, ApJ, 650, 644
- Elmegreen et al. (2006) Elmegreen B.G., Elmegreen D.M., Chandar R., Whitmore B., Regan M., 2006, ApJ, 644, 879
- Elmegreen et al. (2007) Elmegreen D.M. Elmegreen B.G., Ravindranath S., Coe D.A., 2007, ApJ, 658, 763
- Elmegreen et al. (2013) Elmegreen B.G. et al., 2013, ApJ, 774, 86
- Elmegreen et al. (2017) Elmegreen B.G., Elmegreen D.M., Tompkins B., Jenks L.G., 2017, ApJ, 847, 14
- Escala & Larson (2008) Escala A., Larson R.B., 2008, ApJ, 685, L31
- Evans et al. (2009) Evans N.J.II et al., 2009, ApJS, 181, 321
- Federrath & Klessen (2012) Federrath C., Klessen R.S., 2012, ApJ, 761, 156
- Fensch & Bournaud (2021) Fensch J., Bournaud F., 2021, MNRAS, MNRAS, 505, 3579
- Förster Schreiber et al. (2009) Förster Schreiber N.M. et al., 2009, ApJ, 706, 1364
- Genzel et al. (2011) Genzel R. et al., 2011, ApJ, 733, 101
- Girard et al. (2018) Girard M., Dessauges-Zavadsky M., Schaerer D., Richard J., Nakajima K., Cava A., 2018, A&A, 619, A15
- Girard et al. (2019) Girard M., Dessauges-Zavadsky M., Combes F., Chisholm J., Patrício V., Richard J., Schaerer D., 2019, A&A, 631, A91
- Girard et al. (2020) Girard M. et al., 2020, MNRAS, 497, 173
- Grasha et al. (2017) Grasha K. et al., 2017, ApJ, 842, 25
- Grudić et al. (2018) Grudić M.Y., Hopkins P.F., Faucher-Giguère C.-A., Quataert E., Murray N., Kereš D., 2018, MNRAS, 475, 3511
- Grudić et al. (2022) Grudić M.Y., Hafen Z., Rodriguez C.L., Guszejnov D., Lamberts A., Wetzel A., Boylan-Kolchin M., Faucher-Giguère C.-A., 2022, MNRAS, submitted [arXiv:2203.05732]
- Guo et al. (2012) Guo Y., Giavalisco M., Ferguson H.C., Cassata P., Koekemoer A.M., 2012, ApJ, 757, 120
- Gullberg et al. (2018) Gullberg B. et al., 2018, ApJ, 859, 12
- Guo et al. (2015) Guo Y. et al., 2015, ApJ, 800, 39
- Guo et al. (2018) Guo Y. et al., 2018, ApJ, 853, 108
- Guszejnov, Hopkins & Grudić (2018) Guszejnov D., Hopkins P.F., Grudić M., 2018, MNRAS, 477, 5139
- Heyer et al. (2009) Heyer M., Krawczyk C., Duval J., Jackson J.M., 2009, ApJ, 699, 1092
- Hodge et al. (2016) Hodge J.A. et al., 2016, ApJ, 833, 103
- Hodge et al. (2019) Hodge J.A. et al., 2019, ApJ, 876, 130
- Hopkins (2013a) Hopkins P.F., 2013a, MNRAS, 428, 1950
- Hopkins (2013b) Hopkins P.F., 2013b, MNRAS, 430, 1653
- Hughes et al. (2013) Hughes A. et al., 2013, ApJ, 779, 46
- Ivison et al. (2020) Ivison R.J., Richard J., Biggs A.D., Zwaan M.A., Falgarone E., Arumugam V., van der Werf P., Rujopakarn W., 2020, MNRAS, 495, L1
- Kim et al. (2021) Kim J. et al., 2021, MNRAS, 504, 487
- Kruijssen & Longmore (2014) Kruijssen J.M.D., Longmore S.N., 2014, MNRAS, 439, 3239
- Kruijssen et al. (2018) Kruijssen J.M.D., Schruba A., Hygate A.P.S., Hu C.-Y., Haydon D.T., Longmore S.N., 2018, MNRAS, 479, 1866
- Kruijssen et al. (2019) Kruijssen J.M.D. et al., 2019, Nature, 569, 519
- Krumholz & Tan (2007) Krumholz M.R., Tan J.C., 2007, ApJ, 654, 304
- Krumholz, Dekel & McKee (2012) Krumholz M.R., Dekel A., McKee C.F., 2012, ApJ, 745, 69
- Larson et al. (1981) Larson R.B., 1981, MNRAS, 194, 809
- Leroy et al. (2011) Leroy A.K. et al., 2011, ApJ, 737, 12
- Leroy et al. (2015) Leroy A.K. et al., 2015, ApJ, 801, 25
- Leroy et al. (2017) Leroy A.K. et al., 2017, ApJ, 846, 71
- Livermore et al. (2012) Livermore R.C. et al., 2012, MNRAS, 427, 688
- Livermore et al. (2015) Livermore R.C. et al., 2015, MNRAS, 450, 1812
- Lotz et al. (2011) Lotz J.M., Jonsson P., Cox T.J., Croton D., Primack J.R., Somerville R.S., Stewart K., 2011, ApJ, 742, 103
- Ma et al. (2020) Ma X. et al., 2020, MNRAS 493, 4315
- Mandelker et al. (2017) Mandelker N. et al., 2017, MNRAS, 464, 635
- Mayer et al. (2016) Mayer L., Tamburello V., Lupi A., Keller B., Wadsley J., Madau, P., 2016, ApJL, 830, L13
- McKee & Ostriker (2007) McKee C.F., Ostriker E.C., 2007, ARA&A, 45, 565
- McMullin et al. (2007) McMullin J.P., Waters B., Schiebel D., Young W., Golap K., 2007, in Shaw R.A., Hill F., Bell D.J., eds, ASP Conf. Ser. Vol. 376, Astronomical Data Analysis Software and Systems XVI, Tucson, p. 127
- Messa et al. (2018) Messa M. et al., 2018, MNRAS, 473, 996
- Messa et al. (2022) Messa M., Dessauges-Zavadsky M., Richard J., Adamo A., Nagy D., Combes F., Mayer L., Ebeling H., 2022, MNRAS, 516, 2420
- Meštrić et al. (2022) Meštrić U. et al., 2022, MNRAS, 516, 3532
- Nagy et al. (2022) Nagy N., Dessauges-Zavadsky M., Richard J., Schaerer D., Combes F., Messa M., Chisholm J., 2022, A&A, 657, A25
- Ochsendorf et al. (2017) Ochsendorf B.B., Meixner M., Roman-Duval J., Rahman M., Evans N.J.II, 2017, ApJ, 841, 109
- Padoan & Nordlund (2002) Padoan P., Nordlund Å., 2002, ApJ, 576, 870
- Patrício et al. (2018) Patrício V. et al., 2018, MNRAS, 477, 18
- Patrício et al. (2019) Patrício V. et al., 2019, MNRAS, 489, 224
- Renaud, Romeo & Agertz (2021) Renaud F., Romeo A.B., Agertz, O., 2021, MNRAS, 508, 352
- Richard et al. (2010) Richard J. et al., 2010, MNRAS, 404, 325
- Rosolowsky & Blitz (2005) Rosolowsky E., Blitz L., 2005, ApJ, 623, 826
- Rosolowsky et al. (2021) Rosolowsky E. et al., 2021, MNRAS, 502, 1218
- Rujopakarn et al. (2019) Rujopakarn W. et al., 2019, ApJ, 882, 107
- Salpeter (1955) Salpeter E.E., 1955, ApJ, 121, 161
- Sandstrom et al. (2013) Sandstrom K.M. et al., 2013, ApJ, 777, 5
- Schruba, Kruijssen & Leroy (2019) Schruba A., Kruijssen J.M.D., Leroy A.K., 2019, ApJ, 883, 2
- Shibuya et al. (2016) Shibuya T., Ouchi M., Kubo M., Harikane Y., 2016, ApJ, 821, 72
- Simons et al. (2017) Simons R.C. et al., 2017, ApJ, 843, 46
- Solomon et al. (1987) Solomon P.M., Rivolo A.R., Barrett J., Yahil A., 1987, ApJ, 319, 730
- Solomon et al. (1997) Solomon P.M., Downes D., Radford S.J.E., Barrett J.W., 1997, ApJ, 478, 144
- Soto et al. (2017) Soto E. et al., 2017, ApJ, 837, 6
- Sun et al. (2018) Sun J. et al., 2018, ApJ, 860, 172
- Sun et al. (2020) Sun J. et al., 2020, ApJ, 892, 148
- Swinbank et al. (2015) Swinbank A.M. et al., 2015, ApJL, 806, L17
- Tadaki et al. (2018) Tadaki K. et al., 2018, Nature 560, 613
- Tamburello et al. (2015) Tamburello V., Mayer L., Shen, S., Wadsley J., 2015, MNRAS, 453, 2490
- Toomre (1964) Toomre A., 1964, ApJ, 139, 1217
- Turner et al. (2017) Turner O.J. et al., 2017, MNRAS, 471, 1280
- Übler et al. (2019) Übler H., et al., 2019, ApJ, 880, 48
- Utomo et al. (2018) Utomo D. et al., 2018, ApJ, 861, L18
- Walter et al. (2016) Walter F. et al., 2016, ApJ, 833, 67
- Wisnioski et al. (2015) Wisnioski E. et al., 2015, ApJ, 799, 209
- Wei et al. (2012) Wei L.H., Keto E., Ho L.C., 2012, ApJ, 750, 136
- Zanella et al. (2019) Zanella A. et al., 2019, MNRAS, 489, 2792
Appendix A Molecular cloud identification in channel maps
In Sect. 4.1 we describe how we performed the search for the GMCs in the ALMA 12-channel intensity maps extracted over the CO(4–3) line emission. In total 24 counter-images of 14 GMCs were identified, with most GMCs having two to three multiple images. Their respective CO(4–3) emission encompasses between one and five adjacent channels, as shown in Fig. 8. Similarly to the definition applied for the GMCs hosted in the Cosmic Snake galaxy (Dessauges-Zavadsky et al., 2019), the detected CO(4–3) emission peaks per channel were considered as belonging to images of distinct clouds when their contours were not spatially overlapping in the same channel map, or when their contours were co-spatial, but not in adjacent channel maps (that is, when separated by at least one channel). This definition of clouds, although at first sight appearing as arbitrary, is a possible way of defining clouds. We consider that the essential point is to describe our method clearly to ensure that our results are reproducible, but, of course, a different cloud definition can be adopted using the same ALMA data. Globally, we acknowledge that our definition of clouds depends on, and is limited by, our spatial resolution and our beam size. We labelled the identified multiple images with ‘N’, ‘S’, and ‘C’ letters, they denote the respective emission peaks found in the northern (N) mirrored image and the southern (S) mirrored image of the arc, and the central (C) north (CS) and south (CS) images around the closed critical line in the northern part of the arc. The numbers enumerate the 14 distinct GMCs.
In Fig. 9 we show the individual integrated CO(4–3) emission line spectra extracted for the 14 GMCs. We plot the spectra obtained for the less blended multiple images in channel maps of each GMC, and that was adopted to estimate the GMC physical properties listed in Table 1.


![[Uncaptioned image]](/html/2301.05715/assets/x19.png)
![[Uncaptioned image]](/html/2301.05715/assets/x20.png)
![[Uncaptioned image]](/html/2301.05715/assets/x21.png)
![[Uncaptioned image]](/html/2301.05715/assets/x22.png)
![[Uncaptioned image]](/html/2301.05715/assets/x23.png)
![[Uncaptioned image]](/html/2301.05715/assets/x24.png)
![[Uncaptioned image]](/html/2301.05715/assets/x25.png)
![[Uncaptioned image]](/html/2301.05715/assets/x26.png)
![[Uncaptioned image]](/html/2301.05715/assets/x27.png)
Figure A1 – continued
Appendix B CASA visibility simulations
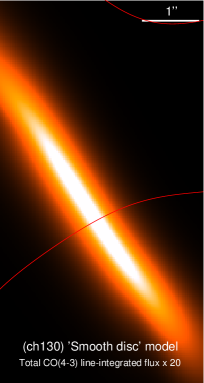
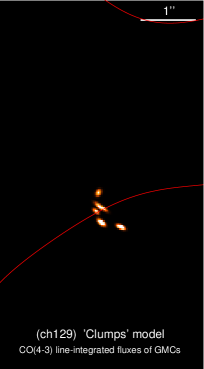
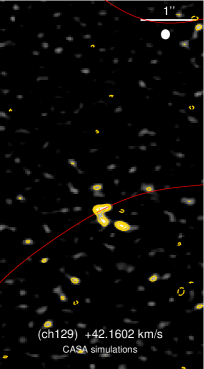
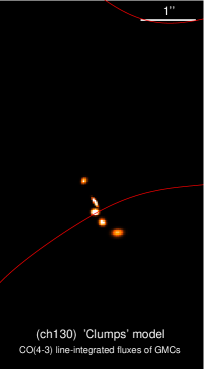
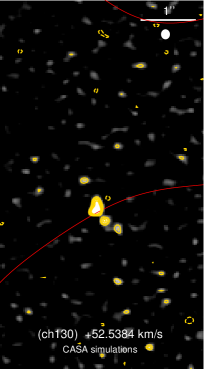
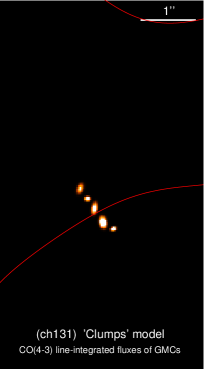
To validate the existence of the detected GMCs (see Sect. 4.1) against artificial clumpy features produced by lensing and interferometric effects out of a smooth exponential disc of CO(4–3) emission, we followed the methodology of Hodge et al. (2016, 2019), Gullberg et al. (2018), and Ivison et al. (2020) who evidenced the presence of artificial clumpy features in lensed interferometric data. We performed CASA visibility simulations with the CASA simobserve routine by setting up the frequency, the bandwidth, the ALMA configuration, the precipitable water vapour, and the exposure time to the real ALMA observations of A521-sys1. For the CO(4–3) line imaging, we used the CASA simanalyze routine and we applied the same pixel size and weighting scheme as for real visibilities using Briggs and the robust factor of 0.5. The generated RMS noise per beam in the simulated channel intensity maps is comparable within about 10 per cent to the RMS noise measured in the real channel intensity maps for the same synthesized beam size. We considered two input sky models.
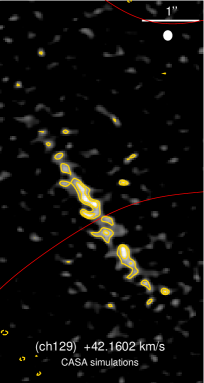
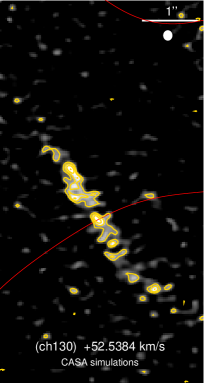
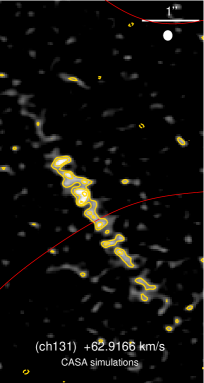
In the first sky model, we distributed the total lensing-corrected CO(4–3) line-integrated flux of measured in the A521-sys1 galaxy in a smooth exponential disc with the Sérsic index of 1 in the source plane, characterised by the rotation velocity and the effective radius determined for the A521-sys1 galaxy (Girard et al., 2019; Nagy et al., 2022). This smooth exponential disc was then lensed with the tailored lens model using Lenstool (see Sect. 2) to obtain the corresponding CO(4–3) emission data cube in the image plane, for which we adopted a channel sampling of as in the real data cube. The simulated channel intensity maps showed no CO(4–3) emission detection of the smooth disc model. Only after increasing the measured total CO(4–3) line-integrated flux by a factor of 20, the CO(4–3) emission of the smooth disc model was detected at above the RMS noise in the simulated channel maps; albeit only in the central bright regions of the disc located close to the critical line. The detected CO(4–3) emission is indeed structured in clumpy features as shown in Fig. 10 for three consecutive channels encompassing the central bright region of the smooth disc. However, we noticed that these clumpy features change for different noise realisations in our CASA visibility simulations; as a result, the corresponding CO emission peaks that mimic the GMC search undertaken per channel map, have random locations, and are thus never detected over two and more adjacent channels at the same location and do not show multiple images as predicted by the lens model, while the GMCs identified in the real channel maps do (see Sect. 4.1 and Fig. 8). Moreover, and most importantly, it is difficult to explain how we could have missed 20 times of the CO(4–3) line-integrated flux of A521-sys1, and this even more that, in addition to the ALMA observations, we have IRAM 30 m single dish observations that do not suffer of large-scale CO(4–3) emission filtering.
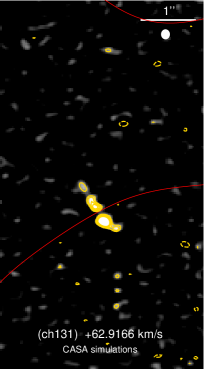
In the second sky model, we created a data cube with also a sampling and we placed in the channel intensity maps CO(4–3) clumps at the locations of the GMGs identified in the A521-sys1 galaxy and with their measured properties (fluxes and , elliptical sizes) in the image plane. The modelled CO(4–3) clumps are detected at above the RMS noise in the simulated channel intensity maps, namely at similar significance levels as the GMCs detected in the real channel intensity maps as shown in Fig. 11. For different noise realisations in our CASA visibility simulations, the clumps remained detected in the simulated channel maps at comparable significance levels.
These two sets of CASA visibility simulations demonstrate that clumps that benefit from a high CO(4–3) surface brightness can be detected in channel intensity maps. This is not the case if the measured total CO(4–3) line-integrated flux is distributed in a smooth exponential disc that globally suffers from a much lower surface brightness than clumps.