75282
44email: pierluigi.monaco@inaf.it
Mapping the Universe with slitless spectroscopy
Abstract
Euclid will survey most of the accessible extragalactic sky with imaging and slitless spectroscopy observations, creating a unique spectroscopic catalog of galaxies with H line in emission that will map the Universe from to . With low expected statistical errors, the error budget will likely be dominated by systematic errors related to uncertainties in the data and modelling. I will discuss the strategy that has been proposed to mitigate the expected systematic effects and propagate the uncertainty of mitigation to cosmological parameter errobars.
keywords:
Cosmology: observations – Large-scale structure of the Universe – Cosmological parameters1 Introduction
Observations of the Cosmic Microwave Background (CMB, Planck Collaboration 2018) have provided percent-accurate constraints to cosmological parameters, strengthening the case for a 6-parameter flat CDM cosmological model; this is consistent with most available evidence on large scales, but at the cost of leaving 95% of the present mass-energy budget unexplained. In fact, most matter today is thought to be in the form of an unknown collisionless particle, and most energy today is thought to be in a dark energy component that is accelerating the Universe expansion, represented by a positive cosmological constant.
To shed light on the dark sector, it is crucial to map the Universe at lower redshift, when dark energy becomes dominant. The European Space Agency has promoted the Euclid mission (Laureijs et al. 2011), an optical and near-infrared space telescope that will survey the sky with a visual imager (VIS), optimised for galaxy lensing, and a near-infrared imager and spectrograph (NISP), optimised for galaxy clustering.
2 Galaxy Clustering with slitless spectroscopy
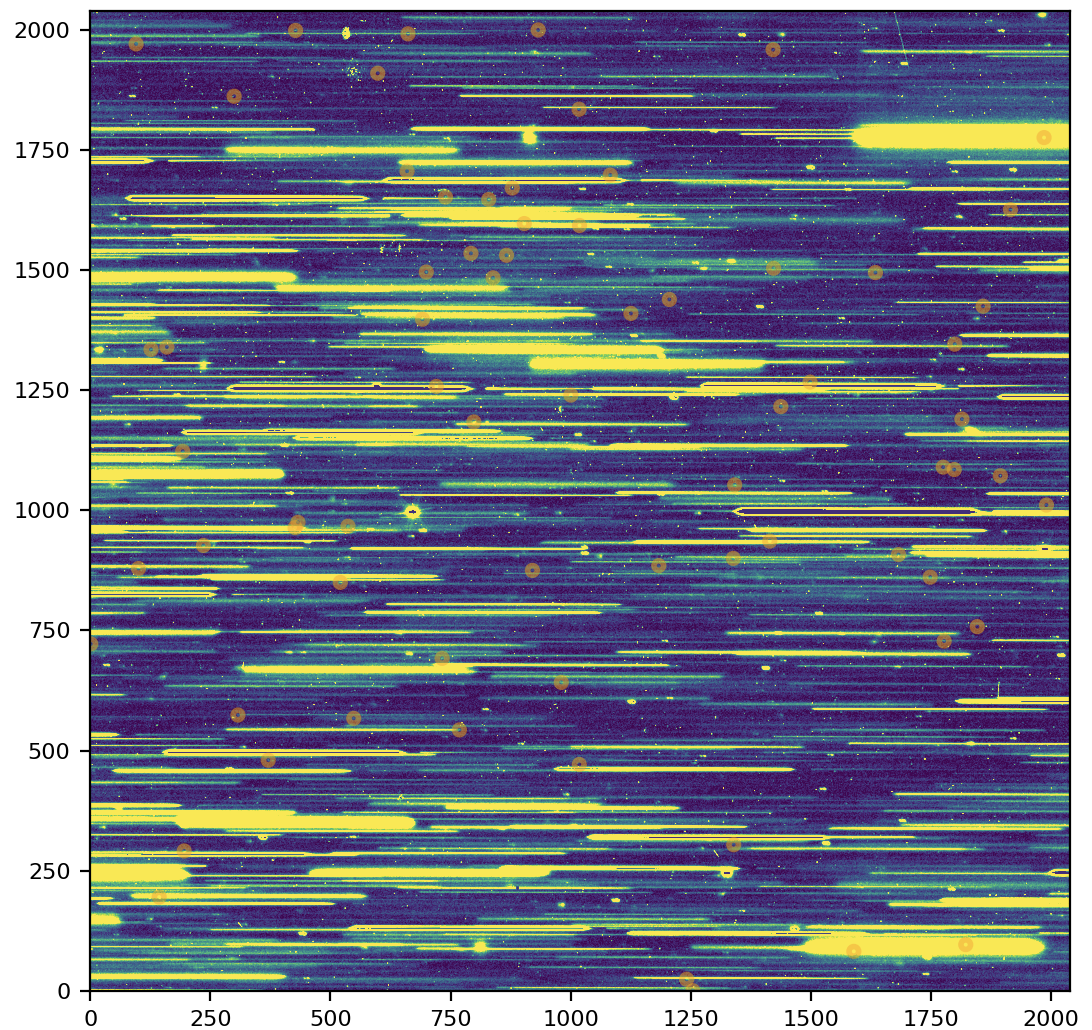
Spectroscopic observations from space are complicated by the impossibility to use screens with suitably pierced holes or slits, as customary from the ground. While JWST has implemented a novel micro-mirror technology that provides a way to select what part of the image is to be dispersed by a grism, Euclid will adopt a straight slitless spectroscopy strategy, already experimented with Hubble Space Telescope (Bagley et al. 2020).This means that each source will produce a straight track on the NISP detector, as showed in the simulation in Fig. 1. These tracks will be separated and used to produce 1D spectra with a resolution of . This observing strategy will allow us to detect emission-line galaxies (ELGs) and measure their redshift, provided that the emission line is correctly recognised. The grism will be sensitive to wavelengths in the range , so the most abundant detectable ELGs are expected to be H emitters in the redshift range . Simulations show that the probability of detecting an ELG drops for line fluxes below erg s-1 cm-2, the nominal line-flux limit of the Euclid Wide Survey.
The obvious drawback of this strategy, the need to deblend all the sources in a field, is balanced by the ability to perform a matter-of-fact blind search of emission-line galaxies. Indeed, spectra will be extracted for any source detected in the photometric observations, that we may think as limited to , and the number of H ELGs associated to fainter sources has been demonstrated to be negligible in Bagley et al. (2020). At the same time, although we expect the success rate of deblending to be a function of surface density of all sources, the sample will be free of fiber collision bias (e.g., Bianchi et al. 2018).
3 Chasing systematic effects
The Observational Systematics Work Package of the Galaxy Clustering Science Working Group has surveyed the whole pipeline, from raw data to the measure of galaxy clustering that is provided to the likelihood. Using the formalism of Monaco, Di Dio & Sefusatti (2019), we have classified the possible systematic effects as follows: (i) modulations of the effective flux limit of the sample, due either to instrumental issues (e.g. the tiling of the various dithers will produce an inhomogeneous exposure time map, while straylight from nearby bright stars will modulate the noise) or to astrophysical foregrounds (e.g. zodiacal light will add to the background noise, while Milky Way extinction will decrease the signal); (ii) redshift errors due to line misidentifications; (iii) redshift errors due to noise fluctuations being interpreted as lines in an overall undetected spectrum, thus creating ‘noise interlopers’.
The first class of systematic effects will be mitigated by suitably constructing a random catalog. To get rid of the angular footprint of a survey, clustering estimators usually compare the density field measured with the data sample with that from a random sample that covers the same area and is unclustered on the sky; its number density is usually taken to be 50 times that of the data sample (fitted by a model in order not to erase some radial modes), to minimise the amount of extra shot noise introduced by the random. We will construct the random by forward-modeling the completeness and purity of the spectroscopic sample, thus creating what we call a visibility mask. This will be done by taking profit of the Euclid Deep Field, where 50 deg2 of the sky will be surveyed ten times with various orientations of the grism, and with 40 more pointings with a ‘blue grism’ that is sensitive in the range ; from it, we will extract a bona fide sample, pure at % level, of the ELGs that can be seen in the EWS. These galaxies will be used to create a parent random catalog that is unclustered on the sky, whose objects have the same physical properties of the target sample; these random galaxies will be injected in the EWS NISP images, and processed to determine their probability of detection. This way the space density of the selected random will be modulated on the sky by systematics in the same way as the data sample.
While the third class of systematic effects, the noise interlopers, can be modeled by suitably adding a class of contaminants to the random catalog, the second class, line misidentifications, is more subtle to address (Addison et al. 2019). With a typically steep luminosity function of sources, most objects in a catalog are around the detection limit, where a single emission line is typically detected. If no further information is used, the contamination level is expected to be around –20 %, mostly coming from Oiii emitters at higher redshift. These galaxies will be moved from their redshift to the one corresponding to H, carrying with them their rescaled clustering signal, so the measured two-point function will be the weighted sum of the target one and the contaminant one , where is the fraction of contaminants in the sample. This contamination can be mitigated at the likelihood level, comparing the measurements with a weighted sum of predictions relative to the target sample and to the significant contaminants, with fractions treated as nuisance parameters subject to a tight prior coming from measurement of the Deep Field.
4 Propagating the uncertainty in the mitigation
This mitigation strategy will anyway leave residuals that contaminate the sample. Every step in the modeling of the visibility mask of the EWS has an associated uncertainty that must be propagated to parameter errorbars. The most effective way to achieve this is to construct a set of simulated mock galaxy catalogs and process them in the same way as the parent random catalog described above: inject galaxies in the images and compute their probability of being detected. However, this process should not be performed using our best knowledge of the visibility mask but a modulation of it, obtained by perturbing every single step in the pipeline, sampling its estimated error PDF. As an example, detection probability will depend on the measured noise level, and we will use the best-fit value of the noise to create the random, and a value drawn from its PDF for applying the visibility mask to mock galaxy catalogs.
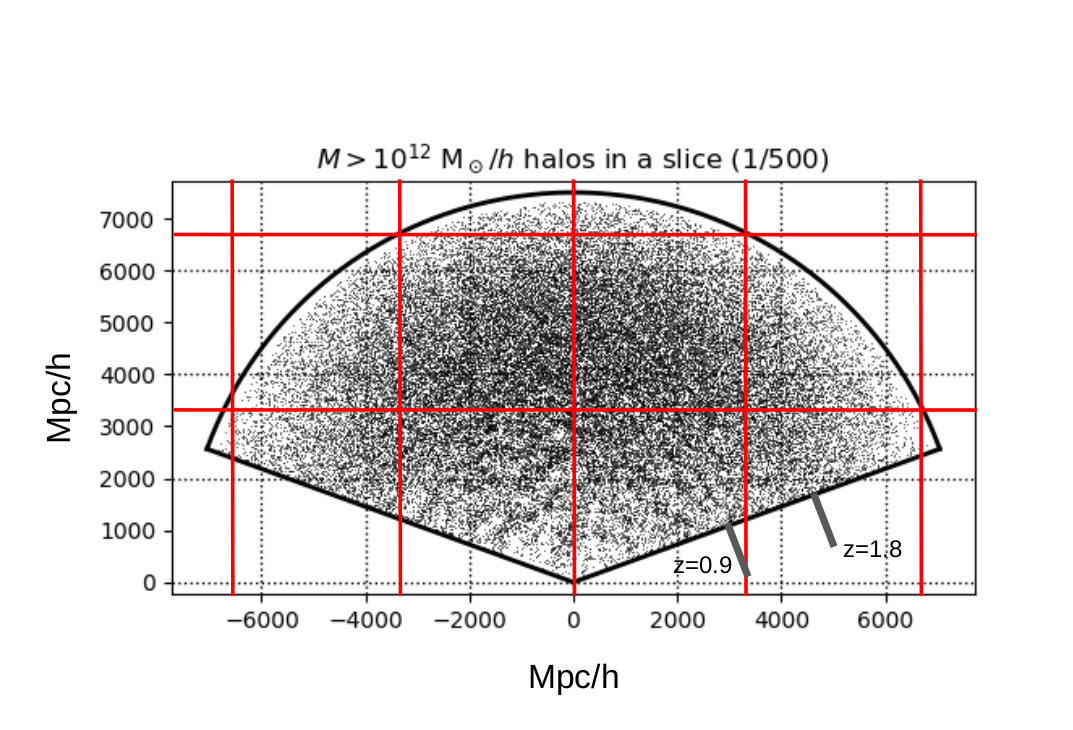
This approach will provide a brute-force numerical estimate of the covariance matrix that will include both cosmic covariance and the uncertainty in the mitigation of systematic effects. Proper sampling of the matrix requires thousands of mocks; in this moment the Galaxy Clustering Science Working Group is preparing 3500 simulations of the Euclid sky. N-body codes are simply too expensive to address this massive production, so we will resort to approximate methods (Monaco 2016). I am presently working to prepare such a large set of simulations using the PINOCCHIO code (Monaco, Theuns & Taffoni 2002; Munari et al. 2017), based on Lagrangian Perturbation Theory. Fig. 2 shows one of these lighcones, reporting dark matter halos (with , one in 500) in comoving coordinates, in a slice that cuts through the survey volume; the catalogs cover half of the sky, with the exception of unobserved low Galactic latitudes, and start at . The red lines mark the box size (3380 Mpc), that is tiled to cover the survey volume. When ready, this will be the largest set of cosmological simulations ever produced.
Acknowledgements.
P.M. thanks L. Guzzo, W. Percival, Y. Wang, C. Scarlata, B. Granett, M. Moresco, S. De La Torre and the members of the Observational Systematics Work Package for many discussions. The simulation used for Fig. 1 was produced by the Euclid Science Ground Segment, in particular Operational Units OU-SIM and OU-SIR. The Euclid Consortium acknowledges the European Space Agency and a number of agencies and institutes that have supported the development of Euclid, in particular the Academy of Finland, the Agenzia Spaziale Italiana, the Belgian Science Policy, the Canadian Euclid Consortium, the French Centre National d’Etudes Spatiales, the Deutsches Zentrum für Luft- und Raumfahrt, the Danish Space Research Institute, the Fundação para a Ciência e a Tecnologia, the Ministerio de Ciencia e Innovación, the National Aeronautics and Space Administration, the National Astronomical Observatory of Japan, the Netherlandse Onderzoekschool Voor Astronomie, the Norwegian Space Agency, the Romanian Space Agency, the State Secretariat for Education, Research and Innovation (SERI) at the Swiss Space Office (SSO), and the United Kingdom Space Agency. A complete and detailed list is available on the Euclid web site (http://www.euclid-ec.org).References
- Addison et al. (2019) Addison, G., et. al., 2019, ApJ, 879, Id.15
- Bagley et al. (2020) Bagley, M., et al., 2020, ApJ, 897, Id.98
- Bianchi et al. (2018) Bianchi, D., et al., 2018, MNRAS, 481, 2338
- Laureijs et al. (2011) Laureijs, R., et al., 2011, arXiv:1110.3193
- Monaco (2016) Monaco, P., 2016, Galaxies, 4, 53
- Monaco et al. (2019) Monaco, P., Di Dio, E. & Sefusatti, E., 2019, JCAP, 2019-4, Id.023
- Monaco et al. (2002) Monaco, P., Theuns, T. & Taffoni, G., 2002, MNRAS, 331, 587
- Munari et al. (2017) Munari, E., et al., 2017, MNRAS, 465, 4658
- Planck Collaboration (2018) Planck Collaboration, Aghanim N., et al., 2018, A&A, 641, Id.A6