[a] F.G. Kopylova
The splashback radius of groups and clusters of galaxies at low redshifts
Abstract
We present a study of the distribution of galaxies along the radius of 157 groups and clusters of galaxies (200 km s-1 < < 1100 km s-1) of the local Universe (0.01 < < 0.1). We introduced a new boundary of galaxy systems and identified it with the splashback radius . We also identified the central region of galaxy systems with a radius of . These radii are defined by the observed integrated distribution of the total number of galaxies depending on the squared distance from the center of the groups/clusters coinciding, as a rule, with the brightest galaxy. We show that the radius is proportional to the (radius of the virialized region of a galaxy cluster) and to the radius of the central region with a slope close to 1. Among the obtained dependences of the radii on X-ray luminosity, the - relation has the lowest scatter. We measured = Mpc for the total sample, = Mpc for galaxy groups with 400 km s-1, = Mpc for galaxy clusters with > 400 km s-1. We found the average ratio of the radii or .
1 Introduction
Clusters of galaxies are the largest gravitationally bound objects in the Universe. They are collapsing structures known as dark matter halos. Clusters of galaxies are continuously increasing in mass both as a result of the merging with individual galaxies and smaller groups of galaxies, and as a result of continuous infall of dark matter from the environment. Clusters of galaxies do not have clear boundaries, which are often determined by density contrast relative to the critical or average density of the universe. Their evolution is considered within the framework of the spherical collapse model in the expanding universe (e.g. [7, 6]).
Using N-body simulations of the motion of particles of a dark matter halo (galaxies), it was found that a significant part of them (up to 50%) located outside the virialized regions of galaxy clusters (up to 2 or 2) have already been inside [2, 14, 5].
[8] presents the results of Millennium simulations for 75 galaxy clusters ( = 0.0), where it is shown that a significant part of the galaxies bounce up to in the phase-space diagram.
The radius of galaxy clusters (physical halo boundary), the splashback radius , was introduced in [1] as the radius at which newly accreted dark matter particles are piled up within the apocenters of their orbits. The radius is clearly visible on the dark matter halo density profiles as a sharp density drop [1, 4]. In simulations performed in [15], it is shown that the localization of depends on the rate of mass accretion into the cluster: in the halo with a rapid accretion rate - , in the halo with a slow rate — .
In this work, we are looking for observational manifestations of splashback features in a sample of groups and clusters of galaxies (data from the SDSS catalog). In [9] we show the edge of the galaxy clusters, clearly identified by the integral distribution of the number of all galaxies in a cluster depending on the squared clustercentric distance, which we call the radius of the halo, . This radius is usually larger than the radius and is measured along the projected profile when a sharp increase in the number of galaxies in the center of clusters ends. We identified them later with the splashback radius and gave the results of its measurements for 100 groups/clusters of galaxies [9, 10, 12, 13]. In the works [12, 13] we have shown that the distribution of early-type galaxies in clusters allows for a more accurate estimate of the desired radius. We have measured for 40 galaxy systems the average radius or (if we take into account 4), which varies from 1.10 Mpc for the group NGC 5627 with = 314 km s-1 to 4.17 Mpc for the cluster Coma (A 1656) with = 921 km s-1. Here (hereinafter ) is the radius of a cluster inside which the density exceeds the critical density of the universe by a factor 200. This radius in our works is determined by the dispersion of radial velocities of galaxies in the systems. In model simulations, the radius is often used, within which the density in the syatem exceeds the average density of the universe by a factor 200.
In this study, we used a sample of 157 groups/clusters of galaxies from the regions of superclusters of galaxies Leo (N=12), Hercules (N=27), Ursa Major (N=19), Corona Borealis (N=8), Bootes (N=13), from other smaller superclusters (N=11) and fields (N=20), groups of galaxies from the region of the A 1656/ A1367 supercluster (N=48). For these systems of galaxies we have determined radii (splachback radius) and (core radius) from the observed profile and found the dependences of the radii on other galaxy cluster characteristics. This study uses the data of the SDSS (Sloan Digital Sky Survey Data Releases 7, 8) and 2MASS XSC (Two-Micron ALL-Sky Survey Extended Source Catalog) catalogs and NED (NASA Extragalactic Database). Throughout this study we adopted the following values of cosmological parameters: , , km s-1 ípc-1.
2 Method and data
In the papers [9, 10, 11, 13] we presented the dynamical characteristics for a region with a radius of for almost the entire sample of groups and clusters studied in this work. This radius can be estimated by the formula Mpc [3]. Then, if a cluster can be considered to be virialized within this radius, its mass can be computed by the formula , where is the dispersion of the line-of-sight velocities of the galaxies located within the radius, and G is the gravitational constant. Thus, the measured mass of the cluster is . In our work, we first estimated the average line-of-sight velocity of the cluster and its dispersion , and then use the inferred dispersion to determine the radius. We then determine the number of galaxies within this radius and redetermine , , , etc. We move from the cluster and determine iteratively the dispersion of line-of-sight velocities of the galaxies and other parameters of the clusters within this radius. We consider galaxies with velocities deviating by more than from the mean velocity of the group (see, e.g., [14]) as field objects.
To find the radius , it is important to highlight the outskirts of galaxy systems. For this purpose, we present Figure 1 which describes in detail the structure and kinematics of galaxy cluster A 1318 (as an example). The panels of Figure 1 show: a) deviations of line-of-sight velocities of cluster members and field galaxies from the average radial velocity of the system plotted as a function of the squared clustercentric radius; b) the integrated distribution of the number of galaxies as a function of the squared clustercentric distance; c) location of galaxies in the sky plane in equatorial coordinates; d) the histogram of the line-of-sight velocities of all galaxies within the radius. The solid line shows the Gaussian corresponding to the dispersion of line-of-sight velocities of galaxies. The vertical lines show the radii: (dashed-and-dotted), (short dashed), (long dashed).
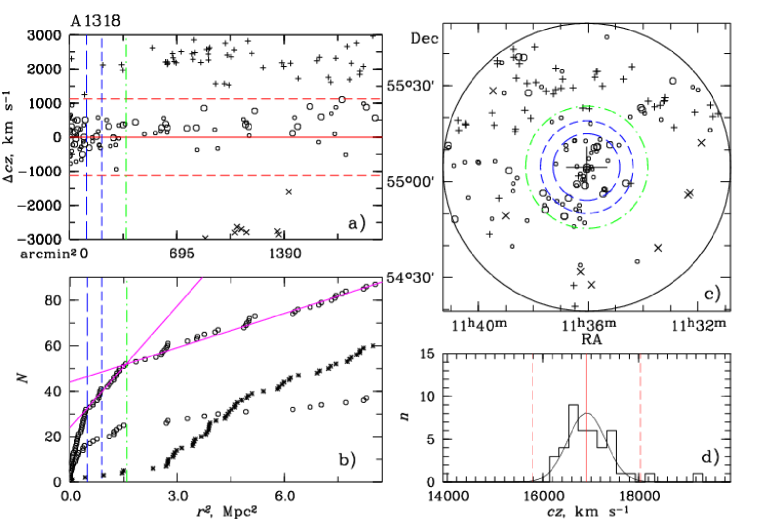
We are especially interested in panel b), where the projected cluster profile is shown, the integrated distribution of the number of galaxies as a function of the squared clustercentric distance. This distribution makes it possible to visually reveal the dense core of the cluster, its more tenuous shell, and the external region where the distribution becomes linear (shown by the straight magenta lines in the figure) in the adopted coordinates, i.e., where the distrubution of surrounding galaxies becomes uniform on the average [9]. The figure shows the radius of the virialized region, , and the radius, , beyond which the steep growth of the cluster members ends and linear growth begins. We also marked with a long dashed line the central part (core) of the cluster of radius , where the main steep increase in the number of galaxies is observed. The lower curve in the same figure shows the distribution of early-type galaxies brighter tnan , which we use to refine the radius in question. Such galaxies are located, as a rule, in the central virialized regions of galaxy systems. , the splashback radius of the galaxy systems [1, 4] found by us, is the radius of the apocenters of the orbits of galaxies, originating in the central region of galaxy clusters. Thus, the radius separates galaxies which fall onto the cluster for the first time from collapsing galaxies that are already participating in establishing virial equilibrium. For our sample we measured Mpc with a variation range of , () and , or (given that . This value is consistent with results of simulations (see, e.g., [15]).
3 Results
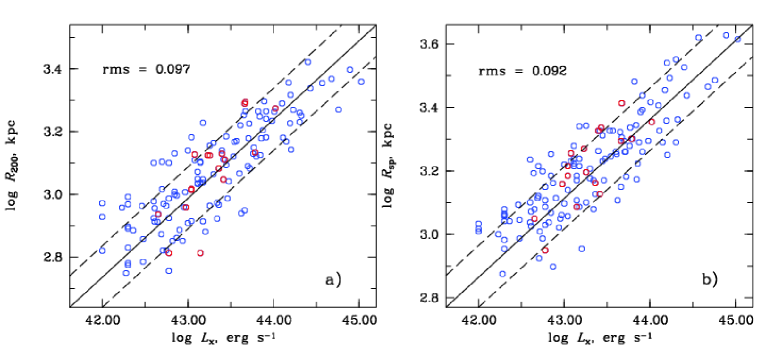
We stutied the dependences of the found radii and on the properties of galaxy clusters. Figure 2 shows the dependence of on the X-ray luminosity, , and for comparison a similar dependence for the radius is shown. The relations shown (straight lines) represent the average between forward and inverse regressions, when the independent variables are interchanged. The dashed lines show 1 deviations from them. Note that rms deviation depends on the radius less than on . Red circles show merging clusters of galaxies with bimodal radial velocity distribution within the radius . We can be see that these syatems do not differ from normal clusters of galaxies by location on the – relation. The Table 1 shows the parameters of the relations we obtained: slopes, normalizations, and scatters.
We have noted in Section 1 the results of other authors (e.g., [15]), from which it follows that depends on the rate of accretion of dark matter particles on the clusters: at a rapid rate of mass accretion, this radius is close to the virial radius, that is, in our case to .
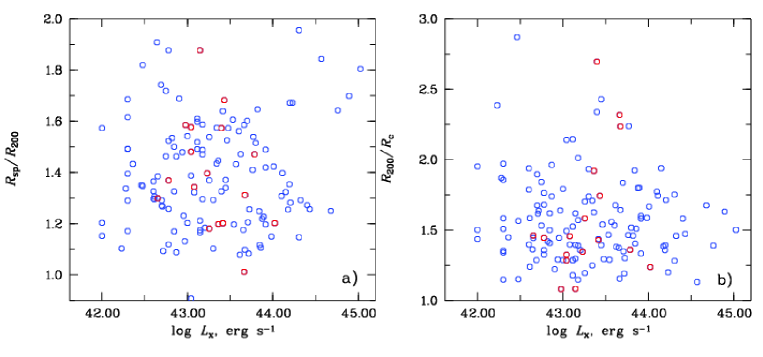
Figure 3 shows the dependence of the radii ratios and on the X-ray luminosity of systems of galaxies. Variations of the ratio have distinct boundaries for most systems of galaxies: = and = . We refer to galaxy systems with a radius ratio less than 1.15 (or ) as objects with a rapid rate of mass accretion (RA), and the systems with a radii ratio greater than 1.6 (or ) - as objects with a slow accretion rate (SA). There are 21 RA and 34 SA systems in our sample. RA systems are usually groups/clusters of galaxies with a non-Gaussian radial velocity distribution, with signs of merging with other groups and galaxies near the virial radius, for example: A 1270, A 1904, A 1991, NGC 2563. Among SA groups/clusters of galaxies there are rich galaxy systems such as A 1656, A 1795, A 2142, A 2029, poor galaxy systems such as NGC 7237, IC 2476, MCG-01-29, which collect matter (groups, galaxies, gas) from great distances from the center.
We have obtained the following results:
1. The boundary of the dark halo of groups/clusters of galaxies, the radius determined by galaxies, is proportional to the radius of the virialized region and to the radius of the core region with a slope close to 1.
2. All the radii we measured correlate with the X-ray luminosity of groups/clusters of galaxies and have similar slopes. Dependencies of the splashback radius on mass and luminosity have a lower scatter.
| Relation | Slope | Normalization | Scatter |
|---|---|---|---|
| – | 0.092 | ||
| – | 0.097 | ||
| – | 0.110 | ||
| – | 0.066 | ||
| – | 0.086 | ||
| – | 0.074 | ||
| – | 0.088 | ||
| – | 0.064 | ||
| – | 0.088 |
Acknowledgments
This research has made use of the NASA/IPAC Extragalactic Database (NED, http://nedwww.ipac.caltech.edu), which is operated by the Jet Propulsion Laboratory, California Institute of Technology, under contract with the National Aeronautics and Space Administration, Sloan Digital Sky Survey (SDSS, http://www.sdss.org), which is supported by Alfred P. Sloan Foundation, the participant institutes of the SDSS collaboration, National Science Foundation, and the United States Department of Energy and Two Micron All Sky Survey (2MASS, http://www.ipac.caltech.edu/2mass/releases/allsky/).
References
- Adhikari et al. [2014] Adhikari, S., Dalal, N., Chamberlain, R. T. 2014, JCAP, 11, 19
- Balogh et al. [2000] Balogh, M. L., Navarro, J. F., Morris, S. L. 2000, Astrophys. J. , 540, 113
- Carlberg et al. [1997] Carlberg, R. G., Yee, H. K. C., Ellingson, E., et al. 1997, Astrophys. J. , 485, L13
- Diemer & Kravtsov [2014] Diemer, B. & Kravtsov, A. V. 2014, Astrophys. J. , 789, 1
- Gill et al. [2005] Gill, S. P. D., Knebe, A., Gibson, B. K. 2005, Mon. Not. R. Astron. Soc. , 356, 1327
- Gott [1973] Gott, J. R,III 1973, Astrophys. J. , 186, 481
- Gunn & Gott [1972] Gunn, J. E., & Gott, J. R,III 1972, Astrophys. J. , 176, 1
- Haines et al. [2015] Haines, C. P., Pereira, M. J., Smith, G. P., et al. 2015, Astrophys. J. , 806, 101
- Kopylov & Kopylova [2015] Kopylov, A. I., Kopylova, F. G. 2015, Asrophysical Bulletin, 70, 243
- Kopylova & Kopylov [2016] Kopylova, F. G., Kopylov, A. I. 2016, Asrophysical Bulletin, 71, 129
- Kopylova & Kopylov [2017] Kopylova, F. G., Kopylov, A. I. 2017, Asrophysical Bulletin, 72, 363
- Kopylova & Kopylov [2018] Kopylova, F. G., Kopylov, A. I. 2018, Asrophysical Bulletin, 73, 267
- Kopylova & Kopylov [2019] Kopylova, F. G., Kopylov, A. I. 2019, Asrophysical Bulletin, 74, 365
- Mamon et al. [2004] Mamon, G. A., Sanchis, T., Salvador-Sole, E., Solanes, M. J. 2004, A&A, 414, 445
- More et al. [2015] More, S., Diemer, B., Kravtsov, A. V. 2015, Astrophys. J. , 810, 36