Globular Clusters in NGC 4839 Falling into Coma: Evidence for the Second Infall?
Abstract
NGC 4839 is the brightest galaxy (cD) of the NGC 4839 group at Mpc in the south-west of the Coma cluster, which is known to be falling into Coma. However, it has been controversial whether it is in the first phase of infall or in the second phase of infall after passing the Coma center. We present a wide field study of globular clusters (GCs) in NGC 4839 and its environment based on Hyper Suprime-Cam images in the Subaru archive. We compare the GC system of NGC 4839 with that of NGC 4816, which is the brightest member (S0) of the nearby group and lies at a similar distance in the west from the Coma center. Interestingly the spatial distribution of the GCs in NGC 4839 is significantly more compact than that of the GCs in NGC 4816. In addition, the radial number density profile of the GCs in NGC 4839 shows an abrupt drop at kpc, while that of the GCs in NGC 4816 shows a continuous slow decline even in the outer region at kpc. The effective radius of the NGC 4839 GC system is about three times smaller than that of the NGC 4816 GC system. This striking difference can be explained if NGC 4839 lost a significant fraction of the GCs in its outskirt when it passed through Coma. This supports strongly the second infall scenario where the NGC 4839 passed the Coma center about 1.6 Gyr ago, and began the second infall after reaching the apocenter in the south-west recently.
1 Introduction
1.1 The NGC 4839 Group and the Main Cluster in Coma
Coma is the most massive galaxy cluster in the local universe. It is connected with filaments from neighboring galaxy clusters and hosts various substructures indicating that it is a complex merger system (Colless & Dunn, 1996; Malavasi et al., 2020; Healy et al., 2021). Thus, Coma is one of the best targets to study how large scale substructures are assembled and evolve, and has been a focus of many cluster studies in various aspects (see Biviano (1998); Churazov et al. (2021) and references therein). Two most prominent substructures in Coma are the main cluster core in the center and the NGC 4839 group in the south-west, as shown by galaxy number density maps (Colless & Dunn, 1996; Healy et al., 2021), X-ray images of hot gas (White et al., 1993; Neumann et al., 2001; Lyskova et al., 2019; Churazov et al., 2021), and radio images of synchrotron emission (Bonafede et al., 2021, 2022; Lal et al., 2022). The main cluster core hosts two giant galaxies (NGC 4874 (cD) and NGC 4889 (D)), which are merging now. The NGC 4839 group is at Mpc in the south-west of Coma, and it is much smaller and less massive than the main cluster core (Colless & Dunn, 1996; Lyskova et al., 2019). The NGC 4839 group is considered to be falling into Coma and that the two systems will merge to form a more massive system in the future (Biviano (1998) and references therein).
1.2 Merger Scenarios for the NGC 4839 Group: A Pre-merger or a Post-merger?
It is generally accepted that the NGC 4839 group is merging with the main cluster. However, whether it is a pre-merger where the NGC 4839 group is in the first phase of infall (Briel et al., 1992; White et al., 1993; Colless & Dunn, 1996; Neumann et al., 2001; Akamatsu et al., 2013) or a post-merger (Burns et al., 1994; Lyskova et al., 2019; Churazov et al., 2021) has been controversial (Sanders et al., 2020; Healy et al., 2021).
We summarize the observational features related with the merging of the NGC 4839 group in the previous studies in Table 1. These features include several substructures seen in X-ray and radio images, an excess of E+A galaxies in the SW region of the cluster, and substructures found in the spatial distribution and kinematics of galaxies. Each feature can be explained with either the pre-merger scenario or the post-merger scenario. Recently the post-merger scenario, which can better explain the existence of X-ray/radio substructures (in particular, bridges and streams), appears to be more supported (Lyskova et al., 2019; Churazov et al., 2021, 2022; Bonafede et al., 2021). However, even in the recent discussions of both scenarios based on various observations, Healy et al. (2021) state that Nevertheless, the question whether the NGC 4839 group is on its first infall or has already passed through the cluster, remains open.
1.3 Globular Clusters as a Probe
The halos of massive galaxies in galaxy clusters grow via numerous mergers of less massive galaxies and host a large number of globular clusters (GCs). Thus, GCs are an excellent probe for investigating the structure of the outer halos in massive galaxies in the local universe, and they provide a critical clue for revealing the assembly history of galaxy halos.
In this study, we present a wide field survey of GCs covering the NGC 4839 group and its environment, based on the archival Subaru/Hypersuprime-Cam (HSC) images. The primary goals of this study are to derive wide field number density maps of GCs and to use them to constrain the merger scenarios of the NGC 4839 group. We adopt the distance to Coma as 100 Mpc (de Grijs & Bono, 2020).
1.4 Previous Studies of NGC 4839 GCs
The main host of the NGC 4839 group is NGC 4839 ( mag, km s-1), which is an elongated cD galaxy (Schombert, 1988; Ali et al., 2014). There are only two previous studies of the GCs in NGC 4839. Marín-Franch & Aparicio (2002) applied the surface brightness fluctuation (SBF) method to estimate indirectly the total number of GCs in several bright Coma galaxies from -band images obtained at the 2.5m Issac Newton Telescope. They found that NGC 4839 is the second-most GC-rich in Coma, following NGC 4874 in their sample. Later Jordán et al. (2004) presented a ()/() photometry of GCs in NGC 4839 based on /WFPC2 images, deriving the total number of GCs to be , which is three times smaller than the value given by Marín-Franch & Aparicio (2002). These previous studies either covered only the small field of NGC 4839 or used only one band, so little is known about the GCs in the outskirt of NGC 4839. Other previous surveys of GCs in Coma covered mainly the main cluster core, and did not cover the NGC 4839 region (Peng et al., 2011; Madrid et al., 2018).
2 Data
Utilizing the Subaru/Hyper Suprime-Cam (HSC) archival images from the Subaru Mitaka Okayama Kiso Archive system (SMOKA) (Aihara et al., 2019), Oh et al. (2023) provided a wide field survey of GCs in the entire Coma cluster. At the distance of Coma (100 Mpc), one arcsec (arcmin) corresponds to a linear scale of 484.8 pc (29.1 kpc). Thus GCs at the distance of Coma appear as point sources in the HSC images. Oh et al. (2023) obtained photometry of the point sources in the seven HSC fields covering the entire Coma cluster, using DAOPHOT (Stetson, 1987). We adopt the AB magnitudes in the SDSS system. The limiting magnitude with 50% completeness of detection derived from artificial star experiments is mag. Detailed description of the detection and photometry of the point sources is given in Oh et al. (2023), of which we used the data for NGC 4839 and its environment in this study. We apply the foreground extinction correction using the extinction maps for Coma given in Schlegel et al. (1998); Schlafly & Finkbeiner (2011).
3 Results
3.1 NGC 4839 in Comparison with NGC 4816
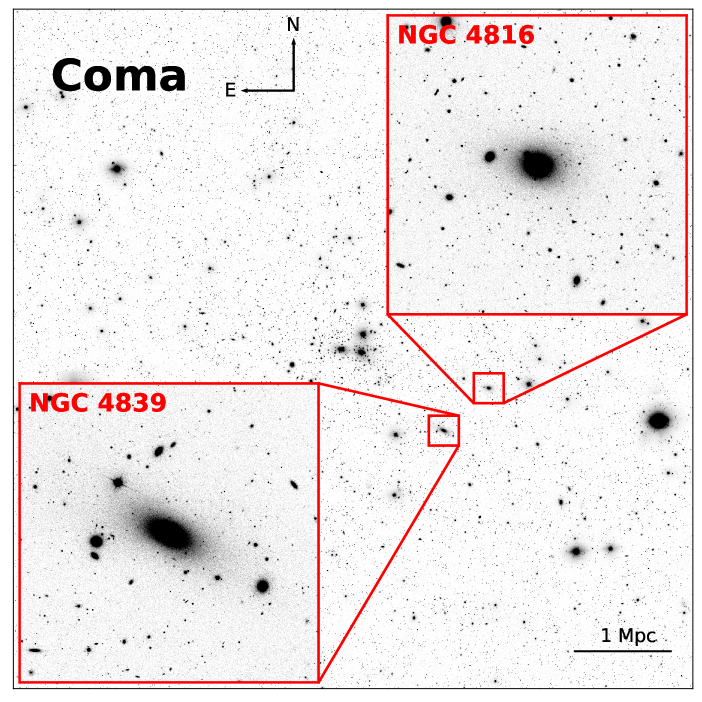
In Figure 1 we show a gray scale map of the -band SDSS image of the Coma cluster region including the NGC 4839 group. The zoom-in images () of NGC 4839 and NGC 4816 show that the two galaxies are similar in their luminosity and size. In the following analysis of NGC 4839 we chose NGC 4816, a nearby bright S0 galaxy, as a comparison galaxy.
NGC 4839 and NGC 4816 are at similar projected distances from the Coma center. The projected separation between the two galaxies in the sky is (0.63 Mpc at the distance of Coma). Healy et al. (2021) found 15 groups using the catalog of Coma member galaxies, and provided the number of members and velocity dispersion of each group. Groups S11 and S14 in their study correspond to the NGC 4816 and NGC 4839 groups, respectively. We used these group data in the following analysis.
NGC 4816 is the brightest member of the S14 group (with and km s-1) at in the west of Coma (see Fig. 12 in Healy et al. (2021)). Similarly, NGC 4839 is the brightest cD/SA0 member of the NGC 4839 group (the S11 group with and km s-1) at , but in the south-west of Coma.
Thus both galaxies are very bright, and the magnitude of NGC 4816 is only 0.9 mag fainter than that of NGC 4839. While the NGC 4839 group shows a strong X-ray emission, the NGC 4816 group shows little detected X-ray emission even in the recent X-ray images (Lyskova et al., 2019; Sanders et al., 2020; Mirakhor & Walker, 2020; Churazov et al., 2021, 2022).
Table 2 lists the basic parameters of the NGC 4839 and NGC 4816 groups in comparison with the main cluster. We calculated the virial mass from the velocity dispersion of the two groups (Healy et al., 2021) using the group virial mass equation: in Tully (2015) (adopting ), as listed in Table 2: for the NGC 4839 group, and for the NGC 4816 group. We also list the mass for the subhalo 2 corresponding to the NGC 4816 group (), and the subhalo 9 corresponding to the NGC 4839 group () derived from the weak lensing analysis in Okabe et al. (2014). Okabe et al. (2014) derived the mass within the truncation radius of each subhalo. The truncation radius of the subhalo 9 is 98 kpc, which is much smaller than the virial radius of the typical galaxy groups (the truncation radius of the subhalo 2 is not given in Okabe et al. (2014)). Thus weak-lensing masses of the two groups are significantly smaller than the dynamical masses.
These results show that the NGC 4839 and NGC 4816 groups have comparable high masses. This indicates that the NGC 4816 group should show strong X-ray emission like the NGC 4839 group, but it is not yet detected in any previous X-ray observations. Not all galaxy groups are detected in X-ray observations. About a half of the nearby galaxy groups show X-ray emission (Mulchaey, 2000). It is not clear why the NGC 4816 group does not show any strong X-ray emission, unlike the NGC 4839 group. It may need a study to investigate this issue further.
3.2 CMDs of the GCs
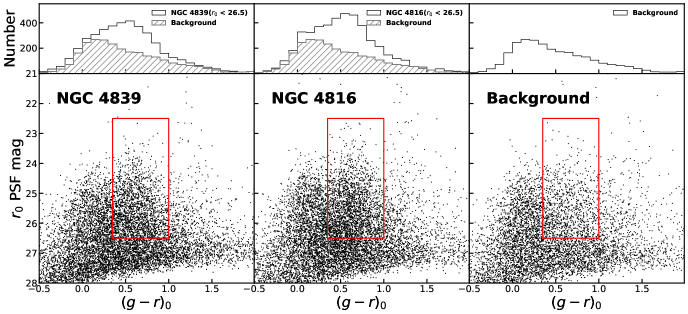
In Figure 2 we plot the color-magnitude diagrams (CMDs) of the point sources in the central regions ( ( kpc)) of NGC 4839 and NGC 4816 as well as a nearby background region with the same area as the galaxy region. We also plot the color histograms of the bright sources with mag of each region. To show the net color histograms we display the contribution of the background sources in the galaxy regions using the background histogram.
The color histograms of the sources in the two galaxies clearly show an excess (open histograms) with respect to the background region (hatched histograms) in the color range of . In the CMDs the vertical structure seen inside the red box represents mainly GCs in NGC 4839 and NGC 4816. We select GC candidates from the entire field using the color-magnitude criteria marked by the red box (, and mag) in the CMDs for the following analysis.
3.3 Spatial Distribution of the GCs
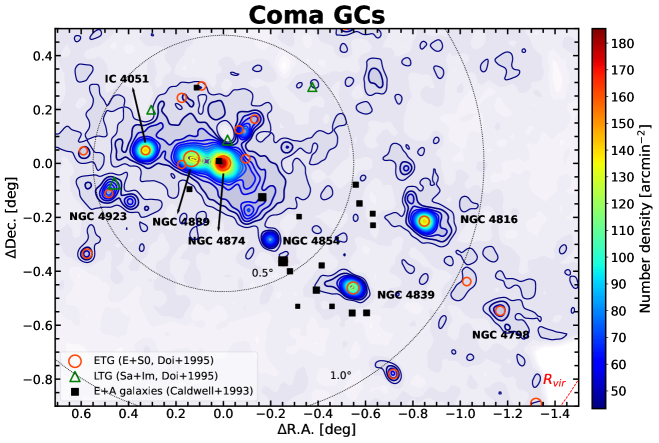
In Figure 3 we display the spatial number density contour map of the selected GC candidates in NGC 4839 and its environment. The region covers out to the virial radius of Coma ( Mpc), and NGC 4839 and NGC 4816 are located approximately at the half virial radius. The strongest peak of the GC number density is seen at the position of NGC 4874, which is adopted as the Coma center in this study. Two other strong peaks in the main cluster core are visible at the position of NGC 4889 and IC 4051. The main cluster core shows also a large extended distribution of intracluster GCs, the details of which are presented in Oh et al. (2023); Lee et al. (2022). Note that in the southwest outskirt two more strong peaks are found at the positions of NGC 4839 and NGC 4816, similar to those of NGC 4889 and IC 4051 in the main cluster core.
One striking feature seen in this figure is a clear difference in the spatial distribution of GCs between NGC 4839 and NGC 4816: the spatial extent of the GC system in NGC 4839 is very compact and that of the GC system in NGC 4816 is much more extended, despite both galaxies showing a similarly strong peak at their centers. NGC 4839 shows a weak excess tail of GCs in the east. There is no corresponding galaxies around the center of this excess. This may be due to stripped GCs from NGC 4839. Sasaki et al. (2016) noted that the center of the massive subhalo 9 in Okabe et al. (2014) is east of NGC 4839 that is located at the X-ray peak in the XMM-Newton and Suzaku images. This offset of the subhalo 9 might have also produced the east tail of the GCs in NGC 4839.
No bright galaxies are found in the outer region of NGC 4816, which might have contributed to the extended distribution of GCs. The strong central concentration of the GCs around NGC 4816 () in the radial number density profiles, as shown in the following section, indicates that a majority of the GCs in this region are bound to the NGC 4816 group. In the GC number density map of Figure 3 there are several weak GC clumps in the outskirts of the NGC 4816 group, some of which can be due to some non-group member galaxies, but their contribution to the group GC system is negligible.
3.4 Radial Number Density Profiles of the GCs
We derive the radial number density profiles of the GCs in NGC 4839 and NGC 4816. We estimate the background levels from the surrounding regions (at for NGC 4839 and for NGC 4816), and subtract them from the original counts for the galaxy regions.
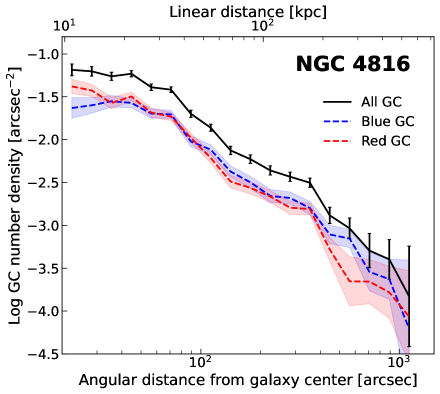
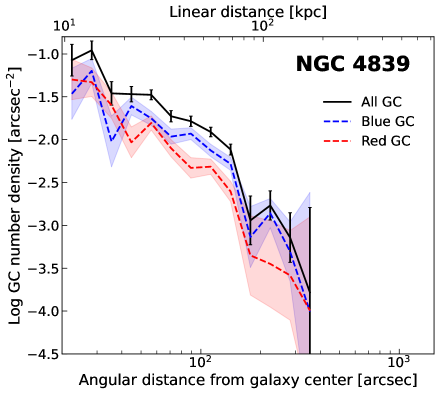
GC colors such as are a useful proxy for metallicity. The color in this study is less sensitive than the color, but is still useful. We divide the GC sample into two subsamples according to their color: blue (metal-poor) GCs with , and the red (metal-rich) GCs with , as described in Oh et al. (2023). We derive the radial number density profiles of the blue GCs and red GCs in NGC 4839 and NGC ,4816, displaying them as well as that of all GCs in Figure 4. This figure shows that the blue GC system is slightly more extended than the red GC system in both NGC 4839 and NGC 4816.
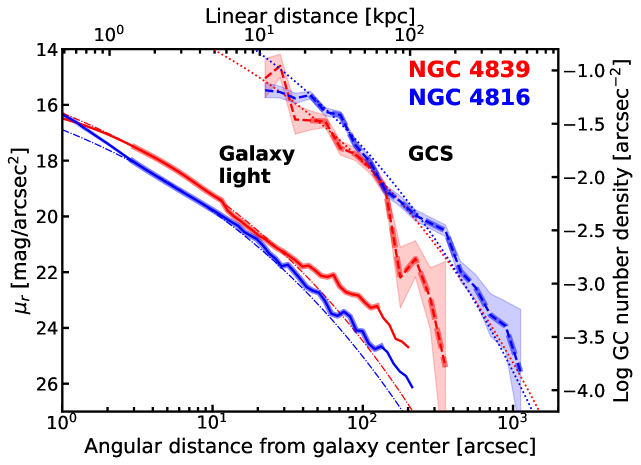
In Figure 5, we compare the radial profiles of the GC number density and surface brightness of galaxy light in NGC 4839 and NG 4816 For comparison with galaxy light, we derive the radial surface brightness profiles of the two galaxies from the HSC -band images. First we mask out several bright sources except for the two galaxies in the images. Then we obtain surface brightness profiles of the galaxies using annular aperture photometry, and plot them in the same figure.
Several interesting features are noted in Figure 5. First, the radial number density profiles of the GCs in the two galaxies show a striking difference in the outer region, while they are similar in the inner region. The decline in the central region at ( kpc) is due to incompleteness of our photometry, so we use only the data for the outer region at . We note only the difference in the outer regions between the two galaxies. The radial number density profile of the NGC 4839 GCs shows a sudden drop at kpc, and few GCs are found at kpc. On the other hand, the radial number density profile of the NGC 4816 GCs shows a slow decline even in the outer region at kpc, and some GCs are found even out to kpc.
Second, the surface brightness profiles of the two galaxies are similar in the inner region at kpc, and show a slight difference in the outer region at kpc. The shapes of these profiles are also similar to that of the GC number density profile of NGC 4816, but showing a clear difference against that of the GC number density profile of NGC 4839.
Third, we fit the surface brightness profiles of the galaxies () with a Sérsic law for (i.e., a de Vaucouleurs law), as shown by the dot-dashed lines. The surface brightness profiles of the galaxy light in the inner regions of the two galaxies are reasonably fit by the Sérsic law. The effective radius of the NGC 4839 galaxy light, kpc, is similar to that of the NGC 4816 galaxy light, kpc. The surface brightness profile of NGC 4839 shows a slight excess over the fitting line at , which is a cD envelope, consistent with the previous results in Schombert (1988); Ali et al. (2014). On the other hand, this excess is much weaker in the case of NGC 4816.
Fourth, we fit the radial number density profiles of GCs at in NGC 4816 with a Sérsic law for , as shown by the dotted line in the figure. The radial number density profile of the NGC 4816 GCs is approximately fit by the Sérsic law. The effective radius of the NGC 4816 GC system derived from this fitting, is kpc. In the case of NGC 4839, the radial number density profile of the GCs in the inner region () is roughly fit by the Sérsic law, but the number density is significantly lower than the fitted line in the outer region at . We derive the GC system effective radius of the two galaxies, from the cumulative radial distribution of GCs. We assume that the number density profile is flat in the central region () where our data is incomplete (see Lee et al. (2008) for the radial number density profile of M60 GCs)). The effective radius of the GC system derived from this, is = kpc for NGC 4839. We resample the radial density profiles from the data 1000 times, and repeat the same procedure to derive an effective radius from each profile. From this we obtain a standard deviation of resampled as a measuring error. Note that the true error must be larger than this error. Similarly we obtain = kpc for NGC 4816, which is larger than, but consistent, within the error, with the value based on the fitting. Thus the effective radius of the NGC 4839 GC system is about three times smaller than that of the NGC 4816 GC system.
4 Discussion and Conclusion
Coma is an ideal target for investigating not only the general assembly process of galaxy clusters but also the details of the merging process including the infall phase of substructures. Various substructures related with the merging process in Coma were discovered in previous X-ray images (see Briel et al. (1992); White et al. (1993); Neumann et al. (2001); Sanders et al. (2020); Mirakhor & Walker (2020); Churazov et al. (2021) and references therein). Early studies based on X-ray observations suggested that the NGC 4839 group is in the first phase of infall (Briel et al., 1992; White et al., 1993). Then Burns et al. (1994) presented a new scenario, based on hydro/N-body simulations, that Coma already had a lunch (the NGC 4839 group) and the NGC 4839 group is in the second infall, which can explain the optical, radio, and X-ray properties of Coma. Later Colless & Dunn (1996) pointed out the shortcomings of the arguments in Burns et al. (1994), and argued that NGC 4839 is in the first phase of infall, based on dynamics of a large number of Coma galaxies. Most of these substructures could be explained either in pre-merger scenarios or in post-merger scenarios, as summarized in Table 1.
Later Lyskova et al. (2019) noted two prominent features seen in the XMM-Newton and Chandra images of the NGC 4839 group: a long (600 kpc) bent tail of cool gas of NGC 4839, and a sheath of enhanced X-ray surface brightness due to hotter gas in the southwest, and tried SPH simulations to test both pre-merger and post-merger scenarios. They concluded that the post-merger scenario can explain better the observational results (X-ray brightness and temperatures) than the pre-merger scenario. According to this scenario (see their Fig. 8), the NGC 4839 group began falling to the main cluster from the northeast about 2 Gyr ago, passed the center about 1.6 Gyr ago, and began the second infall after reaching the apocenter in the southwest recently.
Recently from the X-ray images obtained with the SRG/eROSITA, Churazov et al. (2021, 2022) found a faint X-ray bridge connecting the NGC 4839 group with the main cluster. This bridge may be a remnant of stripped gas while NGC 4839 moves outward from the main cluster to the current position, showing that it is strong evidence that NGC 4839 already passed the main cluster core (see their Fig. 11). Churazov et al. (2021, 2022) also pointed out that the existence of the bow shock at (960 kpc) in the west and the radio relic at Mpc in the southwest (Bonafede et al., 2021) may correspond, respectively, to the secondary shock (produced when crossing the apocenter) and the primary shock (produced when crossing the main cluster core) caused by the merging event with NGC 4839.
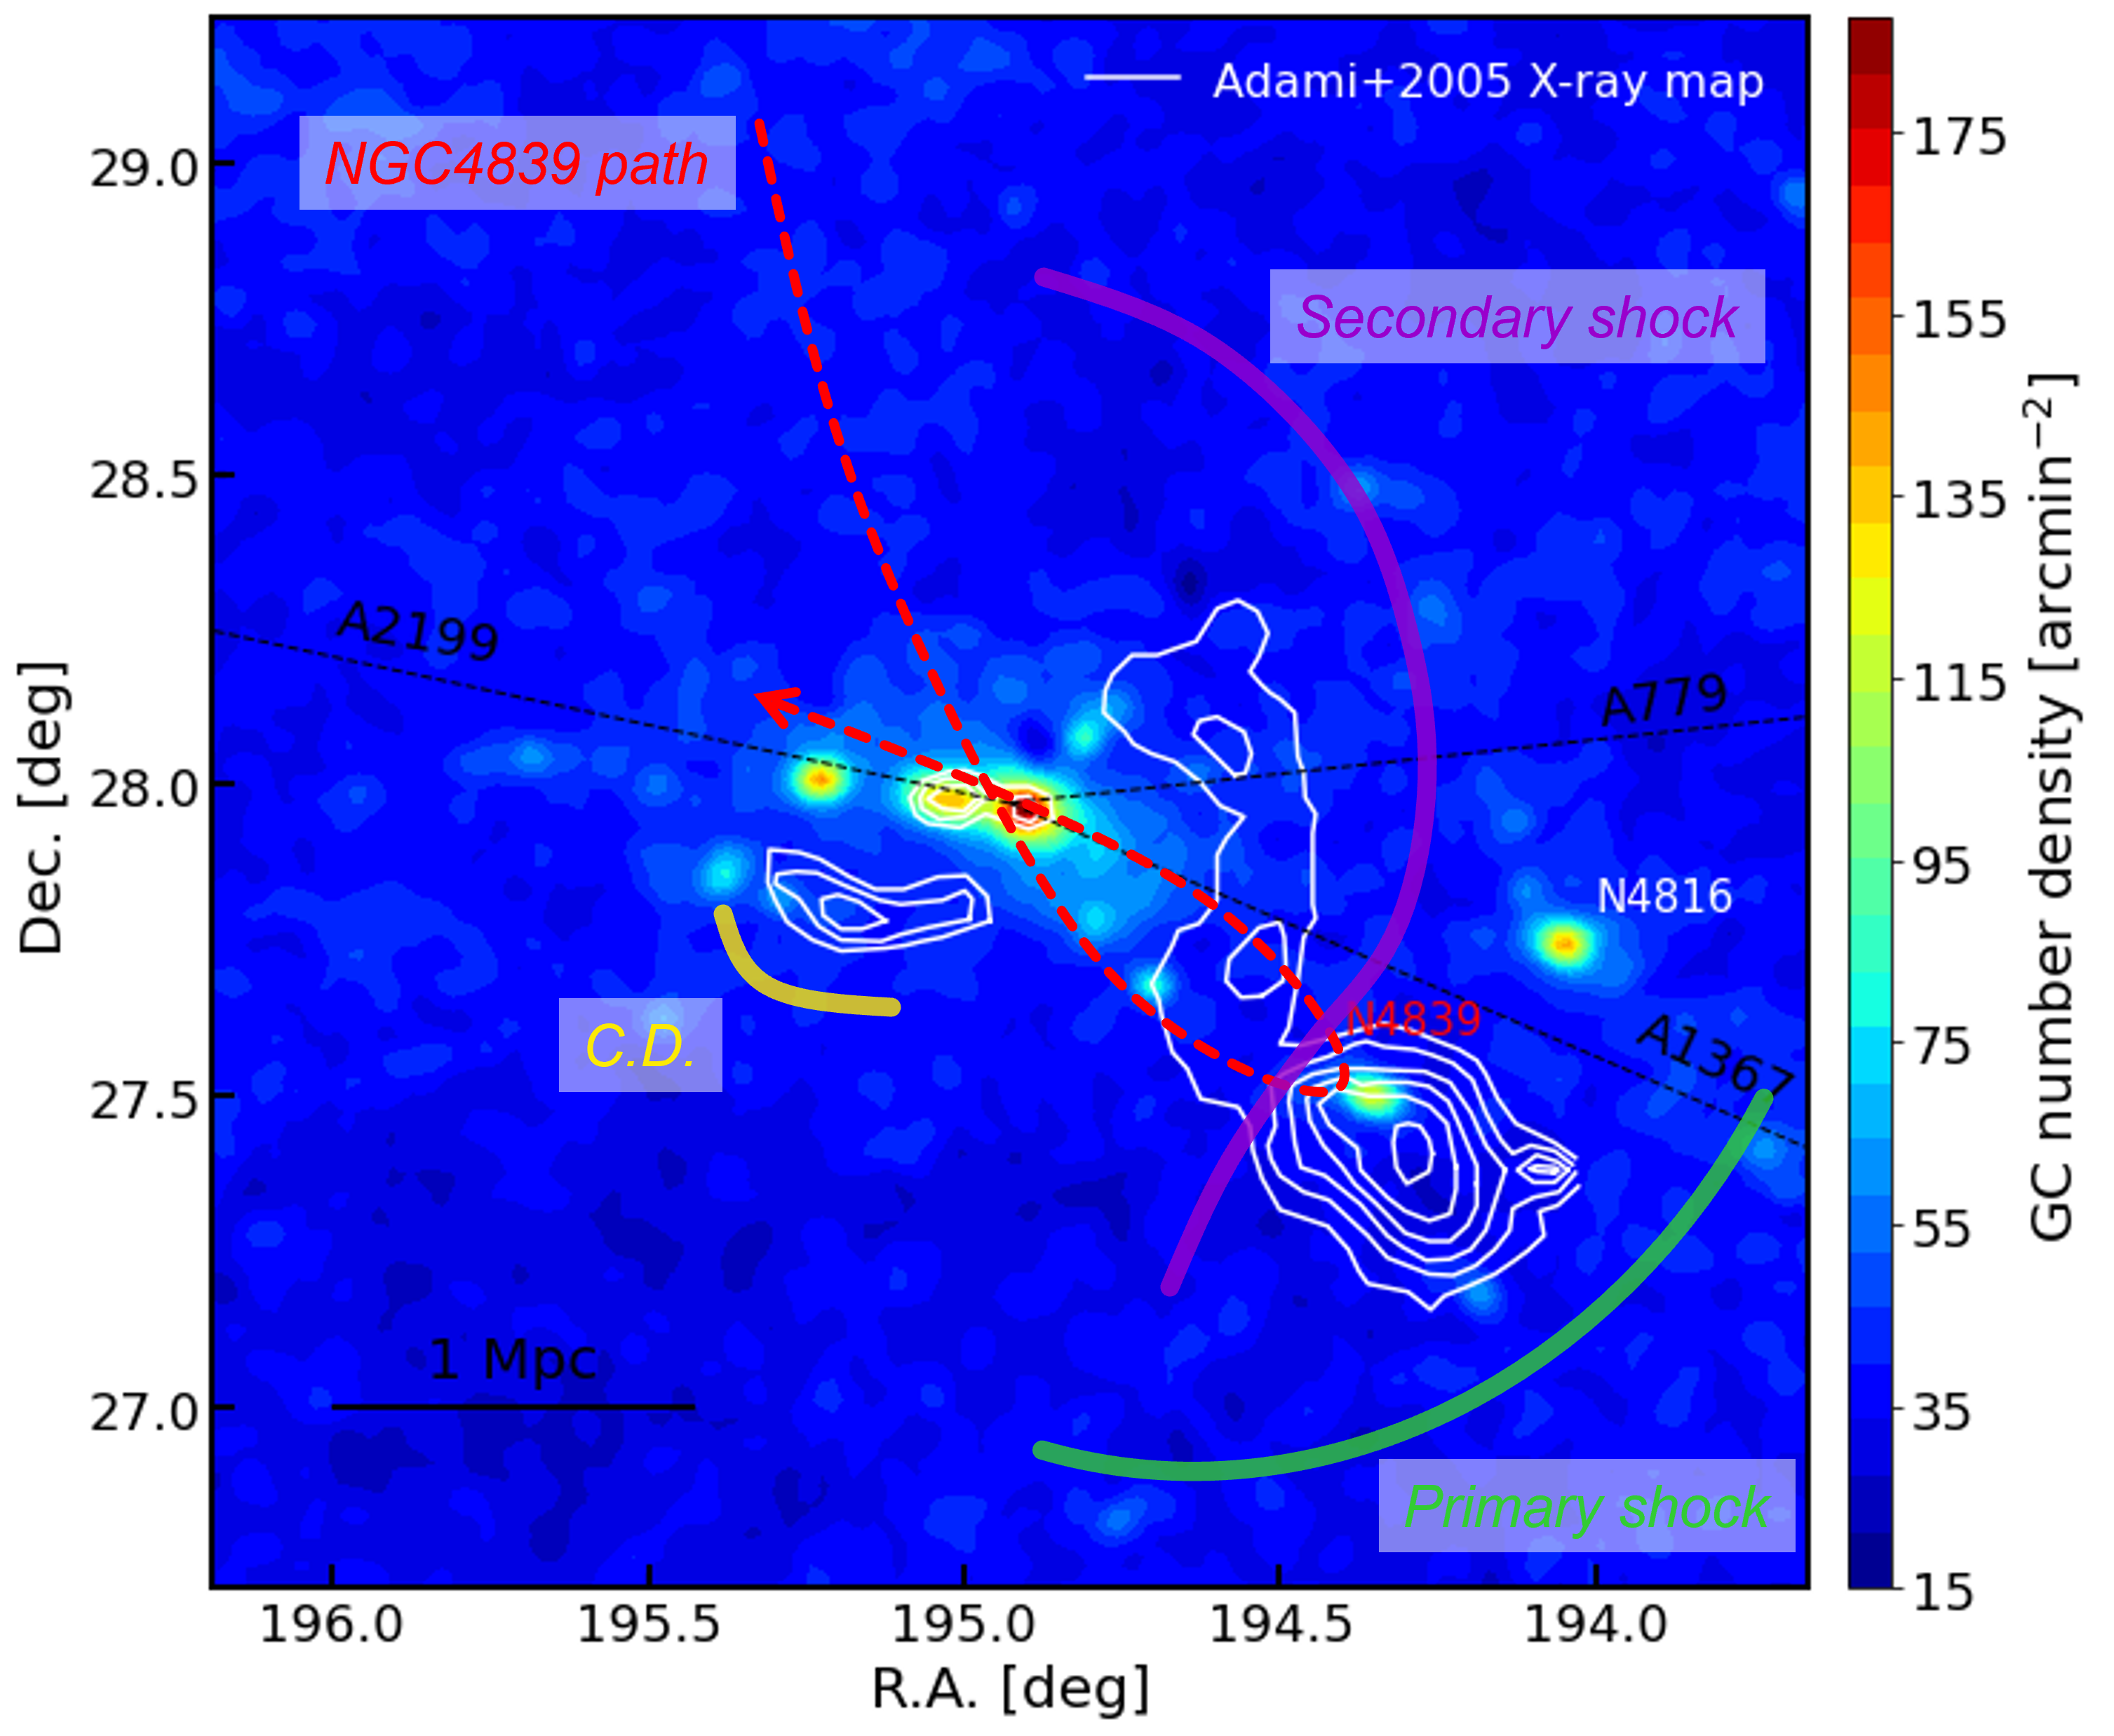
In Figure 6 we compare the GC number density map (pseudocolor map) with the XMM-Newton X-ray contour map of hot gas obtained after model subtraction (showing substructures better, Neumann et al. (2001, 2003)) (based on Fig. 3 in Adami et al. (2005)). In this figure, the X-ray contours around the NGC 4839 region show a slight offset from the center of the NGC 4839 GC clump. This offset is not seen in the recent X-ray data (Lyskova et al., 2019; Churazov et al., 2021). This offset is due to the outdated X-ray data (Neumann et al., 2003) used in Adami et al. (2005). The X-ray map shows three prominent substructures: (a) the NGC 4839 group where a strong concentration of GCs is seen only at the position of NGC 4839, (b) a large arc-like western substructure where few GCs are found, and (c) a smaller substructure associated with NGC 4911/4921 in the southeast where only a small population of GCs are seen. Note that the X-ray emission substructure is seen in the NGC 4839 group, but not in the NGC 4816 group.
The center of the NGC 4839 group (G2 in Adami et al. (2005)) was close to NGC 4839 in the old study by Adami et al. (2005). However, the recent study based on a much larger sample of Coma members by Healy et al. (2021) shows that the center of the NGC 4839 group (S11) is significantly offset to the southwest from NGC 4839 (see their Fig. 11). On the other hand, the recent SRG/eROSITA X-ray data with higher spatial resolution (Churazov et al., 2021) (as well as XMM-Newton data) shows clearly an X-ray peak at the position of NGC 4839 which is embedded in a much more diffuse X-ray emission. This diffuse component is significantly overlapped with the galaxy distribution of the S11 group (see Fig. 11 in Healy et al. (2021)).
In the figure we also add the trajectory (red dashed line) of the NGC 4839 group suggested for the second-infall scenario(Lyskova et al., 2019; Churazov et al., 2021) (from Figure 11 in Churazov et al. (2021)), as well as other known substructures. The very compact spatial extent of the GC system in NGC 4839, much smaller than the GC system in NGC 4816, can be explained if NGC 4839 lost a significant number of GCs in the outskirt of NGC 4839 when it passed the main cluster.
On the other hand, the more extended GC system in NGC 4816 indicates that it may be in the first phase of infall, as described below. The radial velocity of the NGC 4839 group is 768 km s-1 larger than that of the main cluster (6853 km s-1). Colless & Dunn (1996) suggested that the angle between the observer and the velocity vector of the NGC 4839 group is about 74 deg so the merger is happening with km s-1 almost in the projected sky plane. Which of the main cluster and NGC 4839 is closer to us is not yet known. On the other hand, the relative velocity of the NGC 4816 group with respect to the main cluster is only +35 km s-1 and the NGC 4816 group is located along the large scale filament connecting with Abell 1367. Considering these we infer that the NGC 4816 group is infalling to the cluster center in the sky plane. In addition, the GC system of the NGC 4816 shows an extended structure with a continuously declining radial number density profile. These results indicate that the NGC 4816 is in its first infall. If it is in its second infall, its radial profile of the GC system would have shown a significant drop in the outer region like the one in the NGC 4839 group.
If NGC 4839 is in the first phase of infall, it should show a similar distribution to that of NGC 4816, and it would be difficult to explain the observed difference between NGC 4839 and NGC 4816. When NGC 4839 crosses the main cluster core again, it would lose more GCs, which will become part of the intracluster GCs.
In conclusion, the spatial distribution of GCs in NGC 4839 and its environment supports the second infall scenario where the NGC 4839 passed the Coma center about 1.6 Gyr ago, and began the second infall after reaching the apocenter in the southwest. Previous simulations on GCs in galaxy clusters (e.g., Ramos-Almendares et al. (2018, 2020)) are useful to understand the spatial distribution and kinematics of the GCs in large scales. However none of them provide any results on how the motion of individual groups in galaxy clusters affects the size of the GC systems in individual galaxies, which could be compared with the results in this study. We expect that our results motivate future simulations to address this issue.
References
- Adami et al. (2005) Adami, C., Biviano, A., Durret, F., et al. 2005, A&A, 443, 17. doi:10.1051/0004-6361:20053504
- Aihara et al. (2019) Aihara, H., AlSayyad, Y., Ando, M., et al. 2019, PASJ, 71, 114
- Akamatsu et al. (2013) Akamatsu, H., Inoue, S., Sato, T., et al. 2013, PASJ, 65, 89. doi:10.1093/pasj/65.4.89
- Ali et al. (2014) Ali, G. B., Shaban, E. A., Amin, M. Y., et al. 2014, Ap&SS, 352, 789. doi:10.1007/s10509-014-1991-y
- Biviano (1998) Biviano, A. 1998, Untangling Coma Berenices: A New Vision of an Old Cluster, 1
- Bonafede et al. (2021) Bonafede, A., Brunetti, G., Vazza, F., et al. 2021, ApJ, 907, 32. doi:10.3847/1538-4357/abcb8f
- Bonafede et al. (2022) Bonafede, A., Brunetti, G., Rudnick, L., et al. 2022, arXiv:2203.01958
- Briel et al. (1992) Briel, U. G., Henry, J. P., & Boehringer, H. 1992, A&A, 259, L31
- Burns et al. (1994) Burns, J. O., Roettiger, K., Ledlow, M., et al. 1994, ApJ, 427, L87. doi:10.1086/187371
- Caldwell et al. (1993) Caldwell, N., Rose, J. A., Sharples, R. M., et al. 1993, AJ, 106, 473. doi:10.1086/116656
- Churazov et al. (2021) Churazov, E., Khabibullin, I., Lyskova, N., et al. 2021, A&A, 651, A41. doi:10.1051/0004-6361/202040197
- Churazov et al. (2022) Churazov, E., Khabibullin, I., Bykov, A. M., et al. 2022, arXiv:2205.07511
- Colless & Dunn (1996) Colless, M. & Dunn, A. M. 1996, ApJ, 458, 435. doi:10.1086/176827
- de Grijs & Bono (2020) de Grijs, R. & Bono, G. 2020, ApJS, 248, 6. doi:10.3847/1538-4365/ab8562
- Doi et al. (1995) Doi, M., Fukugita, M., Okamura, S., et al. 1995, ApJS, 97, 77. doi:10.1086/192136
- Healy et al. (2021) Healy, J., Blyth, S.-L., Verheijen, M. A. W., et al. 2021, A&A, 650, A76. doi:10.1051/0004-6361/202038738
- Jordán et al. (2004) Jordán, A., Côté, P., West, M. J., et al. 2004, AJ, 127, 24. doi:10.1086/379965
- Kim et al. (1989) Kim, K.-T., Kronberg, P. P., Giovannini, G., et al. 1989, Nature, 341, 720. doi:10.1038/341720a0
- Lal et al. (2022) Lal, D. V., Lyskova, N., Zhang, C., et al. 2022, ApJ, 934, 170. doi:10.3847/1538-4357/ac7a9b
- Lee et al. (2008) Lee, M. G., Park, H. S., Kim, E., et al. 2008, ApJ, 682, 135. doi:10.1086/587469
- Lee et al. (2022) Lee, M. G., Bae, J. H., & Jang, I. S. 2022, ApJ, 940, L19. doi:10.3847/2041-8213/ac990b
- Lyskova et al. (2019) Lyskova, N., Churazov, E., Zhang, C., et al. 2019, MNRAS, 485, 2922. doi:10.1093/mnras/stz597
- Madrid et al. (2018) Madrid, J. P., O’Neill, C. R., Gagliano, A. T., et al. 2018, ApJ, 867, 144. doi:10.3847/1538-4357/aae206
- Malavasi et al. (2020) Malavasi, N., Aghanim, N., Tanimura, H., et al. 2020, A&A, 634, A30. doi:10.1051/0004-6361/201936629
- Marín-Franch & Aparicio (2002) Marín-Franch, A. & Aparicio, A. 2002, ApJ, 568, 174. doi:10.1086/338839
- Mirakhor & Walker (2020) Mirakhor, M. S. & Walker, S. A. 2020, MNRAS, 497, 3204. doi:10.1093/mnras/staa2203
- Mulchaey (2000) Mulchaey, J. S. 2000, ARA&A, 38, 289. doi:10.1146/annurev.astro.38.1.289
- Neumann et al. (2001) Neumann, D. M., Arnaud, M., Gastaud, R., et al. 2001, A&A, 365, L74. doi:10.1051/0004-6361:20000182
- Neumann et al. (2003) Neumann, D. M., Lumb, D. H., Pratt, G. W., et al. 2003, A&A, 400, 811. doi:10.1051/0004-6361:20021911
- Oh et al. (2023) Oh, S., Lee, M. G., & Jang, I. S. 2023, in preparation
- Okabe et al. (2014) Okabe, N., Futamase, T., Kajisawa, M., et al. 2014, ApJ, 784, 90. doi:10.1088/0004-637X/784/2/90
- Peng et al. (2011) Peng, E. W., Ferguson, H. C., Goudfrooij, P., et al. 2011, ApJ, 730, 23. doi:10.1088/0004-637X/730/1/23
- Ramos-Almendares et al. (2018) Ramos-Almendares, F., Abadi, M., Muriel, H., et al. 2018, ApJ, 853, 91. doi:10.3847/1538-4357/aaa1ef
- Ramos-Almendares et al. (2020) Ramos-Almendares, F., Sales, L. V., Abadi, M. G., et al. 2020, MNRAS, 493, 5357. doi:10.1093/mnras/staa551
- Sanders et al. (2020) Sanders, J. S., Dennerl, K., Russell, H. R., et al. 2020, A&A, 633, A42. doi:10.1051/0004-6361/201936468
- Sasaki et al. (2016) Sasaki, T., Matsushita, K., Sato, K., et al. 2016, PASJ, 68, 85. doi:10.1093/pasj/psw078
- Schlafly & Finkbeiner (2011) Schlafly, E. F., & Finkbeiner, D. P. 2011, ApJ, 737, 103
- Schlegel et al. (1998) Schlegel, D. J., Finkbeiner, D. P., & Davis, M. 1998, ApJ, 500, 525
- Schombert (1988) Schombert, J. M. 1988, ApJ, 328, 475. doi:10.1086/166306
- Stetson (1987) Stetson, P. B. 1987, PASP, 99, 191. doi:10.1086/131977
- Tully (2015) Tully, R. B. 2015, AJ, 149, 171. doi:10.1088/0004-6256/149/5/171
- White et al. (1993) White, S. D. M., Briel, U. G., & Henry, J. P. 1993, MNRAS, 261, L8. doi:10.1093/mnras/261.1.L8
| Band | Features | Infall Phasea | Referenceb |
|---|---|---|---|
| X-ray | NGC 4839 inner tail (SW), SW main tail (sheath) | 1,2 | 1,2 |
| SW bridge connecting NGC 4839 and the main cluster | 2 | ||
| W sharp edge, E contact discontinuity | 1,2 | ||
| Radio (cont) | Coma radio halo, W halo front | 2 | 3,4 |
| SW bridge, SW streams, SW relic ( Mpc) | 2 | ||
| Radio (HI) | HI deficiency and old galaxies in NGC 4839 group | 1,2 | 5 |
| Optical | E+A galaxies in SWc | 2 | 6 |
| galaxy distribution and kinematics | 1,2 | 7 | |
| Compact globular cluster system in NGC 4839 | 2 | This study |
| Parameter | Main cluster | NGC 4839 group | NGC 4816 group | Referencea |
|---|---|---|---|---|
| Heliocentric galaxy velocity, | 7167 km s-1 | 7338 km s-1 | 6915 km s-1 | 1,2,3 |
| Heliocentric group velocity, | 6853 km s-1 | 7621 km s-1 | 6898 km s-1 | 1,2,3 |
| Velocity dispersion, | 1082 km s-1 | 462 km s-1 | 521 km s-1 | 2,3 |
| Virial Mass (dynamics)b, | 4 | |||
| Weak Lensing Massc, | 5 |