FLARES IX: The Physical Mechanisms Driving Compact Galaxy Formation and Evolution
Abstract
In the Flares (First Light And Reionisation Epoch Simulations) suite of hydrodynamical simulations, we find the high redshift () intrinsic size-luminosity relation is, surprisingly, negatively sloped. However, after including the effects of dust attenuation we find a positively sloped UV observed size-luminosity relation in good agreement with other simulated and observational studies. In this work, we extend this analysis to probe the underlying physical mechanisms driving the formation and evolution of the compact galaxies driving the negative size-mass/size-luminosity relation. We find the majority of compact galaxies (), which drive the negative slope of the size-mass relation, have transitioned from extended to compact sizes via efficient centralised cooling, resulting in high specific star formation rates in their cores. These compact stellar systems are enshrouded by non-star forming gas distributions as much as larger than their stellar counterparts. By comparing with galaxies from the Eagle simulation suite, we find that these extended gas distributions ‘turn on’ and begin to form stars between and leading to increasing sizes, and thus the evolution of the size-mass relation from a negative to a positive slope. This explicitly demonstrates the process of inside-out galaxy formation in which compact bulges form earlier than the surrounding discs.
keywords:
galaxies: high-redshift – galaxies: formation – galaxies: evolution – galaxies: star formation1 Introduction
Galaxy sizes are the macroscopic culmination of a myriad of internal and external multi-scale physical mechanisms, such as galaxy mergers, instabilities, gas accretion, gas transport, star formation and feedback processes (Conselice, 2014). Many of these processes take place below the resolution of cosmological hydrodynamic simulations that have large enough periodic volumes to yield statistically significant galaxy samples at high redshift. Models describing these small-scale physical mechanisms are so-called ‘sub-grid’ models (Somerville & Davé, 2015). Galaxy sizes are a powerful diagnostic of the performance of a sub-grid model since, unlike stellar masses or luminosities, they are not only dependent on how much stellar mass is formed but also where this mass is distributed within a galaxy, and thus the properties of the local environment in the Interstellar Medium (ISM).
The intrinsic size-luminosity relation and the stellar size-mass relation both describe the underlying distribution of stellar mass in galaxies. At low redshift (), simulations produce a positive relation between increasing size and increasing mass. Furlong et al. (2017) measured the size-mass relation in Eagle finding a positive relation which flattens at , and an increase in size with decreasing redshift over the range . Both findings are in good agreement with the observations referenced therein. Furlong et al. (2017) found that passive galaxies at evolved in size by migration of stellar particles, rather than by star formation or merging mechanisms.
Observations have shown a similar redshift evolution in the size of galaxies from the Epoch of Reionisation to the present day. In the low redshift Universe (), star-forming galaxies typically have sizes of the order pkpc (Zhang & Yang, 2019; Kawinwanichakij et al., 2021), with a positive size-luminosity relation (van der Wel et al., 2014; Suess et al., 2019; Kawinwanichakij et al., 2021). However, van der Wel et al. (2014) found a substantial population of compact and massive ( pkpc, ) galaxies at .
At a number of Hubble Space Telescope (HST) studies have found bright star-forming galaxies with compact half-light radii of 0.5-1.0 pkpc (Oesch et al., 2010; Grazian et al., 2012; Mosleh et al., 2012; Ono et al., 2013; Huang et al., 2013; Holwerda et al., 2015; Kawamata et al., 2015; Shibuya et al., 2015; Kawamata et al., 2018; Holwerda et al., 2020). The aforementioned massive compact galaxies found in van der Wel et al. (2014) could be descendants of these early compact systems that are yet to undergo a process driving size increase, such as stellar migration or inside-out star formation. These HST studies produced size-luminosity relations with positive slopes, but there is appreciable scatter in the reported slopes. The subset of these studies that include lensed sources (e.g. Kawamata et al., 2018) produce steeper slopes and resolve compact galaxies at lower luminosities than accessible to non-lensing surveys, which yield flatter size-luminosity relations.
In Roper et al. (2022) we found a negative intrinsic stellar size-luminosity relation at in the First Light And Reionisation Epoch Simulations (Flares, Lovell et al., 2021; Vijayan et al., 2021), a suite of 40 cosmological hydrodynamical zoom simulations using the Evolution and Assembly of GaLaxies and their Environments (Eagle) model (Schaye et al., 2015; Crain et al., 2015). However, after including the effects of dust attenuation, the observed size-luminosity relation exhibited a positive slope, in good agreement with current HST observations (Oesch et al., 2010; Grazian et al., 2012; Mosleh et al., 2012; Ono et al., 2013; Huang et al., 2013; Holwerda et al., 2015; Kawamata et al., 2015; Shibuya et al., 2015; Kawamata et al., 2018; Holwerda et al., 2020). This increase in slope and reversal of the trend between size and luminosity was found to be caused by the concentration of compact dust distributions obscuring the brightest regions of compact galaxies. We also probed the size-luminosity relation as a function of wavelength, finding a flattening of the relation (and indeed a shift to a negative trend) with reddening wavelength, reflecting the underlying size-mass relation. A negative high redshift intrinsic UV size-luminosity/size-mass relation is not unique to the Eagle model, with a negative intrinsic stellar size-luminosity relation present in the BlueTides simulation (Feng et al., 2016) at (Marshall et al., 2021), and the Illutris-TNG simulations (Pillepich et al., 2018) at (Popping et al., 2021), while a constant or negative stellar size-mass relation, dependent on the measurement method, was found in the Simba simulation (Davé et al., 2019) at (Wu et al., 2020).
Explicit confirmation or contradiction of a negative high redshift size-mass relation by observations remains an open question. With the infra-red capabilities of JWST we should soon be able to probe the less obscured rest-frame optical emission of galaxies at high redshift. Roper et al. (2022) showed it is possible to probe a constant observed size-luminosity relation at using JWST’s F444W filter on NIRCam, while MIRI can probe the the negative regime of the observed size-luminosity relation. Using this observational power we will soon ascertain if the negative size-mass relation in simulations is representative of the true Universe.
The evolution from the compact high redshift Universe to the extended low redshift Universe has been studied extensively in both simulations and observations. For star-forming galaxies at , it has been shown that they predominantly grow inside-out via star formation as opposed to growth via merger driven accretion. This trend is particularly evident at the massive end (log()), with evidence that they may be concurrently quenching from the inside-out and building bulges (Tacchella et al., 2015a, b, 2018; Nelson et al., 2016, 2019; Wilman et al., 2020; Matharu et al., 2022). At , the picture is less clear, with some evidence of inside-out growth (e.g. Muñoz-Mateos et al., 2007), but also a tendency for star-forming regions and stellar disks to be found to have the same size (James et al., 2009; Fossati et al., 2013). Upcoming JWST data should be able to complete this picture at least out to .
Given the surprising high redshift size-mass/luminosity relation results consistently found across various simulations at high redshift, it is imperative we understand the mechanisms that yield these unexpected trends. Regardless of whether future observations confirm or rule out this behaviour, a thorough investigation is necessary to elucidate the processes taking place. Such an investigation will aid the interpretation of observations and form the starting point for modifications to the theoretical models should this behaviour be unique to simulations. In this work, we address this by probing the physical mechanisms driving the formation and evolution of compact galaxies, utilising the environmental coverage of Flares to yield a representative description of size evolution from the high redshift Universe () to the present day.
This article is structured as follows: In Section 2 we detail the Flares simulations, in Section 3 we discuss stellar and gas half-mass radii and their size-mass relations, in Section 4 we investigate the formation of compact stellar systems, and in Section 5 we explore the physical mechanisms driving size evolution from the Epoch of Reionisation to the present day. Finally, in Section 6 we present our conclusions. Throughout this work, we assume a Planck year 1 cosmology (, , , Planck Collaboration et al. (2014)).
2 First Light And Reionisation Epoch Simulations (Flares)
Flares is a suite of 40 cosmological hydrodynamical zoom simulations focusing on the Epoch of Reionisation (Lovell et al., 2021; Vijayan et al., 2021). Each resimulation is a spherical region with radius 14 cMpc/h, selected from a ‘parent’ dark matter only (DMO) simulation (Barnes et al., 2017a). The size of the parent simulation enables a region selection methodology capturing the rarest most over-dense regions in the Universe where it is thought the most massive galaxies form (Chiang et al., 2013; Lovell et al., 2018). We select the 40 regions at , at which point the most extreme overdensities are only mildly non-linear, thus preserving the overdensity hierarchy across the full resimulation redshift range. The resimulations span a wide range of overdensities (; see Table A1 of Lovell et al. 2021) with a bias towards extreme overdensities to guarantee a statistically significant sample of galaxies accessible to the JWST and other upcoming next generation telescopes such as the Euclid Space Telescope (Euclid Collaboration et al., 2022), the Nancy Grace Roman Space Telescope (Wang et al., 2022), and the Extremely Large Telescope (Ramsay et al., 2021). We store outputs (snapshots) at integer redshifts from to , inclusive.
Flares employs the AGNdT9 variant of the Eagle sub-grid model (Schaye et al., 2015; Crain et al., 2015). We choose the AGNdT9 variant since it produces similar mass functions to the fiducial model while better reproducing the hot gas of groups and clusters (Barnes et al., 2017b), environments which are more prevalent in the extreme overdensities focused on in Flares. We adopt the fiducial resolution of the Eagle model with a dark matter and an initial gas particle mass of and respectively, and a gravitational softening length of at . We present a discussion of the features of the Eagle model important to this work in Section 2.1.
The Eagle model was calibrated using the galaxy mass function, the mass-size relation for discs, and the gas mass-halo mass relation, but is in good agreement with a number of low redshift observables not used for calibration (e.g. Furlong et al., 2015; Trayford et al., 2015; Lagos et al., 2015). Despite being calibrated at low redshift the Eagle model performs exceptionally well at high redshift. Indeed, previous Flares papers have shown a good agreement with: the galaxy stellar mass function (Lovell et al., 2021), the observed UV luminosity function at (Vijayan et al., 2021, 2022), HST constraints on galaxy sizes at (Roper et al., 2022), and the evolution of galaxy colours with redshift (Wilkins et al., 2022a). In addition, we have also presented galaxy populations at the redshift ‘frontier’ (; Wilkins et al., 2022b) and the behaviour of star formation and metal enrichment histories during the Epoch of Reionisation (Wilkins et al., 2022c).
Since the 40 resimulations are both a sub-sample of the environments in the parent DMO simulation and biased to extreme overdensities we apply a statistical weighting scheme to reproduce the true distribution of environments in the universe. We achieve this by applying an overdensity based weighting to each region and then producing composite distribution functions. For a detailed description of this weighting scheme please refer to the introductory Flares paper, Lovell et al. (2021).
2.1 The Eagle Model
The Eagle model used in Flares is described in detail in Schaye et al. (2015) and Crain et al. (2015); here we give a brief explanation of the elements of the model that are pertinent to this work and refer the reader to the original works for more detail.
2.1.1 Radiative cooling
Radiative cooling and photoheating are implemented on an element-by-element basis following Wiersma et al. (2009) via a look up table. This includes all 11 elements found to be important for radiative cooling and photoheating: H, He, C, N, O, Ne, Mg, Si, S, Ca, and Fe. Wiersma et al. (2009) tabulated the rates as a function of density, temperature and redshift assuming the gas to be in ionisation equilibrium and exposed to the Cosmic Microwave Background and a UV/X-ray background from galaxies and quasars (Haardt & Madau, 2001). These look up tables were produced using cloudy version 07.02 (Ferland et al., 1998).
This radiative cooling implementation comes with some caveats that are important to keep in mind in the context of this work. The assumption of ionisation equilibrium and the absence of ionising radiation from local sources may cause overestimated cooling rates in rapidly cooling gas (Oppenheimer & Schaye, 2013a) and gas that has recently been irradiated by an AGN Oppenheimer & Schaye (2013b). The model also ignores self-shielding, which could yield underestimated cooling rates in dense gas. Given that much of the star formation during the Epoch of Reionisation happens in pristine dense gas the underestimate due to self-shielding somewhat counteracts the overestimate introduced by assuming ionisation equilibrium in these regions.
2.1.2 Star formation
Star formation is implemented following Schaye & Dalla Vecchia (2008), adopting the metallicity dependent density threshold of Schaye (2004). It utilises the observed Kennicutt-Schmidt star formation law (Kennicutt, 1998) but reformulated in terms of pressure to avoid dependence on the equation of state. This modified observed Kennicutt-Schmidt star formation law is implemented stochastically assuming a Chabrier initial mass function (IMF) Chabrier (2003).
Due to resolution limitations, it is necessary to invoke a star formation density threshold which defines the minimum density at which a stellar particle can be formed, this is defined as
| (1) |
where cm-3 is the critical volume density and is the gas metallicity. For low metallicities this diverges, so an upper limit of is imposed. Furthermore, a gas density threshold of 57.7 times the cosmic mean is implemented to prevent star formation in low overdensity gas at very high redshift.
2.1.3 Stellar feedback
Stars, particularly those that are massive and short lived, interact with the ISM by injecting energy via stellar winds, radiation and supernovae. In the Eagle model these energetic events, or stellar feedback events, are implemented following the stochastic thermal feedback method proposed by Dalla Vecchia & Schaye (2012). In this implementation, the temperature increment () of a heated gas particle is specified explicitly and the contribution to a neighbouring gas particle is defined probabilistically.
Stellar feedback happens only once: when a stellar particle reaches an age of 30 Myrs, a neighbouring SPH particle can be heated with a probability dependent on the fraction of the total amount of energy from core collapse supernovae per unit stellar mass that is injected. On average,
| (2) |
where and are asymptotes which can be chosen to tune stellar feedback in the model. The inclusion of the metallicity term, where is the solar metallicity and , accounts for the metallicity dependence of thermal losses in the ISM due to metal-line cooling. The inclusion of the density term, where is the stellar birth density (the density inherited by the stellar particle from their parent gas particle), , and the density pivot cm-3, helps mitigate the inefficiency of feedback in highly enriched dense environments, such as compact galaxy cores. For low metallicities and high densities, asymptotes to (i.e stellar feedback is maximal), while at high metallicities and low densities asymptotes to (i.e stellar feedback is minimal). In the fiducial EAGLE models and . Crain et al. (2015) showed that the choice of is the more influential of the two, and choosing a value larger than unity better reproduces galaxy stellar mass functions at low stellar masses.
2.2 Structure Finding
We follow the same structure extraction method used in the Eagle project and all previous Flares papers, explained in McAlpine et al. (2016).
-
•
Dark Matter overdensities are identified using a Friends-Of-Friends (FOF) algorithm with a linking length of , where is the mean inter-particle separation.
-
•
Baryonic particle species are then assigned to the halo containing their nearest dark matter neighbour.
- •
To refine FOF groups into galaxies, Subfind finds saddle points in the density field of a group. In pathological cases this can lead to undesirable splitting of genuine galaxies with regions of extreme density. These can then lead to spurious galaxies which are often mainly comprised of a single particle type. Although these pathological cases make up of all galaxies with M⊙ at , we nonetheless undo the erroneous splitting. To do so, we identify galaxies with no contributions in stellar, gas or dark matter components and recombine them into their nearest parent ‘central’ substructure from which they were excised, if there is such a substructure within 30 pkpc.
In rare instances, tidal stripping can cause diffuse populations of particles at large radii. These separated populations can have extreme effects on derived galaxy properties. To mitigate the effect of this, we only consider particles within a 30 pkpc aperture centred on the galaxy’s centre of potential, in line with previous Eagle and Flares projects. All galaxy properties presented in this work are derived using this aperture unless explicitly stated otherwise.
3 Galaxy Half Mass Radii
In this section, we present 3-dimensional size-mass relations using half mass radii () derived from the particle distribution. The half mass radius is the radius of a sphere centred on the centre of potential enclosing half the total mass (of a particular particle species) in a 30 pkpc aperture. Throughout this work, we only present half mass radii for galaxies with at least 100 stellar particles within the 30 pkpc aperture (), unless stated otherwise. This translates to an approximate stellar mass threshold of and ensures the stellar distribution is well sampled and the derived half mass radii are robust.
3.1 Stellar Half Mass Radii
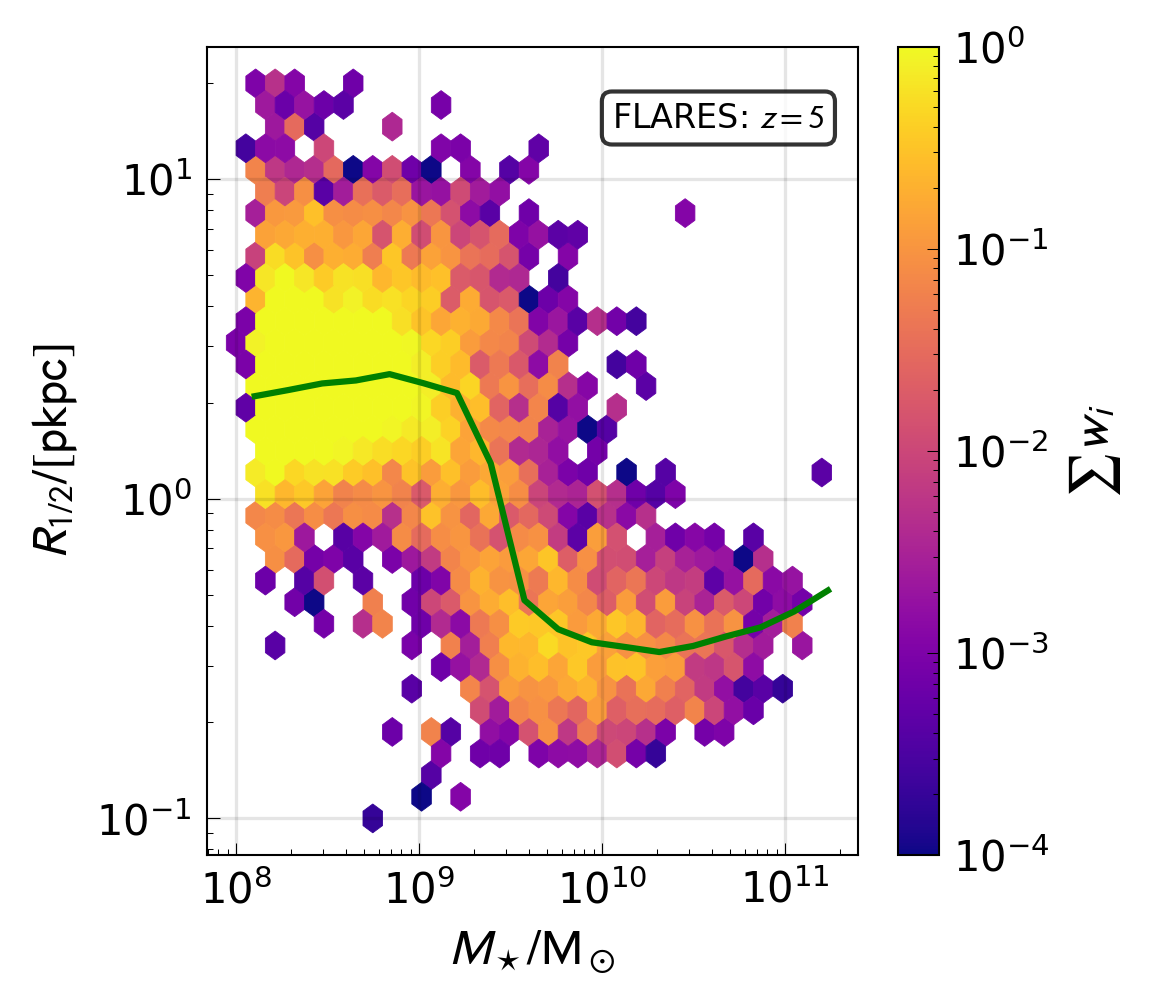
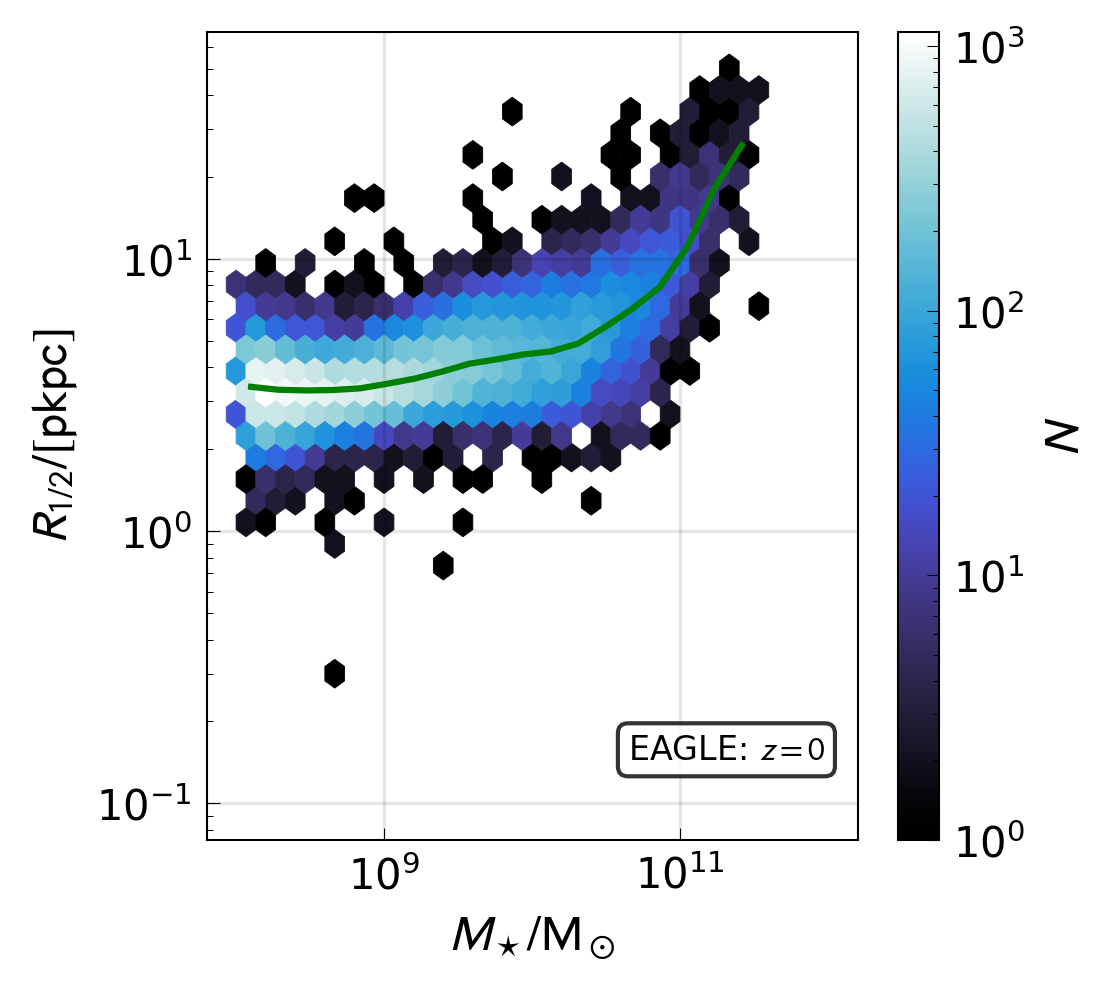
Figure 1 shows the stellar size-mass relation at from Flares (top panel) and from Eagle (bottom panel). The Flares galaxies in the upper panel are statistically weighted using the overdensity of their resimulation region to ensure the resimulated sample is representative of the population. For a detailed description of this weighting, we direct the reader to Lovell et al. (2021). At low redshift, the relation has a positive slope, as demonstrated in Furlong et al. (2017). However, in Flares we find a negatively sloped and bi-modal stellar size-mass relation. Although not shown here, the bi-modality and negative trend are evident for all snapshots at (Roper et al., 2022) and agree with the findings of other works (Wu et al., 2020; Marshall et al., 2021; Popping et al., 2021). For galaxies in Flares at to become comparable in size to those found in Eagle at they will have to become at least ten, or for the most massive galaxies at least 50, times larger. This bi-modality implies two scenarios: there are two distinct populations of galaxies with separate evolution tracks, or galaxies start as diffuse low mass systems which later evolve to become compact high mass systems. We investigate which scenario is applicable in Section 4.1.
3.2 Gas Half Mass Radii
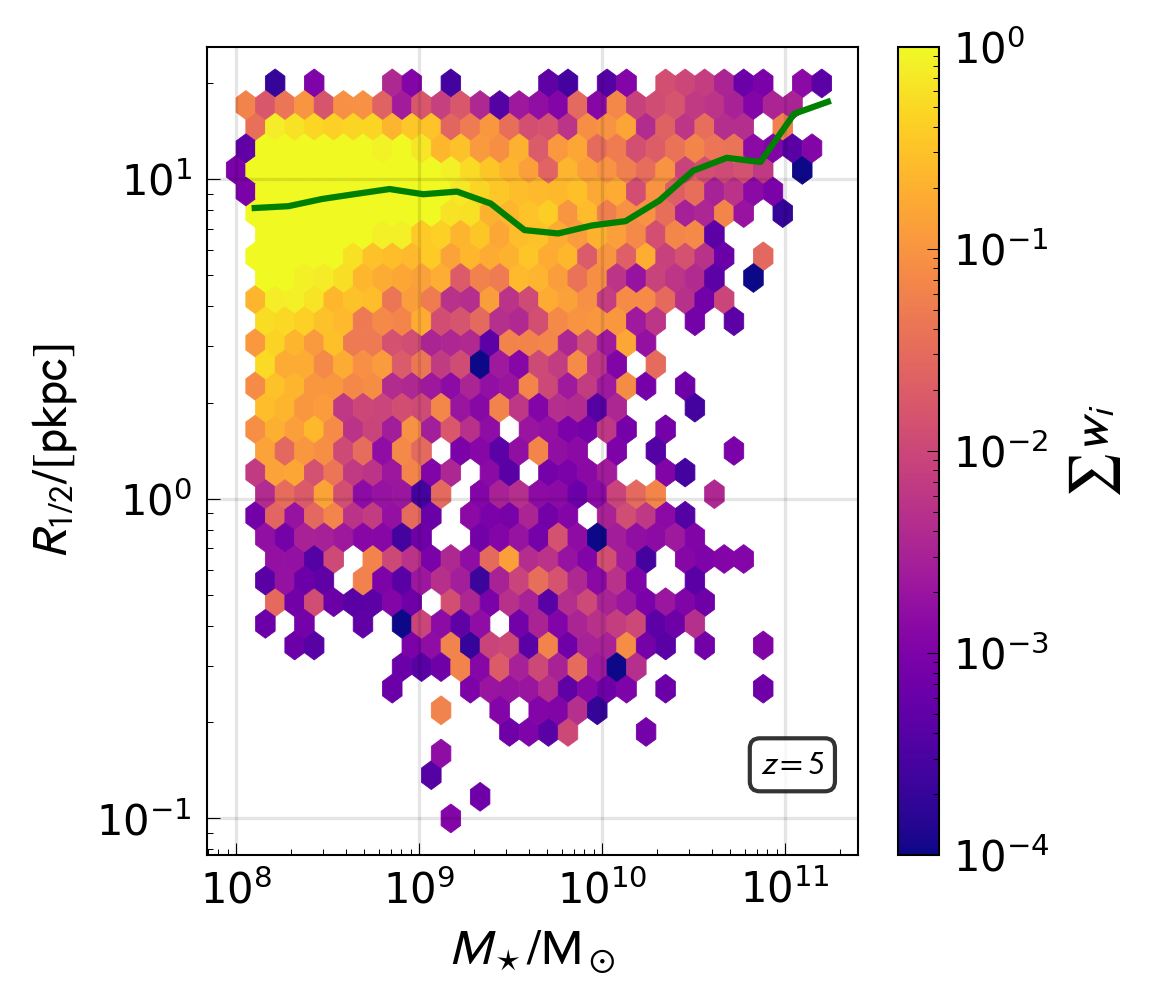
If high redshift stellar distributions are compact, then one might expect that the gas from which they form should also be compact. Figure 2 shows the gas size-stellar mass relation at for all galaxies in Flares with . In contrast to the stellar size-mass relation, we find the relation between gas size and stellar mass is constant with a large scatter to small gas radii at fixed stellar mass. For galaxies with there again appears to be a bi-modality in gas size. Note, however, that this bi-modality is different to that present in Figure 1 where galaxies with populate only the compact population.
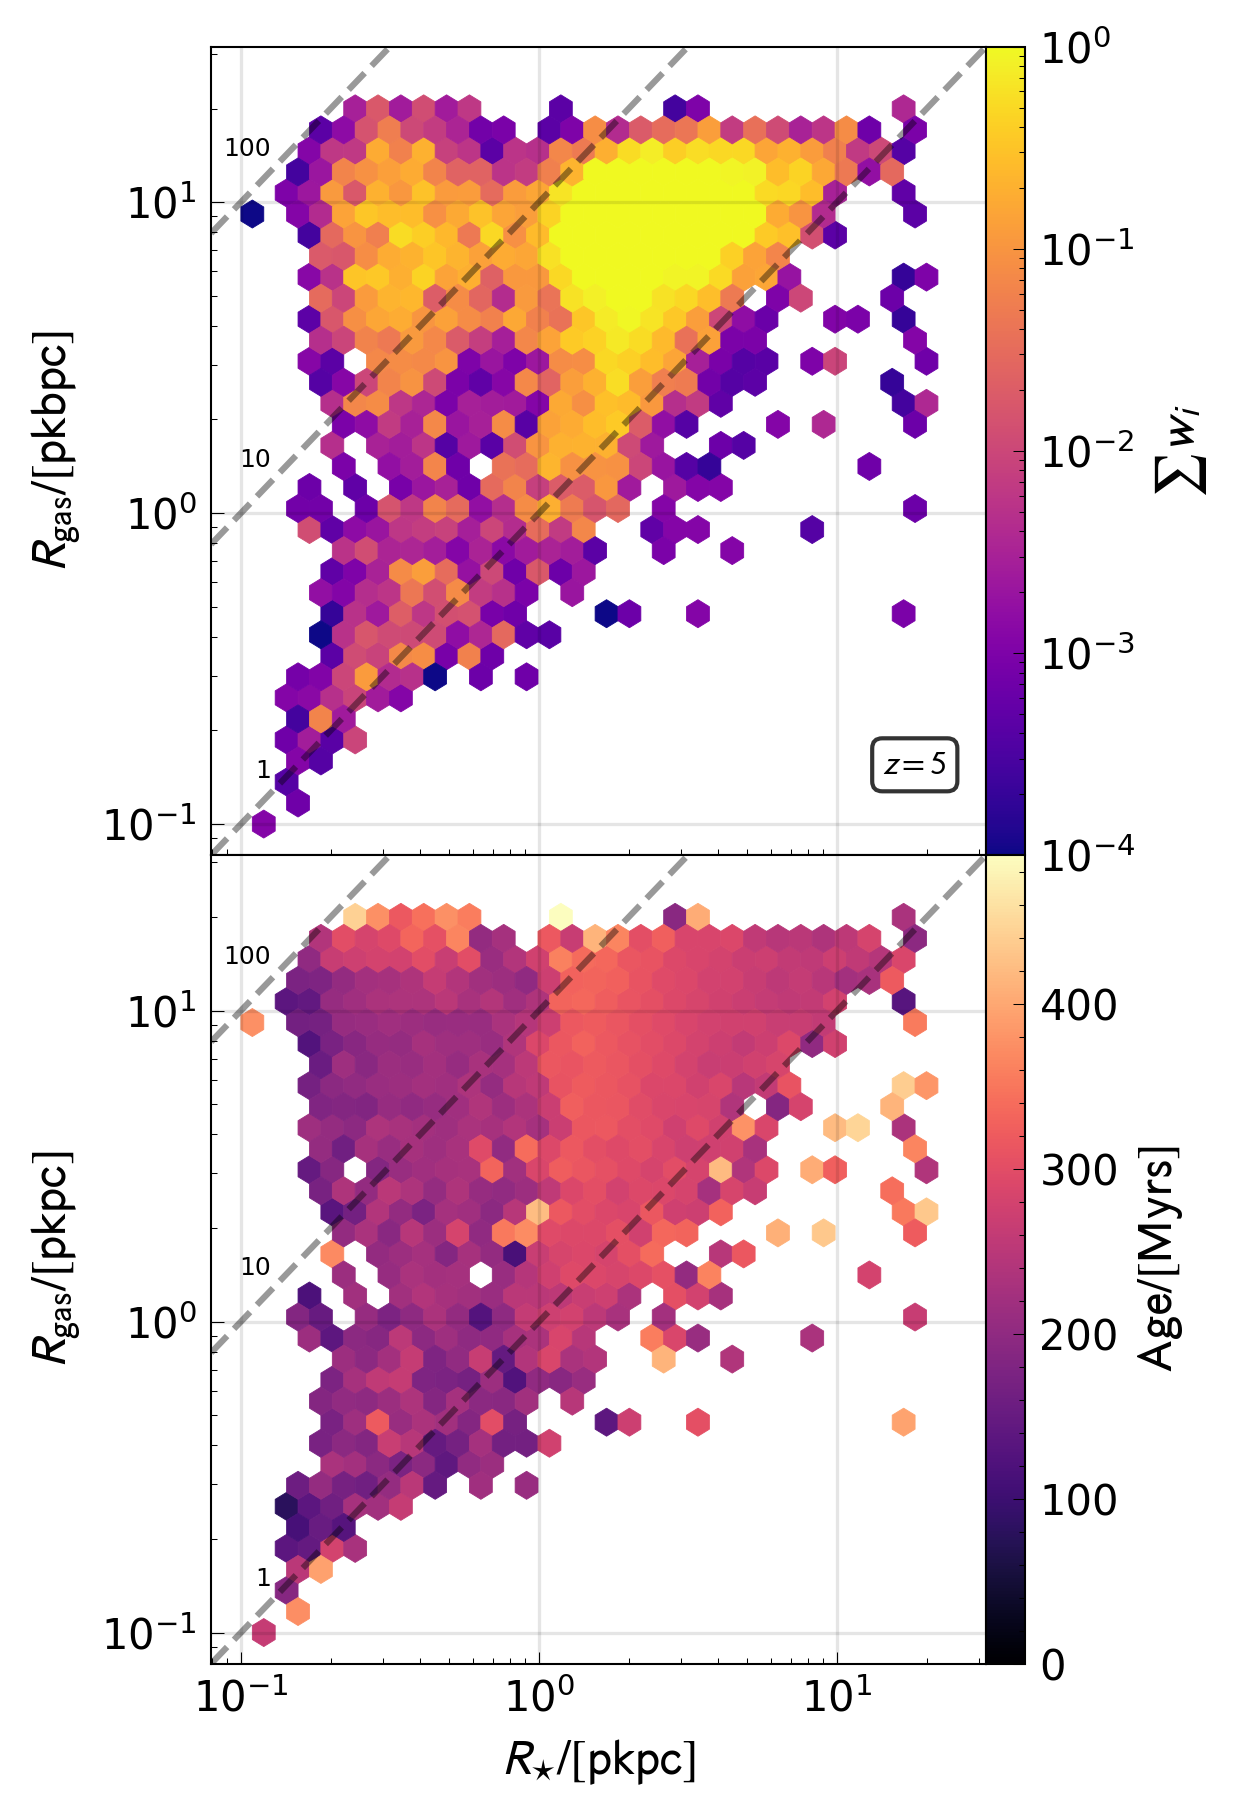
To explicitly compare stellar distributions to gas distributions we compare in the upper panel of Figure 3 the gas half mass radii, including all gas present in the galaxy, to stellar half mass radii at for all galaxies in Flares with . From this, we can see that compact stellar distributions are associated with extended non-star forming gas distributions in most cases. These extended gas distributions can be as much as larger than the stellar component. We can now see the bi-modality in Figure 2 is due to massive galaxies which are not associated with extended gas distributions but instead have compact gas components comparable to their stellar component.
One possible explanation for the difference between the gas distributions of compact galaxies could be that the galaxies with compact gas distributions are newly formed, and are yet to accrete the extended gas distributions of their gas enshrouded brethren. In the lower panel of Figure 3 we probe this by colouring the hexbins by the mean age of galaxies in each hexbin, where we have defined a galaxy’s age as the initial stellar mass weighted average of stellar particle age. This shows no discernible difference between the age of galaxies with compact or extended gas distributions. We can therefore confidently throw out the accretion hypothesis.
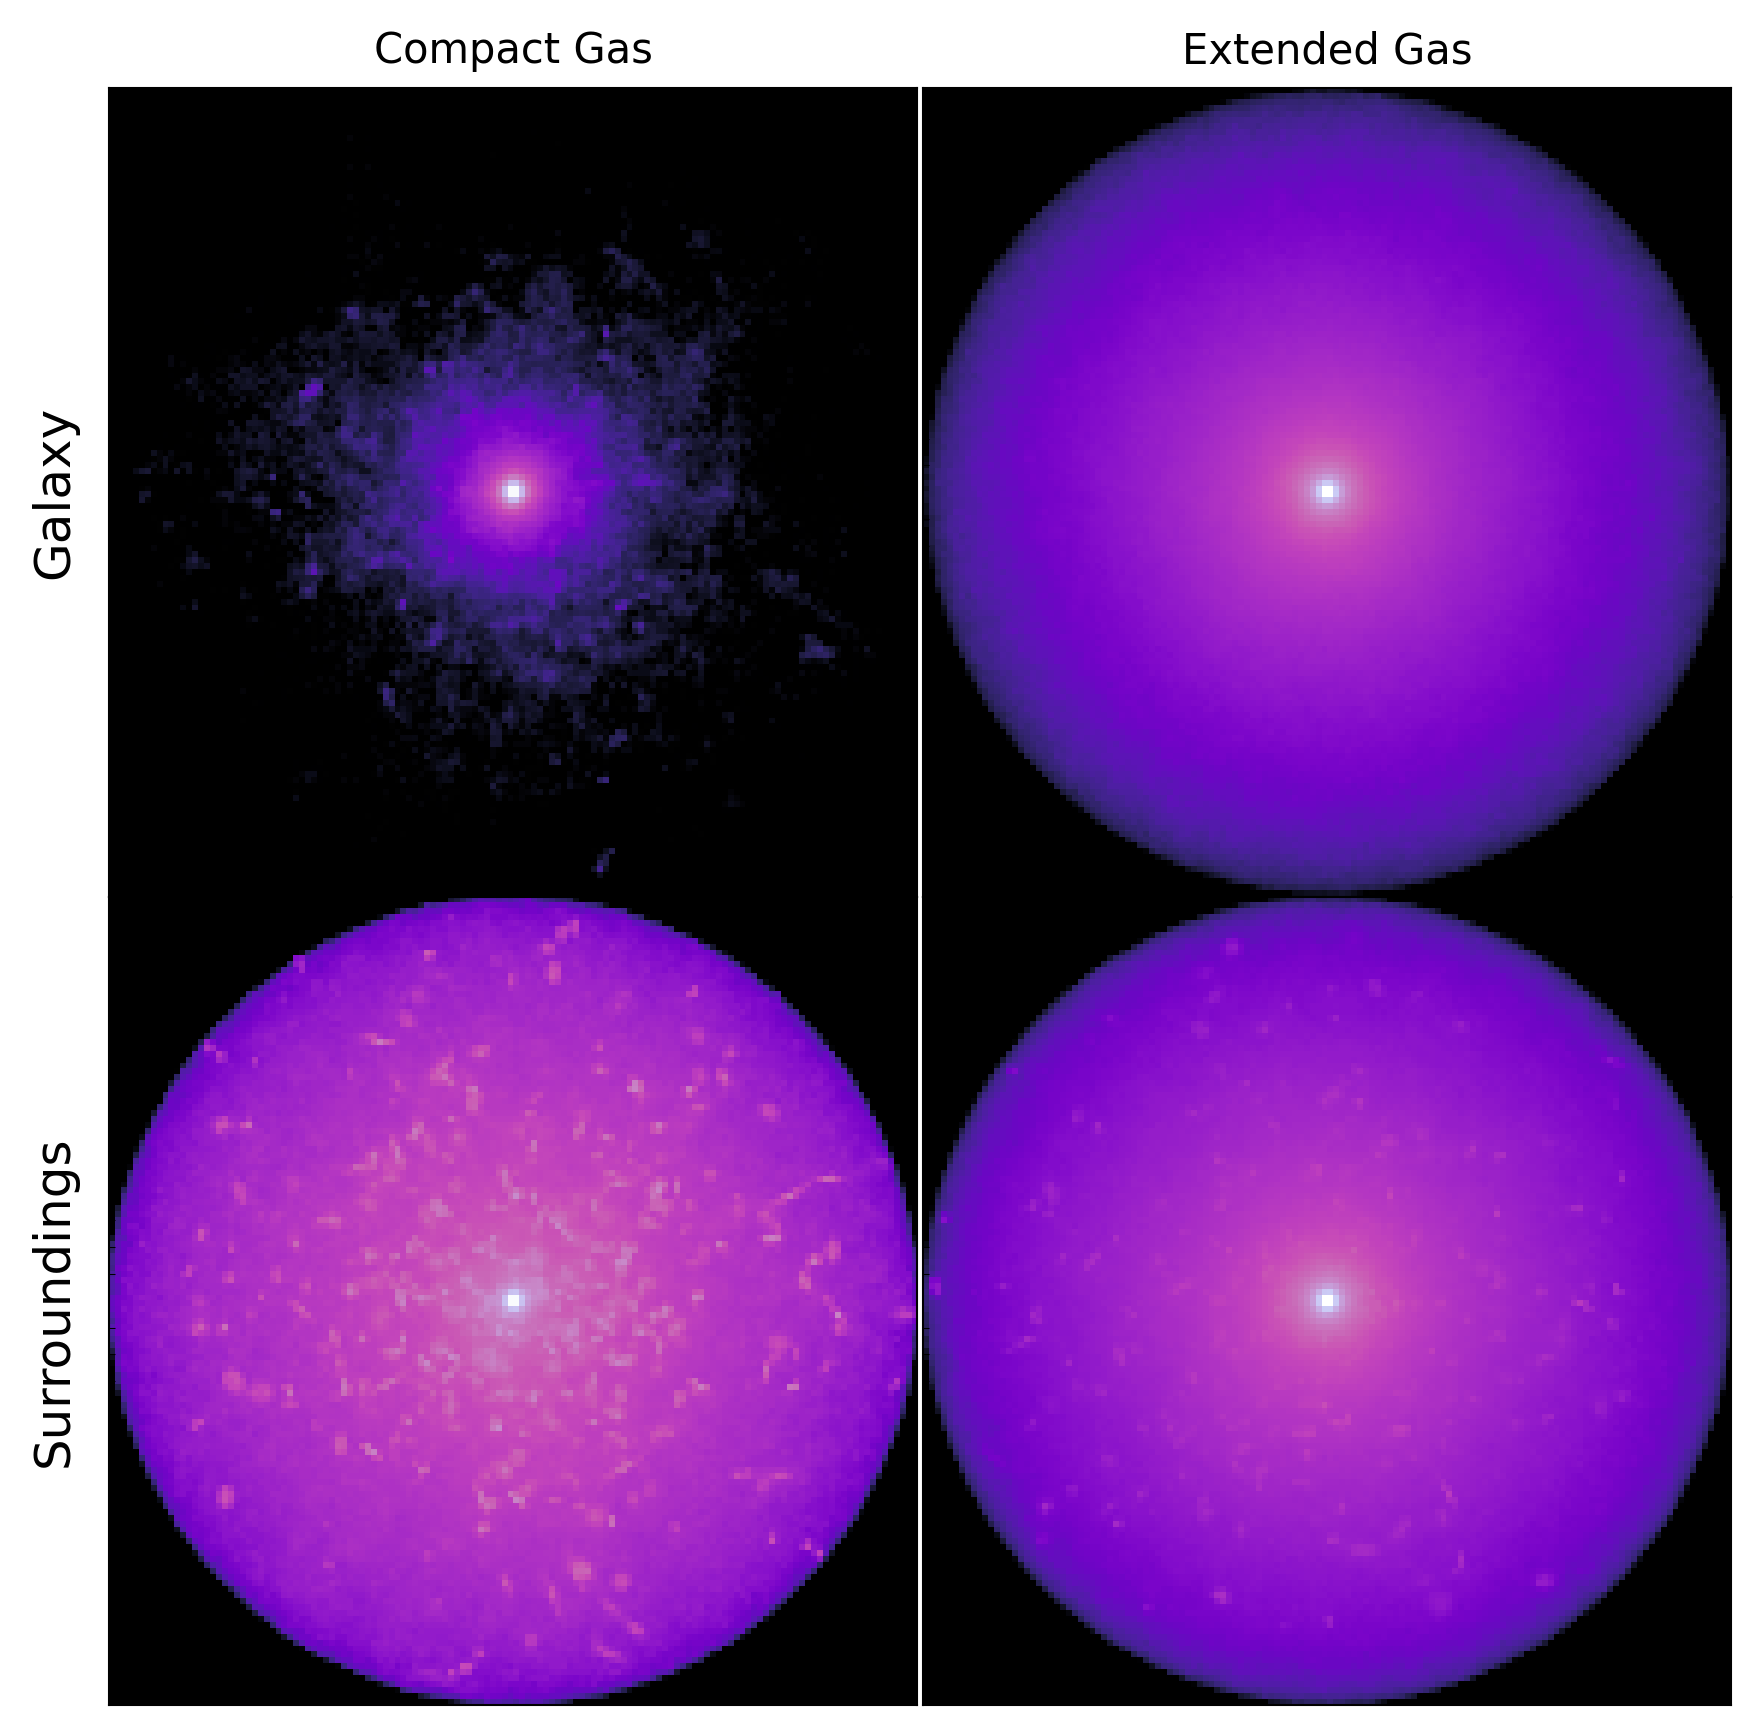
A possible numerical explanation for the split between compact and diffuse gas distributions is that the halo finder has erroneously split galaxies apart from the extended gas distributions surrounding them. To ascertain if this is the case we show stacked images of the gas distribution in Figure 4 split by gas half mass radius (left column: pkpc, right column: pkpc). Each panel has a width of 60 pkpc and a pixel resolution equal to the softening length of the simulation. The top row shows the difference between the compact and extended gas distributions as defined by SUBFIND, whereas the bottom row shows the stacks but includes all stellar particles within 30 pkpc of each galaxy’s centre (defined by the centre of potential). If the compact gas population were the result of a misidentification by the halo finder, we would expect to see similarly extended profiles in both panels in the bottom row. However, the compact gas distribution stack is noticeably less extended. So we can conclude this bi-modality is not the result of numerical effects in structure definition.
These compact stellar distributions associated with compact gas distributions are therefore legitimate structures. However, of the 425 galaxies with compact gas distributions, 418 are satellites, leaving only 7 central galaxies. These satellites have likely undergone tidal stripping and are unlikely to persist to low redshift in their current compact gas-poor form without undergoing mergers. It is worth noting that although the majority of compact gas distributions are associated with satellites, it is not true that the majority of satellites have compact gas distributions. On the other hand, the centrals with compact stellar and gas distributions will not be able to accrete gas and continue forming stars in the near future, and could lead to gas-poor passive compact sources in the future. These could be indicative of one possible evolution track that leads to the quiescent red nuggets seen in observations at lower redshifts (e.g. van Dokkum et al., 2008; Damjanov et al., 2009; Taylor et al., 2010).
4 Compact Galaxy Formation
In this section we probe the formation of massive compact galaxies in the Eagle model. We showed in Roper et al. (2022) that the compact galaxies driving the negative slope of the size-mass relation (see Figure 1) produce a positively sloped size-luminosity relation due to the effects of dust. This size-luminosity relation is in good agreement with observations. We now explore the mechanism driving the formation of these massive compact galaxies, and explore why they only exist above a certain stellar mass threshold ().
To probe the size and mass evolution of individual galaxies we employ the MErger Graph Algorithm (MEGA, Roper et al., 2020)111MEGA has been updated to construct merger graphs for hydrodynamical simulations, in addition to purely -body codes. It can also now use halos defined by other algorithms rather than those produced with its own phase space halo finder. Note, however, that merger graphs generated from other input halo catalogues will not benefit from the temporally motivated approach utilised in MEGA. to construct merger graphs from the SUBFIND halo catalogue. Throughout the following sections we define:
-
•
A progenitor of a galaxy as any galaxy in the previous snapshot which contributed at least 10 particles (of any type) to the galaxy.
-
•
The main progenitor as that which contributed the most particles (of any type) to the galaxy.
-
•
The main branch as the chain of main progenitors starting with a galaxy and ending with it’s earliest main progenitor.
-
•
The root as the first galaxy in the main branch at .
For the purposes of graph construction, all SUBFIND halos are included down to a particle count of 20, unlike the sample used to probe morphological quantities which is limited to those with . Throughout all subsequent plots, all galaxies considered in snapshot B obey the threshold but progenitors are presented without applying any limit. It is worth noting that the cadence of Flares snapshots is sub-optimal for merger graph construction. However, this does not affect the robustness of main branch definitions and only poses a problem if the merger graphs were to be used for semi-analytical modelling or assessing the impact of mergers.
4.1 Evolution across the size-mass relation
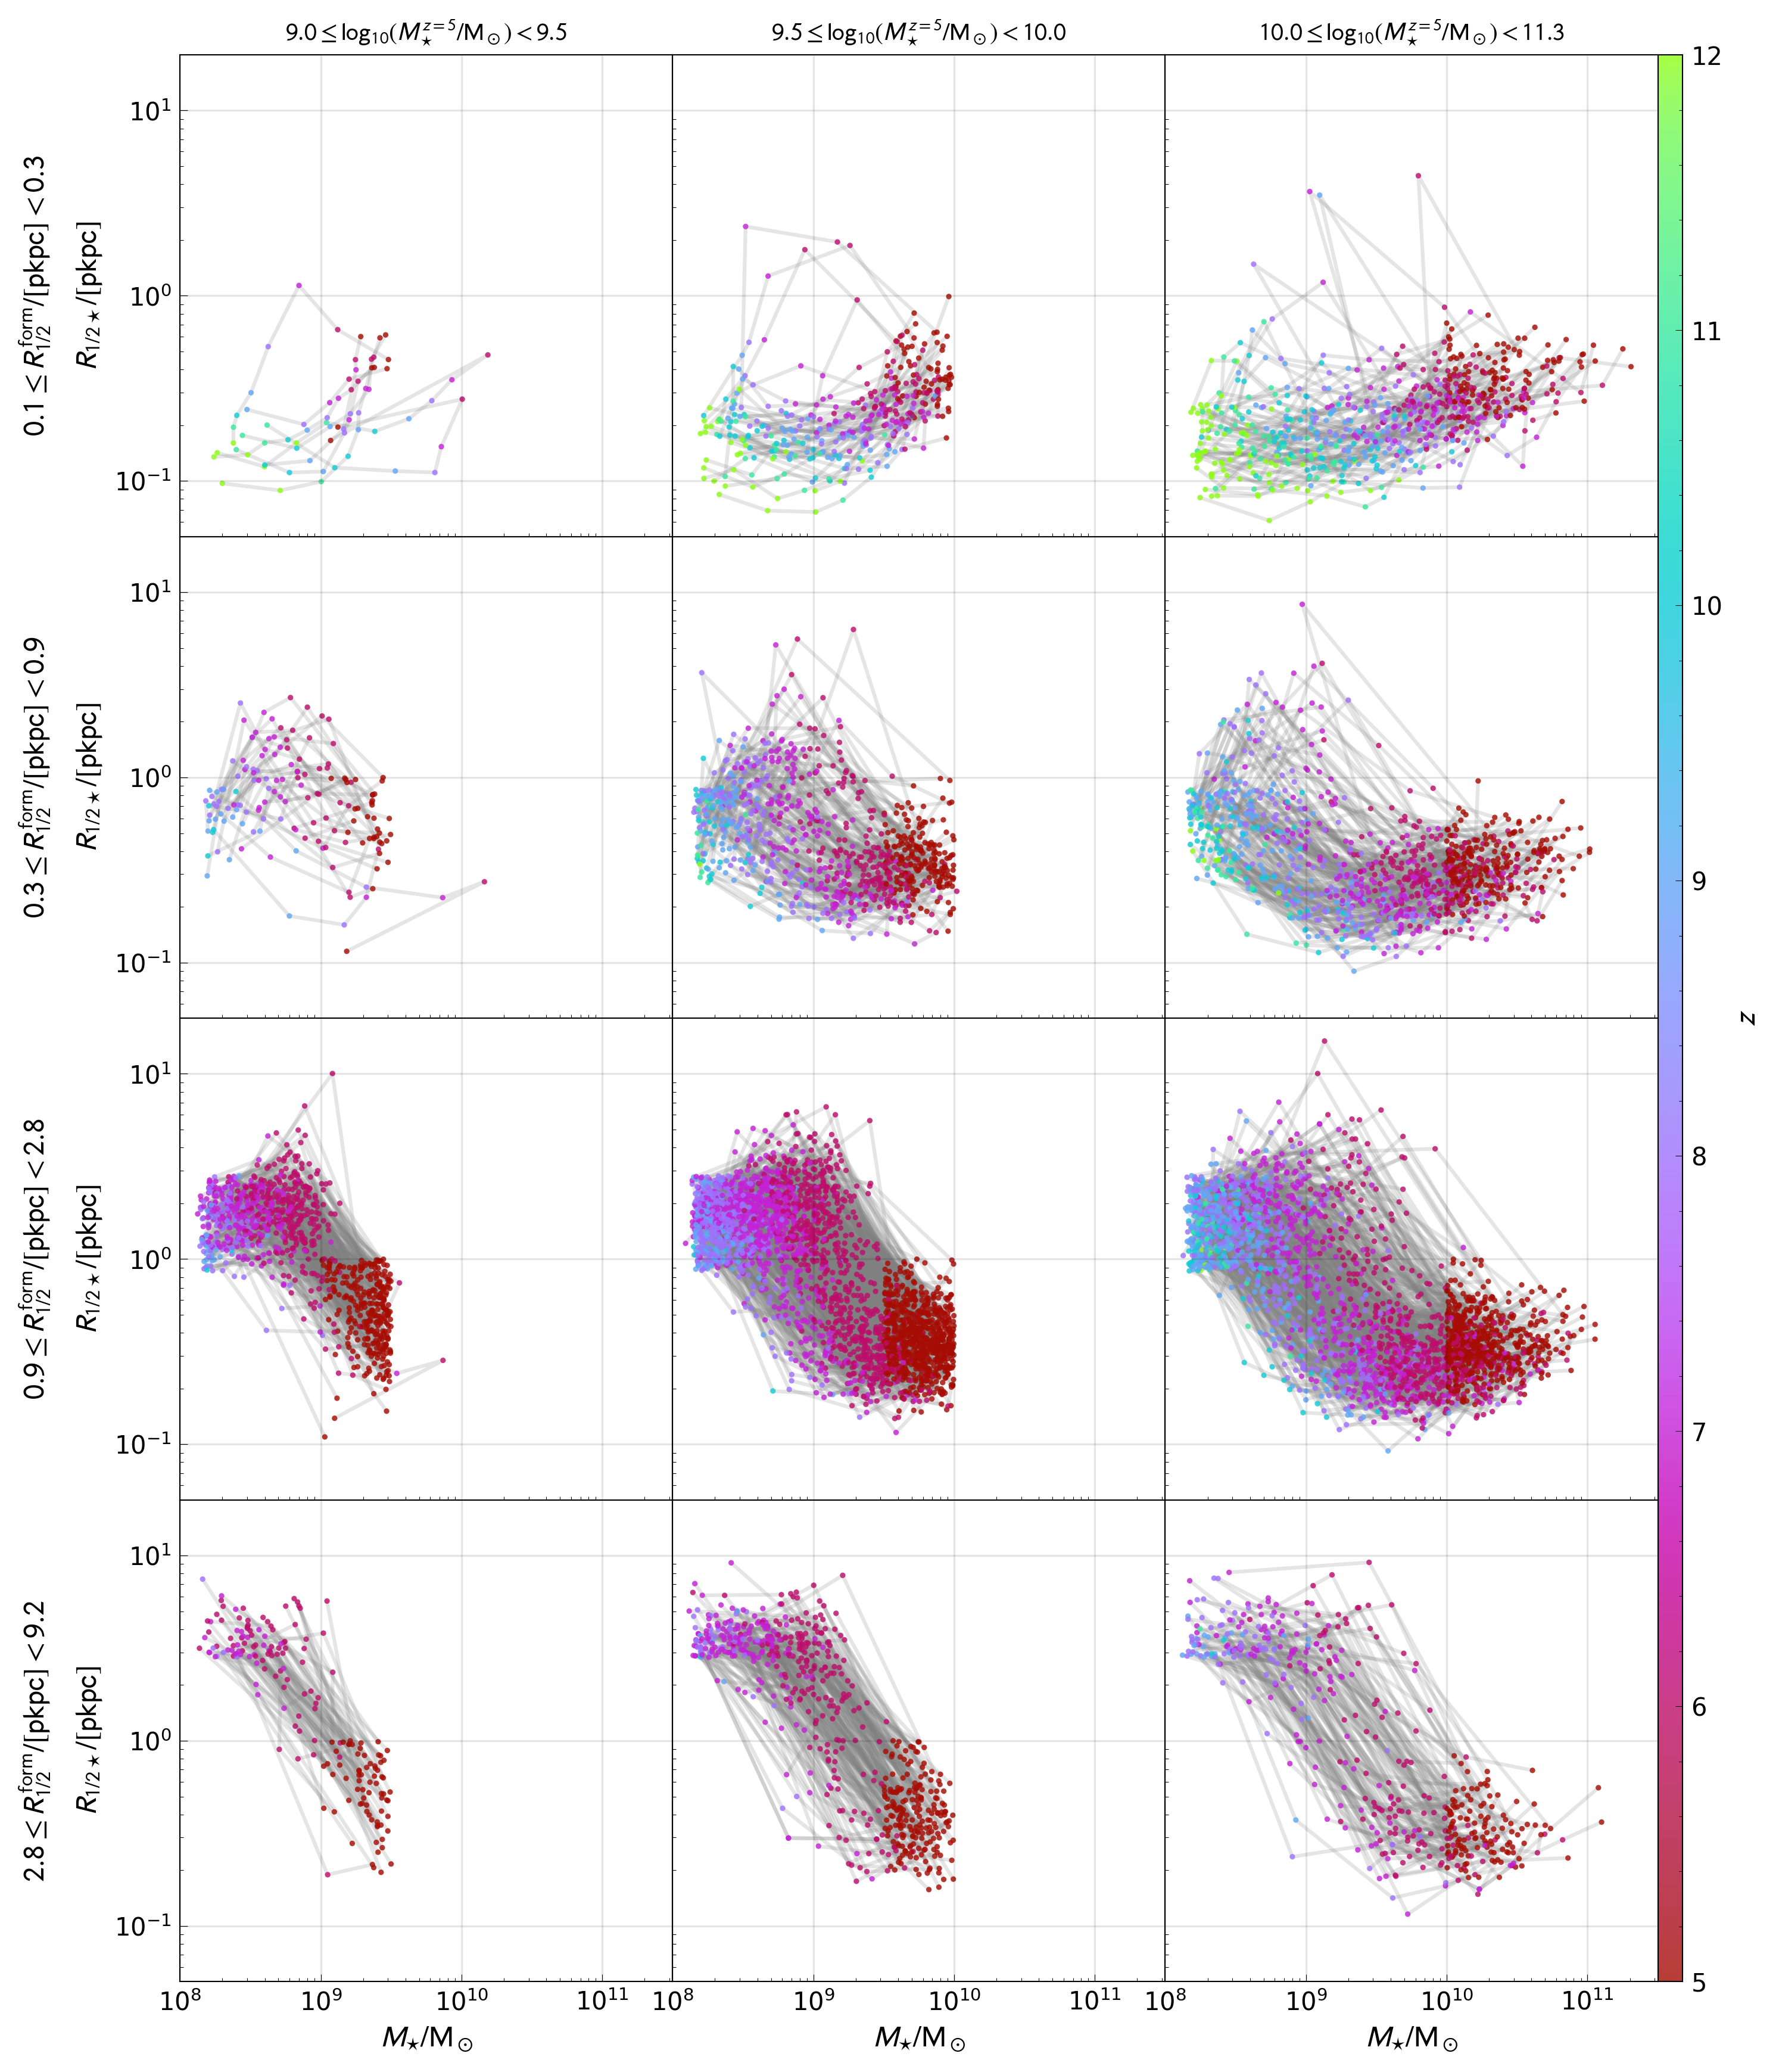
To identify the evolution of galaxies causing the bi-modality in the size-mass relation (Figure 1) we present the evolution across the size-mass relation of galaxies with stellar half mass radii pkpc at in Figure 5. To do so we plot each individual main branch for these galaxies rooted at , splitting into initial size and final mass bins to aid interpretation. These main branches yield two evolution paths for compact galaxies at .
In the first formation path, all progenitors along the main branch are compact including their earliest low mass progenitor. Although these galaxies remain compact throughout their evolution, they exhibit a positive size evolution. We denote this formation path the compact formation path.
In the second, more dominant formation path, galaxies begin as diffuse low mass galaxies which then decrease in size between adjacent snapshots. We denote this formation path the diffuse formation path. From this, we can conclude that in reality, both the formation scenarios proposed in Section 3 are applicable, but each is applicable in different redshift regimes.
The population with compact formation paths are galaxies forming at the earliest times (). Gas at these redshifts has undergone minimal enrichment requiring a higher density threshold to form stellar particles (see Section 2.1.2). The higher density threshold leads to star formation delayed until gas has collapsed further, yielding concentrated starbursts and thus initial compact stellar half mass radii.
Once the gas distribution has been sufficiently enriched star formation can proceed at lower densities, giving rise to galaxies with the diffuse formation path. These galaxies enter the catalogue at as diffuse systems before undergoing a mechanism causing a decrease in size, yielding a compact galaxy. Compact galaxies in the lowest final mass bin (left hand column) undergo this transition between and . Those in the higher final mass bins become compact at earlier redshifts, with many in the highest mass bin (right hand column) exhibiting a positive size evolution after joining the compact distribution. This relation between final mass and transition redshift shows that not only is this an ongoing process at but also that the size transition takes place in a particular stellar mass regime. Once compact these galaxies continue to form stellar mass and increase in size as they do so.
In Figure 5 there are a small number of outliers with pathological increases in size and in some cases decreases in stellar mass, such as those in the top right panel with half mass radii pkpc. These are examples of structure finding issues discussed in detail in Srisawat et al. (2013). In cases such as these interacting galaxies have either been temporarily amalgamated leading to increased sizes and masses or mass associated with a galaxy has been temporarily misassigned to a neighbouring galaxy.
4.2 Changes in size
The diffuse formation path in Figure 5 contains a transition between the diffuse and compact regimes evident in the size-mass relation shown in Figure 1. This transition is governed by a mechanism taking place at a particular stellar mass. In this section we investigate the mechanism driving this transition from diffuse stellar components to compact stellar components.
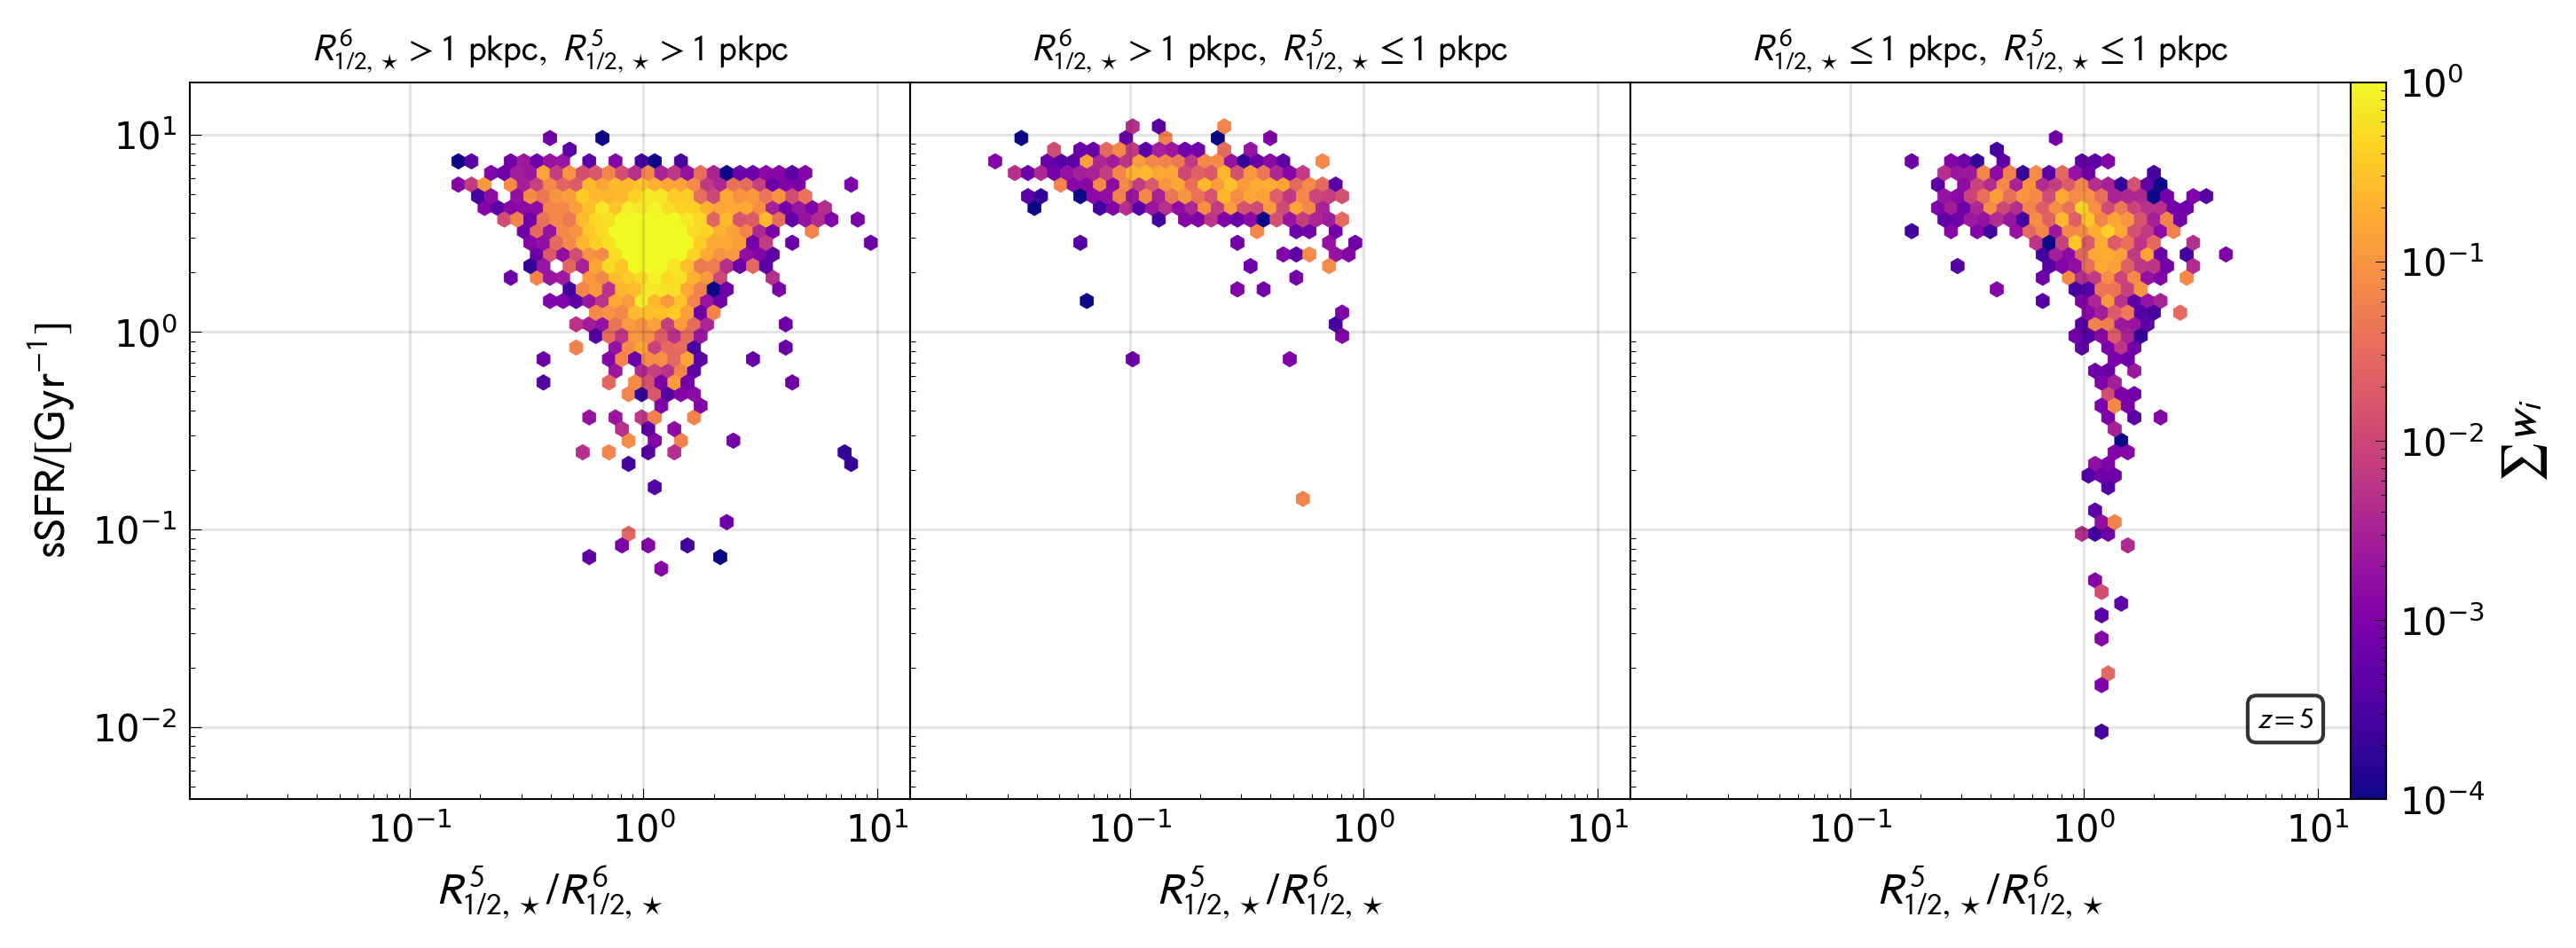
In Figure 6 we show the specific star formation rate (sSFR) of galaxies at as a function of the change in stellar size between and , defined as a ratio between a galaxy’s size and their main progenitor’s size at . We define the sSFR using all stellar particles formed within 100 Myr in a 30 pkpc aperture. A size ratio suggests a galaxy has increased in size while a size ratio suggests a galaxy has decreased in size.
We can see that galaxies which were diffuse at and remain diffuse at (left hand panel) have no clear trend between their sSFR and change in size. Galaxies which remain compact between and (right hand panel) show both decreases () and increases () in size, the majority of the latter have lower sSFRs than the former. In contrast, galaxies which transition from diffuse to compact (central panel) are highly star forming with a subtle negative trend between sSFR and . The tail of passive galaxies (sSFR ) exhibit small increases in size (). This size increase is likely due to stellar migration, where stellar particles move into larger orbits, as found at low redshift in Furlong et al. (2017). These passive galaxies are explored in detail in Lovell et al. (2022).
All galaxies undergoing the transition between diffuse and compact regimes have high sSFRs, while galaxies not undergoing this transition can exhibit a range of behaviours. From this we can conclude that the mechanism driving this transition is centrally concentrated star formation rather than stellar migration.
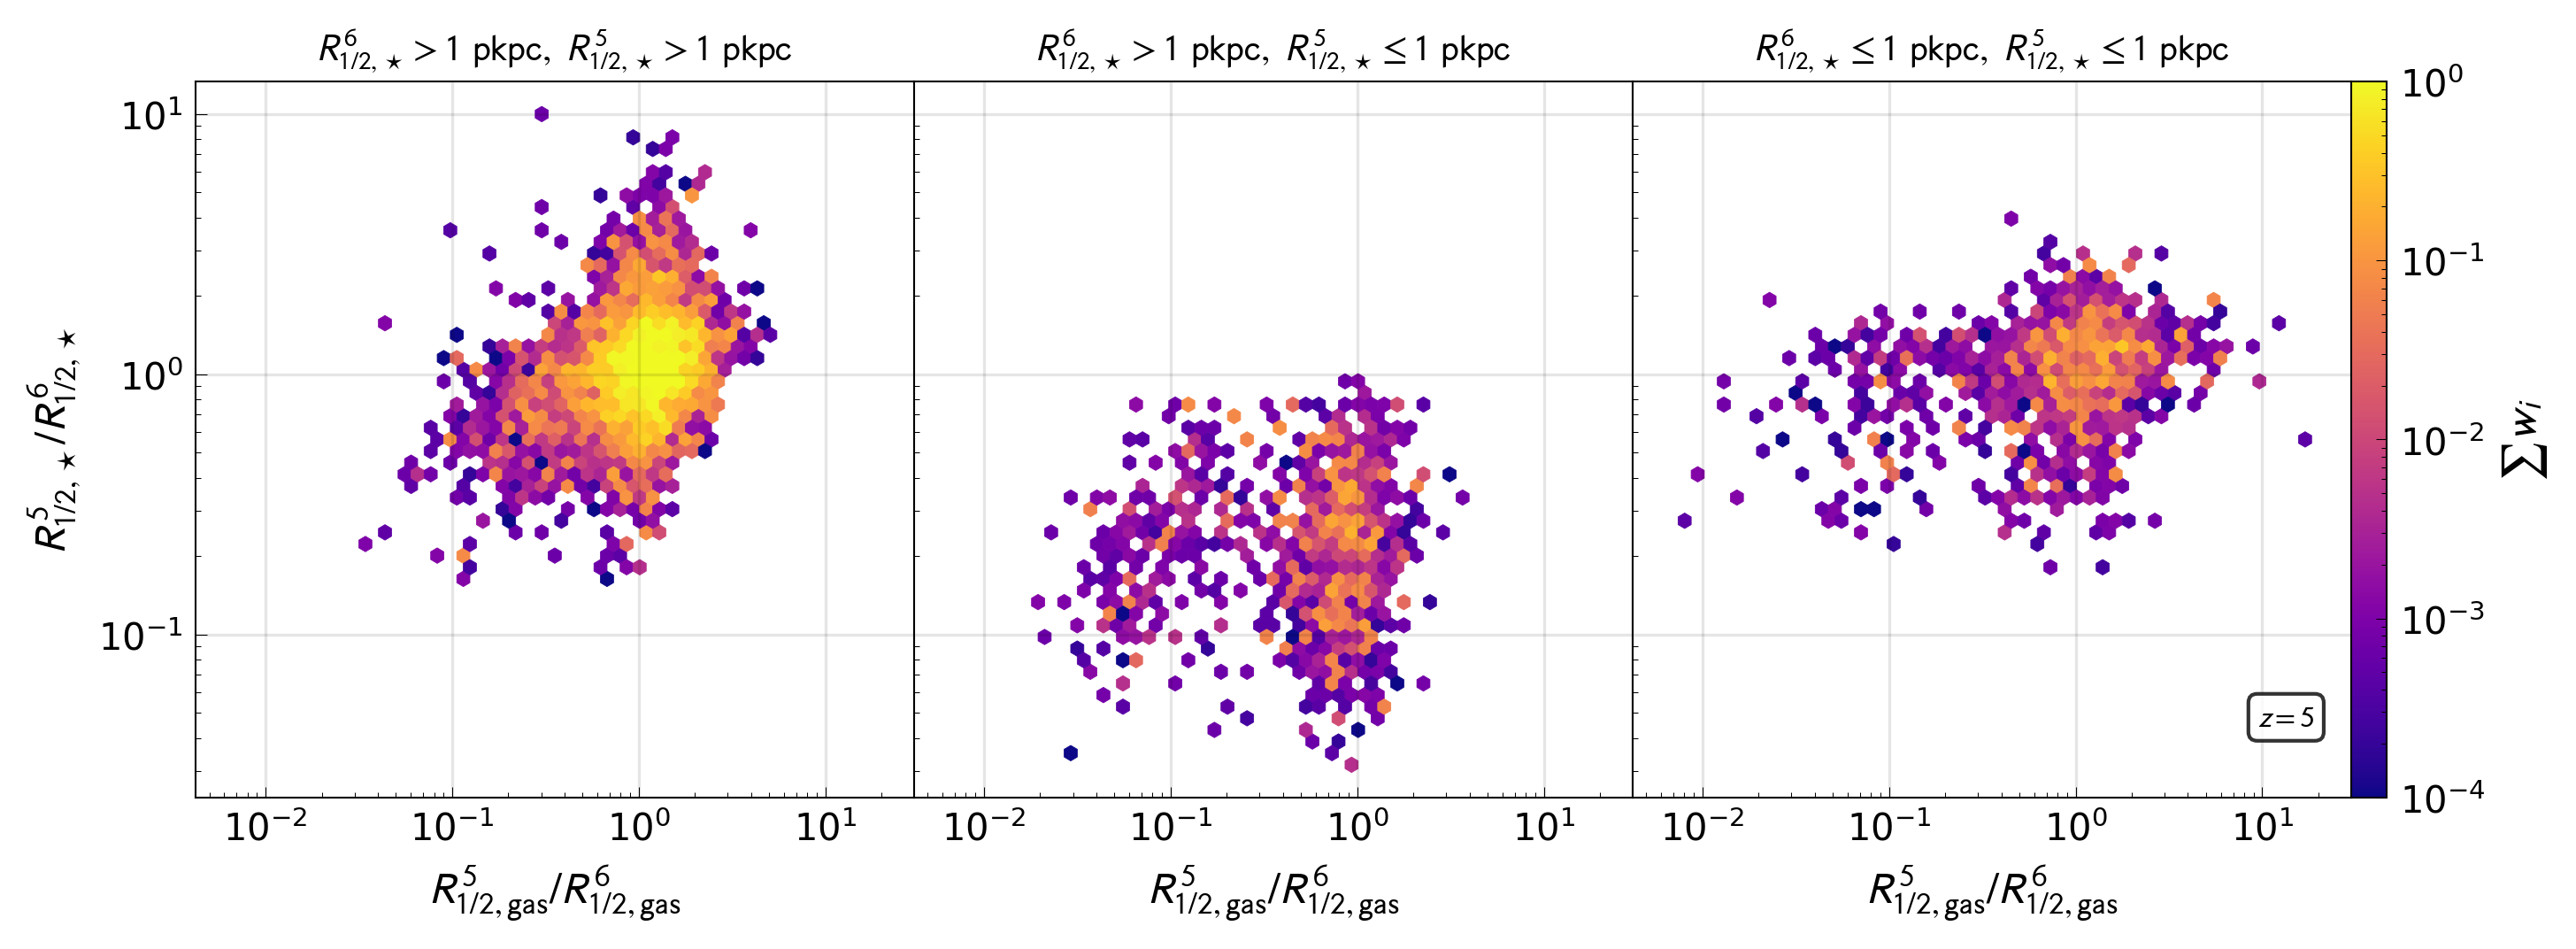
We now probe the changes in the gas distribution in Figure 7. This shows the change in stellar half mass radius vs the change in gas half mass radius at . In each panel, we see little correlation between the change in stellar size and the change in gas size. A small number of galaxies’ gas distributions shrink by a factor of , but these galaxies show no trends in change in stellar size. These shrinking gas distributions are those associated with the compact stellar distributions in Figure 3, explicitly showing the change in gas half mass radius due to tidal stripping of the satellites in that population (as discussed in Section 3.2). There is a subset of diffuse galaxies that remain diffuse (left hand panel) where a decrease in size of the stellar component is accompanied by a decrease in size of the gas component, this is driven by gas cooling leading to collapsing gas clouds and thus concentrated star formation causing a decrease in stellar size (we present more on this in Section 4.4).
The lack of gas half mass radius change in Figure 7 should come as no surprise given the extended nature of gas distributions detailed in Figure 3. The vast majority of the gas distributions are spatially distinct from the regions of compact star formation and are thus unaffected by the energy injected by stellar feedback.
4.2.1 The role of stellar feedback
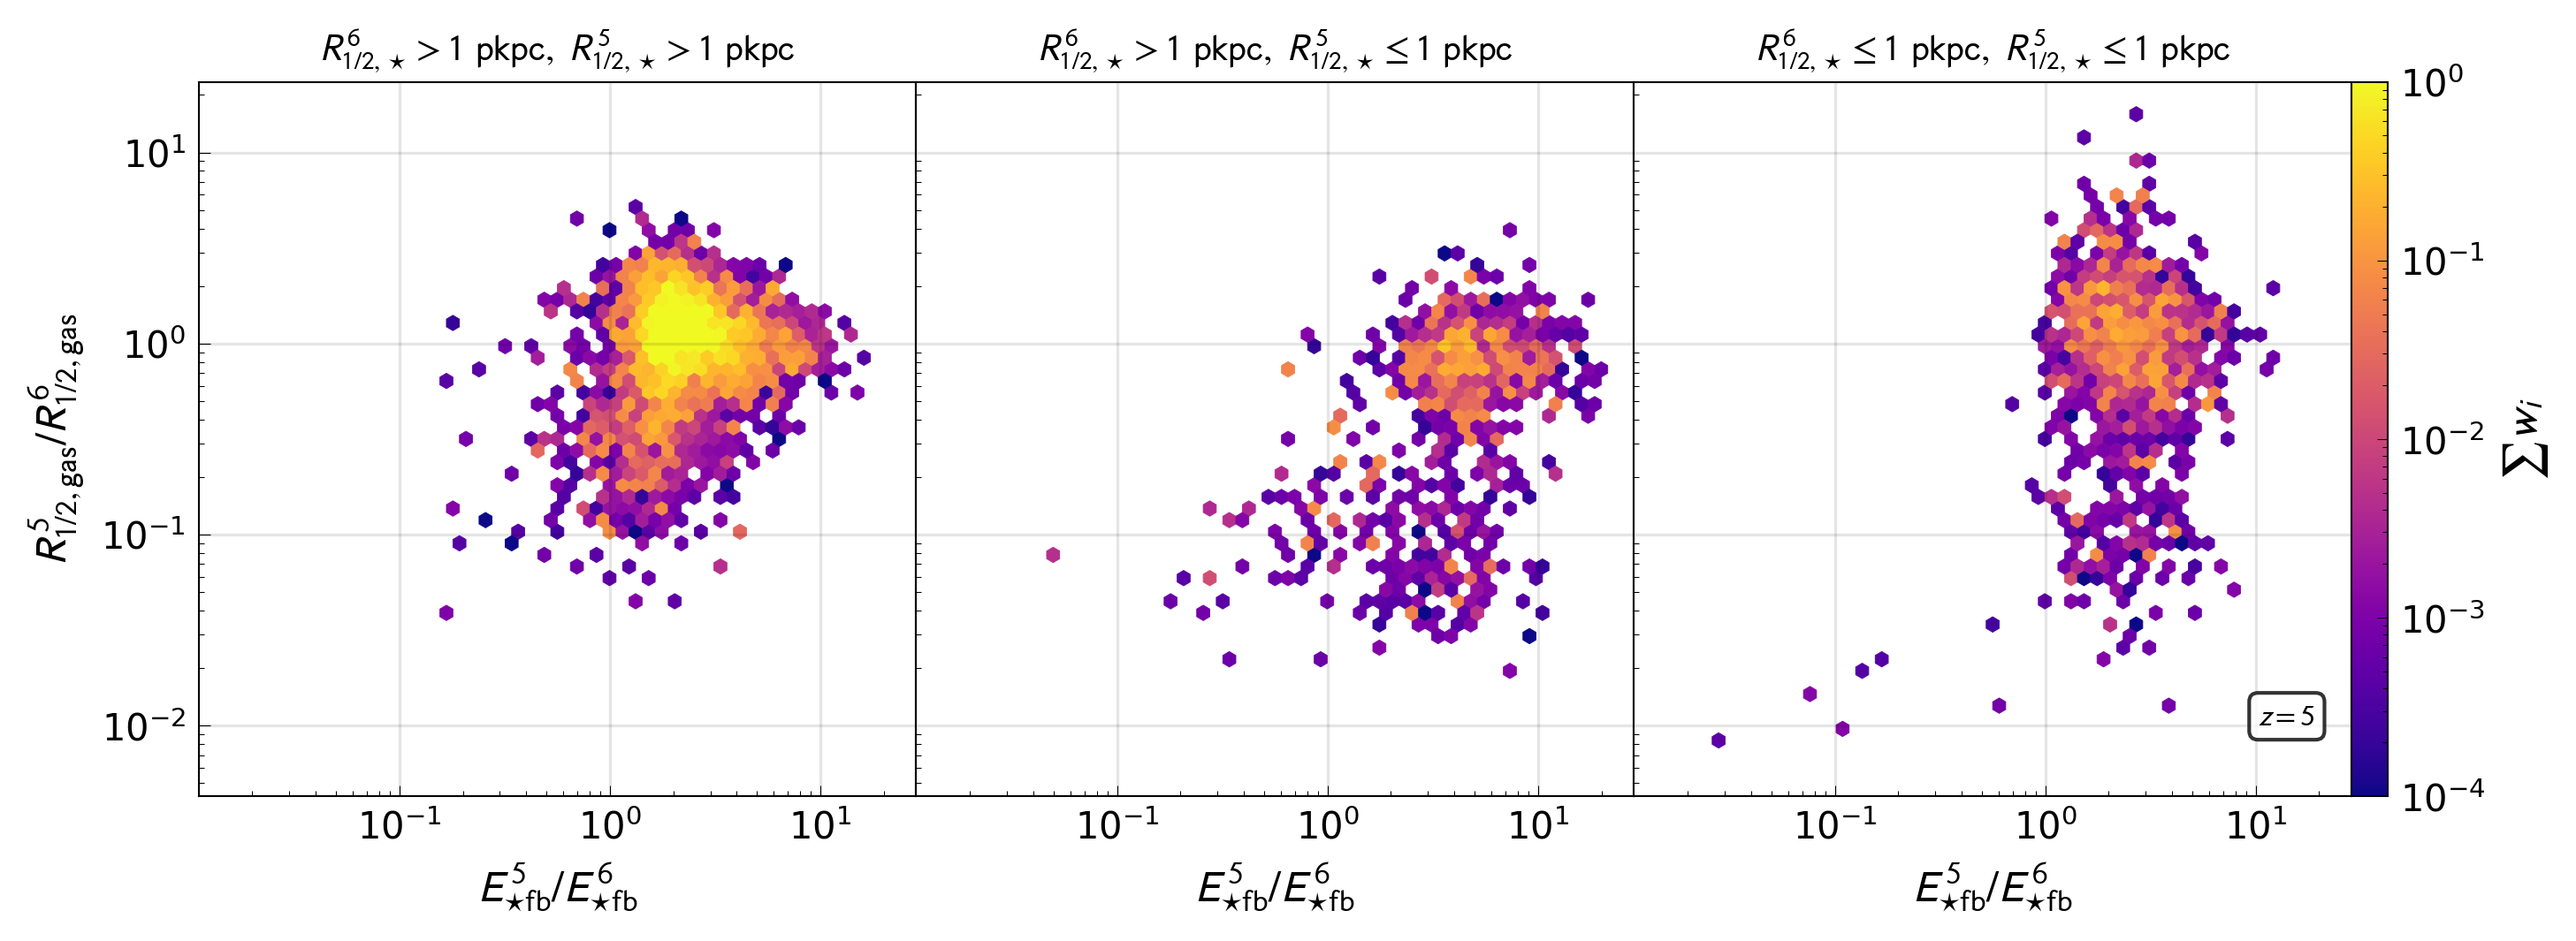
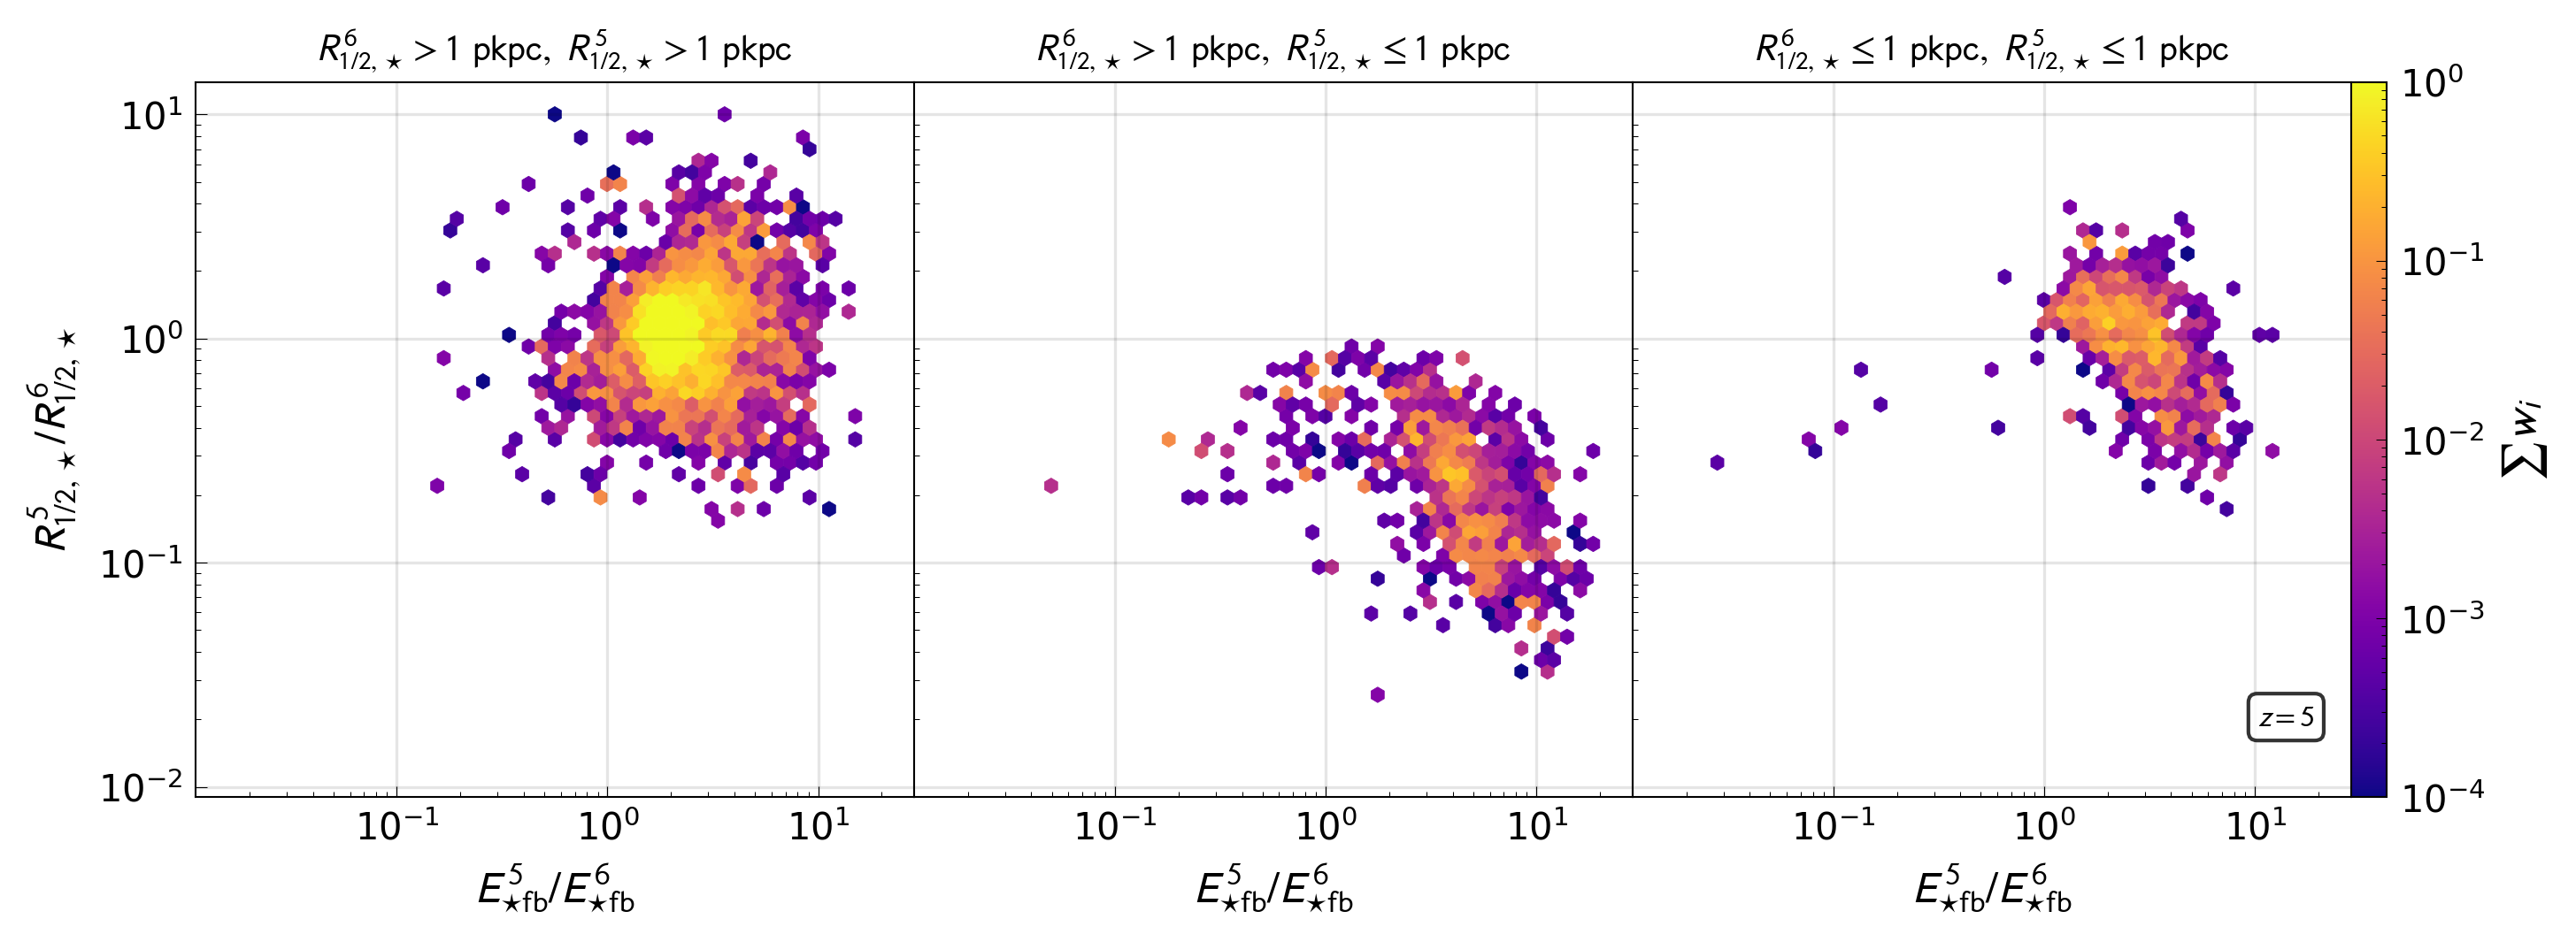
It was shown in Crain et al. (2015) that stellar feedback in the Eagle model is inefficient at high redshift, leading to high sSFR rates in regions of high density. However, the large localised SFRs necessary to transition from the diffuse regime to the compact regime shown in Figure 6 will dump disproportionate amounts of thermal energy into their dense surroundings. Here we probe the effect of stellar feedback during the size transition process and thus further probe the efficiency of stellar feedback in this regime.
In Figure 8 we show the effect of stellar feedback on both the stellar distributions and gas distributions. Here we plot the change in half mass radius as a function of the change in integrated stellar feedback energy between compact galaxies at and their progenitors at . We define the integrated stellar feedback energy following Davies et al. (2020) (Eq. 4 therein) as
| (3) |
where is the initial mass of a stellar particle and is the feedback fraction of individual stellar particles given by Equation 2. We obtain the integrated stellar feedback energy by summing over the contribution of all stellar particles in a galaxy within a 30 pkpc aperture. Note that, given this definition, the ratio can be less than unity if stellar particles are lost between and . Instances where are either due to galaxy interactions or misidentification by the halo finder.
The upper row of Figure 8 clearly shows little correlation between the change in integrated stellar feedback and the change in gas half mass radius. This is due to the aforementioned extent of the gas distribution showing that the effects of stellar feedback remain localised in the core and have no effect on the greater distribution. However, the same is not true for the stellar distribution. In the lower row of Figure 8 we present the change in stellar half mass radius as a function of the change in integrated stellar feedback. In the central panel, containing galaxies undergoing the size transition, we find a clear trend where larger increases in yield larger decreases in stellar half mass radius. For galaxies remaining compact (right hand panel) we find a shallower trend at larger change in size ratios with significant scatter at fixed feedback energy ratio. Notably, even in extreme cases the amount of stellar feedback is still too inefficient to be capable of slowing down star formation.
The galaxies which remain diffuse (left hand panel) exhibit no trend between change in size and integrated stellar feedback. In this regime not only are fewer stars forming, and therefore fewer stellar feedback events, but the gas is also significantly less dense yielding a lower . It is therefore unsurprising we see no trend in this regime.
4.3 Dynamical effects
Given the mechanism controlling the formation of compact galaxies detailed in the previous section, we now probe the dynamics and attempt to determine why the compact to diffuse transition takes place at . To do so, we define the total binding energy of a galaxy as
| (4) |
where is the gravitational constant, are the masses of particles and , is the distance between particles and , and is the softening of the simulation in physical coordinates. We calculate this quantity including all particle species identified to be part of a galaxy.
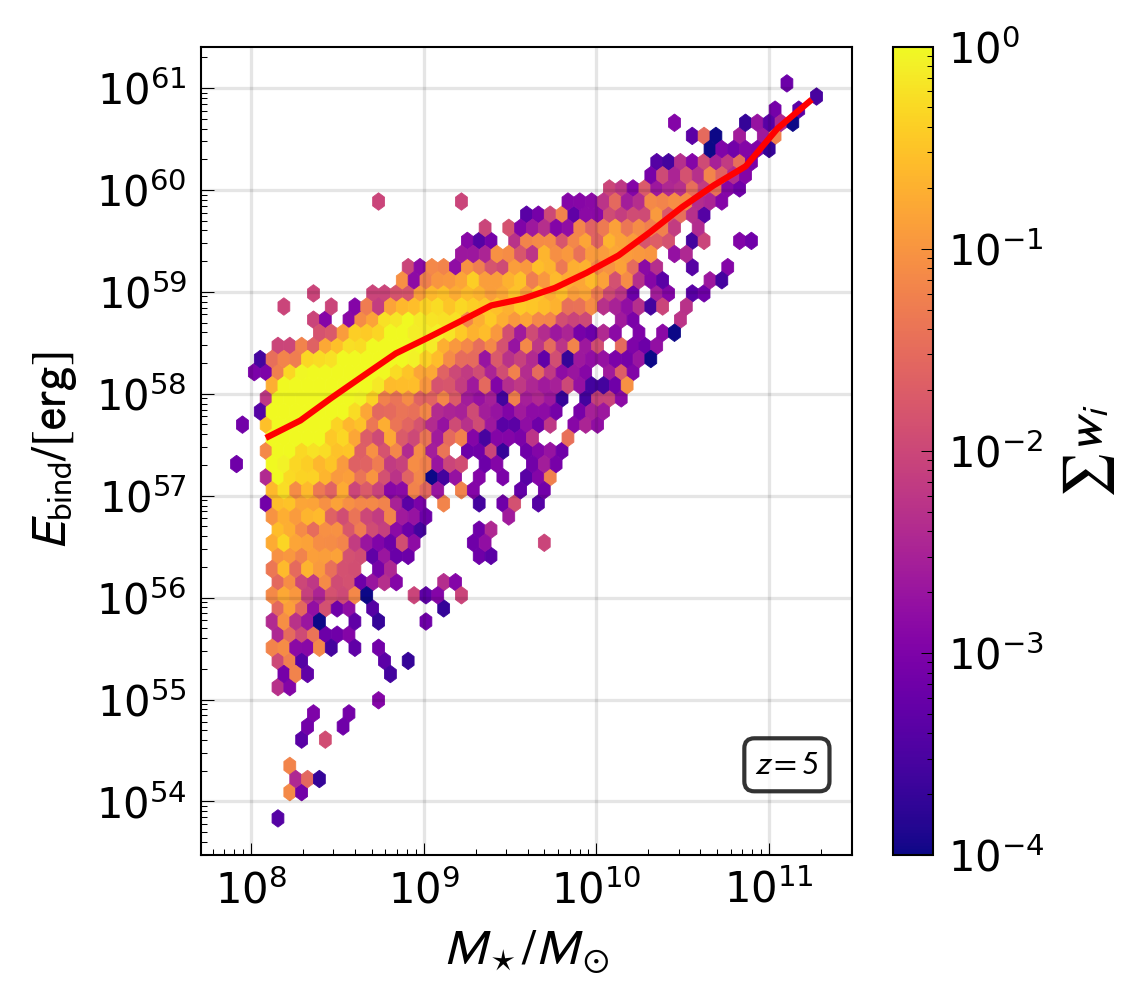
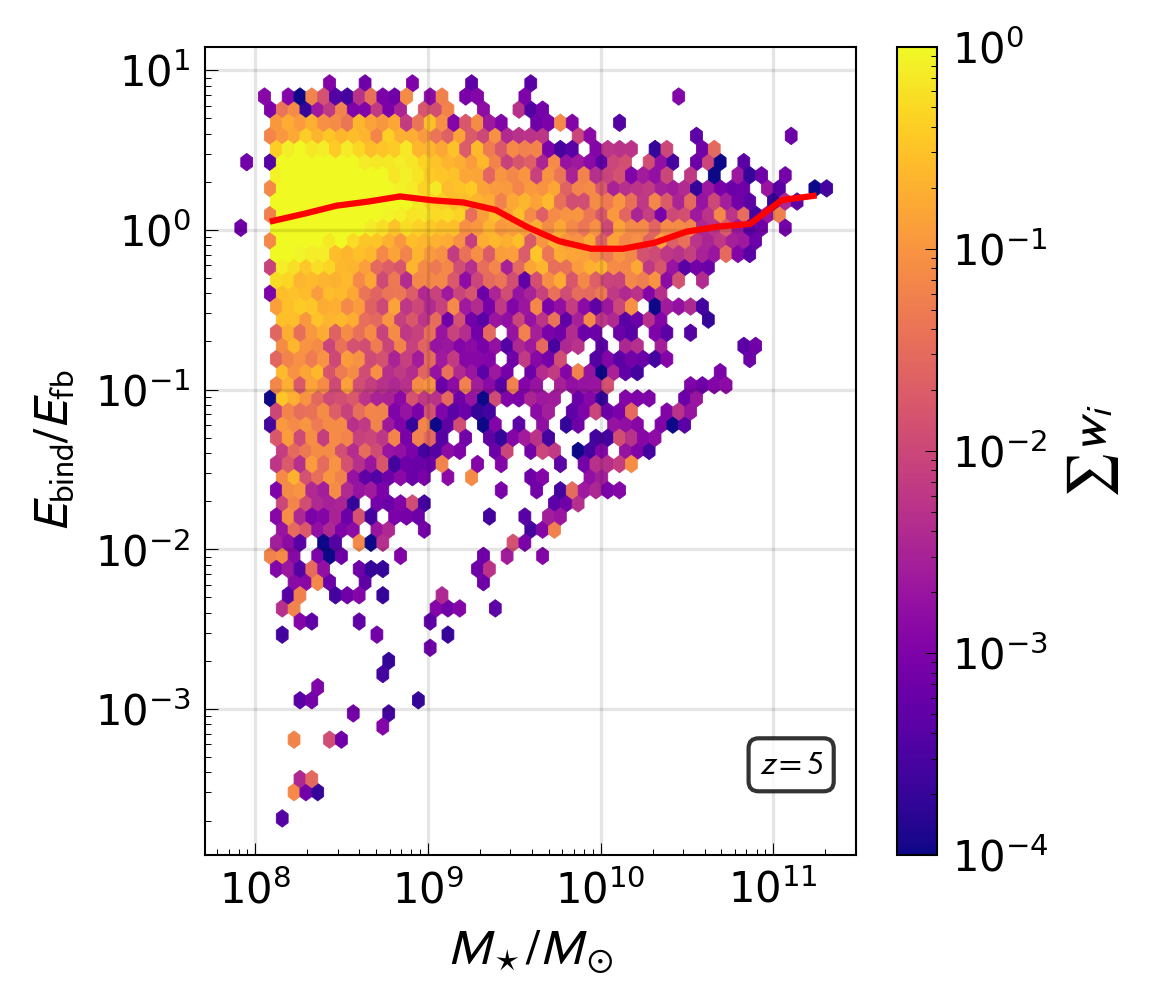
In the upper panel of Figure 9 we present the stellar mass dependence of the total binding energy (Equation 4). There is a clear positive linear relation between total binding energy and stellar mass with a large scatter at low masses which decreases with increasing stellar mass. The binding energy for the massive galaxies at which we see the compact transition () exhibits a small drop away from the linear trend of the lower mass galaxies. This can be attributed to the effects of stellar feedback in these highly star forming galaxies. Although stellar feedback is too inefficient and localised to strongly affect the morphology of a galaxy it nonetheless affects the gas distribution in the region where gravitational attraction between particles is greatest, and thus where the total binding energy is most sensitive to effects on the gas distribution.
We further investigate the interplay between total binding energy and stellar feedback in the lower panel of Figure 9, which shows the ratio between total binding energy and integrated stellar feedback (detailed in Section 4.2.1) as a function of stellar mass. Here we can explicitly see the drop in total binding energy relative to integrated stellar feedback for the highly star forming compact galaxies with . Note that these galaxies are nonetheless bound, as the injected thermal energy from stellar feedback is radiated away by the efficient cooling in star forming regions on short enough timescales.
From Figure 9 we can see no obvious features in the overall dynamics of the entire galaxy that enable the efficient localised star formation that drives the compactification of galaxies at . We can thus conclude that this transition is not a dynamical mechanism affecting both baryonic and dark matter components of a galaxy.
4.4 Cooling radii
To find the cause of the mass threshold at which the size transition takes place we need to probe the behaviour and distribution of star forming gas particles. To do this we employ a ‘cooling radius’ (). We define a ‘cooling radius’ of a galaxy as the gas half mass radius weighted by gas density. This is effectively a measure of the size of the star forming gas distribution. We use this definition to account for variations in density within star forming regions and take into account gas particles which soon will be star forming.
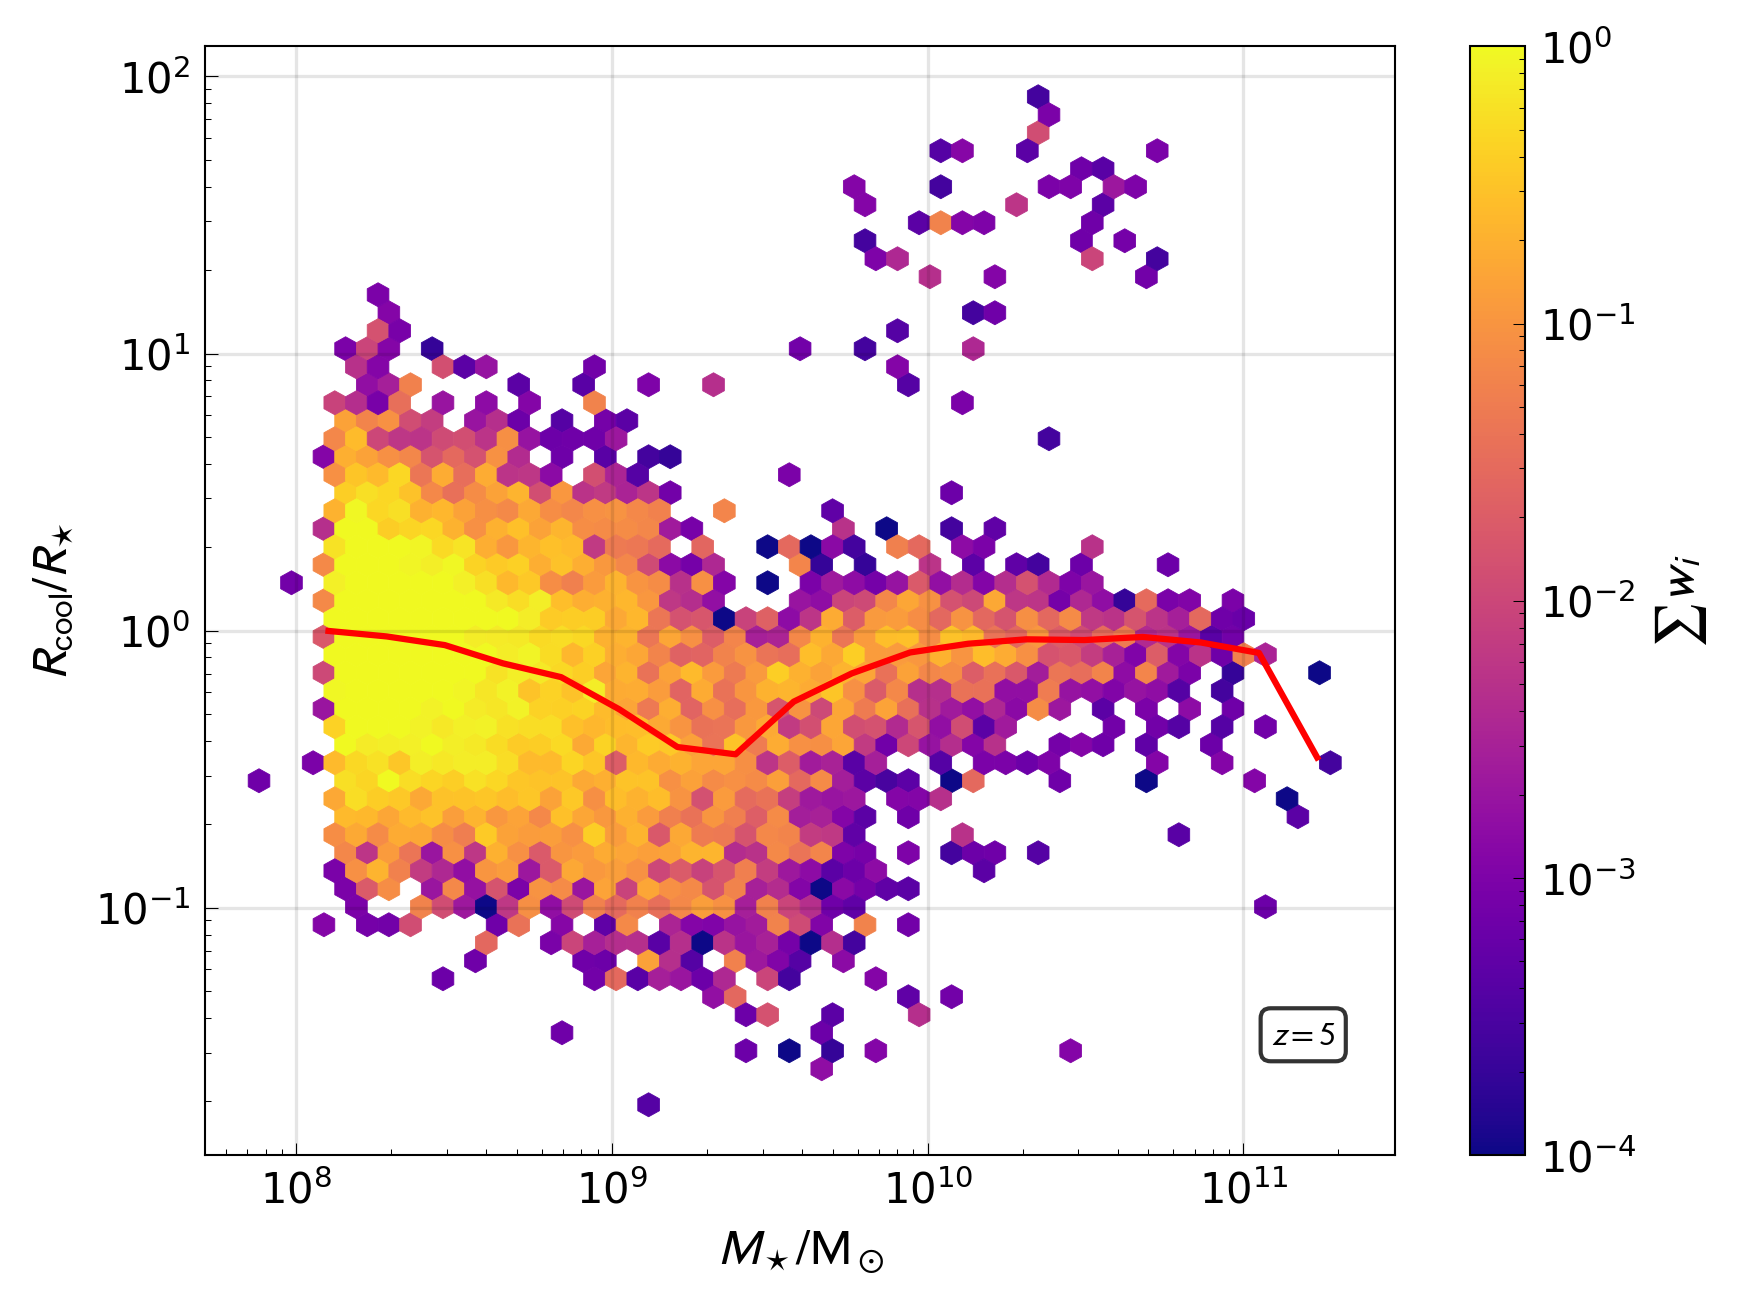
We present the ratio between cooling radii and stellar half mass radii in Figure 10. Here we see a number of features of note. Firstly, there is a low mass distribution ( M⊙) with a large scatter centred on a ratio of unity; these are the diffuse clumpy systems prevalent at low stellar masses that are not undergoing a transition in size. There is then a second distribution of galaxies with stellar masses in the range MM with a negative relation between the ratio of cooling radius and stellar half mass radius; these are galaxies where efficient localised cooling has begun, allowing gas to collapse to high densities below the size of the stellar distribution. Once collapsed to sufficient density these localised cool regions enable high sSFRs, which lead to the significant stellar mass growth associated with decreases in stellar size (Figure 6). These galaxies are the galaxies with decreasing gas and stellar sizes evident in Figure 7. Once enough stellar mass has been formed in the compact star forming gas distribution the gas and stellar size measurements become comparable and the ratio tends towards unity. This process has been completed for most galaxies by the time they reach stellar masses of M⊙.
These distributions are exemplified by the curve showing the 50th percentile. The trend starts at a ratio of unity at M⊙ and then exhibits a clear dip in the stellar mass regime dominated by galaxies undergoing the transition from diffuse to compact stellar distributions. The trend then returns to a ratio of unity for galaxies at stellar masses M⊙.
We can also see a number of outliers to this trend with and . These are massive galaxies with compact bulges, where regions of their extended gas distribution have begun collapsing, leading to the transition from compact to extended sources. We discuss this process in detail in Section 5.
The reason for the specific stellar mass at which we see the diffuse to compact transition is now clear: it is this mass at which gas is capable of cooling efficiently enough to form highly localised regions of sufficient sSFR to form compact stellar systems. We note that, although we cannot show the effects of resolution on this transition222The existing EAGLE high resolution simulation (denoted RECAL) is too small in volume (253 cMpc3) to form massive compact galaxies at high redshift., it takes place significantly above the mass resolution of the simulation and thus should be robust to resolution effects. The compact distributions are, however, near the spatial resolution of the simulation; this could place a lower bound on the sizes that are possible in Flares. The resolution of the underlying dark matter distribution could also lead to spurious collisional heating, leading to kinematic and morphological effects (e.g. Wilkinson et al., 2022). We will investigate the effects of resolution explicitly in Flares-2 with a subset of high resolution simulations using the SWIFT open-source simulation code (Schaller et al., 2018).
5 Compact Galaxy Evolution
In this section, we explore how galaxies evolve from compact systems at high redshift, with a negative size-mass relation, to the extended systems prevalent at the present day, with a positive size-mass relation.
5.1 Birth Property Evolution

Macroscopic changes in galaxy properties, such as size, are tracers of physical mechanisms taking place at much smaller scales within. Particularly those taking place in their cores at high redshift, as shown in Section 4. To probe the small scale physical mechanisms driving galaxy size evolution we present the stellar formation properties of all stellar particles in Flares333Note that Flares is biased towards regions of high overdensity in which the most massive galaxies form at . However, these massive galaxies are the subject of this investigation and thus the bias does not affect any conclusions. and Eagle AGNdT9 in Figure 11. Here we bin these stellar particles by the redshift of their formation to show the redshift evolution of the density and enrichment of star forming environments. The background of Figure 11 shows the feedback fraction (described in Section 2.1.3) for each combination of birth density and metallicity, while the dashed line shows the star formation threshold.
In the right hand panel of Figure 11 we can see the first stars to form in the simulation do so at low density and low metallicity (, ), with a small contribution by stellar particles forming in the earliest compact cores of massive galaxies at high metallicity and density (, ). These early cores have already started to cool and collapse at these redshifts, further aiding their enrichment, and creating a feedback loop of star formation and enrichment.
Between compact core star formation begins to dominate as the most massive galaxies begin to form their compact cores in earnest. Here, we see a shift from the low metallicity and density locus to one of high density and metallicity corresponding to the star formation taking place in massive galaxies’ compact cores. For stellar particles formed between , when the majority of compact galaxies undergo the transition from diffuse to compact, this high density and metallicity locus dominates with only a small contribution from lower densities. This tail of low density star formation has a tighter distribution in terms of metallicity, a reflection of the enrichment of the wider gas environment from previous star formation.
From to (two left hand panels of Figure 11) the locus of high density and metallicity star formation shifts to low density with a spread in metallicity from intermediate () to high values (). By this low density locus is well established, and has shifted to higher values of metallicity (). In this epoch, even gas in low density environments has been significantly enriched enough to enable star formation.
Recall Figure 3, where the majority of compact galaxies were shown to be enshrouded by extended non-star forming gas distributions. When combined with the evolution of stellar birth properties in Figure 11 we can see a clear correlation, where low density and low metallicity gas in the extended gas distributions around compact galaxies begins to form stellar particles after . This is enabled by the extended gas distributions not only reaching the required densities at a later epoch than the compact cores, but also due to sufficient mixing from the metal enriched core due to increases in AGN and stellar feedback efficiency. This is the onset of inside-out star formation as seen at lower redshift (Tacchella et al., 2015a, b; Nelson et al., 2016; Tacchella et al., 2018; Nelson et al., 2019; Wilman et al., 2020; Matharu et al., 2022), but beginning earlier than yet observed at .
Focusing on the location of the stellar birth property locus relative to the feedback fraction, , shown in the background of Figure 11, we can see that is maximal for the majority of high redshift star formation. Only at does the locus of star formation include densities and metallicities at which is not maximal. Despite this, we have shown in Section 4.2.1 that even the maximal feedback fraction in the fiducial Eagle model is incapable of affecting the wider surroundings at high redshift. We will investigate the effects of allowing larger feedback fractions in this regime in a future work that modifies the subgrid model.
5.2 Birth property dependence on large-scale environment
As the universe evolves, stellar particles enrich their local environment and stellar birth metallicity increases. One of the main strengths of the Flares approach is the high dynamic range of environments covered by the resimulations. Using this we can investigate the birth properties in specific large scale environments, defined by the overdensity of a region (overdensity smoothed over a spherical aperture with a radius of 15 cMpc h-1), and shed light on the onset of enrichment and local density in specific environments. In Figure 12 and Figure 13 we present the median redshift evolution of stellar birth metallicity and stellar birth density, respectively, for all stellar particles formed by in Flares and all stellar particles formed by for both Eagle REF and AGNdT9. The Flares sample is split into overdensity bins (environments). The Eagle samples are representative of mean overdensity environments.
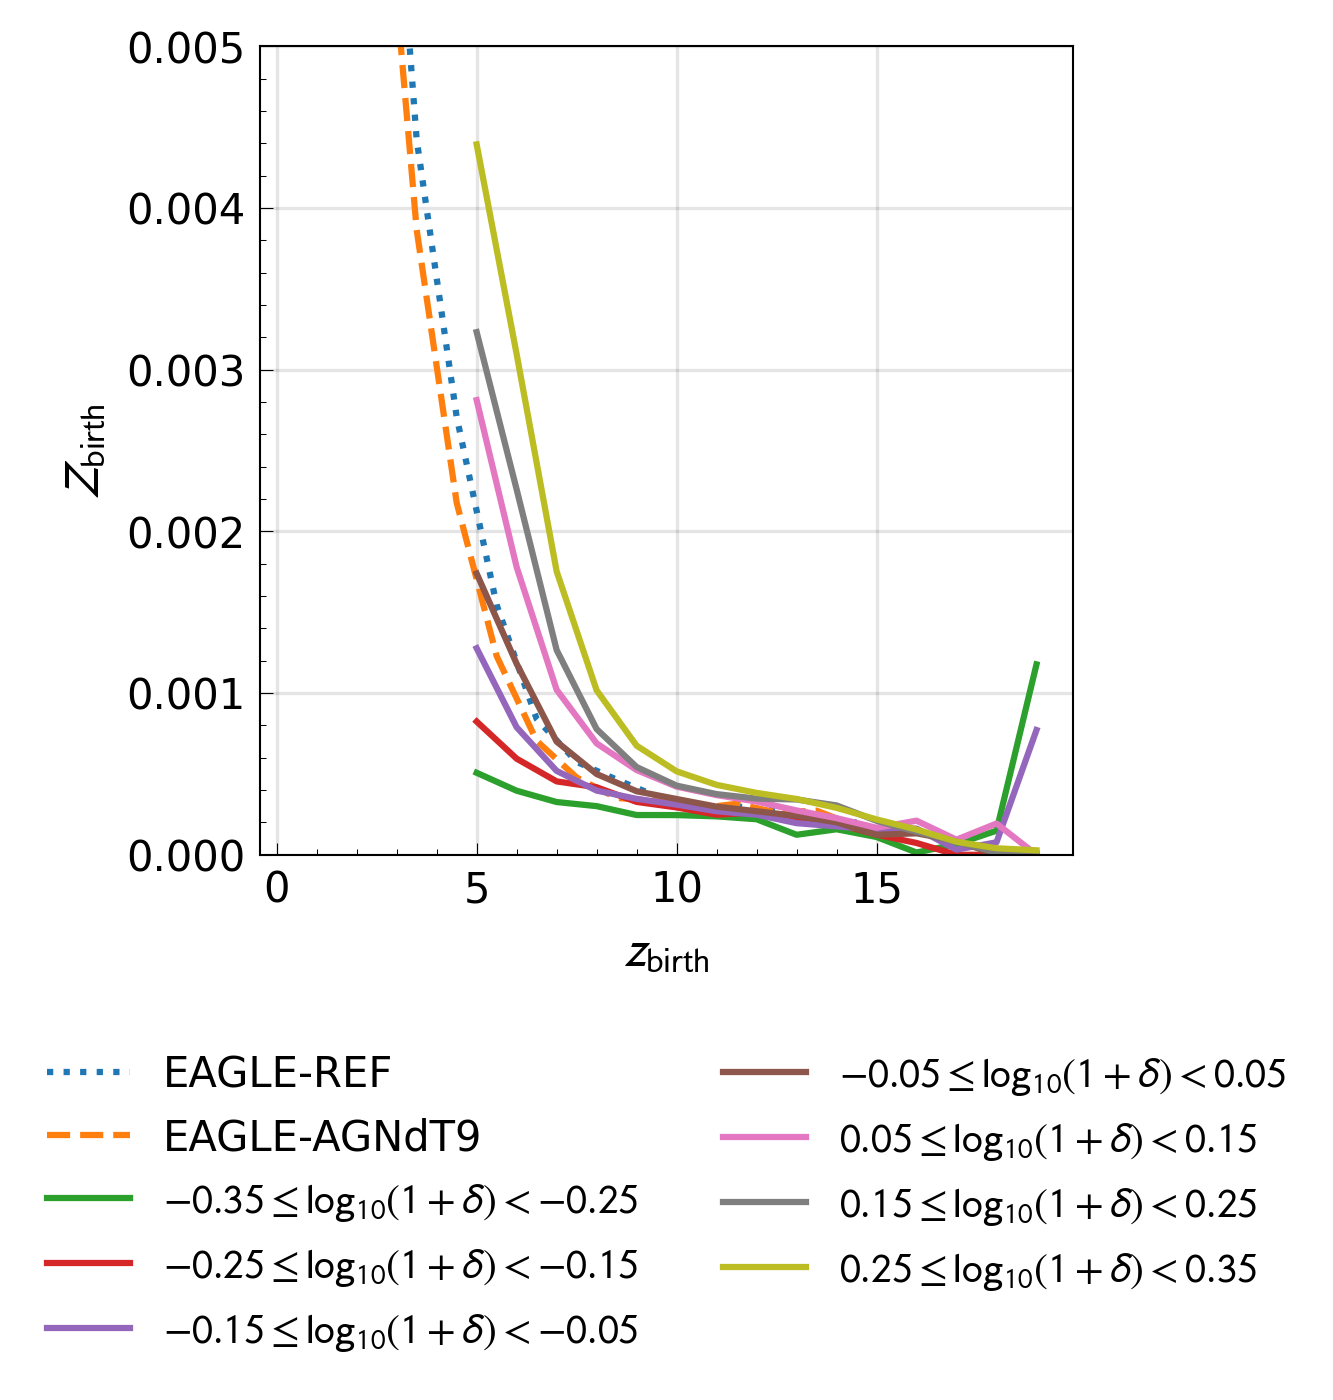
In terms of stellar birth metallicity evolution (Figure 12) we find little distinguishes each environment at the earliest times () beyond stochastic star formation where a small number of stars are formed. Following this, the most over-dense regions with begin forming enriched stellar particles after . From onwards the environmental dependence on stellar birth metallicity is well established, with the enrichment of new stellar particles at fixed redshift increasing with increasing overdensity. This environmental dependence can be interpreted as delayed enrichment of star forming gas in lower overdensity environments relative to more over-dense environments. The most massive and early forming galaxies are strongly biased towards the highest overdensities, hence this dependence on environment. The Eagle curves are both consistent with the mean overdensity bins from Flares, yielding a strong evolution in stellar birth metallicity which is mimicked at earlier times by the most over-dense regions.
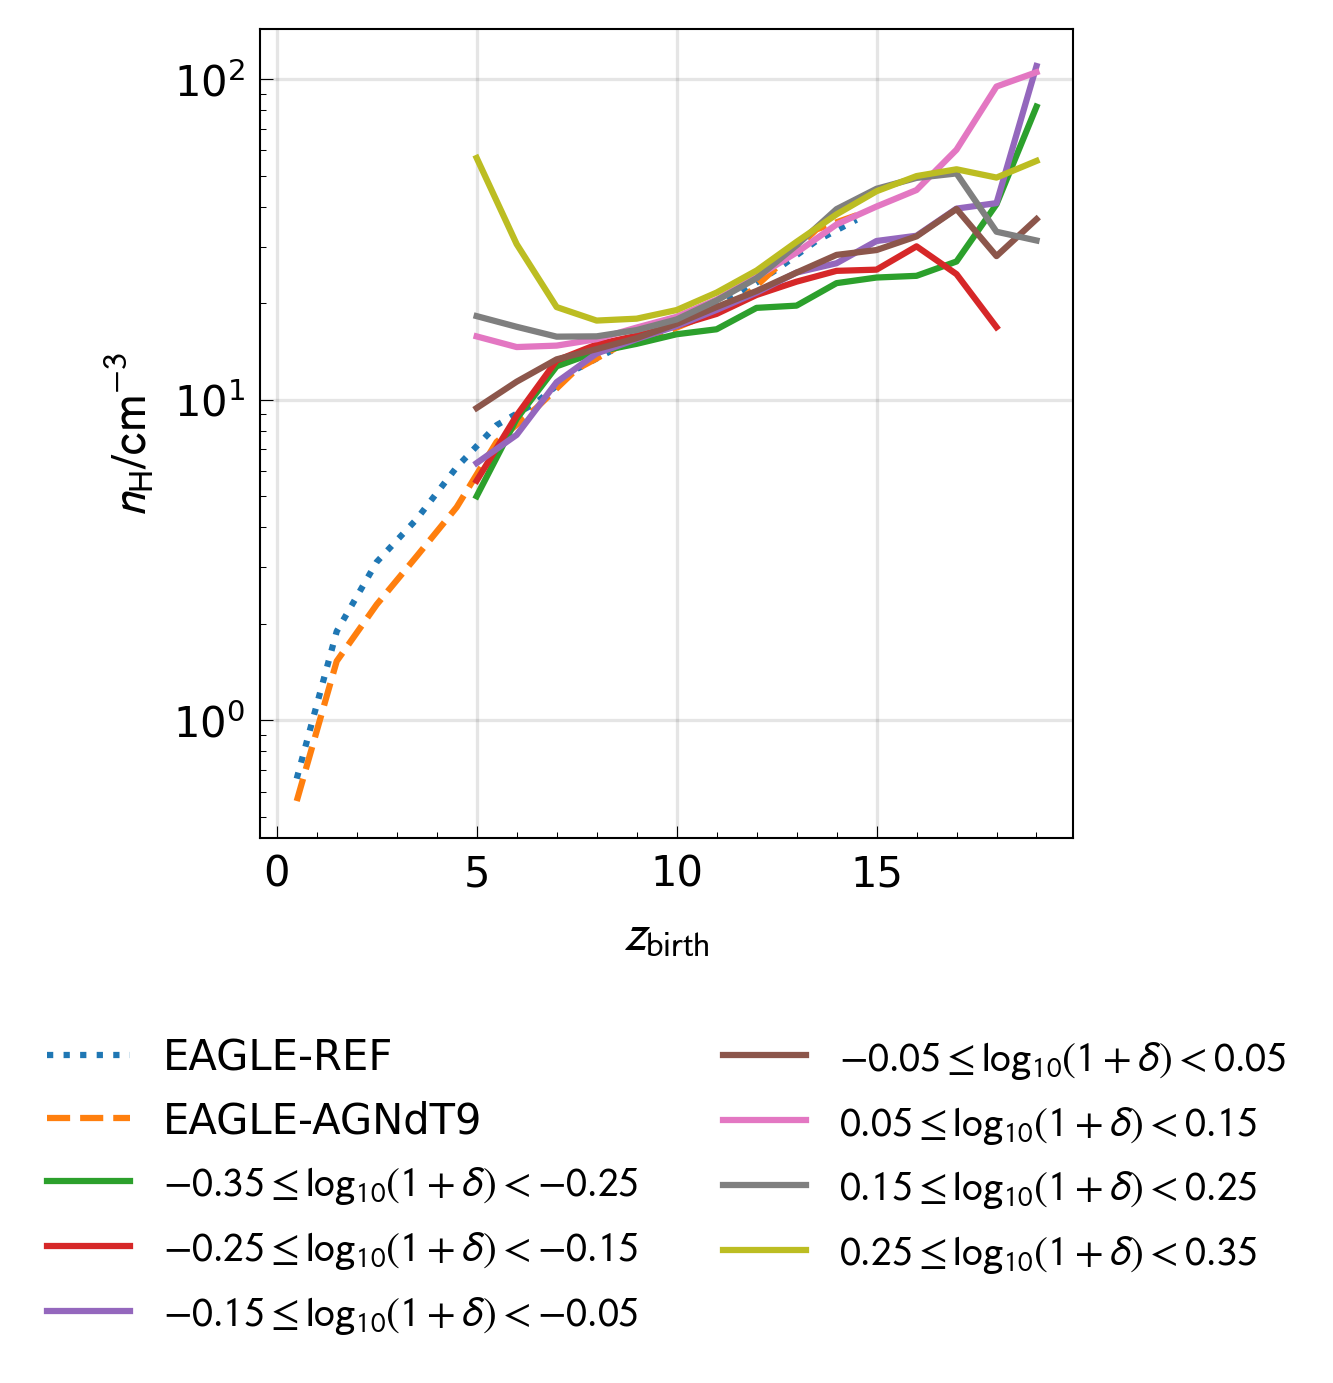
In contrast to stellar birth metallicity, stellar birth density (Figure 13) exhibits environmental dependence at early times beyond stochasticity. As early as we can see under-dense regions form stars at noticeably lower densities than over-dense environments. This naturally follows from the definition of an environment by overdensity; a more over-dense region contains more mass, and thus achieves higher densities earlier. By this early environmental dependence is no longer present. Early enrichment in the over-dense regions (see Figure 12) aids low density star formation, allowing lower stellar birth densities. The early onset and loss of the environmental dependence of stellar birth density due to enrichment at shows a clear transition between regimes where gas density, and later gas metallicity, dominate the star formation law.
We then see a strong environmental dependence establish itself once again in Figure 13 between as the compact cores of the most massive galaxies, biased towards the most over-dense regions, begin to form in earnest. In the lowest density environments, these galaxies do not form by and, even in mean density regions, they are few in number at this redshift444Flares contains infinitely many more galaxies at than the periodic Eagle simulations.. This explains the strong dependence on environment present at , with the most over dense regions increasing in stellar birth density while lower density regions exhibit a decrease. From onwards we can see a clear evolution towards lower stellar birth density as star forming gas is enriched, enabling star formation at lower densities. This is also the regime where the low density extended gas distributions begin to form stars, causing the increase in size of massive compact galaxies.
5.3 Spatial Distribution Evolution
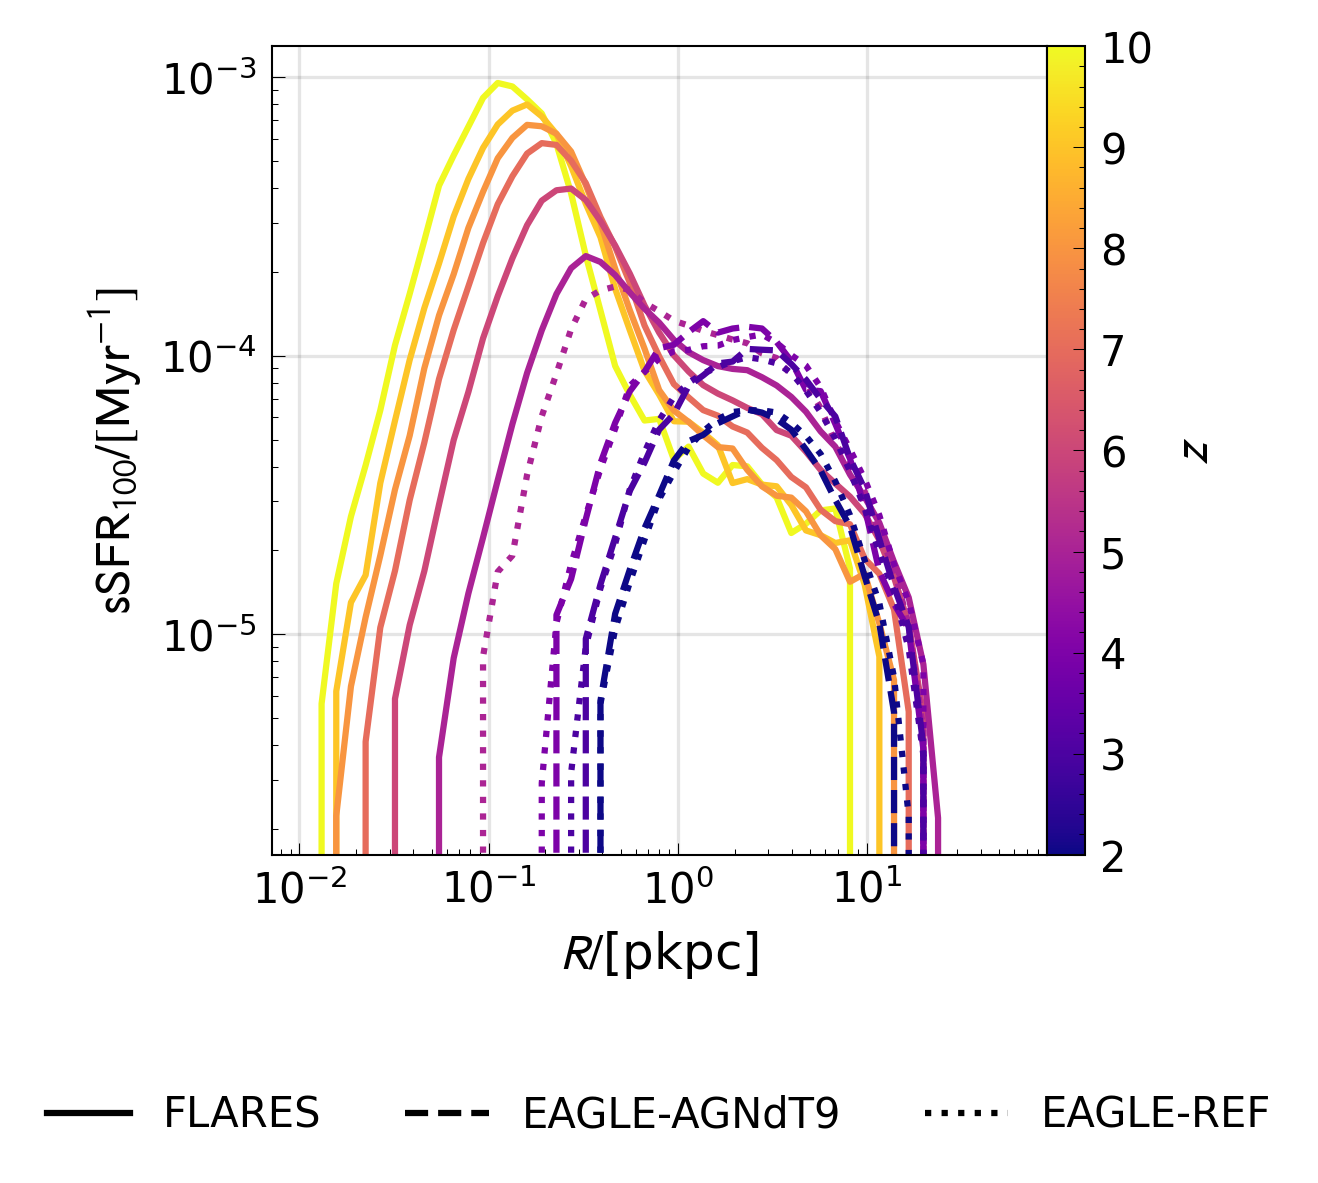
To explicitly link the shift of star formation to a low density and moderate metallicity locus at to star formation in extended gas distributions around compact galaxies, we investigate the spatial distribution of star formation. To do so we calculate profiles of sSFR (relative to the stellar mass of the whole galaxy) at specific redshifts by binning all stellar particles formed in the last 100 Myrs before a snapshot into annuli. We present the median specific star formation rate (sSFR) profiles for galaxies with in each snapshot () in Figure 14.
At () there is a clear peak of star formation at small radii, corresponding to compact core star formation in massive galaxies. This peak of star formation decreases with decreasing redshift as the compact cores become less dominant. For there is an increase in the star formation taking place at ckpc. By the peak of core star formation has entirely disappeared and is replaced by a peak at ckpc. This is a direct representation of the shift from the high redshift regime, where compact core star formation is dominant, to the low redshift regime, where extended gas distribution star formation dominates. This shift between regimes yields the transition shown in Figure 1 from a negative size-mass relation to a positive size-mass relation. We can summarise these two regimes as a high redshift () epoch of compact core (or bulge) star formation and a low redshift () epoch of inside-out star formation.
6 Conclusions
In this work, we have demonstrated the physical mechanisms in Flares and the Eagle sub-grid model that drive the formation of the compact galaxies which drive the negative slope of the size-mass relation at . Specifically, we find:
-
•
There are two formation paths for massive compact galaxies at . The compact formation path for galaxies forming at the earliest epochs () and the diffuse formation path for galaxies forming at later times ().
-
•
In the compact evolution path, progenitors of massive compact galaxies at form at the earliest times () in pristine environments with little to no metal enrichment. Due to the lack of enrichment they form stars at high densities and thus begin as low mass compact systems that stay compact for their entire evolution to .
-
•
In the diffuse evolution path, progenitors of massive compact galaxies at , forming after gas has become partially enriched (), are capable of forming stars at lower densities, and thus begin as low mass diffuse systems which become compact at later times.
-
•
The transition from diffuse to compact galaxy is driven by runaway star formation in their cores. Gas in a region of the diffuse galaxy begins efficient cooling, reaching high densities, enabling highly localised efficient star formation. This star formation then enriches the gas in the core of the galaxy, further enhancing star formation. Once this process has taken place, the galaxy has a compact stellar core with a high specific star formation rate and thus a compact stellar distribution.
We have also presented an evolutionary path for compact galaxies forming at , explaining how these galaxies evolve to yield extended sources seen at the present day, and the shift from the surprising negative high redshift stellar size-mass relation to the observed positive relation at lower redshifts. We find:
-
•
Galaxies at with compact stellar distributions are, in the majority of cases, surrounded by non-star forming gas distributions up to times larger than the stellar component. These extended gas distributions become enriched at later times and become capable of forming stars, increasing the stellar size of galaxies.
-
•
There are two broad regimes of star formation: a high redshift () regime dominated by compact core star formation and a low redshift () regime of inside-out star formation.
-
•
Star formation in the compact core regime takes place in gas at high density and high metallicity between .
-
•
Star formation in the inside-out regime takes place in gas at low density and moderate to high metallicity between .
-
•
A minority of compact stellar distributions are associated with comparably compact gas distributions. These galaxies are neither excessively young nor numerical artefacts of the halo finding process. The vast majority are satellite systems however a small number are central galaxies. These compact galaxies could be the progenitors of so called ‘red nuggets’ observed at intermediate redshifts.
We probe the environmental dependence of stellar birth properties and find a strong dependence rooted in the environmental dependence of galaxy stellar mass. At fixed redshift, high overdensity regions form stellar particles at higher densities (starting at ) and higher metallicities (starting at ) than lower overdensity regions. The most overdense regions also undergo a period of high density star formation at early times (). At the highest overdensity regions strongly deviate from the mean and low overdensity regions, forming stars at increasing density while all other regions begin to form stars at decreasing density.
Given the wealth of observational data coming from JWST, this insight into the physical mechanisms governing the formation and evolution of galaxies in the Epoch of Reionisation is invaluable to interpreting upcoming observational samples, enabling the mapping from observational properties to underlying physical mechanisms. Combined with the predicted size-luminosity relations across the spectrum in Roper et al. (2022), the mechanisms detailed in this work can be used to shed light on the formation and evolution of galaxies at the highest redshifts, linking the low redshift Universe to the high redshift Universe.
Not only are these insights important to interpreting observations, they are also invaluable to future sub-grid models, particularly if the negative size-mass relation is found to be isolated to simulations. Current models are designed to work well at low redshift (e.g. Schaye et al., 2015; Crain et al., 2015; Furlong et al., 2017) and, as shown in previous Flares studies amongst many others, perform surprisingly well at high redshift. Regardless of this favourable performance, given the ever increasing frontier of high redshift astronomy, having robust high redshift motivated models for galaxy formation in simulations is imperative to keep up with the observed samples, and to aid their interpretation. Understanding the behaviour of modern sub-grid models in this epoch is an important first step towards achieving this.
Acknowledgements
We thank the Eagle team for their efforts in developing the Eagle simulation code. We also wish to acknowledge the following open source software packages used in the analysis: scipy (Virtanen et al., 2020), Astropy (Robitaille et al., 2013), CMasher (van der Velden, 2020), and matplotlib (Hunter, 2007).
This work used the DiRAC@Durham facility managed by the Institute for Computational Cosmology on behalf of the STFC DiRAC HPC Facility (www.dirac.ac.uk). The equipment was funded by BEIS capital funding via STFC capital grants ST/K00042X/1, ST/P002293/1, ST/R002371/1 and ST/S002502/1, Durham University and STFC operations grant ST/R000832/1. DiRAC is part of the National e-Infrastructure. The Eagle simulations were performed using the DiRAC-2 facility at Durham, managed by the ICC, and the PRACE facility Curie based in France at TGCC, CEA, Bruyeres-le-Chatel.
WJR acknowledges support from an STFC studentship. CCL acknowledges support from a Dennis Sciama fellowship funded by the University of Portsmouth for the Institute of Cosmology and Gravitation. DI acknowledges support by the European Research Council via ERC Consolidator Grant KETJU (no. 818930). The Cosmic Dawn Center (DAWN) is funded by the Danish National Research Foundation under grant No. 140.
We list here the roles and contributions of the authors according to the Contributor Roles Taxonomy (CRediT)555https://credit.niso.org/. William J. Roper: Conceptualization, Data curation, Methodology, Investigation, Formal Analysis, Visualization, Writing - original draft. Christopher C. Lovell, Aswin P. Vijayan: Data curation, Writing - review & editing. Dimitrios Irodotou, Jussi Kuusisto, Jasleen Matharu, Louise Seeyave: Writing - review & editing. Peter Thomas: Conceptualization, Resources, Writing - review & editing. Stephen M. Wilkins: Conceptualization, Writing - review & editing.
Data Availability
A portion of the data used to produce this work can be found online: flaresimulations.github.io/data. Much of the analysis used the raw data produced by the simulation which can be made available upon request. All of the codes used for the data analysis are public and available at github.com/WillJRoper/flares-sizes-phys.
References
- Barnes et al. (2017a) Barnes D. J., Kay S. T., Henson M. A., McCarthy I. G., Schaye J., Jenkins A., 2017a, MNRAS, 465, 213
- Barnes et al. (2017b) Barnes D. J., et al., 2017b, MNRAS, 471, 1088
- Chabrier (2003) Chabrier G., 2003, PASP, 115, 763
- Chiang et al. (2013) Chiang Y.-K., Overzier R., Gebhardt K., 2013, ApJ, 779, 127
- Conselice (2014) Conselice C. J., 2014, ARA&A, 52, 291
- Crain et al. (2015) Crain R. A., et al., 2015, MNRAS, 450, 1937
- Dalla Vecchia & Schaye (2012) Dalla Vecchia C., Schaye J., 2012, MNRAS, 426, 140
- Damjanov et al. (2009) Damjanov I., et al., 2009, ApJ, 695, 101
- Davé et al. (2019) Davé R., Anglés-Alcázar D., Narayanan D., Li Q., Rafieferantsoa M. H., Appleby S., 2019, MNRAS, 486, 2827
- Davies et al. (2020) Davies J. J., Crain R. A., Oppenheimer B. D., Schaye J., 2020, MNRAS, 491, 4462
- Dolag et al. (2009) Dolag K., Borgani S., Murante G., Springel V., 2009, MNRAS, 399, 497
- Euclid Collaboration et al. (2022) Euclid Collaboration et al., 2022, A&A, 662, A112
- Feng et al. (2016) Feng Y., Di-Matteo T., Croft R. A., Bird S., Battaglia N., Wilkins S., 2016, MNRAS, 455, 2778
- Ferland et al. (1998) Ferland G. J., Korista K. T., Verner D. A., Ferguson J. W., Kingdon J. B., Verner E. M., 1998, PASP, 110, 761
- Fossati et al. (2013) Fossati M., et al., 2013, A&A, 553, A91
- Furlong et al. (2015) Furlong M., et al., 2015, MNRAS, 450, 4486
- Furlong et al. (2017) Furlong M., et al., 2017, MNRAS, 465, 722
- Grazian et al. (2012) Grazian A., et al., 2012, A&A, 547, A51
- Haardt & Madau (2001) Haardt F., Madau P., 2001, in Neumann D. M., Tran J. T. V., eds, Clusters of Galaxies and the High Redshift Universe Observed in X-rays. p. 64 (arXiv:astro-ph/0106018)
- Holwerda et al. (2015) Holwerda B. W., Bouwens R., Oesch P., Smit R., Illingworth G., Labbe I., 2015, ApJ, 808, 6
- Holwerda et al. (2020) Holwerda B. W., Bridge J. S., Steele R. L., Kusmic S., Bradley L., Livermore R., Bernard S., Jacques A., 2020, arXiv e-prints, p. arXiv:2005.03515
- Huang et al. (2013) Huang K.-H., Ferguson H. C., Ravindranath S., Su J., 2013, ApJ, 765, 68
- Hunter (2007) Hunter J. D., 2007, Computing in Science & Engineering, 9, 90
- James et al. (2009) James P. A., Bretherton C. F., Knapen J. H., 2009, A&A, 501, 207
- Kawamata et al. (2015) Kawamata R., Ishigaki M., Shimasaku K., Oguri M., Ouchi M., 2015, ApJ, 804, 103
- Kawamata et al. (2018) Kawamata R., Ishigaki M., Shimasaku K., Oguri M., Ouchi M., Tanigawa S., 2018, ApJ, 855, 4
- Kawinwanichakij et al. (2021) Kawinwanichakij L., et al., 2021, ApJ, 921, 38
- Kennicutt (1998) Kennicutt Robert C. J., 1998, ApJ, 498, 541
- Lagos et al. (2015) Lagos C. d. P., et al., 2015, MNRAS, 452, 3815
- Lovell et al. (2018) Lovell C. C., Thomas P. A., Wilkins S. M., 2018, MNRAS, 474, 4612
- Lovell et al. (2021) Lovell C. C., Vijayan A. P., Thomas P. A., Wilkins S. M., Barnes D. J., Irodotou D., Roper W., 2021, MNRAS, 500, 2127
- Lovell et al. (2022) Lovell C. C., et al., 2022, arXiv e-prints, p. arXiv:2211.07540
- Marshall et al. (2021) Marshall M. A., Wilkins S., Di Matteo T., Roper W. J., Vijayan A. P., Ni Y., Feng Y., Croft R. A., 2021, MNRAS, 000, 1
- Matharu et al. (2022) Matharu J., et al., 2022, ApJ, 937, 16
- McAlpine et al. (2016) McAlpine S., et al., 2016, Astronomy and computing., 15, 72
- Mosleh et al. (2012) Mosleh M., et al., 2012, ApJ, 756, L12
- Muñoz-Mateos et al. (2007) Muñoz-Mateos J. C., Gil de Paz A., Boissier S., Zamorano J., Jarrett T., Gallego J., Madore B. F., 2007, ApJ, 658, 1006
- Nelson et al. (2016) Nelson E. J., et al., 2016, ApJ, 828, 27
- Nelson et al. (2019) Nelson E. J., et al., 2019, ApJ, 870, 130
- Oesch et al. (2010) Oesch P. A., et al., 2010, ApJL, 709, L21
- Ono et al. (2013) Ono Y., et al., 2013, ApJ, 777, 155
- Oppenheimer & Schaye (2013a) Oppenheimer B. D., Schaye J., 2013a, MNRAS, 434, 1043
- Oppenheimer & Schaye (2013b) Oppenheimer B. D., Schaye J., 2013b, MNRAS, 434, 1063
- Pillepich et al. (2018) Pillepich A., et al., 2018, MNRAS, 475, 648
- Planck Collaboration et al. (2014) Planck Collaboration et al., 2014, A&A, 571, A1
- Popping et al. (2021) Popping G., et al., 2021, MNRAS, 510, 3321
- Ramsay et al. (2021) Ramsay S., et al., 2021, The Messenger, 182, 3
- Robitaille et al. (2013) Robitaille T. P., et al., 2013, A&A, 558, A33
- Roper et al. (2020) Roper W. J., Thomas P. A., Srisawat C., 2020, MNRAS, 494, 4509
- Roper et al. (2022) Roper W. J., Lovell C. C., Vijayan A. P., Marshall M. A., Irodotou D., Kuusisto J. K., Thomas P. A., Wilkins S. M., 2022, MNRAS, 514, 1921
- Schaller et al. (2018) Schaller M., Gonnet P., Draper P. W., Chalk A. B. G., Bower R. G., Willis J., Hausammann L., 2018, SWIFT: SPH With Inter-dependent Fine-grained Tasking, Astrophysics Source Code Library, record ascl:1805.020 (ascl:1805.020)
- Schaye (2004) Schaye J., 2004, ApJ, 609, 667
- Schaye & Dalla Vecchia (2008) Schaye J., Dalla Vecchia C., 2008, MNRAS, 383, 1210
- Schaye et al. (2015) Schaye J., et al., 2015, MNRAS, 446, 521
- Shibuya et al. (2015) Shibuya T., Ouchi M., Harikane Y., 2015, ApJS, 219, 15
- Somerville & Davé (2015) Somerville R. S., Davé R., 2015, ARA&A, 53, 51
- Springel et al. (2001) Springel V., White S. D. M., Tormen G., Kauffmann G., 2001, MNRAS, 328, 726
- Srisawat et al. (2013) Srisawat C., et al., 2013, MNRAS, 436, 150
- Suess et al. (2019) Suess K. A., Kriek M., Price S. H., Barro G., 2019, ApJ, 877, 103
- Tacchella et al. (2015a) Tacchella S., et al., 2015a, Science, 348, 314
- Tacchella et al. (2015b) Tacchella S., et al., 2015b, ApJ, 802, 101
- Tacchella et al. (2018) Tacchella S., et al., 2018, ApJ, 859, 56
- Taylor et al. (2010) Taylor E. N., Franx M., Glazebrook K., Brinchmann J., van der Wel A., van Dokkum P. G., 2010, ApJ, 720, 723
- Trayford et al. (2015) Trayford J. W., et al., 2015, MNRAS, 452, 2879
- Vijayan et al. (2021) Vijayan A. P., Lovell C. C., Wilkins S. M., Thomas P. A., Barnes D. J., Irodotou D., Kuusisto J., Roper W. J., 2021, MNRAS, 501, 3289
- Vijayan et al. (2022) Vijayan A. P., et al., 2022, MNRAS, 511, 4999
- Virtanen et al. (2020) Virtanen P., et al., 2020, Nature Methods, 17, 261
- Wang et al. (2022) Wang Y., et al., 2022, ApJ, 928, 1
- Wiersma et al. (2009) Wiersma R. P. C., Schaye J., Smith B. D., 2009, MNRAS, 393, 99
- Wilkins et al. (2022b) Wilkins S. M., et al., 2022b, First Light And Reionisation Epoch Simulations (FLARES) V: The redshift frontier, doi:10.48550/arXiv.2204.09431, http://arxiv.org/abs/2204.09431
- Wilkins et al. (2022a) Wilkins S. M., et al., 2022a, MNRAS,
- Wilkins et al. (2022c) Wilkins S. M., et al., 2022c, arXiv e-prints, p. arXiv:2208.00976
- Wilkinson et al. (2022) Wilkinson M. J., Ludlow A. D., Lagos C. d. P., Fall S. M., Schaye J., Obreschkow D., 2022, arXiv e-prints, p. arXiv:2208.07623
- Wilman et al. (2020) Wilman D. J., et al., 2020, ApJ, 892, 1
- Wu et al. (2020) Wu X., Davé R., Tacchella S., Lotz J., 2020, MNRAS, 494, 5636
- Zhang & Yang (2019) Zhang Y.-C., Yang X.-H., 2019, /raa, 19, 006
- van Dokkum et al. (2008) van Dokkum P. G., et al., 2008, ApJL, 677, L5
- van der Velden (2020) van der Velden E., 2020, The Journal of Open Source Software, 5, 2004
- van der Wel et al. (2014) van der Wel A., et al., 2014, ApJ, 788, 28
Appendix A The Effects of AGN on Compact Galaxy Formation
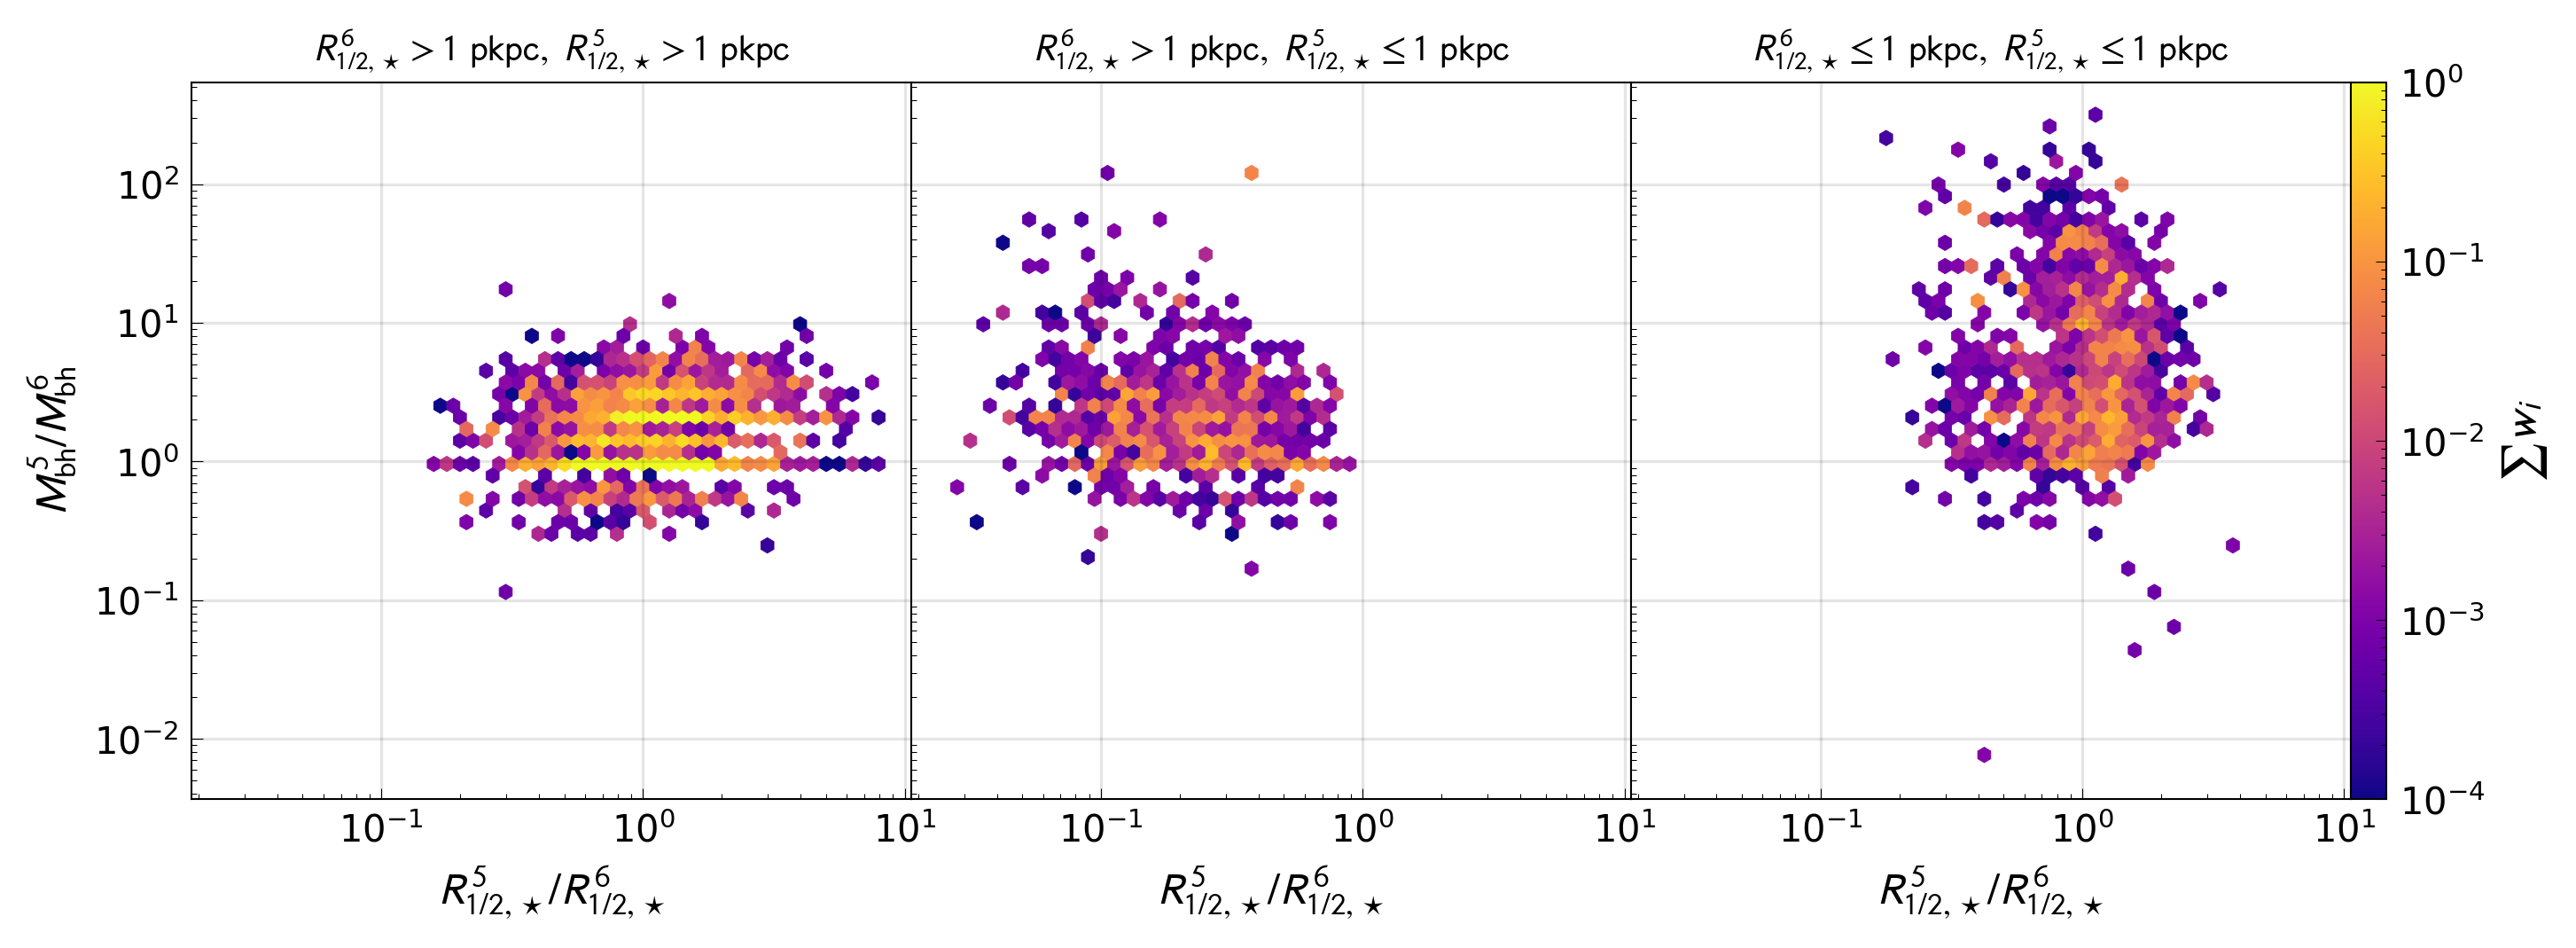
In this section, we present the effects of AGN feedback on the evolution of galaxies from diffuse systems to compact systems. To do so we need a measure of the integrated energy injected by the AGN. In our model, AGN feedback is closely tied to the accretion rate of a black hole, with the energy injection rate from black hole accretion given by
| (5) |
where is the fraction of the feedback energy that is coupled with the ISM, the radiative efficiency of the accretion disc, the (instantaneous) black hole accretion rate and the speed of light. We can probe the effect of AGN feedback by measuring the mass increase between snapshots of a black hole and comparing that to the ratio between sizes. However, purely looking at the mass increase of the central black hole will contaminate the mass increase with black hole mergers. To avoid this we look at the ratio between the total black hole mass of a galaxy and its progenitor as inferred from merger graphs (Roper et al., 2020). Note that, despite this, the black hole mass ratios will nonetheless be contaminated by galaxy mergers, however, the vast majority of these contribute seed mass black holes which will have little effect on the mass increase. Galaxy mergers will also produce different stellar size ratios than stellar formation driven changes and thus should not affect the overall trend.
We present the comparison between stellar size ratios and black hole mass ratios in Figure 15. Here we see no trend between the stellar size ratio and black hole mass ratio in any size evolution phase (any column). We can thus conclude that AGN and their feedback do not play a role in the compactification of galaxies in the Eagle model. The only trend we do see is that a subset of galaxies which were compact at and remain compact exhibit large increases in black hole mass. These are galaxies with black holes efficiently accreting from the dense gas in their compact cores, and are thus examples of possibly observable high redshift quasars.