The Bending of \ceC3: Experimentally Probing the -type Doubling and Resonance
Abstract
\ceC3, a pure carbon chain molecule that has been identified in different astronomical environments, is considered a good probe of kinetic temperatures through observation of transitions involving its low-lying bending mode () in its ground electronic state. The present laboratory work aims to investigate this bending mode with multiple quanta of excitation by combining recordings of high resolution optical and infrared spectra of \ceC3 produced in discharge experiments. The optical spectra of rovibronic () transitions have been recorded by laser induced fluorescence spectroscopy using a single longitude mode optical parametric oscillator as narrow bandwidth laser source at the University of Science and Technology of China. 36 bands originating from (00), , are assigned. The mid-infrared spectrum of the rovibrational band has been recorded by Fourier-transform infrared spectroscopy using a globar source on the AILES beamline of the SOLEIL synchrotron facility. The spectrum reveals hot bands involving up to 5 quanta of excitation in . From combining analyses of all the presently recorded spectra and literature data, accurate rotational parameters and absolute energy levels of \ceC3, in particular for states involving the bending mode, are determined. A single PGOPHER file containing all available data involving the and states (literature and present study) is used to fit all the data. The spectroscopic information derived from this work enables new interstellar searches for \ceC3, not only in the infrared and optical regions investigated here but also notably in the band region (around 63 cm-1) where vibrational satellites can now be accurately predicted. This makes \ceC3 a universal diagnostic tool to study very different astronomical environments, from dark and dense to translucent clouds.
[inst3] organization=Université Paris-Saclay, CNRS, Institut des Sciences Moléculaires d’Orsay, city=Orsay, postcode=F-91405, country=France
[inst1] organization=CAS Center for Excellence in Quantum Information and Quantum Physics, and Hefei National Laboratory for Physical Sciences at the Microscale, University of Science and Technology of China, addressline=Hefei, city=Anhui, postcode=230026, country=P. R. China
[inst2] organization=Laboratory for Astrophysics, Leiden Observatory, Leiden University, addressline=PO Box 9513, city=RA Leiden, postcode=NL2300, country=the Netherlands
[inst4] organization=SOLEIL Synchrotron, AILES beamline, addressline=l’Orme des Merisiers, Saint-Aubin, city=Gif-sur-Yvette, postcode=F-91190, country=France
[inst5] organization=Department of Physics, University of New Brunswick, city=Fredericton, state=NB, country=Canada
[inst6] organization=School of Chemistry, University of Bristol, city=Bristol, country=United Kingdom
1 Introduction
The bare carbon chain molecule propadienediylidene, \ceC3, has for long been the object of considerable interest to astronomers and spectroscopists alike. It is one of the few species for which astronomical observations have preceded laboratory identification. Puzzling, unidentified lines around 4051 Å were first detected in cometary optical emission in 1881 by Huggins [1] then observed toward many cometary bodies [, 2, 3, 4]. These lines were successfully reproduced in the lab by Raffety [5] and Herzberg [6] but their molecular carrier remained elusive until the work of Douglas [7] who conclusively identified \ceC3 through an isotope-substitution experiment. First actual rovibronic assignments of transitions in this band to transitions of the system were delayed until the work of Gausset et al. [8, 9]. Because of its lack of a permanent dipole moment, \ceC3 does not possess a pure rotational spectrum and is thus not accessible by radio astronomy. Instead, its electronic and vibrational spectra in the optical and infrared regions, respectively, provide useful spectroscopic approaches for detecting and tracing this simple molecule in the interstellar medium (ISM). Optical detections of the band of \ceC3 have established the species as an ubiquitous component of diffuse interstellar matter [, 10, 11, 12, 13, 14, 15] making it an ideal probe of the physical and chemical conditions in such environments. In the work of Schmidt et al. [15], the most extensive rovibronic \ceC3 series detected in space to date, seven – rovibronic bands in addition to the origin band were observed in absorption towards HD 169454, a reddened star (because of molecular extinction along a line of sight crossing one or more molecular clouds), in a high-quality absorption spectrum. Rovibronic series have also been reported in cometary spectra [, 16]. In the past decades, \ceC3 has also been detected in circumstellar shells and in the dense ISM via detection of transitions in its asymmetric stretching ( cm-1) [, 17] and bending ( cm-1) [, 18, 19, 20] vibrational bands. It is particularly interesting to note that the observation of several rovibrational transitions involving the low-lying fundamental mode have been reported in the carbon-rich star IRC+10216 [18], in the molecular cloud Sagittarius B2 [18, 19], and in the star forming cores W31C and W49N [20]. The unusually low frequency of the bending mode makes vibrationally excited \ceC3 a powerful probe of the kinetic temperature in various interstellar environments [18].
Besides the case of the 4051 Å comet band system, astronomical observations have also prompted other laboratory studies on \ceC3. Following the early work by Douglas [7] and Gausset et al. [9], dedicated experiments have been conducted, aiming for a comprehensive characterization of the electronic band system of \ceC3 at low- [see, , 21, 22, 23, 24, 25, 26, 27] and high- [, 28, 29, 30, 31, 32, 33, 34, 20, 35, 36, 15, 37] resolution. The work of McCall et al. [38] led to a reassignment of the R(0) transition of the (000)–(000) band, in agreement with astronomical data [13]. Optical measurements have enabled the accurate description of the vibrational pattern in the electronic ground state (GS), notably the determination of the infrared inactive symmetric stretch band center ( 1224 cm-1) [34].
In almost simultaneous studies, the fundamental vibrational band was observed in the laboratory [39] and in space [17]. The bending mode was investigated by far-infrared spectroscopy [40] subsequently enabling its interstellar detection [41, 18] which then prompted further high resolution laboratory investigations of the band [42, 43]. The combination band was also granted some interest: first measured in the laboratory by Krieg et al. [44], it was subsequently re-investigated by Schröder et al. [45] who extended the known stretching vibrational manifold, with levels involving up to seven quanta of excitation in and three quanta in , thus probing the potential energy surface (PES) of this “floppy” molecule to high energies along the stretching coordinate and providing precise sets of molecular constants. In contrast, the bending vibrational manifold remains unstudied at this level of thoroughness with only a limited number of dedicated investigations. Relatively low-resolution stimulated-emission pumping (SEP) studies [, 24, 25, 46] have resulted in the observation of levels involving in the electronic GS while the rovibronic investigations of the band system by Gausset et al. [9] revealed bands involving up to . More extensive high-resolution data from direct absorption infrared studies, by probing hot bands in either [47] or [44], have enabled the detection of levels with up to (only) two quanta of excitation in . High resolution spectroscopic information for transitions involving higher quanta of excitation in is highly desirable to characterize the PES along the bending coordinate. Such data will also serve the astronomical community as the observation of vibrationally excited \ceC3 will allow to probe kinetic temperature of various interstellar environments.
Even though an exhaustive review of the extensive literature on \ceC3 is beyond the scope of this paper, it is worth mentioning that because of its relevance not only in astrophysics but also in molecular physics, many other studies have been dedicated to this species. Many theoretical investigations were conducted on its potential energy surface [e.g. 48, 49, 50] aiming specifically at establishing its equilibrium structure (and resolving the long-standing ambiguity linear vs. bent; the former being the census to date) and providing reliable energy term values and vibrational constants for excited vibrational levels in the electronic GS. Experimentally, other electronic band systems have been investigated [, 51, 52, 53, 54] while \ceC3 isotopologues have been the subject of optical [55, 56] and infrared [57] studies. The vacuum ultraviolet photoionization spectrum of \ceC3 was also reported [58]. Weltner and Van Zee [59] and Van Orden and Saykally [60] have published detailed reviews on the experimental works on \ceC3 as of the late 1990’s. \ceC3 is also included in many astronomical models [, 61, 62] and dedicated experiments have been conducted to investigate its reactivity with neutral species in space [see 63].
In this paper, we report a joint optical ( band) and infrared ( band) investigation of \ceC3 in which we detected and assigned bands involving levels with up to 5 quanta of excitation in . Many of these bands are reported here for the first time. The combined analysis of these two data sets enables the accurate determination of the spectroscopic constants of the species as well as absolute rovibrational level energies for the levels in the electronic GS. From this, accurate far-infrared transitions are derived for ro-vibrational transitions involving the mode and its hot band sequences guiding reliable interstellar searches. The paper is organized as follows: in Section 2, we describe the two experimental approaches used in this work; in Section 3, the experimental results and spectral analysis are presented; in Section 4, a prediction of the line position of the rovibrational hot bands in the far-infrared is reported; and in Section 5, the astronomical implications of the present data are discussed. The recorded line positions, experimental spectra, and fit files are available in the extensive supplementary material.
2 Experimental methods
2.1 Optical Spectroscopy
The optical spectroscopic study of the transition of \ceC3 has been performed between 380 and 410 nm at the University of Science and Technology of China by using a laser induced fluorescence (LIF) setup that has been described in Zhang et al. [64, 65, 66]. In this experiment, \ceC3 molecules are produced in a pulsed DC discharge nozzle using two flat-top stainless steel electrodes [67]. A gas mixture of 0.3 % acetylene (C2H2) diluted in argon is introduced into the nozzle by a General Valve (Series 9, 0.5 mm orifice). High voltage pulses ( V, 20 µs, 10 Hz) are applied to one of the electrodes while the other is grounded in order to produce an intense pulsed plasma. The plasma containing \ceC3 molecules is then expanded and adiabatically cooled by collisions with the buffer gas. About 10 mm downstream, the molecular beam is crossed perpendicularly by a laser beam, which suppresses the Doppler broadening in the recorded spectra. Fluorescent emission from laser excited \ceC3 molecules is collected by a lens system perpendicular to the laser beam, guided into a grating spectrometer (Zolix, 0.5 m) and then detected by a photomultiplier tube (Hamamatsu, R928).
A home-built single-longitude-mode optical parametric oscillator (SLM-OPO) is employed as the laser source [68]. In the present study, the signal output of the OPO is frequency-doubled in a KDP (KH2PO4) crystal to obtain tunable radiation between 350 and 450 nm. A small portion ( 5 %) of the OPO signal output is injected into a wavelength meter (High Finesse, WS7-60) for calibration. The wavelength meter is calibrated with a stabilized He-Ne laser, providing a frequency accuracy of cm-1 for the laser source.
Special care had to be taken in the measurement of the relatively weak hot vibronic bands. This is because in the supersonic jet the population of an excited vibrational level is much lower than that in the level and, in most cases, the hot bands are overlapped with stronger fundamental vibronic bands. To overcome these difficulties, the spectrometer is used as a narrow band pass filter which helps to distinguish fluorescence of the hot bands from other overlapping bands. As the fluorescence from different upper states often results in different dispersed spectra, and since the bandpass of the monochromator is extremely narrow ( 0.5 nm), it becomes possible to only detect the fluorescence emission from upper states involving specific GS hot bands. This was realized by selecting a dispersion wavelength of the monochromator corresponding to the fluorescence from the upper electronic state (itself optically-pumped from vibrationaly excited states of the state) to the lowest allowed vibrational level of the GS.
A laser excitation spectrum is recorded by measuring the intensity of the fluorescence as a function of the continuously tuned laser wavelength. This technique yields a very good signal-to-noise (S/N) ratio and a spectral resolution of 0.02 cm-1 (corresponding to a resolving power of 1,200,000) for the strong bands. Based on the line width of the rovibronic transitions, the accuracy of the extracted line positions from our spectra can confidently be assumed to be of about 0.002 cm-1 for the bands arising from in the ground electronic state [with the exception of the (000)–(000) band for which a 0.005 cm-1 uncertainty is used] and 0.005 cm-1 for the other hot bands (with ). Absolute frequency accuracies may be subject to small shifts because of combining spectra from different wavelength regimes that are recorded in different experimental setups, but comparison with previous studies [, 42, 40, 31] allows for reliable calibration (see later in section 2.3).
2.2 Infrared Spectroscopy
The absorption spectrum of \ceC3 has been recorded in the asymmetric stretch region (around cm-1/ 5 µm) using an experimental set-up available on the AILES beamline of synchrotron SOLEIL previously used to investigate the far-infrared spectra of various reactive species [see 69, 70, 71]. The schematic representation of the discharge set-up together with its implementation on the AILES beamline is given in Figure 1 of Martin-Drumel et al. [69]. We briefly describe in this paper the main characteristics of the set-up and the discharge conditions we used to optimize the signal of \ceC3. The discharge cell consists of a 1.1 m long Pyrex tube (13 cm inner diameter) equipped with multipass optics (White-type) allowing for 24 m of absorption pathlength. The cell is connected under vacuum to a Bruker Fourier-transform (FT) infrared spectrometer and is separated from it by two wedged \ceCaF2 windows. A total of seven cell inlets are used: two are connected to the two water-cooled electrodes (separated by 70 cm), four allow for gas injection (buffer gas or sample) at different locations in the cell, and one located at the center of the cell is connected to a vacuum system (250 m3/h Roots blower). To probe the positive column of the plasma, one of the electrodes is connected to the high voltage while the second is grounded. In the present work, \ceC3 is synthesized using a discharge of He (injected both through the electrodes and through the two gas inlets closest to the multipass optics) seeded with a small amount of \ceCH4 (injected using the inlets located closer to the center of the cell).
Under our experimental conditions, we find that the abundance of \ceC3 is very sensitive to both the discharge current and the pressure of \ceCH4 precursor. To optimize the production of \ceC3, we use a rapid scan optical fiber spectrometer (Ocean Optics) to monitor the 4051 Å emission band. The \ceCH4 pressure is slowly increased until reaching the maximum of the visible emission while simultaneously adjusting the discharge current. In the optimum conditions, about 1 A of current (at 1 kV DC) drives the discharge through a ballast resistor of 100 . A total pressure of about 1 mbar of a mixture of \ceCH4 seeded in He is injected in the cell and a continuous flow of gas is maintained. To record the absorption spectra in the 5 µm region, we use the globar internal source of the Bruker FTIR installed on the AILES beamline of the SOLEIL synchrotron, a CaF2 beamsplitter, and an Indium Antimonide (InSb) detector. These experimental conditions, together with the use of a bandpass optical filter, limit the bandwidth of our acquisition to the 1850–2100 cm-1 range. The unapodized spectral resolution is set to 0.004 cm-1 and 138 scans are co-added. Despite the effort to optimize the synthesis of \ceC3 in our cell and reduce the noise floor, the most intense lines of our spectra correspond to only about 5 % of signal absorption resulting in a SNR of 10 at best.
Aside from \ceC3, intense absorption lines of CO (possibly produced by reaction with residual H2O) belonging to the sequences (with , the 4 – 3 band being the strongest one) of the species in its electronic GS are observed over the full spectral range covered in this study (Figure S1 in the supplementary material). Even though these series of intense lines hinder identification of weaker series of \ceC3 lines, they enable spectral calibration by comparison with the accurate wavenumbers values from Refs. [72, 73, 74]. After calibration, the frequency accuracy is estimated for each \ceC3 line based on its full-width at half-maximum and signal-to-noise ratio [75] and ranges from 0.0005 cm-1 to 0.006 cm-1. The rotational contour of the CO bands also allows for estimation of its rotational temperature (see Figure S2 in the supplementary material) from comparison with simulations using the PGOPHER software [76]. Under our experimental conditions, a rotational temperature of 500 K is found in each CO band. Since the observation of CO hot bands is limited by the spectral coverage rather than the levels population, no vibrational temperature value can be asserted. Besides CO lines, a few weak transitions of the fundamental bending mode of H2O are also detected [77] and several lines are assigned to the R branch of the fundamental band of C2H in the 1860–1895 cm-1 range [78] (Figure S1).
2.3 Methodology
As mentioned previously, the vibrational band lies in the far-infrared region and is significantly weaker than the band [48]; for these reasons, it remains challenging to measure the hot band sequences involving which would provide vibrational energies in the progression. Alternatively, such information can be derived from a combined rovibronic and rovibrational analysis of bands involving various quanta of excitation in the electronic GS. This approach is used in the present study exploiting \ceC3 spectra in the optical and mid-infrared region.
Initial analyses of optical and infrared data have been performed independently, mostly exploiting combination differences. Subsequently, all literature and newly measured rotationally-resolved transitions have been imported into the PGOPHER software [76] which has been used successfully to analyze specific bands of \ceC3 previously [51, 37, 45, 56]. Some features of this software have proven particularly powerful in the present study. First, all assignments can be treated as separate input files (for instance, one file per band) hence easing the treatment of large datasets. Then, the software allows for a relatively straightforward simultaneous treatment of rovibrational and rovibronic data. Last but not least, graphical representations of residuals, simulated bands, and term values plots is an invaluable tool to refine assignments and detect perturbations. We thus perform a combined fit using PGOPHER of the presently recorded data together with all available rovibronic ( only) and rovibrational (all known bands in the state) literature data allowing for the most complete spectroscopic description of the \ceC3 molecule to date.
2.4 Spectroscopy of \ceC3
As already mentioned in the introduction, detailed descriptions of the spectroscopy of \ceC3 can be found in Gausset et al. [9] and Rousselot et al. [62]; here we recall some aspects pertinent to this work. In the electronic GS, as a result of the presence of a doubly-degenerate bending vibration, the species exhibits l-type doubling. Levels with are split into multiple l-states, with the vibrational angular momentum, such that l = , , …, 0 or 1. Because the \ceC3 bending frequency is unusually small ( cm-1), the -type doubling is unusually large. In addition, the electronic state is subject to Renner-Teller coupling, splitting the bending states into components, where is the total vibronic angular momentum and the projection of the electronic orbital angular momentum onto the molecular axis of the molecule. Again, the very small bending frequency yields significant effects on \ceC3 spectroscopy, here resulting in a large Renner-Teller interaction. A typical representation of splittings for the bending mode of linear molecules experiencing Renner-Teller interaction is given in Figure 9 of Gausset et al. [9]. Because \ceC3 is linear, thus centrosymmetric, and contains identical nuclei of zero spin, all the antisymmetric levels have zero weight by spin statistics. In other words, half of the rotational levels are missing. For example, for states, only even- () levels exist while for a state, only odd- () levels exist. For other states, all levels exist but with alternate / labels.
In the following, each vibronic level is labeled () where is the electronic state ( or ), () refers to the quanta of excitation in each vibrational level, is the Greek letter associated to the quantum number, and the symmetry of the state ( or ). For instance, the (020) state corresponds to the , vibrational level in the electronic state; the (020) state corresponds to the , (hence ) vibrational level in the electronic state. When discussing rovibrational transitions in the state, the is often omitted.
3 Results and discussion
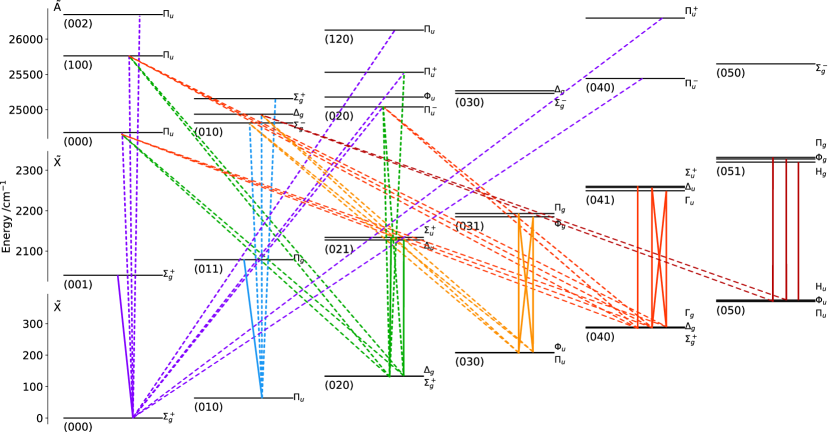
Our rovibronic and rovibrational sets of data are extremely complementary as illustrated in Figure 1, allowing to retrieve both accurate energies and spectroscopic constants for levels involving in the state. With regard to the (00) vibrational levels with , the single fundamental piece of information not accessible using our combined data set alone is the energy of the (010) state (see Figure 1); a value that has fortunately been determined accurately by Schmuttenmaer et al. [40].
3.1 Optical data
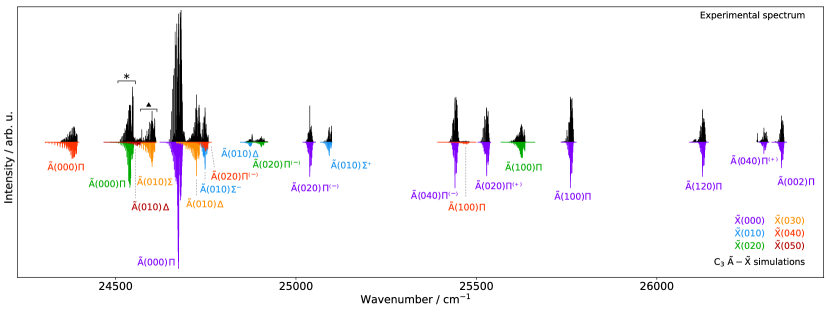
In the 24300–26400 cm-1 region, 36 vibronic bands have been recorded by LIF spectroscopy as summarized in Table 1 and visible on Figure 2. Of these, 17 are reported for the first time. The strongest bands in the optical spectra belong to transitions arising from the (000) state (Figure 2). The PGOPHER software allows to estimate the rotational temperature of each band; it ranges for 20 K to 150 K (see Table S1 in the supplementary material). Typical linewidths reproducing the experimental spectra range from 0.02 cm-1 to 0.04 cm-1. The present measurements are in good agreement with band values previously reported in the literature and often provide more accurate frequencies (see Table S2 in the supplementary material). Thanks to the relatively low rotational temperature combined with the high resolution resulting in well-resolved features, assignments of the new bands are relatively straightforward. Several bands appear heavily perturbed, in particular those involving the (020) and (040) states.
| Vibronic assignment | Band Origina | This work | Literature | ||||
| / cm-1 | Refs. | ||||||
| (000)–(000) | – | 24676 | 24 | 64 | [9, 38, 34, 33, 37, 15] | ||
| u | – | 24679 | 14 | 16 | [38, 34, 37] | ||
| u | – | 24676 | 6 | 8 | [38, 34, 37] | ||
| (020)–(000) | – | 25039 | 14 | 30 | [15, 31] | ||
| – | 25529 | 18 | 50 | [9, 15] | |||
| (040)–(000) | – | 25441 | 14 | 50 | [9, 15] | ||
| – | 26296 | 16 | 4 | [15] | |||
| (002)–(000) | – | 26347 | 14 | 10 | [15] | ||
| (100)–(000) | – | 25761 | 18 | 28 | [9, 15] | ||
| (120)–(000) | – | 26128 | 20 | ||||
| (010)–(010) | – | 24749 | 17 | 47 | [9] | ||
| – | 24872 | 18 | 51 | [9] | |||
| – | 25093 | 17 | 39 | [9] | |||
| (000)–(020) | – | 24543 | 26 | 50 | [9] | ||
| – | 24544 | 30 | 48 | [9] | |||
| u | – | 25546 | 14 | ||||
| u | – | 25458 | 14 | ||||
| u | – | 25542 | 6 | ||||
| (020)–(020) | – | 25906 | 26 | 28 | [31] | ||
| – | 25906 | 25 | 30 | [31] | |||
| (100)–(020) | – | 25629 | 26 | ||||
| – | 25629 | 23 | |||||
| (010)–(030) | – | 24605 | 34 | 35 | [9] | ||
| – | 24607 | 30 | |||||
| – | 24728 | 28 | 30 | [9] | |||
| – | 24729 | 25 | |||||
| (000)–(040) | – | 24389 | 28 | 38 | [9] | ||
| – | 24389 | 28 | |||||
| – | 24391 | 30 | |||||
| (020)–(040) | – | 24752 | 20 | ||||
| – | 24752 | 21 | |||||
| – | 24754 | 21 | |||||
| (100)–(040) | – | 25475 | 24 | ||||
| – | 25475 | 24 | |||||
| (010)–(050) | – | 24565 | 26 | ||||
| – | 24656 | 22 | |||||
a Accurate values can be retrieved from the energies reported in Table S4.
b u and u are perturber states of the (000) state, unidentified so far (see text).
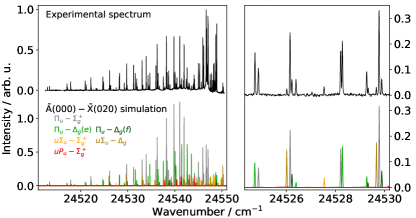
In the (000)–(020) band region, we assign for the first time transitions involving the u and u upper state perturbers, previously only observed in the (000)–(000) band region [38, 34, 37]. In total, 22 transitions are assigned in the bands involving (020): 11 in the u– band (P-, Q-, R-branch; although the single Q-branch assignment remains tentative), 5 in the u– band (P- and R-branch), and 6 transitions in the u– band (P- and R-branch). No transitions are observed for the u– branch. Figure 3 presents an overview of this band system with the sub-bands highlighted in various colors. These transitions are predicted by PGOPHER without setting up a transition moment for the corresponding bands (Table S1 in the supplementary material). One can notice that the simulated intensities of the perturber transitions do not perfectly reproduce the experimental spectrum on Figure 3 (in particular, the u– band intensity is overestimated); we assume that some intensity perturbations are not properly taken into account. The agreement in line position, however, is quite satisfactory. The present assignments thus confirm the assignment of the perturber lines observed in the (000)–(000) region. It is also worth noticing that, on Figure 3, the R-branches of the – and – bands (above 24545 cm-1) appear stronger in the experimental spectrum than on the simulation, and stronger than the Q-branches (the strongest features around 24540 cm-1). Since no rotational temperature allows proper reproduction of such intensity ratios, this intensity difference is either the result of an experimental adjustment during the scan or of some discrepancy in the model that does not properly apply to this band system. For the – band, half of the levels, with even values, was previously observed by Gausset et al. [9]. This peculiarity has led the authors to a better understanding of the -uncoupling in the ground electronic state of \ceC3. In the present study, we are able to assign transitions involving both even and odd values. The transitions involving odd values appear about 5 times weaker on the experimental spectrum than predicted using PGOPHER, and are thus significantly weaker than those involving even values, which may explain why they remained unobserved thus far.
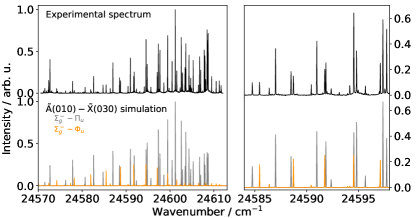
Three bands are observed in this study, namely (010)–(030) – (P-, Q-, and R-branches, Figure 4), (000)–(040) – (P- and Q-branches, tentative assignments in the R-branch, see Figure S3 in the supplementary material), and (020)–(040) – (P- and Q-branches, Figure S4 in the supplementary material). To our knowledge, it is the first time that these transitions are observed for the band. These bands are spectrally intertwined with the corresponding bands arising from the same upper state and their intensity is properly predicted by PGOPHER by perturbation (, even though no transition moment is used to predict them, see Table S1 in the supplementary material). These nominally forbidden transitions appear quite strong both on the simulation and the experimental trace, as visible on Figure 4. We note, however, that again the R-branches of both bands (located above 24605 cm-1) are stronger on the experimental spectrum than predicted by the simulation.
Two bands of the (010)–(050) band system, namely the – and – bands, are observed in this work (see Figure S5 in the supplementary material). Again, to the best of our knowledge, these bands are the first bands of the transition probing the (050) state at high resolution. A single band probing higher quanta of excitation in was previously reported in the literature, the (000)–(060) – band for which Q-branches assignments were proposed by Merer [28]. In the present work, the spectral range where this band lies (around 24217 cm-1) has not been investigated and no other band involving the (060) level is observed, preventing assignments confirmation by combination differences. Additional figures showing overviews of all bands observed in this study are reported in the supplementary material (Figure S6–S17).
3.2 Infrared data
| Vibronic assignment | Band Origina | This work | Literature | ||||
|---|---|---|---|---|---|---|---|
| / cm-1 | Refs. | ||||||
| (001)–(000) | – | 2040 | 60 | 52 | [39, 47] | ||
| (011)–(010) | – | 2015 | 60 | 41 | [47] | ||
| (021)–(020) | – | 2001 | 54 | 32 | [47] | ||
| – | 1994 | 55 | 32 | [47] | |||
| – | 2003 | 20b | |||||
| – | 1992 | 18b | |||||
| (031)–(030) | – | 1985 | 51 | ||||
| – | 1976 | 55 | |||||
| – | 1988 | 23 | |||||
| – | 1973 | 31 | |||||
| (041)–(040) | – | 1973 | 48 | ||||
| – | 1970 | 49 | |||||
| – | 1960 | 49 | |||||
| – | 1956 | 30 | |||||
| – | 1974 | 28 | |||||
| (051)–(050) | – | 1961 | 48 | ||||
| – | 1956 | 34 | |||||
| Hg | – | Hu | 1945 | 44 | |||
a Accurate values can be retrieved from the energies reported in Table 3.
b Tentative assignment.
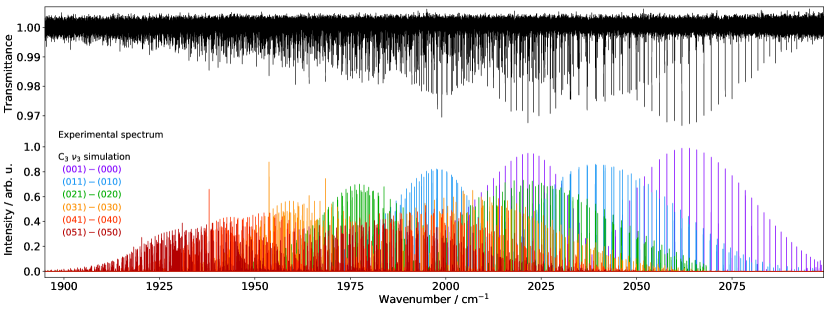
The full FTIR absorption spectrum of \ceC3 recorded in this work is shown in Figure 5. The intense absorption features from CO, H2O, and C2H have been removed from the experimental trace for clarity. The simulated spectrum given in the lower part of the figure is obtained using the PGOPHER software [76] using the band center and rotational constants obtained from our fit (see section 3.3), a Gaussian lineshape with a 0.005 cm-1 width, and assuming a 700 K rotational temperature (which was found to better reproduce the fundamental band; we note that this temperature is higher than that found for CO). The hot band sequence involving increasing values of extends toward lower frequencies as visually indicated by the colored sequence. Figure 5 also illustrates the strong overlap of all the bands observed in this work which causes most of the difficulties in the assignment process. For example, the lines arising from the (051)–(050) bands span over most of the spectral region. Since they are weak and hindered by many other more intense lines, their assignment was challenging. In total, 18 rovibrational bands of \ceC3 have been observed in this study, 14 of them for the first time (see Table 2). A detailed account on this work and available literature of rovibrational data is available in Table S3 in the supplementary material. In this work, the assignment of the infrared data was performed separately from the optical measurements presented in the previous sections and strongly relied on the literature data (including optical studies).
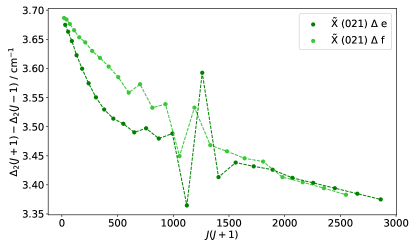
The analysis of the (001)–(000) –, (011)–(010) –, and (021)–(020) – and – bands is rather straightforward thanks to the diode laser experiments performed by Matsumura et al. [39] and Kawaguchi et al. [47]. For all these bands, our observations are perfectly consistent with the literature measurements and allow for an extension of the dataset toward high- values (up to 55–60, see Table 2). The frequency accuracy is slightly improved for the (001)–(000) and (011)–(010) bands (by up to a factor 2, with values as low as 0.0005 cm-1) and similarly for the (021)–(020) bands (see Table S3 in the supplementary material). Our extended dataset and the use of () (see the supplementary material for a detailed explanation) allowed to identify local perturbations in the upper (021) levels manifold. Figure 6 shows the diagrams of the first derivative of the second differences, () values, calculated in the upper states. The highest shift occurs for the (021) manifold at = 35 (the shift corresponds to about 10 times the \ceC3 linewidth), and similar but smaller shifts are observed for the (021) manifold. No notable level shifts are observed in (021) state. The observed perturbations in the state are likely caused by a Coriolis interaction with the (190) manifold, which mixes energy levels with = 0, or , and l = odd. While the (190) state has not yet been detected in SEP measurements, observations of (180) at about 1993 cm-1 puts the (190) state in the right energy range [25].
We report for the first time numerous infrared transitions involving the (031)–(030), (041)–(040), and (051)–(050) hot bands. The assignment procedure relied mainly on combination differences using the work of Gausset et al. [9] (see the supplementary material for a detailed explanation on the procedure). As no combination differences are available for the (030) state, we used the results of successive fits that included -type resonance with the state to secure the assignments. Further confirmation is obtained by GS combination differences using the present optical data. SEP data from Rohlfing and Goldsmith [46] and Northrup and Sears [24], despite their limited resolution, have provided crucial information on states for which little was known so far (vibrational energies and estimated values). In several cases, for example the (051)–(050) band manifold, this provided sufficient information to initiate an analysis.
Rohlfing and Goldsmith [46] reported the vibrational energy of the (051) state [2330.9(5) cm-1] as well as an estimation of the rotational constants for the lowest values [ = 0.4718(13) cm-1]. Using this information, we started our analysis for the and states. Once – transitions were found (up to = 40 for both and transitions), we used the -type resonance to secure the assignments of – and – bands. The intensities of the P branches involving high values are very weak (red-end of our spectrum) and, as for the states of (021), some Coriolis-type resonances seem to complicate the assignments. Figures S18–S23 in the supplementary material show the different infrared band manifolds observed in this study.
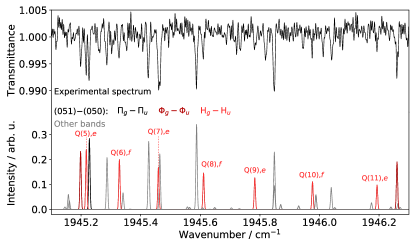
The rotational assignments proposed in this study are confirmed by the observation of several Q-branches, , no shift by one or more quanta of is possible in the proposed assignments. Such a -branch is shown on Figure 7 for the (051)–(050) – band, another example is provided for the (041)–(040) – band in Figure S24 in the supplementary material. Overall, Q-branch transitions were observed, for both and levels, for the (011)–(010) – [Q(1),Q(3)], (021)–(020) – [Q(2), tentative], (031)–(030) – [Q(3)–Q(6)], (041)–(040) – [Q(4)–Q(7)], and (051)–(050) – [Q(3)–Q(5), Q(6) tentative] and – [Q(5)–Q(11)] bands.
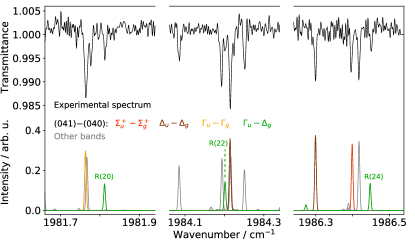
Once all the data were included in PGOPHER, we have also been able to assign some transitions involving bands. An interesting feature of PGOPHER is that it predicts these transitions without inputting a corresponding transition moment for these nominally “forbidden” transitions (similarly to what was described previously for the electronic spectra). For the (021)–(020) bands, the bands are predicted with relatively low intensities; and only features with relatively poor SNR are observed on the experimental spectrum. Only tentative assignments are made (7 for the – and 4 for the – band) and these are not included in the fit. For hot bands involving higher quanta of excitation in , however, these predicted transitions have significant intensity, in particular for high values. Indeed, several features with reasonable SNR are observed on the spectrum as visible on Figure 8 for the (041)–(040) – band. Additional examples are provided in the supplementary material for the (031)–(030) – and – bands (Figure S25) and the (041)–(040) – (Figure S26). These “cross-ladder” transitions (if we refer to levels of a given value for a specific state as a ladder) provide constraints on the energy difference between the various levels of the vibrational levels for which they are observed.
In the high frequency part of the spectrum, most of the transitions can be assigned to the \ceC3 molecule (see for instance figure 8 and figure S27 in the supplementary material). Toward the lower end of the spectrum, however, many transitions remain unassigned. These transitions probably arise from the R-branches of the (061)–(060) bands but assigning this spectrum has not been possible despite our best efforts, mainly because the signal-to-noise ratio is rather poor in that region and spectroscopic assignments are challenging on the basis on a single branch.
3.3 Combined fit
3.3.1 Dataset
The unique feature of the present work is that it becomes possible to combine the optical and infrared data sets. Available data from the literature and the present work for the rovibronic and all rovibrational transitions are listed in Tables S2 and S3 in the supplementary material. These detailed tables contain the values, frequency uncertainties used in the combined fit, and the frequency offset eventually applied to the data. All available data and rovibrational transitions in the electronic GS (, data with list of assignments provided in the literature) are included in the present fit with one exception, namely the work of Balfour et al. [27] who reported the spectroscopic assignments for five transitions. One of the rovibronic band observed by Balfour et al. [27], the (020)–(000) – band, was re-investigated by Tokaryk and Chomiak [31] who proposed a different spectroscopic assignment. In the present study, our assignments are in line with those of Tokaryk and Chomiak [31]. Additionally, we propose in this work an alternative spectroscopic assignment for the (002)–(000) – band compared to Balfour et al. [27]. Finally, when performing the combined fit, we noticed that the spectroscopic assignments proposed by Balfour et al. [27] in the (200)–(000) – band are incompatible with those of the (200)–(200) – from Merer [28]. Since assignments from Merer [28] have proven consistent with literature data for the other bands they reported, we decided to only include the Merer values. There is no literature data able to confirm or infirm the spectroscopic assignments of the remaining two bands observed by Balfour et al. [27]; at this stage we have chosen not to include these data in our fit.
As previously noted by Saha and Western [51], a serious difficulty arises in high resolution combination fits when rovibronic data are included from different light sources, as (small) spectral offsets are intrinsic to this approach. This can be overcome by shifting the frequencies of one dataset by this offset value. It is often challenging, however, to determine which dataset presents an offset from the absolute transitions rest frequencies. The impact of this issue is relatively limited because only the absolute energy of the upper state is affected while the accuracy of the rotational constants and overall fit is not. In the present study, small offsets (typically of the order of several hundredths of a cm-1) are applied to several rovibronic datasets (see Table S2 for a detailed list of concerned data and offset values). We use the frequency offsets established by other authors from the literature when available (for instance, an offset of cm-1 was determined for the data of Gausset et al. [9] by Tanabashi et al. [33]) for consistency reasons. When not available in the literature, we determine these offsets ourselves. Overall, offsets values range from 0.02 to 0.12 cm-1, hence the absolute energies in the state may be affected by these amounts.
As much as possible, data are included in the fit at their experimental accuracy (see Table S2 for typical values for each dataset). When no frequency accuracy was provided, we assume a value based on the dispersion of the frequencies from our best model. In some instances, the literature data are provided with an upper limit for the frequency error but the residuals from the fit show that this value is over-estimated. For example, the uncertainty on line frequency is assumed to be better than 0.01 cm-1 for the (000)–(000) transitions reported by Zhang et al. [34] while the residuals from our fit show that the line accuracy is probably more of the order of 0.005 cm-1; that value is thus used in the present fit. It has proven challenging to treat such a large dataset for one molecule subject to clear perturbations with transitions significantly deviating from the fit. Transitions severely perturbed are excluded from the fit while transitions slightly diverging are kept in the fit but with an increased frequency error (hence a lower weight), typically by a factor 10, in order to maintain a global deviation for the combined fit. Overall, the dataset contains 4425 observations (3957 rovibronic and 1468 rovibrational transitions) including 2046 (1106 rovibronic and 940 rovibrational transitions) from this work. The full dataset is available as electronic files as part of the supplementary material (these files also contain the transitions not included in the present fit).
3.3.2 Hamiltonian
The PGOPHER Hamiltonian used for the combined fit is similar to the previous studies using PGOPHER on \ceC3. One difference with the work of Haddad et al. [37] is that we expressed the Hamiltonian in terms of the rotational angular momentum of the nuclear framework, , in order to obtain energy levels and rotational constants comparable with most of the literature data. It is worth noting that the specific Hamiltonian used by the PGOPHER software differs from the conventional Hamiltonian for a linear molecule developed for instance by Yamada et al. [79]. The off-diagonal constants accounting for -type doubling are expressed as perturbation terms between two states, which results in several values for a given vibrational level instead of a more physically-relevant single one (see Table S4). For example, for the (050) vibrational level there are three different values: one for the state, and two defined as and . The resulting PGOPHER files together with details on their construction are provided in the Supplementary Material.
The perturbation analysis for the (000) state is carried out using the same effective Hamiltonian as reported in Haddad et al. [37], with the two perturbing and states identified in the literature treated as three perturbing states with the and levels of the state treated separately. The resulting states are labeled u, u, and u. As in Haddad et al. [37], the spin-spin interaction constant was fixed to 0.1 cm-1 in the u state. Table S5 in the supplementary material presents the resulting constants in these perturbing states.
3.3.3 Fit results
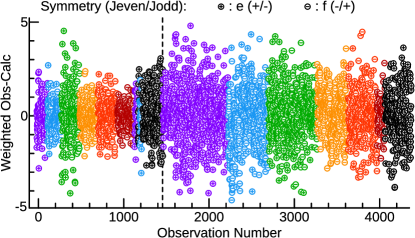
A total of 340 parameters have been adjusted to reproduce more than 4400 experimental data with a rms of 0.041 cm-1 and a reduced standard deviation of 1.3. Figure 9 displays the residuals of the fit with a color coding based on the () level involved in the transition (the same as in Figure 1). Overall, the fit is quite satisfactory. One can notice that the infrared (021)–(020) transitions (in green, around observation #400) are among those the least well reproduced by the fit as a result of severe perturbations in the (021) level.
The full list of parameters is reported in Tables S4 and S5 in the supplementary material, and a subset of parameters pertaining to the (00) levels is reported in Table 3 where they are compared to available literature data. Only five parameters could not be determined in the present fit, the energies of five levels [(110), (300), (400), (500), (600)] involved each in a single rovibrational transition for which no cross-correlating data exist.
| Level | ||||||||||||
|---|---|---|---|---|---|---|---|---|---|---|---|---|
| (000) | This work | |||||||||||
| Ref. [47] | ||||||||||||
| (010) | This work | |||||||||||
| Ref. [47]a | ||||||||||||
| (020) | This work | |||||||||||
| Ref. [47] | ||||||||||||
| This work | ||||||||||||
| Ref. [47]a | ||||||||||||
| This work | ||||||||||||
| (030) | This work | |||||||||||
| Ref. [9] | ||||||||||||
| This work | ||||||||||||
| This work | ||||||||||||
| (040) | This work | |||||||||||
| Ref. [9] | ||||||||||||
| This work | ||||||||||||
| This work | ||||||||||||
| This work | ||||||||||||
| This work | ||||||||||||
| (050) | This work | |||||||||||
| This work | ||||||||||||
| This work | ||||||||||||
| This work | ||||||||||||
| This work | ||||||||||||
a Average values of the and components reported by the authors.
4 Prediction of hot bands
The present modeling of \ceC3 in its electronic ground and states can be used to predict further transitions not directly observable. This is particularly interesting for the hot bands of the fundamental that remain elusive in the laboratory to date. Table 4 contains lists of predicted transitions for the (020)–(010) and (030)–(020) band systems. These transitions have been calculated using PGOPHER and the final set of parameters reported in Table 3. One limitation of PGOPHER is that the list of energies does not carry frequency error information, hence we cannot convey these errors to the transitions frequencies. However, based of the frequency errors of the transitions used to determine these energies, and the overall good quality of the fit, we estimate the accuracy of these transition frequencies to be of the order of 0.005 cm-1 (150 MHz).
| P | Q | R | P | Q | R | P | Q | R | |||
| (020)–(010) | (020)–(010) | ||||||||||
| 1 | 68.947() | 71.657() | 70.088() | ||||||||
| 2 | 69.864() | 68.296 () | 71.015() | ||||||||
| 3 | 67.261() | 73.589() | 65.693 () | 68.412 () | 72.029() | ||||||
| 4 | 69.959() | 64.782 () | 68.399 () | 72.936() | |||||||
| 5 | 65.678() | 75.634() | 64.118 () | 68.655 () | 74.058() | ||||||
| 6 | 70.123() | 63.144 () | 68.547 () | 74.918() | |||||||
| (030)–(020) | (030)–(020) | (030)–(020) | |||||||||
| 0 | 75.074() | ||||||||||
| 1 | |||||||||||
| 2 | 72.364() | 74.247() | 76.917() | 73.933 () | 75.816 () | 78.486 () | 75.841 () | ||||
| 3 | 73.097 () | 75.767 () | 79.617 () | 73.122 () | 76.824 () | ||||||
| 4 | 70.589() | 74.440() | 78.788() | 72.149 () | 76.000 () | 80.348 () | 69.505 () | 73.206 () | 77.830 () | ||
| 5 | 71.463 () | 75.811 () | 81.712 () | 68.670 () | 73.294 () | 78.842 () | |||||
| 6 | 68.831() | 74.732() | 80.682() | 70.408 () | 76.309 () | 82.258 () | 67.890 () | 73.438 () | 79.902 () | ||
5 Astronomical implications
Due to the extremely low bending frequency of \ceC3, even in an environment at moderate temperature its low excited bending vibrational levels (010), at 63 cm-1 (91 K), and (020), at cm-1 (191 K), can be thermally populated significantly. Indeed, at 100 K, 29 % and 13 % of the GS population lies in each of these levels; at 50 K, these numbers drop down to 14 % and 2 %, which remains significant for an abundant molecule. Hence, hot bands may be detectable in various environments of the interstellar medium where \ceC3 is abundant. Unambiguous detections, , beyond the line confusion limit, become possible when astronomical data can be compared to accurate submillimeter laboratory data (with sub-MHz resolution) that will strongly benefit from the predictions made here. Given the accurate parameters derived here, even without such laboratory data it should be possible to identify these excited transitions in astronomical data. The 0.005 cm-1 (150 MHz) accuracy of our predictions corresponds to a velocity uncertainty of = 23.6 kms-1. Since the linewidth of observed spectra of \ceC3 fundamental band in star forming region ranges from 5 to 12 kms-1 [19, 20, 80, 81], we conclude that our data can be used to search for \ceC3 hot bands. Measurement of \ceC3 in excited states and determination of its abundance and excitation temperature may give new insights into the chemistry of its formation and will add further information to derive the origin of small and possibly also longer carbon chains in the ISM.
6 Conclusion
This work presents the most complete spectroscopic study of \ceC3 to date. Through the combination of infrared and optical transitions precise vibrational energies and rotational constants for the low-lying bending modes of \ceC3 are determined up to , significantly extending our knowledge of the rovibrational manifold of the electronic GS. The measured and predicted transition frequencies presented here can be used in astronomical observations in both the optical, infrared, and far-infrared, increasing the effectiveness of \ceC3 as a probe of the physical and chemical environment of the target. PGOPHER files allowing the full simulation of all known bands of system are given in the supplementary material so that further improvements of the laboratory spectroscopy of this molecule can be directly incorporated in the model.
7 Acknowledgments
This manuscript comprises of two datasets. The project started with LIF measurements at USTC (recorded in 2017) and upon analysis it became clear that combining these with non-published infrared measurements recorded at SOLEIL in 2010 offered a unique opportunity for a very complete spectroscopic study of the \ceC3 radical. PGOPHER is ideal to merge the two large data sets. Given all involved spectroscopic challenges, we asked Colin Western for help, and as usual were helped on the spot and far beyond, resulting in his co-authorship. Along the way of finishing this manuscript, Colin sadly passed away. We dedicate this manuscript to his memory.
We acknowledge financial support
from the National Natural Science Foundation of China (22173089 and 21827804), the Netherlands Organization for Scientific Research (NWO) through a VICI grant, the Netherlands Research School for Astronomy (NOVA), and the Programme National “Physique et Chimie du Milieu Interstellaire” (PCMI) of CNRS/INSU with INC/INP co-funded by CEA and CNES. DT acknowledges funding from the Natural Sciences and Engineering Research Council of Canada in the form of a Discovery grant.
Part of this work was performed at the SOLEIL facility under the proposal 20100296.
8 Authors contributions
Marie-Aline Martin-Drumel: Investigation, Formal analysis, Writing – original draft; Writing – review & editing; Qiang Zhang: Investigation, Formal analysis, Methodology, Writing – original draft, Writing –- review & editing; Kirstin Doney: Investigation, Formal analysis, Writing – original draft; Writing – review & editing; Olivier Pirali: Conceptualization, Investigation, Formal analysis, Writing – original draft; Writing – review & editing; Michel Vervloet: Investigation, Formal analysis, Writing – review & editing; Dennis Tokaryk: Conceptualization, Investigation, Writing – review & editing; Colin Western: Software; Harold Linnartz: Resources, Supervision, Writing – review & editing; Yang Chen: Conceptualization, Investigation; Supervision; Writing -– review & editing Dongfeng Zhao: Conceptualization, Investigation, Supervision, Writing –- review & editing.
References
- Huggins [1882] W. Huggins, Preliminary note on the photographic spectrum of comet b 1881, Proc. Roy. Soc. London 33 (1882) 1–3. doi:10.1098/rspl.1881.0060.
- Swings et al. [1941] P. Swings, C. T. Elvey, H. W. Babcock, The spectrum of comet cunningham, 1940C, Astrophys. J. 94 (1941) 320. doi:10.1086/144336.
- Swings [1942] P. Swings, Molecular bands in cometary spectra. identifications, Rev. Mod. Phys. 14 (1942) 190–194. doi:10.1103/RevModPhys.14.190.
- McKellar [1948] A. McKellar, The far violet region in the spectra of the cool carbon stars, Astrophys. J. 108 (1948) 453. doi:10.1086/145080.
- Raffety [1916] C. W. Raffety, LX. On some investigations of the spectra of carbon and hydrocarbon, London, Edinburgh Dublin Philos. Mag. J. Sci. 32 (1916) 546–559.
- Herzberg [1942] G. Herzberg, Laboratory production of the 4050 group occurring in cometary spectra; Future evidence for the presence of CH2 molecules in comets., Astrophys. J. 96 (1942) 314–315. doi:10.1086/144464.
- Douglas [1951] A. E. Douglas, Laboratory studies of the 4050 group of cometary spectra., Astrophys. J. 114 (1951) 466. doi:10.1086/145486.
- Gausset et al. [1963] L. Gausset, G. Herzberg, A. Lagerqvist, B. Rosen, Spectrum of the \ceC3 molecule, Discuss. Faraday Soc. 35 (1963) 113–117. doi:10.1039/DF9633500113.
- Gausset et al. [1965] L. Gausset, G. Herzberg, A. Lagerqvist, B. Rosen, Analysis of the 4050-Å group of the \ceC3 molecule, Astrophys. J. 142 (1965) 45. doi:10.1086/148262.
- Maier et al. [2001] J. P. Maier, N. M. Lakin, G. A. H. Walker, D. A. Bohlender, Detection of C3 in diffuse interstellar clouds, Astrophys. J. 553 (2001) 267–273. doi:10.1086/320668.
- Roueff et al. [2002] E. Roueff, P. Felenbok, J. H. Black, C. Gry, Interstellar \ceC3 toward HD 210121, Astron. Astrophys. 384 (2002) 629–637. doi:10.1051/0004-6361:20020067.
- Oka et al. [2003] T. Oka, J. A. Thorburn, B. J. McCall, S. D. Friedman, L. M. Hobbs, P. Sonnentrucker, D. E. Welty, D. G. York, Observations of C3 in translucent sight lines, Astrophys. J. 582 (2003) 823.
- Ádámkovics et al. [2003] M. Ádámkovics, G. A. Blake, B. J. McCall, Observations of rotationally resolved \ceC3 in translucent sight lines, Astrophys. J. 595 (2003) 235. doi:10.1086/377305.
- Welty et al. [2012] D. E. Welty, J. C. Howk, N. Lehner, J. H. Black, Detection of interstellar \ceC2 and \ceC3 in the Small Magellanic Cloud, Mon. Not. R. Astron. Soc. 428 (2012) 1107–1115. doi:10.1093/mnras/sts093.
- Schmidt et al. [2014] M. R. Schmidt, J. Krełowski, G. A. Galazutdinov, D. Zhao, M. A. Haddad, W. Ubachs, H. Linnartz, Detection of vibronic bands of C3 in a translucent cloud towards HD 169454, Mon. Not. R. Astron. Soc. 441 (2014) 1134–1146. doi:10.1093/mnras/stu641.
- Cochran and Cochran [2002] A. Cochran, W. Cochran, A high spectral resolution atlas of Comet 122P/de vico, ICARUS 157 (2002) 297–308. doi:10.1006/icar.2002.6850.
- Hinkle et al. [1988] K. W. Hinkle, J. J. Keady, P. F. Bernath, Detection of C3 in the circumstellar shell of IRC+10216, Science 241 (1988) 1319–1322. doi:10.1126/science.241.4871.1319.
- Cernicharo et al. [2000] J. Cernicharo, J. R. Goicoechea, E. Caux, Far-infrared detection of C3 in Sagittarius B2 and IRC +10216, Astrophys. J. Lett. 534 (2000) L199–L202. doi:10.1086/312668.
- Giesen et al. [2001] T. F. Giesen, A. O. V. Orden, J. D. Cruzan, R. A. Provencal, R. J. Saykally, R. Gendriesch, F. Lewen, G. Winnewisser, Interstellar Detection of CCC and High-Precision Laboratory Measurements near 2 THz, Astrophys. J. 551 (2001) L181–L184. doi:10.1086/320024.
- Mookerjea et al. [2010] B. Mookerjea, T. Giesen, J. Stutzki, J. Cernicharo, J. R. Goicoechea, M. De Luca, T. A. Bell, H. Gupta, M. Gerin, C. M. Persson, P. Sonnentrucker, Z. Makai, J. Black, F. Boulanger, A. Coutens, E. Dartois, P. Encrenaz, E. Falgarone, T. Geballe, B. Godard, P. F. Goldsmith, C. Gry, P. Hennebelle, E. Herbst, P. Hily-Blant, C. Joblin, M. Kaźmierczak, R. Kołos, J. Krełowski, D. C. Lis, J. Martin-Pintado, K. M. Menten, R. Monje, J. C. Pearson, M. Perault, T. G. Phillips, R. Plume, M. Salez, S. Schlemmer, M. Schmidt, D. Teyssier, C. Vastel, S. Yu, P. Dieleman, R. Güsten, C. E. Honingh, P. Morris, P. Roelfsema, R. Schieder, A. G. G. M. Tielens, J. Zmuidzinas, Excitation and abundance of C 3 in star forming cores: Herschel /HIFI observations of the sight-lines to W31C and W49N, Astron. Astrophys. 521 (2010) L13. doi:10.1051/0004-6361/201015095.
- Weltner and McLeod [1966] W. Weltner, D. McLeod, Spectroscopy of Carbon Vapor Condensed in Rare-Gas Matrices at 4 K. III, J. Chem. Phys. 45 (1966) 3096–3105. doi:10.1063/1.1728066.
- Smith et al. [1987] R. S. Smith, M. Anselment, L. F. DiMauro, J. M. Frye, T. J. Sears, Laser induced fluorescence study of the transition of the furan cation in a supersonic free jet expansion, J. Chem. Phys. 87 (1987) 4435–4446. doi:10.1063/1.452856.
- Smith et al. [1988] R. S. Smith, M. Anselment, L. F. DiMauro, J. M. Frye, T. J. Sears, Erratum: Laser induced fluorescence study of the transition of the furan cation in a supersonic free jet expansion [J. Chem. Phys. 87, 4435 (1987)], J. Chem. Phys. 89 (1988) 2591–2592. doi:10.1063/1.455740.
- Northrup and Sears [1989] F. J. Northrup, T. J. Sears, Observation of stimulated emission pumping spectra of jet-cooled NCS and C3, Chem. Phys. Lett. 159 (1989) 421–425. doi:10.1016/0009-2614(89)87510-4.
- Northrup and Sears [1990] F. J. Northrup, T. J. Sears, Stimulated-emission pumping spectroscopy study of jet-cooled C3: pure bending levels and bend–symmetric-stretch combination levels of , J. Opt. Soc. Am. B 7 (1990) 1924–1934. doi:10.1364/JOSAB.7.001924.
- Rohlfing and Goldsmith [1990] E. A. Rohlfing, J. E. M. Goldsmith, Stimulated-emission pumping spectroscopy of jet-cooled \ceC3: Antisymmetric stretch–bend levels, J. Opt. Soc. Am. B 7 (1990) 1915. doi:10.1364/JOSAB.7.001915.
- Balfour et al. [1994] W. J. Balfour, J. Cao, C. V. V. Prasad, C. X. W. Qian, Laser-induced fluorescence spectroscopy of the transition in jet-cooled C3, J. Chem. Phys. 101 (1994) 10343–10349. doi:10.1063/1.467914.
- Merer [1967] A. J. Merer, Absorption spectra of \ceC3 and \ceC3H2 from the flash photolysis of diazopropyne, Can. J. Phys. 45 (1967) 4103–4111. doi:10.1139/p67-342.
- Izuha and Yamanouchi [1995] M. Izuha, K. Yamanouchi, New vibronic bands of the laser-vaporized \ceC3 cluster. Determination of the fundamental in the state, Chem. Phys. Lett. 242 (1995) 435–442. doi:10.1016/0009-2614(95)00758-V.
- Izuha and Yamanouchi [1998] M. Izuha, K. Yamanouchi, New Vibronic Bands of Laser-Vaporized \ceC3, J. Chem. Phys. 109 (1998) 1810–1818. doi:10.1063/1.476756.
- Tokaryk and Chomiak [1997] D. W. Tokaryk, D. E. Chomiak, Laser spectroscopy of \ceC3: Stimulated emission and absorption spectra of the transition, J. Chem. Phys. 106 (1997) 7600–7608. doi:10.1063/1.473762.
- Baker et al. [1997] J. Baker, S. K. Bramble, P. A. Hamilton, Observation of new bands in the laser induced fluorescence spectrum of \ceC3, J. Mol. Spectrosc. 183 (1997) 6–11. doi:10.1006/jmsp.1996.7235.
- Tanabashi et al. [2005] A. Tanabashi, T. Hirao, T. Amano, P. F. Bernath, Fourier transform emission spectra of the (000)–(000) band of the 4051.6 band of \ceC3, Astrophys. J. 624 (2005) 1116–1120. doi:10.1086/429316.
- Zhang et al. [2005] G. Zhang, K.-S. Chen, A. J. Merer, Y.-C. Hsu, W.-J. Chen, S. Shaji, Y.-A. Liao, The 4051 Å band of C3 (, 000–000): Perturbed low- lines and lifetime measurements, J. Chem. Phys. 122 (2005) 244308. doi:10.1063/1.1928827.
- Chen et al. [2010] C.-W. Chen, A. J. Merer, J.-M. Chao, Y.-C. Hsu, Laser excitation spectrum of \ceC3 in the region 26000–30700 cm-1, J. Mol. Spectrosc. 263 (2010) 56–70. doi:10.1016/j.jms.2010.06.010.
- Chen et al. [2011] K.-S. Chen, G. Zhang, A. Merer, Y.-C. Hsu, W.-J. Chen, The , 011 () vibrational level of \ceC3, J. Mol. Spectrosc. 267 (2011) 169–171. doi:10.1016/j.jms.2011.03.011.
- Haddad et al. [2014] M. A. Haddad, D. Zhao, H. Linnartz, W. Ubachs, Rotationally resolved spectra of the 4051 Å comet band of C3 for all six 12C and 13C isotopologues, J. Mol. Spectrosc. 297 (2014) 41–50. doi:10.1016/j.jms.2014.01.010.
- McCall et al. [2003] B. McCall, R. Casaes, M. Ádámkovics, R. Saykally, A re-examination of the 4051 Å band of \ceC3 uing cavity ringdown spectroscopy of a supersonic plasma, Chem. Phys. Lett. 374 (2003) 583–586. doi:10.1016/S0009-2614(03)00769-3.
- Matsumura et al. [1988] K. Matsumura, H. Kanamori, K. Kawaguchi, E. Hirota, Infrared diode laser kinetic spectroscopy of the band of C3, J. Chem. Phys. 89 (1988) 3491–3494. doi:10.1063/1.454919.
- Schmuttenmaer et al. [1990] C. A. Schmuttenmaer, R. C. Cohen, N. Pugliano, J. R. Heath, A. L. Cooksy, K. L. Busarow, R. J. Saykally, Tunable far-IR laser spectroscopy of jet-cooled carbon clusters: the bending vibration of C3, Science 249 (1990) 897–900. doi:10.1126/science.11538082.
- Van Orden et al. [1995] A. Van Orden, J. D. Cruzan, R. A. Provencal, T. F. Giesen, R. J. Saykally, R. T. Boreiko, A. L. Betz, in: Proc. Airborne Astronomy Symp. on the Galactic Ecosystem, 1995, p. 67. Van Orden, A., Cruzan, J. D., Provencal, R. A., Giesen, T. F., Saykally, R. J., Boreiko, R. T., & Betz, A. L. 1995, in ASP Conf. Ser. 73, , ed. M. R. Haas, J. A. Davidson, & E. F. Erickson (San Francisco: ASP), 67.
- Gendriesch et al. [2003] R. Gendriesch, K. Pehl, T. Giesen, G. Winnewisser, F. Lewen I., Terahertz spectroscopy of linear triatomic CCC: High precision laboratory measurement and analysis of the ro-vibrational bending transitions, Z. Naturforsch. A 58 (2003). doi:10.1515/zna-2003-2-310.
- Breier et al. [2016] A. A. Breier, T. Büchling, R. Schnierer, V. Lutter, G. W. Fuchs, K. M. T. Yamada, B. Mookerjea, J. Stutzki, T. F. Giesen, Lowest bending mode of 13C-substituted \ceC3 and an experimentally derived structure, J. Chem. Phys. 145 (2016) 234302. doi:10.1063/1.4971854.
- Krieg et al. [2013] J. Krieg, V. Lutter, C. P. Endres, I. H. Keppeler, P. Jensen, M. E. Harding, J. Vázquez, S. Schlemmer, T. F. Giesen, S. Thorwirth, High-resolution spectroscopy of C3 around 3 µm, J. Phys. Chem. A 117 (2013) 3332–3339. doi:10.1021/jp3119204.
- Schröder et al. [2018] B. Schröder, K. D. Doney, P. Sebald, D. Zhao, H. Linnartz, Stretching our understanding of c3: Experimental and theoretical spectroscopy of highly excited states ( and ), J. Chem. Phys. 149 (2018) 014302. doi:10.1063/1.5034092.
- Rohlfing and Goldsmith [1989] E. A. Rohlfing, J. E. M. Goldsmith, Stimulated emission pumping spectroscopy of jet-cooled \ceC3, J. Chem. Phys. 90 (1989) 6804–6805. doi:10.1063/1.456300.
- Kawaguchi et al. [1989] K. Kawaguchi, K. Matsumura, H. Kanamori, E. Hirota, Diode laser spectroscopy of \ceC3: The , , and bands, J. Chem. Phys. 91 (1989) 1953–1957. doi:10.1063/1.457054.
- Jensen et al. [1992] P. Jensen, C. M. Rohlfing, J. Almlöf, Calculation of the complete-active-space self-consistent-field potential-energy surface, the dipole moment surfaces, the rotation–vibration energies, and the vibrational transition moments for C3(X ), J. Chem. Phys. 97 (1992) 3399–3411. doi:10.1063/1.462976.
- Mladenović et al. [1994] M. Mladenović, S. Schmatz, P. Botschwina, Large-scale ab initio calculations for \ceC3, J. Chem. Phys. 101 (1994) 5891–5899. doi:10.1063/1.467305.
- Schröder and Sebald [2016] B. Schröder, P. Sebald, High-level theoretical rovibrational spectroscopy beyond fc-CCSD(T): The C3 molecule, J. Chem. Phys. 144 (2016) 044307. doi:10.1063/1.4940780.
- Saha and Western [2006] S. Saha, C. M. Western, Experimental and ab initio study of a new state of the \ceC3 radical, J. Chem. Phys. 125 (2006) 224307. doi:10.1063/1.2399528.
- Sasada et al. [1991] H. Sasada, T. Amano, C. Jarman, P. F. Bernath, A new triplet band system of \ceC3: The transition, J. Chem. Phys. 94 (1991) 2401–2407. doi:10.1063/1.460710.
- Tokaryk and Civiš [1995] D. W. Tokaryk, S. Civiš, Infrared emission spectra of \ceC3: the Renner effect in the and electronic states, J. Chem. Phys. 103 (1995) 3928–3941. doi:10.1063/1.469580.
- Lemire et al. [1989] G. W. Lemire, Z. Fu, Y. M. Hamrick, S. Taylor, M. D. Morse, New electronic band systems of jet-cooled carbon trimer: 266-302 nm, J. Phys. Chem. 93 (1989) 2313–2319. doi:10.1021/j100343a024.
- Clusius and Douglas [1954] K. Clusius, A. E. Douglas, The 4050 bands of the \ce^13C3 molecule, Can. J. Phys. 32 (1954) 319–325. doi:10.1139/p54-030.
- Zhang et al. [2021] Q. Zhang, J. Gu, K. D. Doney, H. Linnartz, Y. Chen, D. Zhao, High-resolution laser spectroscopy of the transition of \ce^13C^12C^12C and \ce^12C^13C^12C, J. Mol. Spectrosc. 378 (2021) 111455. doi:10.1016/j.jms.2021.111455.
- Moazzen-Ahmadi and McKellar [1993] N. Moazzen-Ahmadi, A. R. W. McKellar, Infrared diode laser spectroscopy of the fundamental and sequence bands of 13C3 and of the fundamental band of 12C–12C–13C, J. Chem. Phys. 98 (1993) 7757–7762. doi:10.1063/1.464583.
- Nicolas et al. [2006] C. Nicolas, J. Shu, D. S. Peterka, M. Hochlaf, L. Poisson, S. R. Leone, M. Ahmed, Vacuum ultraviolet photoionization of \ceC3, J. Am. Chem. Soc. 128 (2006) 220 –226. doi:10.1021/ja055430+.
- Weltner and Van Zee [1989] W. Weltner, R. J. Van Zee, Carbon molecules, ions, and clusters, Chem. Rev. 89 (1989) 1713–1747. doi:10.1021/cr00098a005.
- Van Orden and Saykally [1998] A. Van Orden, R. J. Saykally, Small carbon clusters: spectroscopy, structure, and energetics, Chem. Rev. 98 (1998) 2313–2358. doi:10.1021/cr970086n.
- Hassel et al. [2011] G. E. Hassel, N. Harada, E. Herbst, Carbon-chain species in warm-up models, Astrophys. J. 743 (2011) 182. doi:10.1088/0004-637x/743/2/182.
- Rousselot et al. [2001] P. Rousselot, C. Arpigny, H. Rauer, A. L. Cochran, R. Gredel, W. D. Cochran, J. Manfroid, A. Fitzsimmons, A fluorescence model of the \ceC3 radical in comets, Astron. Astrophys. 368 (2001) 689–699. doi:10.1051/0004-6361:20000578.
- Kaiser [2002] R. I. Kaiser, Experimental investigation on the formation of carbon-bearing molecules in the interstellar medium via neutral-neutral reactions, Chem. Rev. 102 (2002) 1309–1358. doi:10.1021/cr970004v.
- Zhang et al. [2017] D. Zhang, Q. Zhang, B. Zhu, J. Gu, B. Suo, Y. Chen, D. Zhao, High-resolution electronic spectra of yttrium oxide (YO): The D–X transition, J. Chem. Phys. 146 (2017) 114303. doi:10.1063/1.4978335.
- Zhang et al. [2018] Q. Zhang, D. Zhang, B. Zhu, J. Gu, Z. Xiao, C. Yu, Y. Chen, D. Zhao, Rotationally resolved spectrum of the B 1A′ – X 1A′ 0 0 0 band of CuSH, J. Mol. Spectrosc. 350 (2018) 27–29. doi:10.1016/j.jms.2018.05.007.
- Zhang et al. [2020] Q. Zhang, D.-p. Zhang, B.-x. Zhu, J.-w. Gu, D.-f. Zhao, Y. Chena, Reinvestigate the C – X (0,0) band of AgO, Chin. J. Chem. Phys. 33 (2020) 75–78. doi:10.1063/1674-0068/cjcp1912223.
- Motylewski and Linnartz [1999] T. Motylewski, H. Linnartz, Cavity ring down spectroscopy on radicals in a supersonic slit nozzle discharge, Rev. Sci. Instrum. 70 (1999) 1305–1312. doi:10.1063/1.1149589.
- Zhang et al. [2017] Q. Zhang, B. Zhu, D. Zhang, J. Gu, D. Zhao, Y. Chen, Note: Pulsed single longitudinal mode optical parametric oscillator for sub-Doppler spectroscopy of jet cooled transient species, Rev. Sci. Instrum. 88 (2017) 126108. doi:10.1063/1.5009962.
- Martin-Drumel et al. [2011] M. A. Martin-Drumel, O. Pirali, D. Balcon, P. Bréchignac, P. Roy, M. Vervloet, High resolution far-infrared Fourier transform spectroscopy of radicals at the AILES beamline of SOLEIL synchrotron facility, Rev. Sci. Instrum. 82 (2011). doi:10.1063/1.3660809.
- Martin-Drumel et al. [2012] M. A. Martin-Drumel, S. Eliet, O. Pirali, M. Guinet, F. Hindle, G. Mouret, A. Cuisset, New investigation on THz spectra of OH and SH radicals (X ), Chem. Phys. Lett. 550 (2012) 8–14. doi:10.1016/j.cplett.2012.08.027.
- Martin-Drumel et al. [2014] M. A. Martin-Drumel, O. Pirali, M. Vervloet, Synchrotron based ft-fir pure rotational spectroscopy of the \ceNH2 radical in its two lowest vibrational states, J. Phys. Chem. A 118 (2014) 1331–1338. doi:10.1021/jp406618s.
- Wappelhorst et al. [1997] M. H. Wappelhorst, S. Saupe, B. Meyer, T. George, W. Urban, A. LeFloch, Sub-Doppler heterodyne frequency measurements on isotopic species of carbon monoxide and improved frequencies for secondary standards near 60 THz, J. Mol. Spectrosc. 181 (1997) 357–362. doi:10.1006/jmsp.1996.7182.
- Schneider et al. [1990a] M. Schneider, J. S. Wells, A. G. Maki, Heterodyne frequency measurements of 12C16O laser transitions near 2050 cm-1, J. Mol. Spectrosc. 139 (1990a) 432–438. doi:10.1016/0022-2852(90)90078-5.
- Schneider et al. [1990b] M. Schneider, J. S. Wells, A. G. Maki, Erratum: Heterodyne frequency measurements of 12C16O laser transitions near 2050 cm-1, J. Mol. Spectrosc. 141 (1990b) 351–351.
- Davis et al. [2001] S. P. Davis, M. C. Abrams, J. W. Brault, Fourier Transform spectrometry, Academic Press, San Diego, 2001. doi:10.1016/B978-012042510-5/50009-3.
- Western [2017] C. M. Western, PGOPHER: A program for simulating rotational, vibrational and electronic spectra, J. Quant. Spectrosc. Radiat. Transfer 186 (2017) 221–242. doi:10.1016/j.jqsrt.2016.04.010.
- Loos et al. [2017] J. Loos, M. Birk, G. Wagner, Measurement of positions, intensities and self-broadening line shape parameters of lines in the spectral ranges 1850–2280 cm-1 and 2390–4000 cm-1, J. Quant. Spectrosc. Radiat. Transfer 203 (2017) 119–132. doi:10.1016/j.jqsrt.2017.02.013.
- Kanamori et al. [1987] H. Kanamori, K. Seki, E. Hirota, Infrared diode laser kinetic spectroscopy of the CCH radical band, J. Chem. Phys. 87 (1987) 73–76. doi:10.1063/1.453571.
- Yamada et al. [1985] K. M. Yamada, F. Birss, M. Aliev, Effective hamiltonian for polyatomic linear molecules, Journal of Molecular Spectroscopy 112 (1985) 347–356. doi:10.1016/0022-2852(85)90166-3.
- Mookerjea et al. [2012] B. Mookerjea, G. E. Hassel, M. Gerin, T. Giesen, J. Stutzki, E. Herbst, J. H. Black, P. F. Goldsmith, K. M. Menten, J. Krełowski, M. De Luca, T. Csengeri, C. Joblin, M. Kaźmierczak, M. Schmidt, J. R. Goicoechea, J. Cernicharo, Chemistry of \ceC3 and carbon chain molecules in DR21(OH), Astron. Astrophys. 546 (2012) A75. doi:10.1051/0004-6361/201219287.
- Giesen et al. [2020] T. F. Giesen, B. Mookerjea, G. W. Fuchs, A. A. Breier, D. Witsch, R. Simon, J. Stutzki, First detection of the carbon chain molecules 13ccc and c13cc towards sgrb2(m), Astron. Astrophys. 633 (2020) A120. doi:10.1051/0004-6361/201936538.