SACDNet: Towards Early Type 2 Diabetes Prediction with Uncertainty for Electronic Health Records
Abstract
Type 2 diabetes mellitus (T2DM) is one of the most common diseases and a leading cause of death. The problem of early diagnosis of T2DM is challenging and necessary to prevent serious complications. This study proposes a novel neural network architecture for early T2DM prediction using multi-headed self-attention and dense layers to extract features from historic diagnoses, patient vitals, and demographics. The proposed technique is called the Self-Attention for Comorbid Disease Net (SACDNet), achieving an accuracy of 89.3% and an F1-Score of 89.1%, having a 1.6% increased accuracy and 1.3% increased f1-score compared to the baseline techniques. Monte Carlo (MC) Dropout is applied to the SACDNet to get a bayesian approximation. A T2DM prediction framework based on the MC Dropout SACDNet is proposed to quantize the uncertainty associated with the predictions. A T2DM prediction dataset is also built as part of this study which is based on real-world routine Electronic Health Record (EHR) data comprising 4,124 diabetic and 181,767 non-diabetic examples, collected from 295 different EHR systems running in different parts of the United States of America. This dataset is further used to evaluate 7 different machine learning and 3 deep learning-based models. Finally, a detailed analysis of the fairness of every technique against different patient demographic groups is performed to validate the unbiased generalization of the techniques and the diversity of the data.
keywords:
Artificial neural networks, Deep Learning, Corpus generation, Healthcare, Uncertainty, Disease Prediction,1 Introduction
Diabetes mellitus or simply diabetes is a set of conditions concerning the body’s mechanism of managing blood glucose [1, 2]. There are two major types of diabetes mellitus i.e., Type 1 Diabetes mellitus (T1DM) and Type 2 Diabetes mellitus (T2DM) [1, 2]. Almost 90% of the diabetics are type 2 diabetics which signifies the importance of diagnosing T2DM [1, 2]. T2DM occurs more often in middle-aged and older people [1, 2, 3]. However, over the past 20 years, this disease is becoming more common in adolescents and even in children [2].
Symptoms of T2DM include unplanned weight loss, increased thirst (polydipsia), frequent urination (polyuria), and increased hunger [4, 2, 5, 6]. Other symptoms of T2DM involve slow wound healing, fatigue, depression, and high blood pressure [7, 2]. Previous studies show higher comorbidity of T2DM with various diseases including cardiovascular disease, hypertension, angina, gastric ulcer, and hypothyroidism [8, 9, 10, 11, 12]. It can cause serious long-term complications like affecting the kidneys, eyes, and nerves [13, 14]. Also, it increases the risk of heart disease and stroke [15]. Similarly, there are several risk factors involved when it comes to T2DM including obesity, ethnicity, older age, high blood pressure, family history, and genetics [16, 17, 18].
According to the International Diabetes Federation (IDF), around 536.6 million people were diabetic in the year 2021 [2]. This number is projected to grow to 783.2 million by 2045. As stated almost 90% of total diabetics are diagnosed with T2DM. Thus, the total number of type 2 diabetic persons in the year 2021 was 483 million [2]. Diabetes has a high mortality rate as well. According to the IDF, 6.7 million people died due to some complications caused by diabetes in 2021 alone [2]. The USA is also impacted hugely by diabetes. A total of 32.2 million US citizens were diabetic in the year 2021, which amounts to almost 11% of the total US population [2, 19]. The US is at number 4 on the list of the countries with the most diabetic patients and spends a fortune every year fighting diabetes and its underlying complications [2]. In 2021 a total of 966 billion US dollars were spent on fighting diabetes which is 316% higher than the 232 billion US dollars spent in the year 2007 for the same [2].
Early detection of diabetes is of vital importance for an effective treatment [20] yet stays a challenge [21]. T2DM is often diagnosed very late when the symptoms become severe and complications arise [2, 20]. Diagnosis of diabetes is usually delayed even in developed countries. Early diagnosis of T2DM can help prevent many serious complications including but not limited to loss of vision, kidney failure, amputations of limbs, stroke, and even premature death [22, 23]. Thus, an early diagnosis of T2DM is essential which can not only save millions of dollars every year but also save precious human lives. However, diabetes in general and T2DM, in particular, remain undiagnosed in the vast majority [20], and according to the National Diabetes Statistics Report, around 8.5 million diabetic persons in the US alone are undiagnosed [19].
Predicting T2DM has been studied previously using supervised and unsupervised machine learning algorithms [24, 25, 26, 12, 14]. Most of the research work has used PIMA Indian diabetes dataset for training and evaluating T2DM predictive systems [27, 28, 29, 30, 31]. PIMA dataset has a very limited number of examples, which raises the concern of a lack of versatility in the dataset that is required for better generalization of the models. Also, the dataset contains examples belonging to only the female PIMA Indians of Arizona further limiting the variation in the dataset. Also, some other datasets like the UCI and MIMIC-III have been used but such datasets are collected in a more controlled environment and may lack the inherent features and characteristics of real-world data.
This work aims to overcome the shortcomings of the existing research including the lack of volume and diversity of datasets, data being collected in a controlled environment, and the nature of features like tricep skin thickness and blood insulin that are not part of routine EHR data. To this extent following key contributions are made as part of this study:
-
1.
A novel deep neural network architecture is proposed for the diagnosis of T2DM. The proposed technique called the SACDNet uses multi-headed self-attention to extract relational features from historic diagnoses and uses fully connected dense layers to extract features from vitals and demographics. The technique then uses a set of fully connected layers to predict T2DM using these features.
-
2.
A novel framework is proposed to predict T2DM with associated confidence that can help in identifying uncertain predictions. The proposed framework is built using the proposed SACDNet with MC-Dropout and entropy to get uncertainty associated with the predictions.
-
3.
A novel dataset is built collecting data from different EHR systems running in different parts of the US. The dataset encloses a set of diverse data points that can be used to train a more generalized T2DM predictive model.
-
4.
Different machine and deep learning techniques were used to train and evaluate T2DM predictive models using the proposed corpus, building T2DM predictive systems that rely solely on routine EHR data features.
-
5.
Also, a fairness analysis of all the techniques used in the study is presented, evaluating each against different demographic groups of data, verifying the claimed diversity of the proposed dataset and the fairness of each technique.
The rest of the paper is divided as follows: Section 2 presents related work. Section 3 gives an overview of the corpus generation process and its specifications. Section 4 presents the novel deep neural network-based technique used in this study, along with the details of the proposed framework for diabetes prediction. The details of the experimentation are given in section 5. The results obtained and the analysis performed on the results are presented in Section 6. Section 7 provides the conclusions and directions for future work.
2 Related Work
Different machine and deep learning techniques have been previously used for the diagnosis of type 2 diabetes [30, 31, 25, 26, 12, 14]. Many datasets have been used for training and evaluating machine learning techniques for T2DM prediction. Three significant datasets have been used previously for T2DM detection which are the PIMA Indian Diabetes dataset [32], UCI [33], and the MIMIC-III [34]. Out of these, the PIMA Indian diabetes dataset is the most widely used. Table 1 gives the details of each dataset.
| Dataset | Positive Examples | Negative Examples | Total Examples |
|---|---|---|---|
| PIMA | 179 | 358 | 537 |
| UCI | 51,034 | 14,806 | 65,840 |
| MIMIC-III | 1,242 | 38,456 | 39,698 |
A large number of studies have used the PIMA dataset to build T2DM prediction models [14]. The very first study that used machine learning for predicting T2DM using the PIMA dataset dates back to 1988 [32]. Techniques like KNN, Logistic Regress, Naïve Bayes, Decision Trees, Support Vector Machines (SVM), Random Forests, AdaBoosting, and Gradient Boosted Trees have all been used to train and evaluate T2DM prediction models using the PIMA dataset [24, 27, 35, 36, 37, 38, 39, 40, 41, 42, 43, 44, 29, 28]. Apart from the conventional machine learning techniques, deep neural networks have also been widely used for T2DM prediction. Previous studies have used multi-layer perceptron networks to predict T2DM, where PIMA was used for training and evaluation [45, 4, 46, 47, 48]. Many other neural network architectures including CNN, RNN (both LSTM and GRU), and a combination of CNN-LSTM-based deep neural networks were evaluated using the PIMA dataset [30, 31, 49, 14]. Additionally, many studies have used voting and stacking-based ensembling to combine the aforementioned techniques to improve the overall performance of T2DM prediction models [24, 50, 35, 44].
Previous studies have also applied machine and deep learning techniques to datasets other than PIMA [51, 13, 16, 8, 42, 5, 52, 12]. For example, NHANES dataset [53] was used to train an SVM-based model for predicting diabetes [54]. Similarly, another study combined NHANES dataset [53] with lab results of different patients for training Logistic Regression, SVM, Random Forest, and Gradient Boosted Trees for predicting T2DM [50]. Many studies have also collected data consisting of the same features as the PIMA dataset from other sources to build machine learning-based T2DM predictive models [13, 37].
Over the past decade, a large number of hospitals and practices have moved to digital health records [34, 55]. Previous work has used data from different EHRs to build machine learning models [18, 25, 56, 57] for T2DM prediction. For example, studies have used Logistic Regression, SVM, Random Forest, Naïve Bayes, and Gradient Boosted Trees on EHR data collected from different hospitals in different parts of the world [58, 59, 60]. Also, deep neural networks have been trained on EHR data for T2DM prediction [22, 14]. Most such studies that utilize some EHR data rely on clinical components like lab results, historical diagnoses, family medical history, or a combination of these. Although data collected from EHRs might be significantly larger yet in most of the studies data is collected from a single practice or region and might not be an effective sample of the data required for better generalization of the machine and deep learning techniques [61, 62, 63].
In addition to the aforementioned techniques that rely solely on tabular data features, some of the studies also rely on images and signal data for the prediction of T2DM. A couple of studies have utilized heart rate variation data collected from ECG and built machine and deep learning models to predict diabetes [64, 65]. Similarly, images of the retina have been used by a couple of studies to predict T2DM using deep CNN and LSTM-based models [66, 67].
3 Dataset
For this study, the data was provided by CureMD111https://www.curemd.com/ which is one of the leading EHR providers in the US. Data from 767 different practices was provided, out of which 295 unique practices were selected based on the existence of type 2 diabetic patients. Hence it can be stated that the dataset that is used in this study has examples belonging to 295 different EHR environments, operating in various parts of the US. The motivation behind using such a dataset is to be able to build real-world T2DM prediction systems that rely on real-world features coming from routine EHR records, which cannot only provide a non-invasive method of early T2DM detection but can also be plugged into any EHR, without requiring any additional data from patients.
The raw data from CureMD’s EHRs contained 5,092,987 unique clinical encounters belonging to 1,034,889 different patients. All the data attributes that contained personal information related to the patients were already masked and are not used in any of the experiments or analyses. For this study only the following three clinical components are used:
-
1.
Diagnosis: This clinical component consists of a set of ICD-10-CM codes that are assigned to a patient during a clinical encounter. Each code represents a disease, symptom, or injury222https://www.cdc.gov/nchs/icd/index.htm that was found in the patient at the time of the encounter. The raw data from the 295 different practices contained 29,714 unique ICD-10-CM codes. This clinical component is selected because it provides the key information related to the individual disease that can either lead to or is comorbid with T2DM.
-
2.
Vitals: The vitals clinical component represents a set of vitals readings that were taken during a visit. The aforementioned EHR data contained 17 different vitals including weight, height, BMI, lean body weight, ideal body weight, neck circumference, waist, oxygen saturation, peak expiratory flow, blood type, blood Rh, finger stick, pulse, respiration, temperature, systolic blood pressure, and diastolic blood pressure. This clinical component was selected because many previous studies relied on the use of vitals for predicting the chances of developing T2DM. Vitals like weight, BMI, blood pressure, etc., have all been marked as important markers in T2DM prediction [31, 52, 22, 50, 62, 54].
-
3.
Demographics: The patient’s demographics component consists of attributes including the patient’s date of birth (which can be used to calculate the present age of the patient), gender, sexual orientation, and race category. Demographical information has been widely used in various disease prediction systems and is considered an important feature [54, 16, 68, 69].
The CureMD EHR data in its raw form required a certain set of preprocessing steps to mold it into a form usable for experiments which are discussed in the section below.
3.1 Data Preprocessing
Data collected from EHRs is sparse, noisy, heterogeneous, and unstructured [56, 70, 55]. Such data also presents other challenges including the problem of missing data and class imbalance [71, 72]. The raw EHRs data that was obtained from CureMD had all of these inherent issues. The details of these data challenges and the required preprocessing techniques that were used to tackle these challenges are discussed below:
3.1.1 Handling Records with no History
The aim of this study is to build an early T2DM prediction system that relies solely on patients’ historic clinical diagnoses, recorded vitals, and demographics. Thus, it is desired to filter out only those patients that have some historic visits before being diagnosed with T2DM. However, in the raw EHR data, a large number of records were encountered where a patient was marked with T2DM (indicated with an E11 ICD-10-CM code) in the very first encounter. Such examples occur in cases when a patient, already diagnosed with T2DM walks into a hospital or practice for the first time without any recorded medical history in the EHR of the same. Thus, a strategy is required to eliminate such example points having no historic encounters prior to the diagnosis of T2DM. For this, all the T2DM-diagnosed patients that do not have at least 4 previous encounters before being diagnosed with T2DM were filtered out of the data. A total of 72,626 patients with T2DM were identified in the raw data, out of which only 5,770 had at least previous 4 encounters before being diagnosed with T2DM. For the non-diabetics, the patients with less than 4 encounters were filtered out.
After the execution of this step, the data set was reduced from 72,626 to 5,770 T2DM patients. Also, from a total of 962,263 non-diabetic patients, only 186,865 patients were left. Hence, after executing the first step of our preprocessing a dataset with 5,770 diabetic and 186,865 non-diabetic patients was created.
3.1.2 Handling Missing Data
The problem of missing data is widely encountered in EHRs [71, 72]. Different studies have implied different approaches for handling missing data. Techniques like dropping complete records with missing values, and filling in missing values using mean, median, or from the nearest neighbors, have been used in many research studies [27, 37, 8, 41, 62, 29, 26]. Raw EHR records were analyzed to identify the attributes that were most affected by the problem of missing values. As a result of this analysis, it was found that all the attributes that have the problem of missing values belonged to the vitals component. To deal with missing values a 2-step strategy was applied. In the first step, a missing value ratio was calculated for every attribute using equation 1.
| (1) |
| Attribute | Missing Value Ratio (%) |
|---|---|
| Weight | 12.67 |
| Height | 21.53 |
| BMI | 28.34 |
| Lean Body Weight | 64.71 |
| Ideal Body Weight | 65.14 |
| Neck Circumference | 92.22 |
| Waist | 91.80 |
| Oxygen Saturation | 89.15 |
| Peak Expiratory Flow | 99.99 |
| Blood Type | 99.82 |
| Blood Rh | 99.94 |
| Finger Stick | 98.98 |
| Pulse | 28.91 |
| Respiration | 53.93 |
| Temperature | 51.66 |
| Systolic Blood Pressure | 16.48 |
| Diastolic Blood Pressure | 16.44 |
Table 2 presents the details of the missing value ratio of different attributes in the vitals component. Based on the results presented in table 2 the vitals attributes for which the missing value ratio was higher than 50% were dropped. The reason for dropping these attributes with a higher missing value ratio lies in the fact that such variables do not possess a sufficient amount of information that can be used to impute the missing values in the next step.
The second step of the applied strategy consists of imputing the missing values for the remaining vitals attributes. The following set of steps was used to impute the missing values for vitals:
-
1.
Firstly, all the records were grouped based on the patient they belong to.
-
2.
Secondly, the patient groups having no value for any of the vitals attributes were dropped, as the missing data cannot be imputed for such patients.
-
3.
Thirdly, for each patient group, the Exponentially Weighted Moving Average (EWMA) of every vitals attribute was calculated and stored.
-
4.
Finally, all the missing values were populated by their respective calculated values, calculated using the EWMA.
EWMA was used for data imputation keeping in mind the fact that EHR data is temporal in nature. EWMA can be used to assign larger weights to recent observations, hence giving more importance to the recent ones as compared to the older data points [73]. Such behavior is desirable and quite effective in capturing the temporal nature associated with a patient’s EHR records where more weight is given to recent visits and less weight to older visits. For the remaining two components i.e., patient demographics and diagnosis the problem of missing value did not exist in the raw data. After applying this 2-step strategy the dataset size was further reduced to a total of 4,124 diabetic and 181,767 non-diabetic patients.
3.1.3 Creating Single Example Points
The data of every patient consists of multiple encounters/visits. This step deals with merging these multiple encounters of a single patient into one example point that can be used for training and evaluating machine and deep learning techniques. The process of creating the example points is given as follows:
-
1.
All three components i.e., diagnosis, vitals, and demographics, were merged into a single record for every patient encounter.
-
2.
For every encounter the age of the patient at the time of the encounter was calculated using the patient’s date of birth.
-
3.
Next for every patient all the encounter records were sorted using the date of the encounter in ascending order of the date.
-
4.
For every T2DM patient, all the encounter records before the first T2DM diagnosis encounter were selected and the associated diagnoses were extracted. The ICD-10-CM diagnosis codes were merged together creating a single comma-separated string enclosing all the unique historic diagnoses of a patient.
-
5.
Next, the vitals from the first T2DM encounter were merged with the diagnoses attribute along with the demographic information of the patient, creating a single T2DM positive example.
-
6.
Label 1 was also generated for the created T2DM example points.
-
7.
For every non-T2DM patient, all the diagnoses from all the previous encounters were merged to create a single comma-separated diagnoses feature. Also, the vitals from the last encounter and the patient’s demographic information were merged with the diagnoses feature to create a T2DM negative example.
-
8.
Label 0 was generated for the non-T2DM example points.
3.1.4 Dealing with Class Imbalance
Class imbalance is a problem that arises when the data is distributed unevenly among the classification categories [74, 75, 76]. In case of class imbalance, the performance of traditional classification techniques is affected where the performance of the techniques becomes biased towards the majority class and is reduced for the minority class [74, 77, 78]. Many techniques have been presented over the years to deal with class imbalance including oversampling, undersampling, SMOTE, MUTE, ADASYN [78, 75, 79, 80, 81]. Class imbalance is another inherent property of health care and medicine data [82, 62, 22].
Techniques like SMOTE, ADASYNC, data oversampling, data undersampling, etc. have been used for balancing data for T2DM prediction as well [22, 49, 62]. The EHR data that is used as part of this study has a huge class imbalance having a total of 4,124 diabetic and 181,767 non-diabetic records. A combination of 5-fold cross-validation combined with undersampling is applied to handle this class imbalance. A total of 5 non-overlapping samples of size 4,124 were selected from the non-T2DM examples which are used to train 5 different variations of every machine learning and deep learning technique. The details are discussed in section 5.
4 Methodology
A novel deep neural network architecture is proposed for T2DM prediction that combines multi-headed self-attention with fully connected layers. The proposed technique called the Self-Attention for Comorbid Disease Net (SACDNet) uses multiheaded self-attention to extract features from the diagnoses vector with the intent to find a relation between every pair of diagnoses and uses dense layers to extract features from vitals and demographics data. The resultant feature vectors are then concatenated and passed through a single dropout layer. Finally, a series of fully connected layers are used for T2DM classification.
4.1 Self Attention
The concept of attention was introduced to modify the RNN-based Encoder-Decoder models [83] where every decoder timestamp will now receive a weighted sum of all encoder hidden states called the attention score. The attention score is usually a scaled dot product given by the equation 2.
| (2) |
Where Q, K, and V represent the query, key, and value matrixes, obtained by multiplying the inputs sequence X with three different weight matrixes , , and respectively. If the query, key, and value are all generated using the same input sequence then the above equation 2 becomes self-attention. The concept of self-attention involves finding the similarity between all elements in the input sequence, in our case, this will be to find a relation between all historic diagnoses.
4.2 Multi-Headed Self Attention
This involves applying self-attention to the input sequence multiple times, obtaining different weight matrixes for the query, key, and value [84]. Thus, it provides a more diverse set of relationships between the elements of the input sequence. These multiple self-attention outputs are concatenated. For given input sequence X multi-headed self-attention for N heads is given by equation 3.
| (3) |
Where represents self-attention obtained using different , , and weight metrixes. N represents the number of heads.
4.3 SACDNet
For the given diagnosis matrix D, and the vitals/demographics matrix V SACDNet feature extraction is given using equation 4.
| (4) |
Where MLP represents a set of fully connected layers. This feature vector is then passed to another set of fully connected layers, for T2DM classification. The details of the network are given in table 3.
| No. | Network Layers | |
|---|---|---|
| 1 | Diagnosis Input Vector | Vitals/Demographics Input Vector |
| 2 | Multiheaded Self Attention (N=3, Query Dimension=3, Key Dimension=3, Value Dimension=3) | Fully Connected (Units=256, Activation=SELU) |
| 3 | Fully Connected (Units=128, Activation=SELU) | |
| 4 | Concatenate (To a single merged feature vector) | |
| 5 | Dropout (Rate=0.1) | |
| 6 | Fully Connected (Units=64, Activation=SELU) | |
| 7 | Fully Connected (Units=64, Activation=Sigmoid) | |
4.4 Monte Carlo (MC) Dropout
Deep neural networks are deterministic in nature, which is not always desirable, especially in the case of high-risk systems such as clinical systems [85, 86, 87]. It is desirable to have a system that can provide associated confidence with its prediction. The probability distribution returned by the Softmax function cannot be considered a model’s confidence as it has been proven that neural network-based models can make incorrect predictions with higher confidence [88, 89, 90, 87]. Epistemic or Model uncertainty estimation using MC dropout [88] has been used widely for deep neural network-based models[91, 92, 93, 94]. The idea of MC-Dropout is to get a prediction for given input X from T highly similar ensemble models and then obtain an average of these T different output probability distributions 5. This is achieved by applying the concept of dropout regularization at inference time, which in fact yields T different distributions of the model’s parameters. Hence, a large difference in the prediction of these T different models can be an indicator of larger model uncertainty and such can help in obtaining more robust predictive confidence [87, 92].
| (5) |
Where for given T forward passes from the network we will have T different parameter distributions , , , …., as given in equation 5.
4.5 Measuring Predictive Uncertainty
For the given output probability distributions from T different passes, different measures have been used for uncertainty quantization [91, 95, 92]. Entropy has been widely used as a measure of uncertainty quantization [91, 95, 96], where entropy for the averaged MC-Dropout results is calculated using the equation 6.
| (6) |
4.6 Proposed Framework
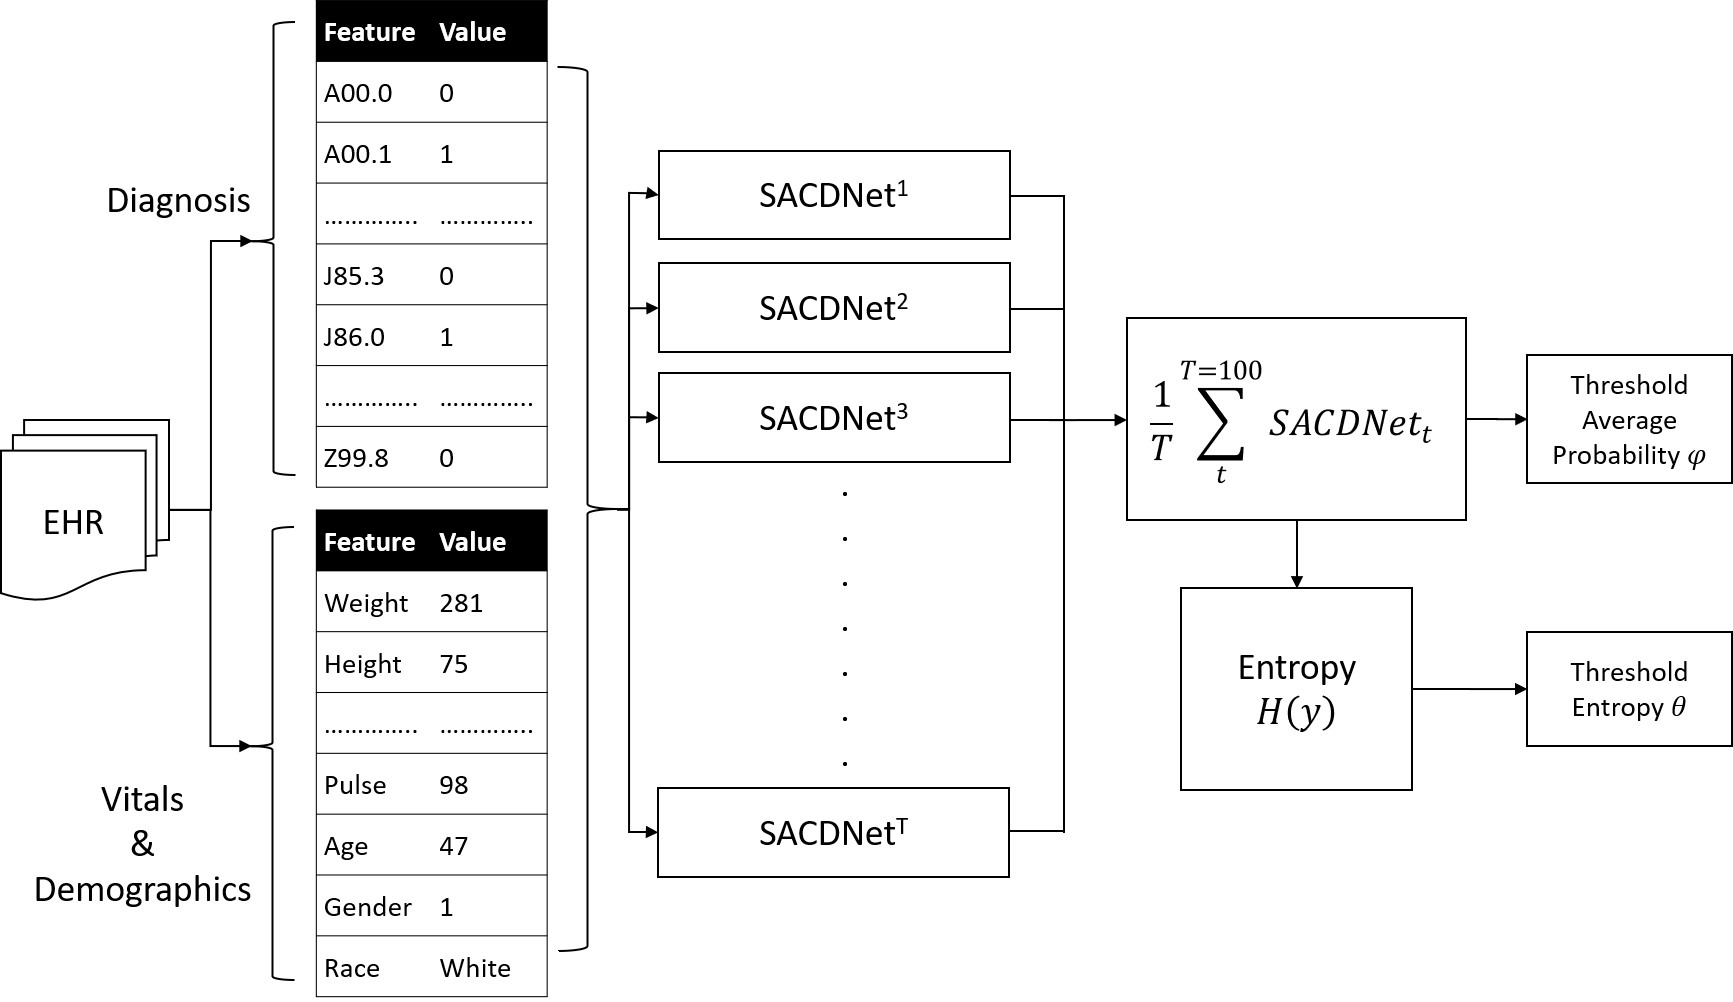
The proposed framework combines the novel SACDNet with MC-Dropout to build a system that can predict T2DM with associated uncertainty. The idea is to get an ensemble of 100 different highly similar models, for which an average prediction probability for T2DM is calculated 7.
| (7) |
Next using the entropy metric discussed before uncertainty value for the prediction is calculated and based on a specified threshold theta a prediction is marked as certain or uncertain. An overview of the framework is given in figure 1. It can be observed in the figure 1 the electronic health record of a patient is divided into 2 different feature vectors comprising of the historic diagnoses and vitals-demographics respectively. These feature vectors are passed through 100 different representations of the MC-Dropout SACDNet. The generated set of probabilities is averaged to get the final probability which is passed through a threshold function to predict T2DM. Also, the same mean probability is used to quantize uncertainty using entropy.
5 Experiments
This section presents details of experiments performed on the developed T2DM corpus. Machine learning algorithms, deep learning algorithms, and proposed SACDNet are applied to the dataset to train T2DM classifiers. As discussed in section 3, the proposed corpus has a huge class imbalance. This class imbalance can affect the performance of the classifiers [74, 77, 78]. To deal with this problem 5-fold cross-validation was applied obtaining a balanced set by randomly undersampling the majority class. 7 different machine learning techniques including AdaBoost, Decision Trees, Logistic Regression, Gaussian Naïve Bayes, Random Forest, SVM, and Gradient Boosted Trees (XGB) were trained using the proposed corpus. Multiple deep neural network-based techniques were trained using the proposed corpus [47, 46, 31, 46, 48], however, apart from our proposed novel technique SACDNet, only two other techniques were able to produce satisfactory results, referred to as the FCN and FCN Dropout. The FCN network consists of 4 fully connected hidden layers using ReLU activations whereas the FCN Dropout consists of 3 fully connected hidden layers with hidden layer one having a dropout rate of 30% and hidden layer two having a dropout rate of 20%, all using the same ReLU activations.
The details of the experimentation process are given as follows:
-
1.
Firstly, all the T2DM positive and negative class examples were separated.
-
2.
Next 5 random samples, without overlap were selected from the non-T2DM examples, where the size of each sample selected was equal to the size of our T2DM positive examples set.
-
3.
Next 5 different datasets were created combining the T2DM positive set with each of the 5 non-T2DM sets.
-
4.
Next for every dataset an 80-20% train test split was done.
-
5.
Every technique was trained using a 5-fold cross-validation, where one of the 5 balanced samples was used for each fold.
-
6.
Performance of each model per fold was calculated using the evaluation measures discussed in the results section 6.
-
7.
An average performance of every model was also calculated using the results from the 5 folds.
For a fair comparison, none of the models’ hyperparameters were tuned for both machine and deep learning techniques
6 Results and Analysis
6.1 Evaluation Measures
For the evaluation of the models presented in this study, 5 widely used metrics were used including Accuracy, F1-Score, Precision, Recall, and Specificity. These have been used for evaluating disease prediction systems, especially for T2DM prediction [24, 36, 5, 38, 39, 13, 7, 41, 42, 29, 26, 25]. For the evaluation of the uncertainty of the model, we have used entropy as discussed in the methodology section 4.
6.2 Comparison Under Fixed Settings
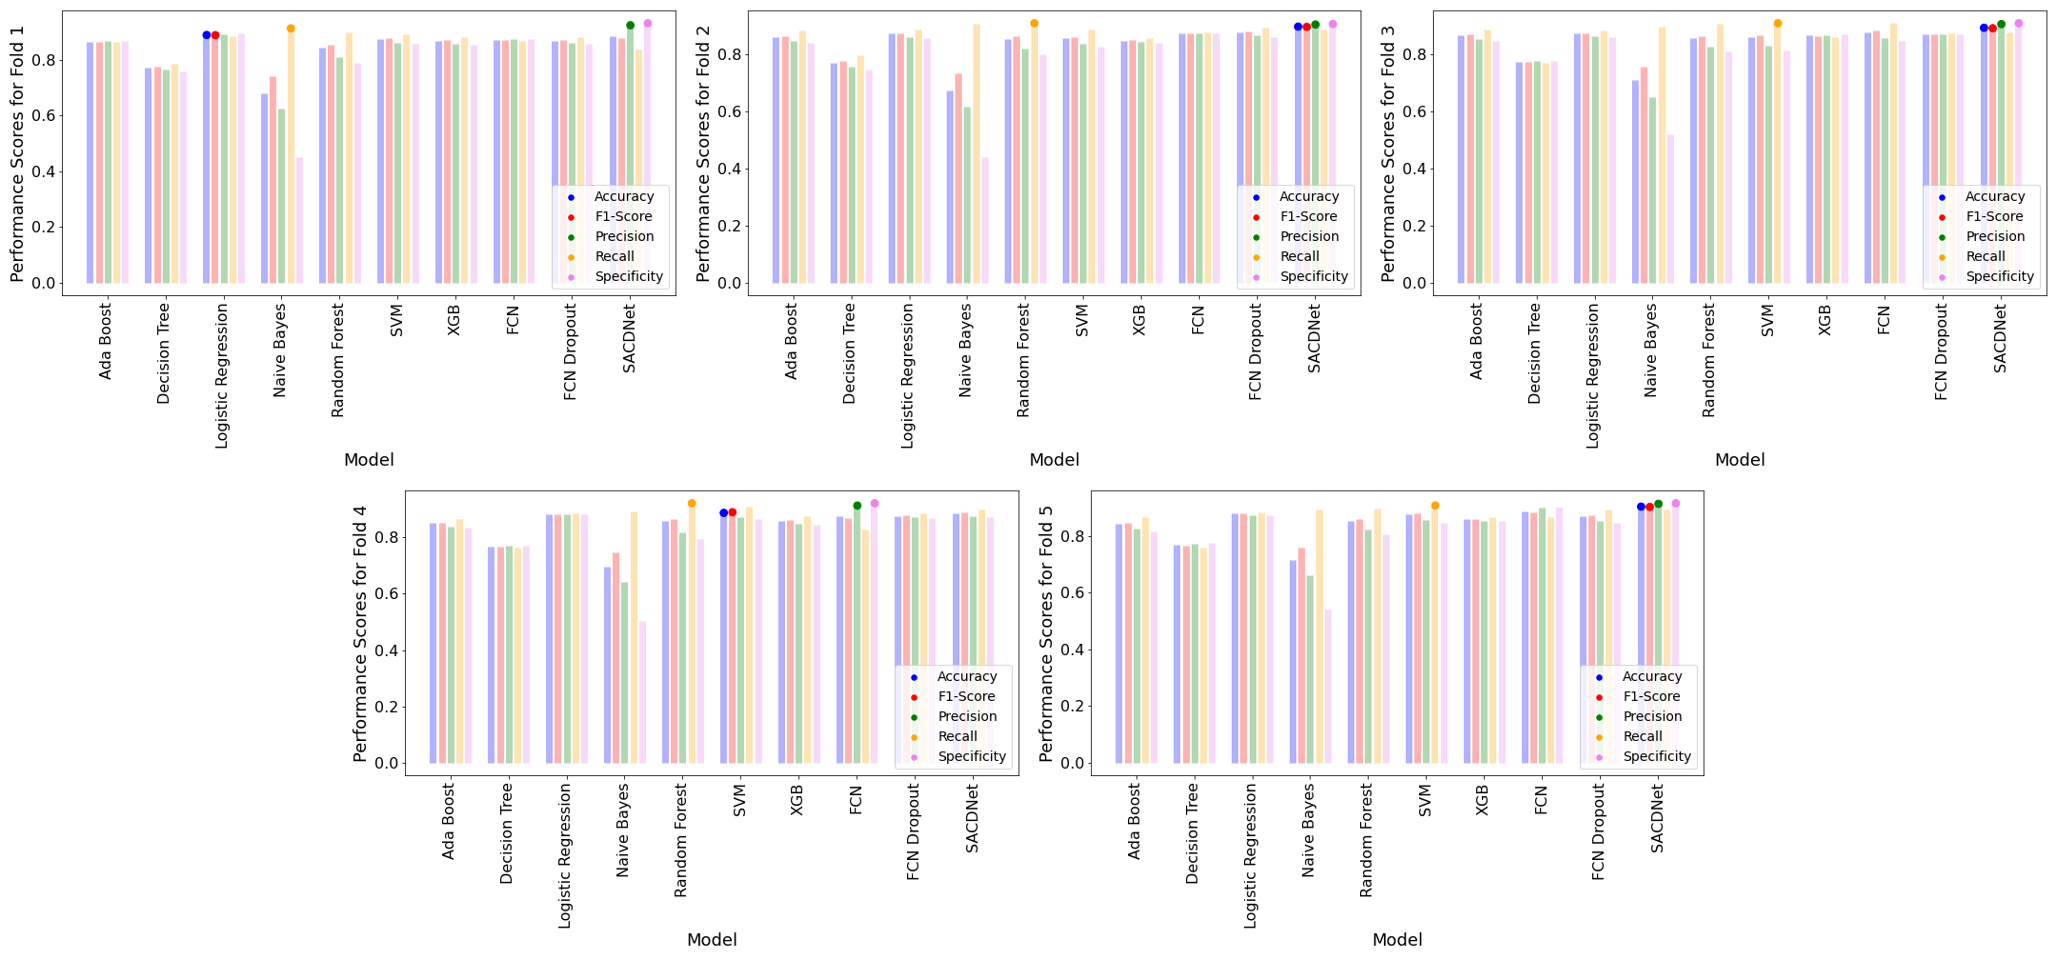
This section presents a comparison of the performance of all the techniques discussed, using different evaluation measures. Firstly, the results obtained against the test set for each of the 5 data folds are presented in figure 2. Next, the average accuracy, f1-score, precision, recall, and specificity are presented in table 4.
| No. | Model | Accuracy (%) | F1-Score (%) | Precision (%) | Recall (%) | Specificity (%) |
|---|---|---|---|---|---|---|
| 1 | Ada Boost | 85.8 | 86.0 | 84.7 | 87.4 | 85.8 |
| 2 | Decision Tree | 77.1 | 77.2 | 76.8 | 77.5 | 77.1 |
| 3 | Logistic Regression | 87.9 | 88.0 | 87.5 | 88.5 | 87.9 |
| 4 | Naïve Bayes | 69.6 | 74.8 | 63.9 | 90.1 | 69.6 |
| 5 | Random Forest | 85.4 | 86.1 | 82.0 | 90.7 | 85.4 |
| 6 | SVM | 87.2 | 87.6 | 85.2 | 90.1 | 87.2 |
| 7 | XGB | 86.1 | 86.2 | 85.5 | 86.8 | 86.1 |
| 8 | FCN | 87.7 | 87.6 | 88.4 | 86.9 | 87.7 |
| 9 | FCN Dropout | 87.3 | 87.5 | 86.4 | 88.5 | 87.3 |
| 10 | SACDNet | 89.3 | 89.1 | 90.5 | 87.9 | 89.3 |
It can be observed from the table 4 that our proposed technique SACDNet performs better compared with 7 different machine learning and 2 neural network-based techniques, achieving a 1.6% increased accuracy and 1.3% increased F1-Score compared to the other techniques.
6.3 Fairness Evaluation
It is desirable to have a T2DM prediction system that is able to perform equally well on a diverse set of examples, without having any bias towards a certain gender, age, or racial group. The proposed dataset collected from different EHR systems running in different parts of the US was built to capture examples belonging to a larger population. Such a diverse dataset can be helpful in building more generalized machine and deep learning models that can perform equally well for examples belonging to different demographic groups of patients. In order to evaluate this hypothesis, the next set of analyses was performed to validate the fairness of each of the techniques used.
For fairness evaluation, the proposed dataset was divided into certain groups based on the associated demographic information of the patients. Example points were divided based on age, gender, and race. All the techniques were evaluated against the individual groups and the results are presented in the figure 3.
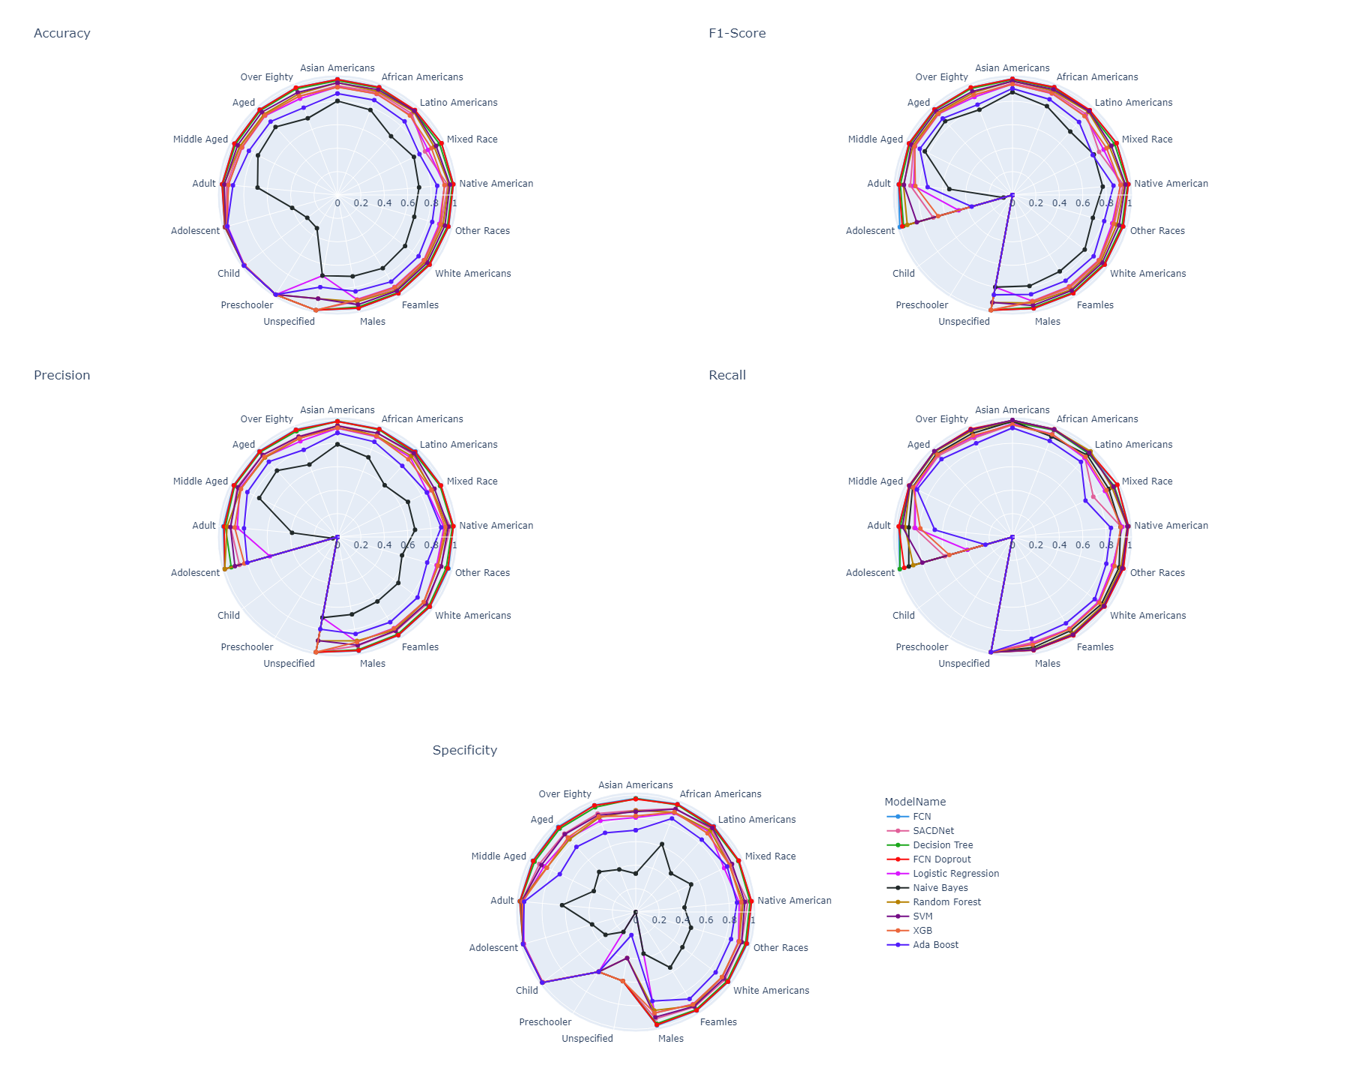
It can be observed from the figure 3 that all the techniques have identical performance for all the race and gender groups. However, there is a sudden drop in the case of precision, recall, specificity, and f1-score for two age groups namely the children and preschoolers. The reason for this is the unavailability of significant examples belonging to the two aforementioned groups. For example, for preschoolers, there were only 1569 examples in the dataset all of which belonged to the non-diabetic class. Hence, there were no diabetic patients belonging to this class, and the precision, recall, specificity, and f1-score, cannot be calculated. Similarly, for Children, only 1857 examples were present all of which belonged to the non-diabetic class, and hence the same holds. Hence, this sudden drop does not represent the biasness of the techniques but only the unavailability of data for the calculation of precision, recall, specificity, and f1-score, which can be further validated by no drop in the accuracy for these two groups. Also, for the unspecified gender, only one example of a diabetic patient and only 6 examples of non-diabetics were encountered which again is causing discrepancies in the performance of certain evaluation measures even though the accuracy of the models is close to near perfect. Hence it can be stated that all the techniques were able to generalize fairly against all the data groups which confirm the diversity of the proposed dataset.
6.4 Uncertainty Analysis
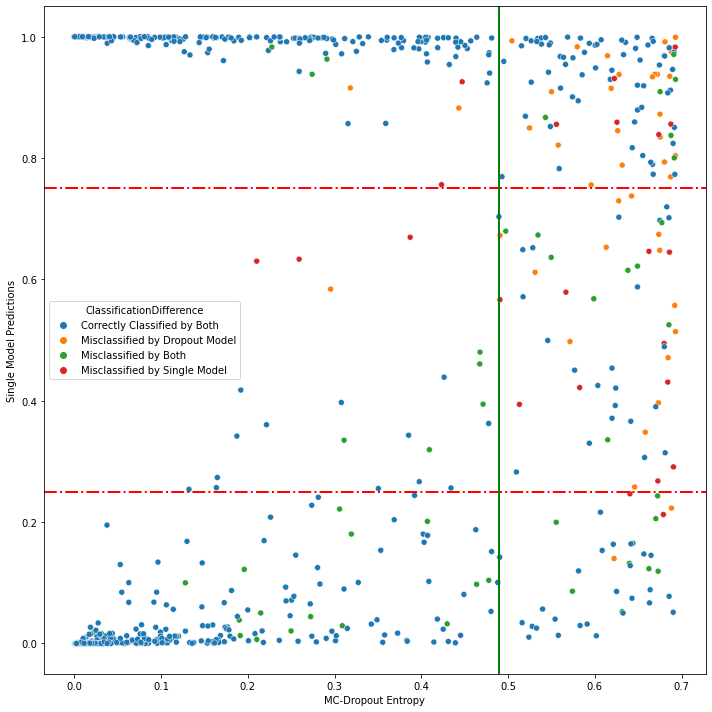
As discussed in the methodology section 4, the proposed SACDNet is intended to be part of a complete T2DM prediction framework that can make predictions with associated confidence, marking predictions with lower confidence as uncertain. In order to draw a comparison of the proposed technique and its MC-Dropout-based extension figure 4 was plotted. The horizontal straight dashed lines represent the probability thresholding for the simple model while the vertical straight line represents the entropy threshold for the MC-Dropout extension. It can be observed from the figure 4 that the MC-Dropout extension used with entropy is able to identify more misclassified examples as uncertain, making it more reliable.
In order to further clarify the reliability of the MC-Dropout extension technique all the examples from the test that were misclassified by either technique were separated and the entropy for the output probabilities was calculated. The histogram of the calculated entropy is given in figure 5, where each bin represents the number of examples per entropy range.
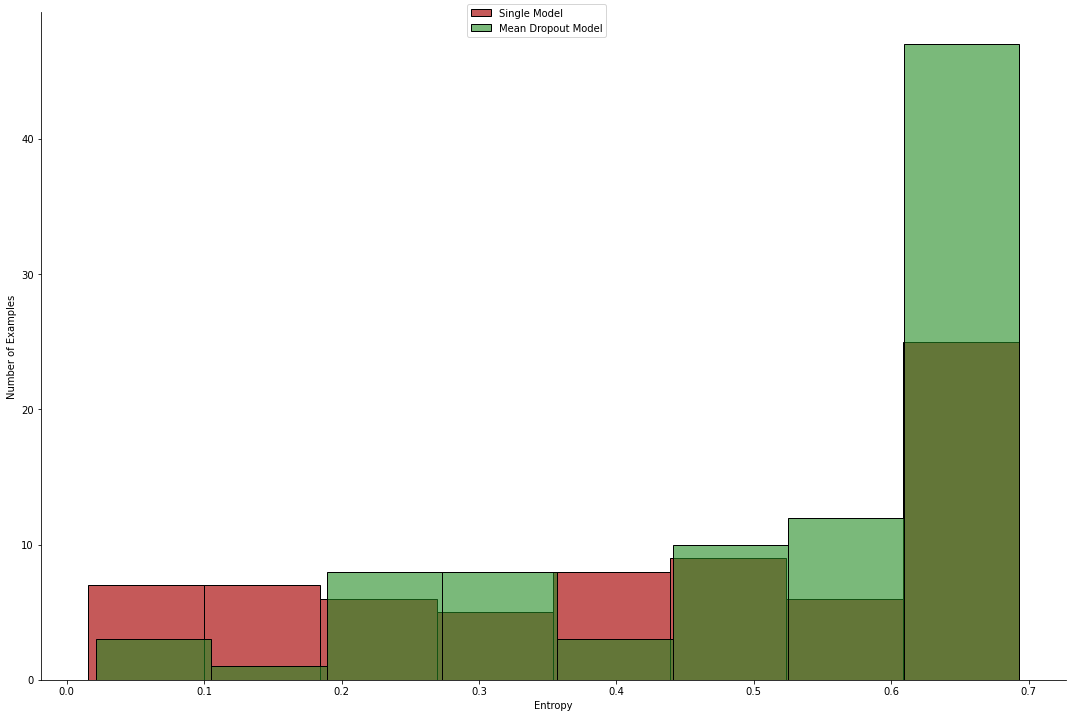
It can be observed from the figure 5 that a higher entropy, which counts for a higher uncertainty, is assigned to more misclassified examples by the proposed MC-Dropout-based extension as compared to the simple model. Hence adding MC-Dropout further improves the proposed technique, reducing the number of overconfident wrong inferences.
7 Conclusion and Future Work
Type 2 diabetes mellitus is a chronic disease that is often undiagnosed and can lead to severe complications. It is desirable to have a system that can help in the early diagnosis of T2DM, reducing the yearly health expenses spent tackling complications of undiagnosed T2DM and also saving millions of lives every year that are lost due to late diagnosis of T2DM. This study proposes a novel deep learning-based model to predict T2DM using routine EHR features. SACDNet was able to perform better than the baseline machine and deep learning models. The study also presents a complete real-world solution for building an early diabetes detection system, developing a diverse corpus from real-world EHR data. Also, the proposed framework based on MC-Dropout can help make predictions with more reliability and abstain from predicting in cases where the model is uncertain. The proposed technique and framework can be plugged into existing EHR software with little or no changes. Also, the methodology followed in this study can be used to build predictive software for other diseases like hypertension, ischemic heart disease, etc.
References
- [1] Types of diabetes mellitus, https://www.webmd.com/diabetes/types-of-diabetes-mellitus.
- [2] I. Federation, Idf diabetes atlas tenth edition 2021. international diabetes federation. idf diabetes atlas, 10th edn. brussels, belgium: International diabetes federation; 2021 (2021).
- [3] S. Abhari, S. R. N. Kalhori, M. Ebrahimi, H. Hasannejadasl, A. Garavand, Artificial intelligence applications in type 2 diabetes mellitus care: focus on machine learning methods, Healthcare informatics research 25 (4) (2019) 248–261.
- [4] S. Wei, X. Zhao, C. Miao, A comprehensive exploration to the machine learning techniques for diabetes identification, in: 2018 IEEE 4th World Forum on Internet of Things (WF-IoT), IEEE, 2018, pp. 291–295.
- [5] P. Sonar, K. JayaMalini, Diabetes prediction using different machine learning approaches, in: 2019 3rd International Conference on Computing Methodologies and Communication (ICCMC), IEEE, 2019, pp. 367–371.
- [6] A. Ramachandran, Know the signs and symptoms of diabetes, The Indian journal of medical research 140 (5) (2014) 579.
- [7] K. C. Howlader, M. Satu, M. Awal, M. Islam, S. M. S. Islam, J. M. Quinn, M. A. Moni, et al., Machine learning models for classification and identification of significant attributes to detect type 2 diabetes, Health information science and systems 10 (1) (2022) 1–13.
- [8] X.-l. Xiong, R.-x. Zhang, Y. Bi, W.-h. Zhou, Y. Yu, D.-l. Zhu, Machine learning models in type 2 diabetes risk prediction: results from a cross-sectional retrospective study in chinese adults, Current medical science 39 (4) (2019) 582–588.
- [9] M. E. Hossain, S. Uddin, A. Khan, M. A. Moni, A framework to understand the progression of cardiovascular disease for type 2 diabetes mellitus patients using a network approach, International Journal of Environmental Research and Public Health 17 (2) (2020) 596.
- [10] H. S. Kim, A. M. Shin, M. K. Kim, Y. N. Kim, Comorbidity study on type 2 diabetes mellitus using data mining, The Korean journal of internal medicine 27 (2) (2012) 197.
- [11] L. B. Hassing, S. M. Hofer, S. E. Nilsson, S. Berg, N. L. Pedersen, G. McClearn, B. Johansson, Comorbid type 2 diabetes mellitus and hypertension exacerbates cognitive decline: evidence from a longitudinal study, Age and ageing 33 (4) (2004) 355–361.
- [12] L. Ducat, L. H. Philipson, B. J. Anderson, The mental health comorbidities of diabetes, Jama 312 (7) (2014) 691–692.
- [13] A. U. Haq, J. P. Li, J. Khan, M. H. Memon, S. Nazir, S. Ahmad, G. A. Khan, A. Ali, Intelligent machine learning approach for effective recognition of diabetes in e-healthcare using clinical data, Sensors 20 (9) (2020) 2649.
- [14] Z. Alhassan, A. S. McGough, R. Alshammari, T. Daghstani, D. Budgen, N. Al Moubayed, Type-2 diabetes mellitus diagnosis from time series clinical data using deep learning models, in: International Conference on Artificial Neural Networks, Springer, 2018, pp. 468–478.
- [15] D. P. P. R. Group, et al., Long-term effects of lifestyle intervention or metformin on diabetes development and microvascular complications over 15-year follow-up: the diabetes prevention program outcomes study, The lancet Diabetes & endocrinology 3 (11) (2015) 866–875.
- [16] N. Fazakis, O. Kocsis, E. Dritsas, S. Alexiou, N. Fakotakis, K. Moustakas, Machine learning tools for long-term type 2 diabetes risk prediction, IEEE Access 9 (2021) 103737–103757.
- [17] G. S. Collins, S. Mallett, O. Omar, L.-M. Yu, Developing risk prediction models for type 2 diabetes: a systematic review of methodology and reporting, BMC medicine 9 (1) (2011) 1–14.
- [18] G. Robertson, E. D. Lehmann, W. Sandham, D. Hamilton, Blood glucose prediction using artificial neural networks trained with the aida diabetes simulator: a proof-of-concept pilot study, Journal of Electrical and Computer Engineering 2011.
- [19] Centers for disease control and prevention. national diabetes statistics report website., https://www.cdc.gov/diabetes/data/statistics-report/index.html.
- [20] M. Franciosi, G. De Berardis, M. C. Rossi, M. Sacco, M. Belfiglio, F. Pellegrini, G. Tognoni, M. Valentini, A. Nicolucci, I. S. Group, Use of the diabetes risk score for opportunistic screening of undiagnosed diabetes and impaired glucose tolerance: the igloo (impaired glucose tolerance and long-term outcomes observational) study, Diabetes care 28 (5) (2005) 1187–1194.
- [21] T. Zhu, K. Li, P. Herrero, P. Georgiou, Deep learning for diabetes: a systematic review, IEEE Journal of Biomedical and Health Informatics 25 (7) (2020) 2744–2757.
- [22] A. Krasteva, V. Panov, A. Krasteva, A. Kisselova, Z. Krastev, Oral cavity and systemic diseases—diabetes mellitus, Biotechnology & Biotechnological Equipment 25 (1) (2011) 2183–2186.
- [23] N. Jayanthi, B. V. Babu, N. S. Rao, Survey on clinical prediction models for diabetes prediction, Journal of Big Data 4 (1) (2017) 1–15.
- [24] N. H. Taz, A. Islam, I. Mahmud, A comparative analysis of ensemble based machine learning techniques for diabetes identification, in: 2021 2nd International Conference on Robotics, Electrical and Signal Processing Techniques (ICREST), IEEE, 2021, pp. 1–6.
- [25] S. Mani, Y. Chen, T. Elasy, W. Clayton, J. Denny, Type 2 diabetes risk forecasting from emr data using machine learning, in: AMIA annual symposium proceedings, Vol. 2012, American Medical Informatics Association, 2012, p. 606.
- [26] Q. Zou, K. Qu, Y. Luo, D. Yin, Y. Ju, H. Tang, Predicting diabetes mellitus with machine learning techniques, Frontiers in genetics 9 (2018) 515.
- [27] P. Ghosh, S. Azam, A. Karim, M. Hassan, K. Roy, M. Jonkman, A comparative study of different machine learning tools in detecting diabetes, Procedia Computer Science 192 (2021) 467–477.
- [28] R. D. Joshi, C. K. Dhakal, Predicting type 2 diabetes using logistic regression and machine learning approaches, International journal of environmental research and public health 18 (14) (2021) 7346.
- [29] R. Birjais, A. K. Mourya, R. Chauhan, H. Kaur, Prediction and diagnosis of future diabetes risk: a machine learning approach, SN Applied Sciences 1 (9) (2019) 1–8.
- [30] A. Yahyaoui, A. Jamil, J. Rasheed, M. Yesiltepe, A decision support system for diabetes prediction using machine learning and deep learning techniques, in: 2019 1st International Informatics and Software Engineering Conference (UBMYK), IEEE, 2019, pp. 1–4.
- [31] M. Rahman, D. Islam, R. J. Mukti, I. Saha, A deep learning approach based on convolutional lstm for detecting diabetes, Computational biology and chemistry 88 (2020) 107329.
- [32] J. W. Smith, J. E. Everhart, W. Dickson, W. C. Knowler, R. S. Johannes, Using the adap learning algorithm to forecast the onset of diabetes mellitus, in: Proceedings of the annual symposium on computer application in medical care, American Medical Informatics Association, 1988, p. 261.
- [33] B. Strack, J. P. DeShazo, C. Gennings, J. L. Olmo, S. Ventura, K. J. Cios, J. N. Clore, Impact of hba1c measurement on hospital readmission rates: analysis of 70,000 clinical database patient records, BioMed research international 2014.
- [34] A. E. Johnson, T. J. Pollard, L. Shen, L.-w. H. Lehman, M. Feng, M. Ghassemi, B. Moody, P. Szolovits, L. Anthony Celi, R. G. Mark, Mimic-iii, a freely accessible critical care database, Scientific data 3 (1) (2016) 1–9.
- [35] S. K. Kalagotla, S. V. Gangashetty, K. Giridhar, A novel stacking technique for prediction of diabetes, Computers in Biology and Medicine 135 (2021) 104554.
- [36] G. Battineni, G. G. Sagaro, C. Nalini, F. Amenta, S. K. Tayebati, Comparative machine-learning approach: a follow-up study on type 2 diabetes predictions by cross-validation methods, Machines 7 (4) (2019) 74.
- [37] A. Mujumdar, V. Vaidehi, Diabetes prediction using machine learning algorithms, Procedia Computer Science 165 (2019) 292–299.
- [38] M. K. Hasan, M. A. Alam, D. Das, E. Hossain, M. Hasan, Diabetes prediction using ensembling of different machine learning classifiers, IEEE Access 8 (2020) 76516–76531.
- [39] H. Kahramanli, N. Allahverdi, Design of a hybrid system for the diabetes and heart diseases, Expert systems with applications 35 (1-2) (2008) 82–89.
- [40] G. Kaur, A. Chhabra, Improved j48 classification algorithm for the prediction of diabetes, International journal of computer applications 98 (22).
- [41] M. Maniruzzaman, M. Rahman, M. Al-MehediHasan, H. S. Suri, M. Abedin, A. El-Baz, J. S. Suri, et al., Accurate diabetes risk stratification using machine learning: role of missing value and outliers, Journal of medical systems 42 (5) (2018) 1–17.
- [42] N. P. Tigga, S. Garg, Prediction of type 2 diabetes using machine learning classification methods, Procedia Computer Science 167 (2020) 706–716.
- [43] M. A. Sarwar, N. Kamal, W. Hamid, M. A. Shah, Prediction of diabetes using machine learning algorithms in healthcare, in: 2018 24th international conference on automation and computing (ICAC), IEEE, 2018, pp. 1–6.
- [44] N. Prema, V. Varshith, J. Yogeswar, Prediction of diabetes using ensemble techniques, Int. J. Recent Technol. Eng 7 (6) (2019) 203–205.
- [45] H. Temurtas, N. Yumusak, F. Temurtas, A comparative study on diabetes disease diagnosis using neural networks, Expert Systems with applications 36 (4) (2009) 8610–8615.
- [46] S. I. Ayon, M. M. Islam, Diabetes prediction: a deep learning approach, International Journal of Information Engineering and Electronic Business 12 (2) (2019) 21.
- [47] H. Naz, S. Ahuja, Deep learning approach for diabetes prediction using pima indian dataset, Journal of Diabetes & Metabolic Disorders 19 (1) (2020) 391–403.
- [48] R. K. Nadesh, K. Arivuselvan, et al., Type 2: diabetes mellitus prediction using deep neural networks classifier, International Journal of Cognitive Computing in Engineering 1 (2020) 55–61.
- [49] M. T. García-Ordás, C. Benavides, J. A. Benítez-Andrades, H. Alaiz-Moretón, I. García-Rodríguez, Diabetes detection using deep learning techniques with oversampling and feature augmentation, Computer Methods and Programs in Biomedicine 202 (2021) 105968.
- [50] K. Kayaer, T. Yildirim, et al., Medical diagnosis on pima indian diabetes using general regression neural networks, in: Proceedings of the international conference on artificial neural networks and neural information processing (ICANN/ICONIP), Vol. 181, 2003, p. 184.
- [51] B. J. Lee, J. Y. Kim, Identification of type 2 diabetes risk factors using phenotypes consisting of anthropometry and triglycerides based on machine learning, IEEE journal of biomedical and health informatics 20 (1) (2015) 39–46.
- [52] N. S. El_Jerjawi, S. S. Abu-Naser, Diabetes prediction using artificial neural network, International Journal of Advanced Science and Technology 121.
- [53] S. NCfH, About the national health and nutrition examination survey (2017).
- [54] W. Yu, T. Liu, R. Valdez, M. Gwinn, M. J. Khoury, Application of support vector machine modeling for prediction of common diseases: the case of diabetes and pre-diabetes, BMC medical informatics and decision making 10 (1) (2010) 1–7.
- [55] Y. Cheng, F. Wang, P. Zhang, J. Hu, Risk prediction with electronic health records: A deep learning approach, in: Proceedings of the 2016 SIAM international conference on data mining, SIAM, 2016, pp. 432–440.
- [56] T. Zheng, W. Xie, L. Xu, X. He, Y. Zhang, M. You, G. Yang, Y. Chen, A machine learning-based framework to identify type 2 diabetes through electronic health records, International journal of medical informatics 97 (2017) 120–127.
- [57] L. Kopitar, P. Kocbek, L. Cilar, A. Sheikh, G. Stiglic, Early detection of type 2 diabetes mellitus using machine learning-based prediction models, Scientific reports 10 (1) (2020) 1–12.
- [58] A. Dagliati, S. Marini, L. Sacchi, G. Cogni, M. Teliti, V. Tibollo, P. De Cata, L. Chiovato, R. Bellazzi, Machine learning methods to predict diabetes complications, Journal of diabetes science and technology 12 (2) (2018) 295–302.
- [59] B. Farran, A. M. Channanath, K. Behbehani, T. A. Thanaraj, Predictive models to assess risk of type 2 diabetes, hypertension and comorbidity: machine-learning algorithms and validation using national health data from kuwait—a cohort study, BMJ open 3 (5) (2013) e002457.
- [60] A. Viloria, Y. Herazo-Beltran, D. Cabrera, O. B. Pineda, Diabetes diagnostic prediction using vector support machines, Procedia Computer Science 170 (2020) 376–381.
- [61] H. Lai, H. Huang, K. Keshavjee, A. Guergachi, X. Gao, Predictive models for diabetes mellitus using machine learning techniques, BMC endocrine disorders 19 (1) (2019) 1–9.
- [62] H. M. Deberneh, I. Kim, Prediction of type 2 diabetes based on machine learning algorithm, International journal of environmental research and public health 18 (6) (2021) 3317.
- [63] A. Cahn, A. Shoshan, T. Sagiv, R. Yesharim, R. Goshen, V. Shalev, I. Raz, Prediction of progression from pre-diabetes to diabetes: Development and validation of a machine learning model, Diabetes/metabolism research and reviews 36 (2) (2020) e3252.
- [64] G. Swapna, S. Kp, R. Vinayakumar, Automated detection of diabetes using cnn and cnn-lstm network and heart rate signals, Procedia computer science 132 (2018) 1253–1262.
- [65] G. Swapna, R. Vinayakumar, K. Soman, Diabetes detection using deep learning algorithms, ICT express 4 (4) (2018) 243–246.
- [66] M. T. Islam, H. R. Al-Absi, E. A. Ruagh, T. Alam, Dianet: A deep learning based architecture to diagnose diabetes using retinal images only, IEEE Access 9 (2021) 15686–15695.
- [67] P. Samant, R. Agarwal, Machine learning techniques for medical diagnosis of diabetes using iris images, Computer methods and programs in biomedicine 157 (2018) 121–128.
- [68] H. Lu, S. Uddin, F. Hajati, M. A. Moni, M. Khushi, A patient network-based machine learning model for disease prediction: The case of type 2 diabetes mellitus, Applied Intelligence 52 (3) (2022) 2411–2422.
- [69] T. N. Joshi, P. Chawan, et al., Diabetes prediction using machine learning techniques, Ijera 8 (1) (2018) 9–13.
- [70] S. Rashidian, K. Abell-Hart, J. Hajagos, R. Moffitt, V. Lingam, V. Garcia, C.-W. Tsai, F. Wang, X. Dong, S. Sun, et al., Detecting miscoded diabetes diagnosis codes in electronic health records for quality improvement: temporal deep learning approach, JMIR medical informatics 8 (12) (2020) e22649.
- [71] C. Shivade, P. Raghavan, E. Fosler-Lussier, P. J. Embi, N. Elhadad, S. B. Johnson, A. M. Lai, A review of approaches to identifying patient phenotype cohorts using electronic health records, Journal of the American Medical Informatics Association 21 (2) (2014) 221–230.
- [72] G. Hripcsak, D. J. Albers, Next-generation phenotyping of electronic health records, Journal of the American Medical Informatics Association 20 (1) (2013) 117–121.
- [73] C. C. Holt, Forecasting seasonals and trends by exponentially weighted moving averages, International journal of forecasting 20 (1) (2004) 5–10.
- [74] S. Vluymans, Learning from imbalanced data, in: Dealing with Imbalanced and Weakly Labelled Data in Machine Learning using Fuzzy and Rough Set Methods, Springer, 2019, pp. 81–110.
- [75] N. V. Chawla, K. W. Bowyer, L. O. Hall, W. P. Kegelmeyer, Smote: synthetic minority over-sampling technique, Journal of artificial intelligence research 16 (2002) 321–357.
- [76] N. Japkowicz, The class imbalance problem: Significance and strategies, in: Proc. of the Int’l Conf. on artificial intelligence, Vol. 56, Citeseer, 2000, pp. 111–117.
- [77] T. J. Lakshmi, C. S. R. Prasad, A study on classifying imbalanced datasets, in: 2014 First international conference on networks & soft computing (ICNSC2014), IEEE, 2014, pp. 141–145.
- [78] C. Bunkhumpornpat, K. Sinapiromsaran, C. Lursinsap, Mute: Majority under-sampling technique, in: 2011 8th International Conference on Information, Communications & Signal Processing, IEEE, 2011, pp. 1–4.
- [79] C. X. Ling, C. Li, Data mining for direct marketing: Problems and solutions., in: Kdd, Vol. 98, 1998, pp. 73–79.
- [80] M. Kubat, S. Matwin, Addressing the curse of imbalanced data sets: One-sided sampling, in: Proceedings of the fourteenth international conference on machine learning, 1997, pp. 179–186.
- [81] H. He, Y. Bai, E. A. Garcia, S. Li, Adasyn: Adaptive synthetic sampling approach for imbalanced learning, in: 2008 IEEE international joint conference on neural networks (IEEE world congress on computational intelligence), IEEE, 2008, pp. 1322–1328.
- [82] Q. Wang, W. Cao, J. Guo, J. Ren, Y. Cheng, D. N. Davis, Dmp_mi: an effective diabetes mellitus classification algorithm on imbalanced data with missing values, IEEE Access 7 (2019) 102232–102238.
- [83] D. Bahdanau, K. Cho, Y. Bengio, Neural machine translation by jointly learning to align and translate, arXiv preprint arXiv:1409.0473.
- [84] A. Vaswani, N. Shazeer, N. Parmar, J. Uszkoreit, L. Jones, A. N. Gomez, Ł. Kaiser, I. Polosukhin, Attention is all you need, Advances in neural information processing systems 30.
- [85] K. Shridhar, F. Laumann, M. Liwicki, A comprehensive guide to bayesian convolutional neural network with variational inference, arXiv preprint arXiv:1901.02731.
- [86] N. Seedat, C. Kanan, Towards calibrated and scalable uncertainty representations for neural networks, arXiv preprint arXiv:1911.00104.
- [87] J. Gawlikowski, C. R. N. Tassi, M. Ali, J. Lee, M. Humt, J. Feng, A. Kruspe, R. Triebel, P. Jung, R. Roscher, et al., A survey of uncertainty in deep neural networks, arXiv preprint arXiv:2107.03342.
- [88] Y. Gal, Z. Ghahramani, Dropout as a bayesian approximation: Representing model uncertainty in deep learning, in: international conference on machine learning, PMLR, 2016, pp. 1050–1059.
- [89] C. Szegedy, W. Zaremba, I. Sutskever, J. Bruna, D. Erhan, I. Goodfellow, R. Fergus, Intriguing properties of neural networks, arXiv preprint arXiv:1312.6199.
- [90] A. Nguyen, J. Yosinski, J. Clune, Deep neural networks are easily fooled: High confidence predictions for unrecognizable images, in: Proceedings of the IEEE conference on computer vision and pattern recognition, 2015, pp. 427–436.
- [91] B. Zhong, R. L. Da Silva, M. Li, H. Huang, E. Lobaton, Environmental context prediction for lower limb prostheses with uncertainty quantification, IEEE Transactions on Automation Science and Engineering 18 (2) (2020) 458–470.
- [92] T. Nair, D. Precup, D. L. Arnold, T. Arbel, Exploring uncertainty measures in deep networks for multiple sclerosis lesion detection and segmentation, Medical image analysis 59 (2020) 101557.
- [93] R. L. da Silva, B. Zhong, Y. Chen, E. Lobaton, Improving performance and quantifying uncertainty of body-rocking detection using bayesian neural networks, Information 13 (7) (2022) 338.
- [94] A. G. Roy, S. Conjeti, N. Navab, C. Wachinger, A. D. N. Initiative, et al., Bayesian quicknat: Model uncertainty in deep whole-brain segmentation for structure-wise quality control, NeuroImage 195 (2019) 11–22.
- [95] Y. Gal, R. Islam, Z. Ghahramani, Deep bayesian active learning with image data, in: International Conference on Machine Learning, PMLR, 2017, pp. 1183–1192.
- [96] D. Lukovnikov, S. Daubener, A. Fischer, Detecting compositionally out-of-distribution examples in semantic parsing, in: Findings of the Association for Computational Linguistics: EMNLP 2021, 2021, pp. 591–598.