XXXX-XXXX
1]Department of Physics, Graduate School of Science, Kobe University, Rokkodai-cho, Nada-ku, Kobe-shi, Hyogo, 657-8501, Japan 2]Division of Physics and Astronomy Graduate School of Science, Kyoto University, Kitashirakawaoiwake-cho, Sakyo-ku, Kyoto-shi, Kyoto, 606-8502, Japan 3]Department of Physics, Tohoku University, Aramakiazaaoba 6-3, Aoba-ku, Sendai-shi, Miyagi, 980-8578, Japan 4]Kamioka Observatory, Institute for Cosmic Ray Research, the University of Tokyo, Higashi-Mozumi, Kamioka-cho, Hida-shi, Gifu, 506-1205, Japan 5]Kavli Institute for the Physics and Mathematics of the Universe (WPI), the University of Tokyo, 5-1-5 Kashiwanoha, Kashiwa-shi, Chiba, 277-8582, Japan 6]Research Center for Neutrino Science, Tohoku University, Sendai 980-8578, Japan 7]Waseda Research Institute for Science and Engineering, Waseda University, 3-4-1 Okubo, Shinjuku, Tokyo 169-8555, Japan 8]Department of Physics, Tokyo University of Science, 2641 Yamazaki, Noda-shi, Chiba, 278-8510, Japan
Direction-sensitive dark matter search with three-dimensional vector-type tracking in NEWAGE
Abstract
NEWAGE is a direction-sensitive dark matter search experiment with a three-dimensional tracking detector based on a gaseous micro time projection chamber. A direction-sensitive dark matter search was carried out at Kamioka Observatory with a total live time of 318.0 days resulting in an exposure of 3.18 kgdays. A new gamma-ray rejection and a head-tail determination analysis were implemented for this work. No significant non-isotropic signal from the directional analysis was found and a 90% confidence level upper limit on spin-dependent WIMP-proton cross section of 25.7 pb for WIMP mass of 150 GeV/ was derived. This analysis marked the most stringent upper limit in the direction-sensitive dark matter searches.
Dark matter, WIMP, TPC, NEWAGE
1 Introduction
Existence of the dark matter in the universe is nowadays widely believed because the dark matter naturally explains observational results in various scales of the universe. Weakly Interactive Massive Particles (WIMPs), which are promising candidates of the dark matter, have been searched for by a number of direct search experiments pursuing for the nuclear recoil by WIMPs ARBEY2021103865 . However, no conclusive evidence of the direct detection of WIMPs was obtained yet.
There are two possible characteristic signatures for the direct detection of the dark matter. One is the annual modulation in the energy spectrum caused by the Earth’s motion around the Sun. The modulation amplitude is expected to be a few percent BAUM2019262 . The other is the directional non-isotropy of the nuclei recoils. Since the Solar System is orbiting in the Milkyway Galaxy, the incoming direction of the dark matter is biased to the direction of the Solar System’s motion. The directional distribution of the nuclear recoil also has an asymmetry and this asymmetric ratio can be as large as tenfold in some cases PhysRevD.37.1353 . Thus, the observation of the non-isotropic signal for the nuclear recoil direction distribution is expected to be a strong evidence for the dark matter detection.
NEWAGE (NEw generation WIMP search with an Advanced Gaseous tracker Experiment) is a direction-sensitive direct WIMP search experiment using a low-pressure gaseous micro Time Projection Chamber (-TPC) for the detection of three-dimensional (3D) tracks of recoil nuclei. NEWAGE started direction-sensitive direct WIMP searches in an underground laboratory in 2007 and has updated the results since then. In 2020, head-tail determinations of the nuclear tracks were implemented and a limit by a vector-like tracking analysis was obtained (NEWAGE2020 results yakabe_ptep ). In 2021, the limit was updated by installing a low alpha ray emission rate detector called LA-PIC hashimoto_nim ; ikeda_ptep . Here the limit was obtained without the vector-like analysis (NEWAGE2021 results) because of the limited statistics. In this paper, we report a result of a direction-sensitive dark matter search with a new gamma-ray rejection cut and a vector analysis for 3D-tracks (3D-vector analysis) for a data 2.4 times larger than NEWAGE2021 results in total.
2 Detector
A gaseous time projection chamber, NEWAGE-0.3b”, was used for this study. The detector overview is described in subsection 2.1. Energy calibration using alpha rays are discussed in subsection 2.2. Event selections already implemented in our previous analysis are summarized in subsection 2.3. An event selection newly-added for this work utilizing the track information for a better gamma-ray rejection is described in subsection 2.4. The reconstruction method of the 3D-vector tracks is explained in subsection 2.5 as the head-tail analysis. Finally, the detector performances on the efficiencies and the angular resolution of the nuclear recoil are shown in subsections 2.6 and 2.7, respectively.
2.1 NEWAGE-0.3b”
NEWAGE-0.3b”, refurbished in 2018 by replacing the readout device (micro pixel chamber, -PIC) with a low alpha-emission rate one (LA-PIC hashimoto_nim ), was used for this work. Figure 1 shows schematic drawings of the NEWAGE-0.3b” detector and its detection scheme. The detection volume was 31 31 41 cm3 in size and was filled with low-pressure gas of CF4 at 76 Torr (0.1 atm) for this work. The location of (0, 0, 0) in the detector coordinate is set at the center of the TPC. The LA-PIC has a pixel structure of 768 768 with a pitch of 400 m. Amplified charge at each pixel is read through 768 anode (hereafter X-axis) and 768 cathode(hereafter Y-axis) strips. Signals read through the strips are processed by Amplifier-Shaper-Discriminator chips (SONY CXA3653Q ASD ). The processed signals are then divided into two. One is compared with a threshold voltage in the chips and the time-over-thresholds (TOTs) of 768 + 768 strips are recorded with a 100 MHz frequency clock. The other 768 cathode strips were grouped into four channels and their waveforms were recorded with a 100 MHz flash analog-to-digital converters (FADCs). A detected track is parameterized with its energy, length, elevation angle , azimuth angle (see Figure 1) and some other parameters defined in the following subsections.
2.2 Energy calibration
The energy calibration was performed with alpha rays produced by reactions. A glass plate coated with a 10B layer was set in the TPC volume as illustrated in Fig. 1. Thermal neutrons were irradiated from the outside of the chamber, captured in the 10B layer, and then produced alpha rays and 7Li nuclei. Because our 10B layer has a sub-micron thickness, alpha rays and 7Li nuclei deposit a part of energy in the 10B layer. Consequently alpha rays and 7Li nuclei produce continuous spectrum up to 1.5 MeV and 0.8 MeV, respectively. Since the energy of the charged particle is not only converted to the ionization but partially deposited to other components such as phonon, it doesn’t necessarily correspond to the detected energy. In order to take this effect, or the ionization quenching factor, into account, ionization quenching factors in CF4 gas at 0.1 atm were calculated with SRIM SRIM . Figure 2 shows the ionization quenching factors for alpha-rays (He), C and F nuclei as functions of their recoil energies in CF4 gas at 0.1 atm. In the following of this paper, the unit of detected energy is expressed as the electron equivalent energy (i.e. keVee), which takes the ionization quenching factor into account.
The obtained spectrum is a sum of the thermal neutron capture events and elastic scattering events by fast neutrons. By comparing these spectra with the Monte-Carlo (MC) simulation results by Geant4 AGOSTINELLI2003250 , the gas gain and the energy resolution were determined. Figure 3 shows one of the calibration results. The 1.5 MeV and 0.8 MeV edges of the thermal neutrons were observed and consistent with our MC modelling.
Although the energy calibration was performed using alpha-rays with an energy of 1.5 MeV, the region of interest in energy is about 50 keVee. In order to compensate this difference of energy scale, an additional study had been performed previously using smaller detector which had the same components as the NEWAGE-0.3”. The study validate linearity of the energy scale using a 55Fe source in addition to the 10B plate, corresponding to the energy range between 5.9 keV and 1.5 MeV.
The detector gas contains rare gas radon isotopes, 220Rn and 222Rn, emitted from the detector materials as natural contaminations. The high-energy calibration was performed by the alpha rays from radon isotopes and their progenies. 220Rn and its progeny produce alpha rays with energies of 6.05 MeV, 6.29 MeV, 6.78 MeV, and 8.79 MeV, while 222Rn and its progeny produce alpha rays with energies of 5.49 MeV, 6.00 MeV, and 7.69 MeV. Because the ratio of 220Rn to 222Rn was not known, the measured spectra were fit with the simulated spectrum of 220Rn and 222Rn separately and the difference was treated as the systematic error of the energy scale.

2.3 Standard event selections
Several event selections had been established as standard event selections by NEWAGE2021 analysis. These selections aim to cut non-physical electronics noise events and electron track events mainly originating from ambient gamma-rays. The standard event selections are briefly explained here, while details can be found in Ref. ikeda_ptep .
- Fiducial volume cut
-
A fiducial volume of 28 24 41 cm3 was defined in the detection volume of 31 31 41 cm3. Any events were required to be fully contained in the fiducial volume so as to discriminate the events from the walls of the TPC field cage and the 10B glass plate. - Length-Energy cut
-
The amount of energy loss by a charged particle per a unit length depends on the particle type. Electron events were discriminated by setting a maximum track length for a given energy. - TOTsum/Energy cut
-
The energy deposition on each strip was recorded as TOT. A total TOTs of all strips were defined as TOTsum. Since the nuclear recoil events have larger TOTsum than those of the electron recoil events for a given energy, electron events were discriminated by setting a minimum TOTsum/energy value for a given energy. (See the left panel of Fig. 4, for instance.) - Roundness cut
-
“Roundness” was defined as the root-mean-square deviation of a track from the best-fit straight line. Nuclear recoil events with a short drift distance have small roundnesses because they are less affected by the gas diffusion. Background events in the gas region between the LA-PIC and the GEM were discriminated by setting a minimum roundness value.
2.4 TOTsum-Length cut
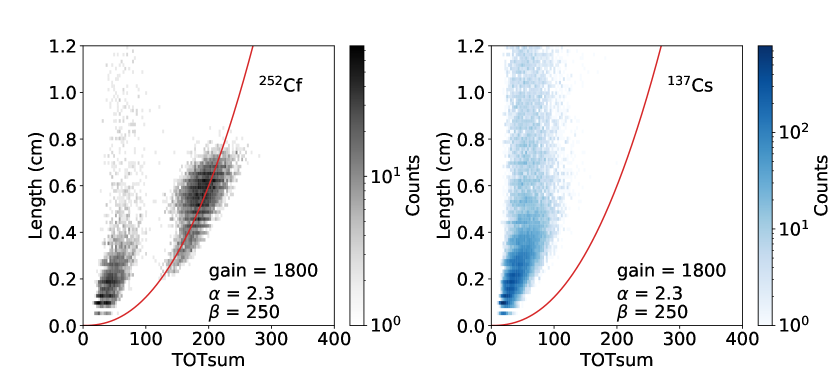
The detector was operated at a higher gas gain (typically 1800) than that of NEWAGE2021 (1200) aiming for a better detection efficiency of nuclear recoil events. One of the expected drawbacks of the high-gain operation was the increase of the background gamma-ray events in contrast to the detection efficiency improvement of nuclear recoils owing to the increase of the number of hit strips. Figure 4 shows the TOTsum/Energy distributions as functions of the energy after the fiducial volume cut. The gas gains of the left and right panels are 1200 and 1800, respectively. It should be noted that each calibration run with the source had been conducted at a common live time of 0.18 days. It is therefore clearly seen that the detection efficiency of electron events ( data) are significantly larger in a measurement at a high gas gain because the number of shown events are increased. It is also seen that the TOTsum/Energy of electron events in the high-gain data have a large component which excess the selection line of TOTsum/Energy selection shown with a red line. This result indicated that the standard event selections were not sufficient for the high-gain operation data.
A new cut, “TOTsum-Length cut”, was implemented in order to improve the discrimination power against the gamma-ray events. Nuclear recoil events have large TOTsums and short track lengths. On the other hand, the electron recoil events have smaller TOTsums and longer tracks. Figure 5 shows the track length distributions as a function of TOTsum for the irradiation with a 252Cf source and a 137Cs source for the cases with gas gains of 1200 and 1800. Since our energy threshold is set to be 50 keVee, the data in an energy range of 50–60 keVee are selected. We confirmed a good separation of the electron (seen in both plots) and nuclear distributions (seen only in the 252Cf plot) in this parameter space even for a high-gain operation data. In order to discriminate electron events, an empirical function written by
| (1) |
was introduced. Here L is the track length, S is the TOTsum, and and are parameters for the cut definition. Here was fixed within a run while was an energy-dependent parameter.
 |
 |
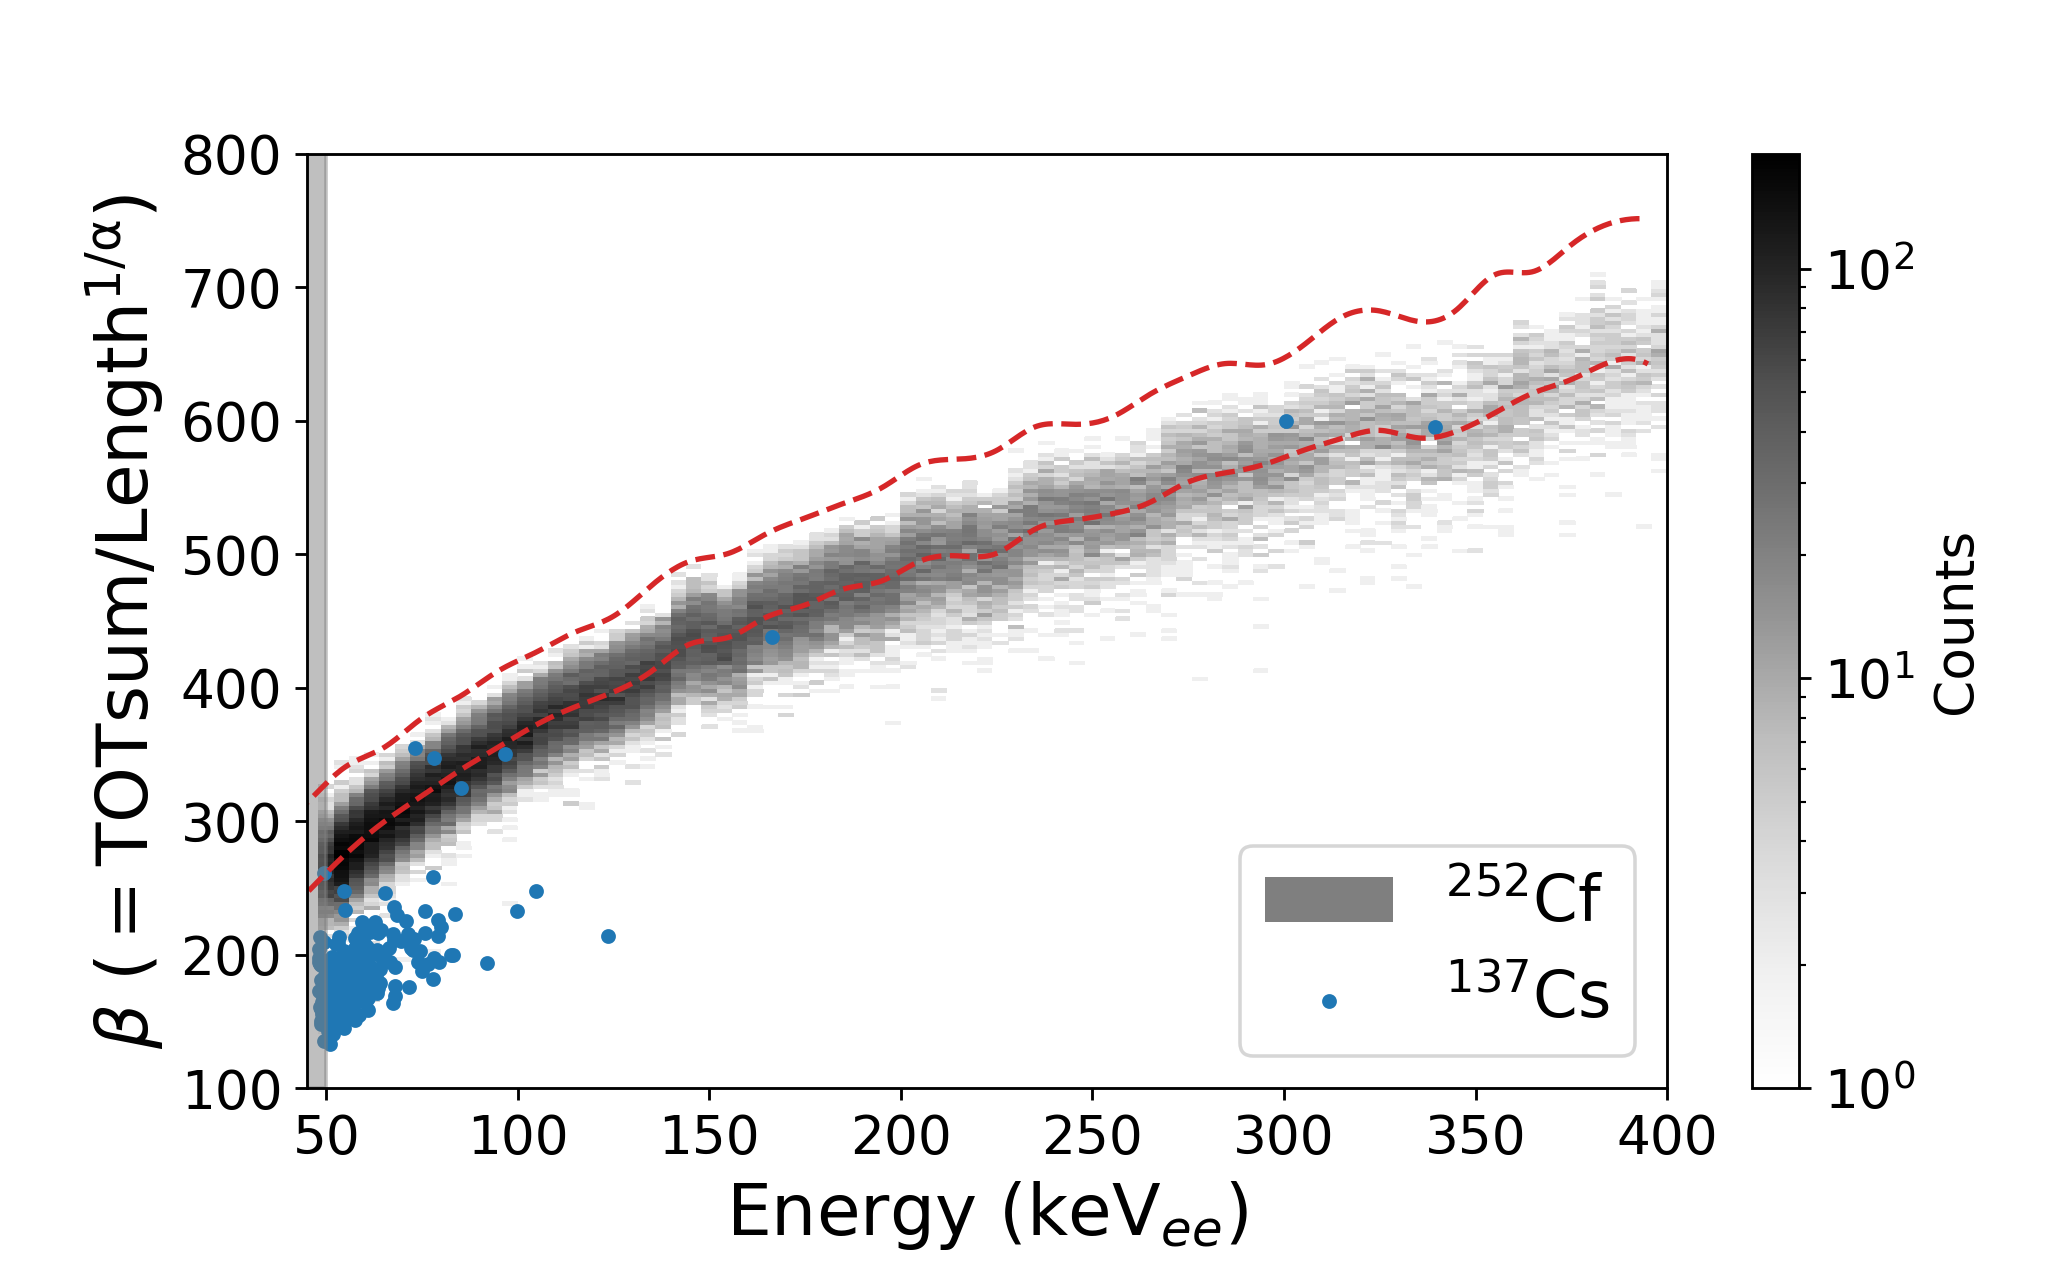
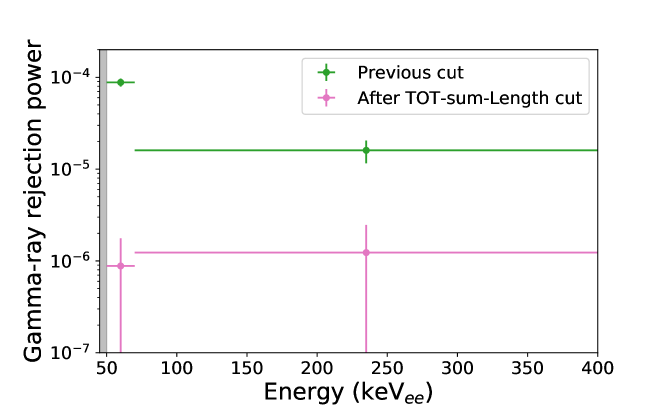
We first determined and values in the 50–60 keVee energy range for each period. The period is a set of data taken under a same detector condition and will be summarized in Section 3. The parameters were determined so that they would give the best rejection of gamma-ray events while retaining the selection efficiency of nuclear recoil events to be greater than 50%. Here, the selection efficiency for a specific selection is defined as the ratio of the remaining number of events to that before the selection. We then fixed and determined for a given energy. Figure 6 shows the energy dependence of . The black and blue dots represent the data with a 252Cf and a 137Cs sources, respectively. The distribution of values of the nuclear recoils events was fit with Gaussian in every 10 keV energy bin. The region between the mean and upper of the Gaussian indicated with red lines in Fig. 6 was set as the nuclear recoil region and the rest was rejected. Gamma-ray rejection powers with and without this cut are shown in Fig. 7. A gamma-ray rejection power of 8.8 10-7 was achieved, which is about two orders of magnitude better than that in NEWAGE2021.
2.5 Head-tail analysis
Importance of the track sense recognition, or the head-tail determination, has been stressed for years Anne_2007 ; Ciaran_2015 . We started to use the head-tail determination for the direction-sensitive dark matter search analysis with a limited efficiency in Ref. yakabe_ptep . An analysis update improved the efficiency and head-tail determinations for 3D tracks, or 3D-vector analysis, were used for this work. The first step in reconstructing the direction of a track is to obtain the relative arrival times of ionized electrons in the readout strips. These relative arrival times on X or Y strips are converted into relative Z positions taking account the drift velocity. The charge detected on the strip, or a hit, is thus assigned a (X, Z) or (Y, Z) hit-position. Angles of a track in the X-Z and Y-Z planes are known by fitting the hit-positions with straight lines. 3D-axial directions of the tracks in the detector coordinate system are determined from these two angles in the X-Z and Y-Z planes. These reconstructed tracks are not 3D-vector ones at this stage because the head-tail of the track is not determined yet.
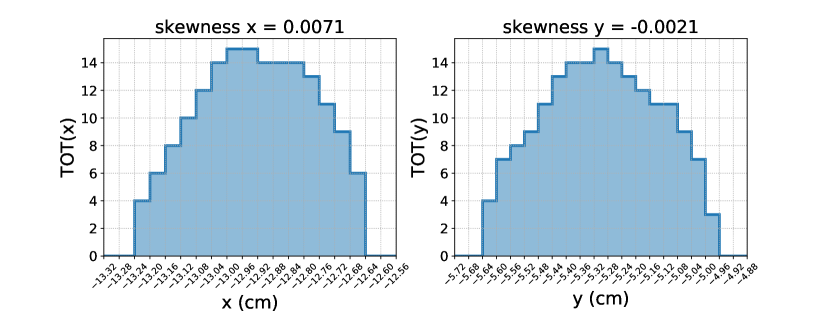
The head-tail of a track can be determined by observing the asymmetry of the energy deposition along its trajectory. The fluorine-nuclear track with an energy of our interest (less than 400 keVee) is known to deposit its energy large at the starting point and small around its end point. This phenomena can be observed as large TOTs at the starting point and small TOTs around its end point.
Figure 8 shows observed TOT distributions of an event along X and Y strips. This event was obtained with a source placed at (25 cm, 0 cm, 0 cm) so that we expect to observe fluorine nucleus tracks running from +X to -X directions. An asymmetry of the TOT distribution along the X-axis is seen while that along the Y-axis is more symmetric. This asymmetry is quantified by parameters defined as following equations,
| (2) | ||||
| (3) |
Here is the TOT observed on strip , and represents the means value. The ability to determine the head-tail, called the head-tail power , is defined as
| (4) |
where is the total number of events, and is the number of events head-tails of which were correctly determined by the skewness. Determinations of are discussed later.
In our previous work, we selected events with small and large skewness to increase the head-tail power at a cost of lowering the selection efficiency to less than one half yakabe_ptep . The analysis was updated so that the the selection efficiency was recovered while the was retained; the use of and were determined according to the azimuth direction of the tracks. For the tracks along the X-coordinate direction (0 45 ∘), was used, and was used for the tracks with 45 90∘). In addition, number of hit strips were increased by the operation at a high gas gains.
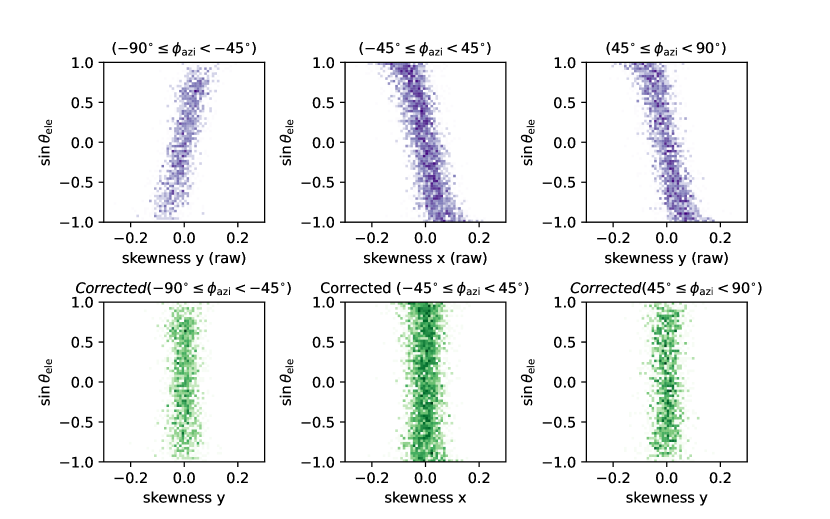
The original values of skewness were found to be correlated with in the measurement using 252Cf source. The upper panels of Fig. 9 show the correlation between and skewness in the 252Cf run. Here, since nuclear recoils scatter toward the direction of emitted neutrons from the 252Cf source, was determined in a range of . The skewness were corrected according to with cubic functions, which are empirically decided, and the corrected skewness values shown in the lower panels of Fig. 9 were used for further discussions.
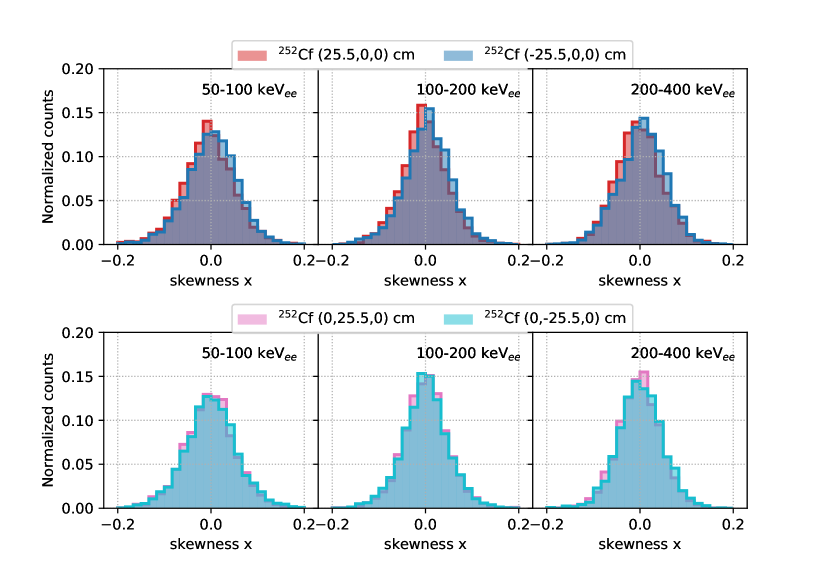
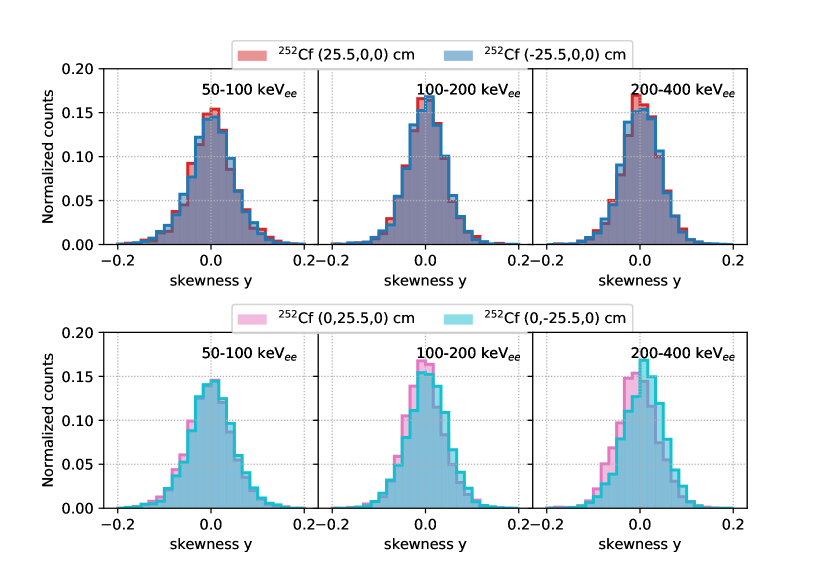
Figures 10 and 11 show skewness distributions of a 252Cf source data after all cuts for three energy ranges. Neutron irradiation data from X and X directions are shown with red and blue histograms in the upper panels of Fig. 10. They show different distributions as expected while the distributions for the Y direction irradiation data (lower panels of Fig. 10) did not show significant difference. The same trend was confirmed for as shown in Fig. 11. was defined by discriminating at . For instance, (+x) is defined as the number of events of of the red histograms in the top panel of Fig. 10. On the other hand, (-x) is defined as the number of events of of the blue histogram. indicates that the detector has no sensitivity for the head-tail information. Averaged values for 50–100 keVee, 100–200 keVee, and 200–400 keVee energy ranges were , , and , respectively. Details of are summarized in Table 1. The error of in each irradiation direction is the standard deviation of head-tail power determined for each period. The overall head-tail power error is the standard deviation of the s in each irradiation direction. Head-tail powers equivalent to those of Ref. yakabe_ptep were achieved without any specific selection for the head-tail determination.
| Energy range | (+x) (%) | (-x) (%) | (+y) (%) | (-y) (%) | (average) (%) |
|---|---|---|---|---|---|
| 50–100 keVee | 52.20.9 | 53.3 1.2 | 52.2 1.1 | 51.9 0.9 | 52.4 1.1 |
| 100–200 keVee | 52.6 1.4 | 53.2 1.2 | 53.5 1.2 | 52.5 1.0 | 52.9 1.2 |
| 200–400 keVee | 53.3 1.6 | 52.4 1.0 | 54.9 2.8 | 53.8 1.6 | 53.6 2.0 |
2.6 Efficiencies
There are two types of efficiencies regarding this study; the detection-selection and the directional efficiencies. The former, or the “absolute” efficiency, determines the number of detected-and-selected events while the latter, or the “relative” one, determines the directional distribution of these events without changing the total number of events. In order to determine the efficiencies including directionality, an isotropic data-set needs to be used. The isotropic data-set was made by summing-up the time-normalized data obtained by irradiating the detector with neutrons from a 252Cf source placed at six positions in , , and directions.
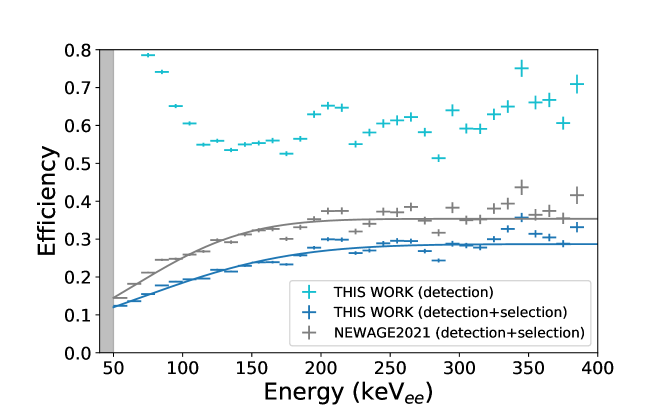
The detection-selection efficiency is defined as the number of nuclear recoil events after all selections divided by the expected number of nuclear recoils in the fiducial volume. Here, the expected number of nuclear recoils is estimated by the Geant4 simulation. Results are shown in Fig 12. It should be noted that the increase of the detection efficiency seen below 100 keVee is due to the contamination of the gamma-ray events and is not real. The contamination is removed with the selections to a negligible level. The detection efficiency is about 60% above 200 keVee. The main reason of not reaching at 100% is that the gas gain being not high enough to trigger all the nuclear recoil events. The detection-selection efficiency above 200 keVee is half of the detection efficiency because of the mean value for the TOTsum-Length selection. A 20%-reduction of the detection-selection efficiency from NEWAGE2021 should also attribute to the additional cut, which still gives a large advantage in the signal-to-noise ratio if we consider the gain on the rejection shown in Fig. 7. The detection-selection efficiency shown in Fig. 12, or the ”absolute” efficiency, can be used to calculate the expected number of events for a given WIMP or background model. It can also be used to unfold the measured energy spectrum and obtain an ”effective” spectrum for the comparison of the background rates.
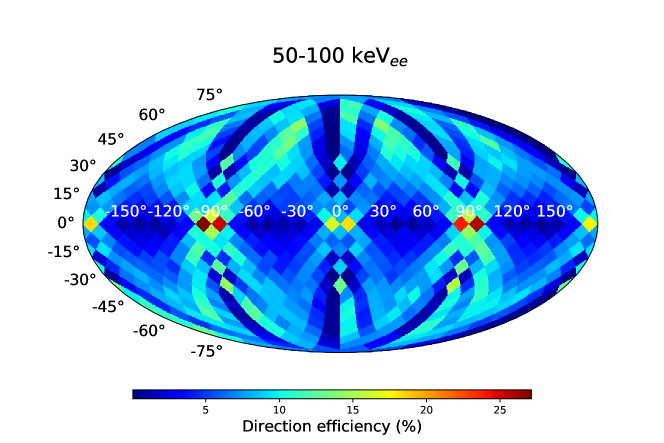
The directional efficiency is defined as the number of recoil events in a angular distribution, divided by the number of total recoil events. Thus the directional efficiency is expressed as a sky map, or the relative response in the elevation () - azimuth () plane, for isotropic recoils. The possible non-homogeneity of the directional efficiency mainly originates from the reconstruction algorithm. The 3D recoil direction, including the sense (head-tail) of the track, is reconstructed from the TOT-distributions of X and Y strips. Figure 13 shows the obtained - distributions of an isotropic recoil calibration data. Since this map is to know the ”relative” or reconstruction efficiency of the directions, the color map is a relative one to be used with the total number of events being conserved. It is seen that the tracks tend to be reconstructed to align with the strips, for the tracks parallel to the detection plane, or the tracks with . The directional efficiencies shown in Fig. 13, or the relative efficiency, can be used to make an expected recoil distribution for a given number of expected events calculated by the detection-selection efficiency.
2.7 Angular resolution
The angular resolution was evaluated by comparing the distribution of the recoil angle of neutron irradiation data with the simulated ones smeared by various angular resolutions. Here is the angle between the incoming neutron direction and the reconstructed nuclear-recoil direction. Since the head-tails of the tracks are determined and considered in the analysis independent from the effect of the angular resolution, the angular resolution was evaluated with the distribution of absolute value of . value defined by Eq. (5) was calculated for a given angular resolution .
| (5) |
where is the number of events in the -th bin of the histogram of measured , and is the number of events in the -th bin of the histogram of the distribution simulated by Geant4 smeared with the angular resolution, and is the number of bins in that histogram. The angular resolution at the minimum value was adopted. The angular resolution was 58.1 degree in the energy range of 50–100 keVee.
3 Experiment
A direction-sensitive dark matter search was performed in Laboratory B, Kamioka Observatory (36.25’N, 137.18’E), located 2700 m water equivalent underground. The measurement was carried out from December 12th, 2017 to March 26th, 2020, subdivided into eight periods. The period was renewed when the detector was evacuated and filled with new CF4 gas. The period information is summarized in Table 2. The Z-axis of the NEWAGE-0.3b” detector was aligned to the direction of S30∘E. The target gas was CF4 at 76 Torr (0.1 atm) with a mass of 10 g in an effective volume of 28 24 41 cm3 (27.6 L). The total live time is 318 days corresponding to an exposure of 3.18 kgdays, which is 2.4 times larger exposure than that of NEWAGE2021.
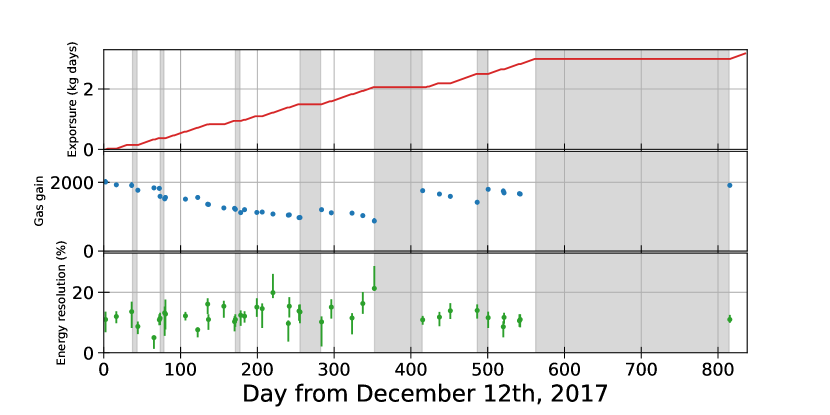
Various environmental parameters were monitored during the measurement to confirm the stability of the detector. Figure 14 shows the time dependences of the integrated exposure, the gas gain and the energy resolution. The energy calibrations and the efficiency measurements were performed approximately every two weeks. The energy scale was corrected by the monitored gas gain. The mean value of the energy resolution was 12.4% with a standard deviation of 3.0% during the measurement. No variation of the energy resolution beyond errors was observed.
| Period | Date | Gas gain | Live time (days) | Exposure (kgdays) |
|---|---|---|---|---|
| RUN20-1 | 2017/12/12 – 2018/01/18 | 2000 | 13.5 | 0.135 |
| RUN20-2 | 2018/01/23 – 2018/02/23 | 1750 | 20.0 | 0.200 |
| RUN21 | 2018/02/28 – 2018/06/01 | 1550 | 58.6 | 0.586 |
| RUN22-1 | 2018/06/06 – 2018/08/24 | 1110 | 52.5 | 0.525 |
| RUN22-2 | 2018/09/20 – 2018/11/29 | 1200 | 60.5 | 0.605 |
| RUN23 | 2018/12/05 – 2019/04/12 | 1750 | 45.9 | 0.459 |
| RUN24 | 2019/04/26 – 2019/06/27 | 1800 | 49.4 | 0.494 |
| RUN25 | 2020/03/04 – 2020/03/26 | 1950 | 17.6 | 0.176 |
| Total | 2017/12/12 – 2020/03/26 | 318.0 | 3.180 |
The event selections described in subsection 2.3 and 2.4 were applied to the data. Figure 15 shows the energy spectrum after each event selection. The statistical errors are shown for the spectrum after all selections. We confirm that the background in this work and NEWAGE2021 was consistent.

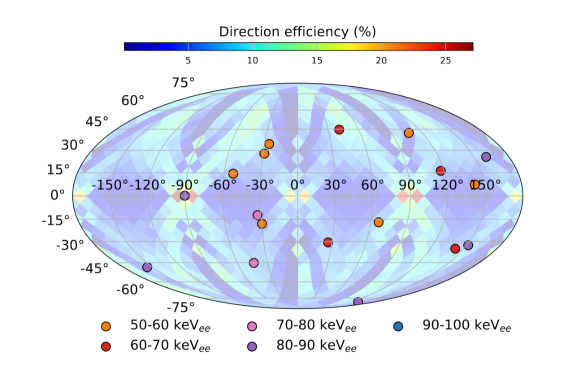
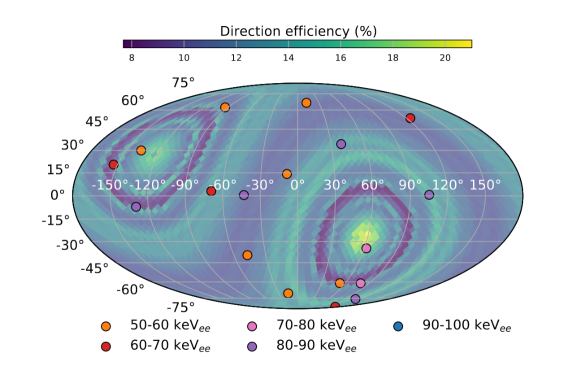
Figure 16 shows the directions of measured nuclear recoil events in the detector coordinate (a) and the galactic coordinate (b), respectively. The was calculated for each event in Fig. 16 (b) and distributions are shown in Fig. 17. The is binned by four and the energy is binned every 10 keVee.
4 Results
A directional WIMP search analysis was performed with an assumption of the standard halo model. Here the Maxwell distribution with a velocity dispersion of 220 km/sec, and an escape velocity of 650 km/sec were assumed PIFFL . The local density of 0.3 was assumed. The spin parameter for the of 0.647 was used in this analysis LEWIN199687 . Considering the nuclear quenching factor, the simulated energy spectrum by the WIMP-nuclear scattering was re-scaled by SRIM SRIM , which represented the observed alpha-ray in the previous experiment Nishimura2009 . The spectra of for each energy bin as shown in Fig. 17 were simultaneously compared with sum distributions of the WIMP signal and isotropic background using the binned likelihood ratio method.
A statistic value was defined as Eq. (6).
| (6) |
where,
| (7) | ||||
| (8) | ||||
| (9) |
Subscripts and are the bin-number of the and the energy, respectively. The expected and measured number of events in bin are described as and , respectively. is written as Eq. 7, where is the expected number of the WIMP-nucleus scatterings, and is the expected number of background events. is the WIMP-proton cross section. was estimated using the Geant4 simulation based on the flux measurements of the ambient gamma-rays, the ambient neutrons, the alpha rays from the radon, and the alpha rays from the LA-PIC surface. The dominant background components in the energy range of 50–100 keVee were the ambient gamma-rays and the alpha rays from the radon (see Ref. ikeda_ptep for details). Expected background spectra are shown in Fig. 15 for reference. The largest systematic uncertainty of the expected rate arise from the energy scale uncertainty. This uncertainty was estimated from the discrepancy of the energy calibration between 10B, 220Rn, and 222Rn measurements discussed in subsection 2.2. The uncertainty was evaluated in each run. The weighted average of the energy scale uncertainty was +13.2% and -2.3%. The uncertainties of the background rate are the measurement errors of radioactivities for the ambient gamma-rays and the radons. Here the ambient gamma-ray flux was measured with a CsI scintillator NishimuraPhD and the radon background was estimated with the high energy spectrum of this work. Nuisance parameters and considering the systematic uncertainty from the energy scale and the background estimation are defined as Equations (8) and (9). Possible shifts of the energy scale and the number of expected backgrounds are expressed as and .
was minimized for a given WIMP mass with , pull-terms and as fitting parameters. We first explain the procedure for the WIMP mass of 150 GeV/ case. A minimum /NDF of 20.4/17 was obtained for =14.6 pb. The left panel in Fig. 17 shows the distributions of the best-fit case. A chi-square distribution was created from a dummy sample of isotropic background model using Monte Carlo simulations. This test gave the p-value of 0.60 for the measured result. Observed distribution was thus found to be consistent with the background-only model. Since no significant WIMP excess was obtained, an upper limit at 90% confidence level (C.L.) was set for the spin-dependent WIMP-proton scattering cross section. The likelihood ratio is defined as,
| (10) |
Here, and are the value of and the minimum value of calculated by varying , respectively. The 90% C.L. upper limit of the WIMP-proton cross section, , is determined as follows,
| (11) |
Using the above equation, the 90% C.L. upper limit of the spin-dependent cross section was found to be 25.7 pb for a WIMP mass of 150 GeV/. The distributions with the upper limit of 90% C.L. are shown in the right panels of Fig. 17.
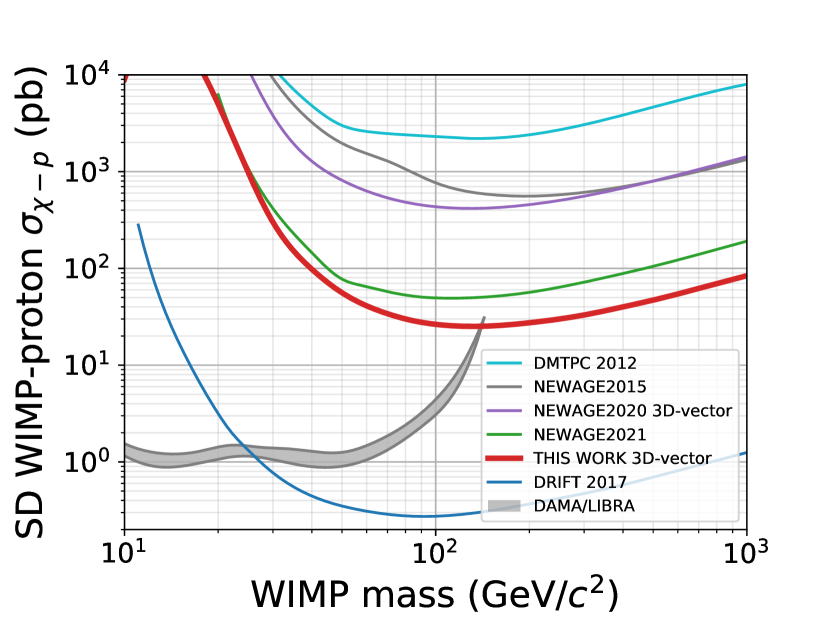
Upper limits of the cross sections were obtained for other WIMP masses by the same procedure. Figure 18 shows the upper limits at 90% C.L. of the spin-dependent WIMP-proton cross sections as a function of the WIMP mass. Compared to the NEWAGE2020 results, which was analyzed by the 3D-vector method using the standard -PIC, this upper limit updates by about one order of magnitude. This is due to the reduction of surface background events with the LA-PIC. Furthermore, compared to the NEWAGE2021 result, the statistics of the 2.4 factor and an updated analysis including the background estimation, improved the limits by a factor of about two for WIMPs heavier than 100 GeV/. In the NEWAGE2021 analysis, the exclusion limit in the WIMP mass below 100 GeV/ was better than expected due to the statistical fluctuation. This work improved the statistical uncertainty, in addition to the improvement of background estimation. This results in the update of the exclusion limit curve in any WIMP mass region. We marked the most stringent limit via the directional analysis.
The 3D-vector method was successfully implemented in the analysis without impact on the upper limit of the WIMP-proton cross section in the background-dominant analysis. The directional analysis including head-tail information demonstrates the possibility to reveal the property of WIMP.

5 Discussions
A new limit by a directional dark matter search with a 3D-vector analysis was obtained by this work. Although we started to search the region of one of the interpretations of the DAMA/LIBRA’s annual modulation signal DAMA , a significant improvement of the sensitivity is needed for the search of the region of more interest. The improvements can be realized mainly in three aspects: the detection-selection efficiency, the energy threshold, and the backgrounds.
The detection-selection efficiency at 50–60 keVee is 12.5%, which indicates the statistics can be increased by a factor of eight at most for a same exposure by an improvement of the detection-selection efficiency. A measurement with a higher gas gain will increase the trigger efficiency. A better gamma-ray rejection analysis, introducing machine-learning methods, would compensate the expected increase of the gamma-ray background rate and allow us to operate the detector at a higher gas gain. Shielding the detector is an independent hardware approach to reduce the gamma-ray background events.
The current energy threshold (50 keVee) is mainly limited by the track length of the recoil events. Typical length of the track of fluorine nuclear recoil below 50 keVee in CF4 gas at 76 Torr (0.1 atm) is less than 1 mm. This is comparable to the strip pitch of 0.4 mm and one can deduce that the angular resolution and gamma-ray rejection both get worth below this point. One solution is to operate the CF4 gas at a lower pressure than 76 Torr to allow the nuclei and electrons run longer and improve the angular resolution and gamma-ray rejection below 50 keVee.
The remaining background sources are the ambient gamma-rays and internal radons as shown in Fig. 15. We have already discussed the gamma-ray reduction above so we discuss the reduction of radon background here. The LA-PIC, significantly reduced the surface alpha rays in NEWAGE2021, still contains some material which emanates the radon gas hashimoto_nim . A new version of the -PIC series, LBG-PIC currently being developed. The material used for the LBG-PIC is carefully selected so that the total radon emanation is less than 1/10 of the LA-PIC.
With the improvements described above, we aim to explore the region claimed by DAMA/LIBRA DAMA and to improve the sensitivity to reach limits by other direct search experiments.
6 Conclusion
A direction-sensitive direct dark matter search was carried out at Kamioka Observatory with a total live time of 318.0 days corresponding to an exposure of 3.18 kgdays. A new gamma-ray rejection cut, which improved the gamma-ray rejection power to 8.8 10-7 while maintaining the detection-selection efficiency of the nuclear recoil at about 20% was introduced. This enabled us to use the high gas gain data, which was not used in the previous study due to the deterioration of the gamma-ray rejection power. The exposure was increased by a factor of 2.4. A 3D-vector reconstruction with a head-tail determination power of 52.4% in the energy range of 50–100 keV was also used for this study. As a result of the directional WIMP-search analysis, an upper limit of the spin-dependent WIMP-proton cross section of 25.7 pb for a WIMP mass of 150 GeV/ was derived. This limit marked the best direction-sensitive limit.
Acknowledgment
This work was partially supported by KAKENHI Grant-in-Aids (19H05806, 19684005, 23684014, 26104005, 21K13943, 22H04574, and 21H04471).
References
- (1) A. Arbey and F. Mahmoudi, Progress in Particle and Nuclear Physics, 119, 103865 (2021).
- (2) S. Baum, K. Freese, and C. Kelso, Phys. Lett. B, 789, 262–269 (2019).
- (3) D. N. Spergel, Phys. Rev. D, 37, 1353–1355 (Mar 1988).
- (4) R. Yakabe, K. Nakamura, T. Ikeda, et al., Prog. Theor. Exp. Phys, 2020(11), 113F01 (11 2020).
- (5) T. Hashimoto, K. Miuchi, et al., Nucl. Inst. Meth. A, 977, 164285 (2020).
- (6) T. Ikeda, K. Nakamura, T. Shimada, et al., Prog. Theor. Exp. Phys, 2021(6), 063F01 (04 2021).
- (7) O. Sasaki and M. Yoshida, 1, 440–444 vol.1 (1998).
- (8) F. Sauli, Nuclear Instruments and Methods in Physics Research Section A: Accelerators, Spectrometers, Detectors and Associated Equipment, 805, 2–24, Special Issue in memory of Glenn F. Knoll (2016).
- (9) James F. Ziegler, M.D. Ziegler, and J.P. Biersack, Phys. Res. Sec, B, 268(11), 1818 – 1823, 19th International Conference on Ion Beam Analysis (2010).
- (10) S. Agostinelli, J. Allison, K. Amako, et al., Phys. Res. Sec. A, 506(3), 250–303 (2003).
- (11) A. M. Green and B. Morgan, Astropart. Phys., 27, 142–149 (2007).
- (12) C. A. J. O’Hare and A. M. Green, Phys. Rev. D, 92, 142–149 (2015).
- (13) Piffl, T., Scannapieco, C., Binney, J., Steinmetz, M., Scholz, R.-D., Williams, M. E. K., de Jong, R. S., Kordopatis, G., Matijevic, G., Bienaymé, O., Bland-Hawthorn, J., Boeche, C., Freeman, K., Gibson, B., Gilmore, G., Grebel, E. K., Helmi, A., Munari, U., Navarro, J. F., Parker, Q., Reid, W. A., Seabroke, G., Watson, F., Wyse, R. F. G., and Zwitter, T., A&A, 562, A91 (2014).
- (14) J.D. Lewin and P.F. Smith, Astroparticle Physics, 6(1), 87–112 (1996).
- (15) H. Nishimura et al., Astroparticle Physics, 31(3), 185–191 (2009).
- (16) Nishimura, H., PhD thesis, Kyoto University (2008). (2008).
- (17) K. Nakamura, K. Miuchi, et al., Prog. Theor. Exp. Phys, 2015(4), 043F01 (04 2015), https://academic.oup.com/ptep/article-pdf/2015/4/043F01/19301446/ptv041.pdf.
- (18) S. Ahlen, J.B.R. Battat, et al., Phys. Lett. B, 695(1), 124 – 129 (2011).
- (19) J.B.R. Battat et al., Astropart. Phys., 91, 65–74 (2017).
- (20) C. Savage, P. Gondolo, and K. Freese, Phys. Rev. D, 70, 123513 (Dec 2004).