Hi intensity mapping with MeerKAT: forecast for delay power spectrum measurement using interferometer mode
Abstract
Neutral hydrogen (Hi) intensity mapping (IM) surveys are considered a promising tool for investigating the expansion history of the Universe. In this work, we explore the potential of MeerKAT Hi IM observations in interferometer mode to estimate the power spectrum and constrain cosmological parameters within typical dark energy models. We employ an approach called the “delay spectrum,” which allows us to separate the weak Hi signal from foreground contamination in the frequency domain. Our findings indicate that the choice of survey fields significantly impacts the fractional errors on the power spectrum () within a limited observational time of 10 hours. As the integration time increases from 10 hours to 10,000 hours, progressively decreases until cosmic variance begins to dominate. For a total observation time of 10,000 hours, the lowest at low can be achieved by tracking 100 points for MeerKAT L-band (900–1200 MHz) and 10 points for MeerKAT UHF-band (580–1000 MHz). Next, we assess the performance of Hi IM in constraining typical dark energy models. We find that MeerKAT Hi IM survey in interferometer mode demonstrates limited capability in constraining the dark-energy equation of state, even when combined with Planck data. Our analysis serves as a valuable guide for future MeerKAT observations in Hi IM surveys.
keywords:
techniques: interferometric – cosmology: large scale structure of Universe – cosmology: cosmological parameters – radio lines: general1 Introduction
In the last two decades, the accurate measurement of the cosmic microwave background (CMB) brings us to the era of precision cosmology. Another promising method for reaching precision cosmology is the cosmic large-scale structure (LSS) survey. At present, the cosmic LSS survey has made significant progress with galaxy redshift survey in constraining cosmological parameters, e.g. the 2dF Galaxy Redshift Survey (Colless et al., 2001; Cole et al., 2005), the 6dF Galaxy Survey (Jones et al., 2009; Beutler et al., 2011), the WiggleZ Dark Energy Survey (Blake et al., 2011; Drinkwater et al., 2010), the Baryon Oscillation Spectroscopic Survey (BOSS) (Alam et al., 2017) and the Dark Energy Survey (DES) (Abbott et al., 2018). In addition, the next generation galaxy survey targeting an even larger and deeper Universe, such as the Dark Energy Spectroscopic Instrument (Dey et al., 2019), the Large Synoptic Survey Telescope (Ivezić et al., 2019; Chisari et al., 2019) and the Euclid (Amendola et al., 2018), will significantly improve the measurement precision in the near future.
Neutral hydrogen (Hi) is widely regarded as a promising tracer of the underlying dark matter distribution of the late Universe. Hi can be detected with radio telescopes via its 21 cm line which arises from the spin-flip transition of ground state hydrogen atom. Nevertheless, it is known that detecting Hi signal in individual galaxies at higher redshift requires good angular resolution and sensitivity, which relies on large radio interferometers in the near future, such as the Square Kilometre Array (SKA). However, Hi survey of the cosmic LSS can be quickly carried out using existing radio telescopes via the intensity mapping (IM) methodology, which observes the total Hi intensity of the galaxies in a voxel (Battye et al., 2004; McQuinn et al., 2006; Loeb & Wyithe, 2008; Chang et al., 2008; Wyithe et al., 2008; Bagla et al., 2010; Seo et al., 2010; Lidz et al., 2011; Ansari et al., 2012). A variety of related studies show that Hi IM survey has great potential for cosmology studies, e.g. constraints on cosmological parameters and related studies on dark energy (Pritchard & Loeb, 2012; Bull et al., 2015; Pourtsidou et al., 2017; Olivari et al., 2018; Obuljen et al., 2018; Sprenger et al., 2019; Xu et al., 2018; Cheng et al., 2020; Xu & Zhang, 2020; Jin et al., 2020; Xiao et al., 2021; Zhang et al., 2021; Jin et al., 2021; Wu & Zhang, 2022; Scelfo et al., 2022; Berti et al., 2022; Wu et al., 2023a, b), primordial non-Gaussianity (Camera et al., 2013; Xu et al., 2015; Li & Ma, 2017; Ballardini et al., 2019; Karagiannis et al., 2020; Cunnington et al., 2020; Karagiannis et al., 2021; Viljoen et al., 2021), and neutrino mass (Villaescusa-Navarro et al., 2015; Zhang et al., 2020).
Hi IM LSS detection was first reported by measuring the cross-correlation function between the Hi map observed with Green Bank Telescope (GBT) and the DEEP2 optical redshift survey (Chang et al., 2010). The cross-correlation power spectrum between Hi IM survey and optical galaxy survey was also detected by the GBT and the WiggleZ Dark Energy Survey (Masui et al., 2013). Anderson et al. (2018) reported the cross-correlation power spectrum result of the Parkes Telescope’s Hi IM map and the 2dF galaxy survey. With the same dataset, Tramonte & Ma (2020) presented the feasibility of measuring Hi filament with the intensity mapping survey. Wolz et al. (2022) gave a joint analysis of GBT Hi IM and eBOSS survey. Recently, the MeerKAT Hi IM survey reported the cross-correlation power spectrum detection of the Hi map and the optical galaxy survey (Cunnington et al., 2023). Meanwhile, using the MeerKAT interferometer observations, Paul et al. (2023) reported the Hi IM auto power spectrum detection on Mpc scales. The Hi IM auto power spectrum on large scales, however, still remains undetected (Switzer et al., 2013a).
Several large radio telescopes or interferometers, such as the Five-hundred-meter Aperture Spherical radio Telescope (FAST, Nan et al., 2011), Baryon acoustic oscillations In Neutral Gas Observations (BINGO, Dickinson, 2014; Wuensche et al., 2020) and SKA (Maartens et al., 2015; Bacon et al., 2020), are built or planned for Hi survey. In addition, interferometers have the inherent advantage of being less sensitive to systematics. The smallest -modes accessible to an interferometer are determined by the shortest baselines. Therefore, a compacted radio interferometer array is required for probing the cosmic LSS, especially for the scales of baryon acoustic oscillation (BAO). To date, several interferometers, such as the Canadian Hydrogen Intensity Mapping Experiment (CHIME, Bandura et al., 2014), Hydrogen Intensity and Real-time Analysis eXperiment (HIRAX, Newburgh et al., 2016) and Tianlai (Chen, 2012; Wu et al., 2021), are designed as compacted arrays to probe the BAO.
The MeerKAT radio telescope array with 64 dish antennas of 13.5 m diameter is located in the Northern Cape Province of South Africa. As a precursor of SKA, MeerKAT has already been operating and producing preliminary results (Pourtsidou, 2018; Wang et al., 2021; Knowles et al., 2021; Terni de Gregory et al., 2021; de Villiers & Cotton, 2022). The MeerKAT Large Area Synoptic Survey (MeerKLASS, Santos et al., 2017; Wang et al., 2021; Li et al., 2021; Irfan et al., 2021) is proposed for cosmological studies with single-dish-mode Hi IM. Using the MeerKLASS pilot survey data, Cunnington et al. (2023) reported the cross-correlation power spectrum detection. In addition, the small field deep surveys using MeerKAT interferometer mode, such as the MeerKAT International GHz Tiered Extragalactic Exploration (MIGHTEE, Jarvis et al., 2018; Paul et al., 2021; Maddox, N. et al., 2021), can also provide a Hi cube. With such Hi cube, Paul et al. (2023) reported the Hi IM auto power spectrum detection on Mpc scales. In this paper, we investigate the performance of MeerKAT interferometer-mode Hi IM survey in measuring the power spectrum with different survey strategies and forecast the constraints on cosmological parameters in typical dark energy models.
We only consider the most typical dark energy models in this work. Among all the dark energy models, the cold dark matter (CDM) model is the simplest. It is though simple but extremely important in cosmology because it can well explain almost all the current cosmological observations. In the CDM model, dark energy is assumed to be a cosmological constant with the equation of state , and thus the dark-energy density remains a constant during the cosmological evolution. Note here that the equation of state of dark energy is defined as , with and the pressure and density of dark energy, respectively. Although the CDM model is widely viewed as a standard model of cosmology, it still faces huge challenges in both theoretical and observational aspects. In the theoretical aspect, the cosmological constant has always been suffering with the “fine-tuning” and “cosmic coincidence” problems (Zlatev et al., 1999; Sahni & Starobinsky, 2000; Bean et al., 2005). In the observational aspect, the so-called “Hubble tension” problem has been widely viewed as triggering a new crisis in cosmology, known as the “Hubble crisis” (Verde et al., 2019; Riess, 2019; Di Valentino et al., 2021; Poulin et al., 2019; Guo et al., 2019, 2020; Cai et al., 2021; Vagnozzi, 2020; Perivolaropoulos & Skara, 2022; Gao et al., 2021, 2022b; Zhang & Huang, 2020; Liu et al., 2020; Ding et al., 2020). Therefore, a dynamical dark energy was proposed very early on. Actually, in order to explore and understand the nature of dark energy, the first step should be precisely measuring the equation of state of dark energy that governs how dark-energy density evolves with the cosmic expansion.
The most simplest dynamical dark energy model assumes that is a constant. For convenience, we call this model the CDM model in this work. This model is very useful in exploring the nature of dark energy with observational data due to its simplicity. However, generally speaking, the equation of state of dark energy should be time-varying, and thus should be a function of the redshift (or equivalently, the scale factor of the Universe, ).
The two-parameter form of the parametrization of dark-energy equation of state, (Chevallier & Polarski, 2001; Linder, 2003), has been widely used in the exploration of the nature of dark energy with cosmological observations, since it can cover many possible forms in the late Universe. For convenience, this parametrization model is called the CDM model in this work.
In this paper, we discuss the cosmological constraints only in the most typical dark energy models, i.e., the CDM, CDM, and CDM models. In these models, the late-time expansion history of the Universe is described by the following equation,
| (1) |
where is the Hubble constant and is the present-day fractional density of matter. Here, the function describes the cosmological evolution of the dark-energy density. For CDM, ; for CDM, ; for CDM, .
In this work, we employ the “delay spectrum” approach, which is first applied in the observation of Precision Array for Probing the Epoch of Reionization (PAPER, Parsons & Backer, 2009). At present, it has been successfully applied to Hi IM surveys (Paul et al., 2023). With such an approach, we can deal with visibilities directly, which are primary data products of radio interferometers. By Fourier transformation of the visibilities across the frequencies, we can effectively capture signal delay between antenna pairs. It is known that the bright foreground emissions contaminate the cosmic Hi signal in the same frequency ranges, such as the synchrotron and free-free emission from the Galaxy and extra-galactic point sources. Generally, the foreground contamination components have smooth frequency spectra, which can be separated from the cosmic Hi fluctuation in the “delay spectrum” space (Parsons et al., 2012; Liu et al., 2014a, b; Liu & Shaw, 2020).
This paper is organized as follows. In Section 2, we provide a detailed description of estimating Hi signal power spectrum, MeerKAT survey strategy and its system noise, foregrounds and shot noise. In Section 3, we present the constraint results of the power spectrum and cosmological parameters. Finally, the conclusion is given in Section 4. In our simulation, we assume a flat CDM model as the fiducial model and keep the fiducal values of cosmological parameters fixed to Planck 2018 results (Aghanim et al., 2020).
2 Methodology
2.1 Hi delay spectrum
The Hi brightness temperature fluctuation across the survey volume is expressed as,
| (2) |
where is the position vector on the sky, is the observation frequency, and denote the isotropic and fluctuating components of the Hi brightness temperature distribution, respectively.
Radio interferometer observation produces the Hi signals visibilities, which are the cross-correlation signals between each pair of antennas. Assuming the flat-sky approximation, the visibility for a pair of antennas is given by
| (3) |
where denotes the primary beam response of the telescope in the direction of , represents the solid angle element. is defined as the baseline vector, where is the baseline vector between a pair of antennas and is the speed of light. The visibility function can be Fourier transformed to the ‘delay spectrum’ space via
| (4) |
where is the corresponding delay of frequency interval . Following McQuinn et al. (2006), Parsons et al. (2012) and Liu & Shaw (2020), the Hi power spectrum is expressed in the form of ‘delay spectrum’,
| (5) |
where and are the effective antenna area and bandwidth, respectively, denotes the wavelength at the centre of the band, is the comoving distance to the redshift corresponding to , is the comoving width along the line-of-sight (LoS) corresponding to the redshift range determined by , and is the Boltzmann constant. Here, and are the Fourier wave vectors perpendicular and parallel to the LoS, respectively. They are related to the interferometer variables via
| (6) |
where is the rest-frame frequency of the 21 cm line. denotes the Hubble parameter as a function of redshift .
There are various advantages of this ‘delay spectrum’ method (Parsons et al., 2012; Vedantham et al., 2012; Paul et al., 2016). The different spectral behaviours between Hi signal and foreground make it possible to isolate the latter in the Fourier space. In addition, the Fourier conjugate variable is associated with the LoS cosmological distance, therefore the ‘delay spectrum’ constructed in this method can recover the cosmological 3D Hi power spectrum (Parsons et al., 2012; Liu et al., 2014a, b).
2.2 Hi signal power spectrum
The mean sky brightness temperature of Hi 21 cm emission is expressed as (Santos et al., 2015, 2017)
| (7) |
where km s-1 and is the fractional density of Hi, which can be written as
| (8) |
where is the critical density today and the proper Hi density is calculated by
| (9) |
where denotes the dark matter halo mass, is the proper halo mass function and denotes the Hi mass in a halo of mass at redshift . Throughout this paper, we assume a simple power-law model following Santos et al. (2015), i.e., with and that can fit both low- and high-redshift observations within reasonable accuracy.
Considering the redshift space distortion (RSD) effect (Kaiser, 1987), the Hi power spectrum is expressed as
| (10) |
where . The matter power spectrum , where is the growth factor and is the matter power spectrum at z = 0. is obtained with CAMB (Lewis et al., 2000). represents the RSD effect which is expressed as
| (11) |
where is the Hi bias, written as
| (12) |
where is the halo bias, is the linear growth rate with being the scale factor, is the nonlinear dispersion scale with the value of . In this paper, we simply employ the fitting functions of and following Santos et al. (2017),
| (13) | ||||
| (14) |
2.3 MeerKAT noise power spectrum

The total thermal noise power spectrum can be written as (Bull et al., 2015)
| (15) |
where represents the dual-polarization of the MeerKAT instrument and is the integration time. The ratio of MeerKAT effective antenna area and system temperature, , is frequency dependent. Currently, there are two frequency bands available for observation, i.e., the L-band (– MHz) and the UHF-band (– MHz). Because of the serious RFI contamination in the L-band frequency range, only the frequency range of – MHz () is used in our analysis. The full UHF-band is used in this analysis, corresponding to . In Fig. 1, we show for L-band and UHF-band. These values are obtained from the MeerKAT website.111http://public.ska.ac.za/meerkat/meerkat-schedule
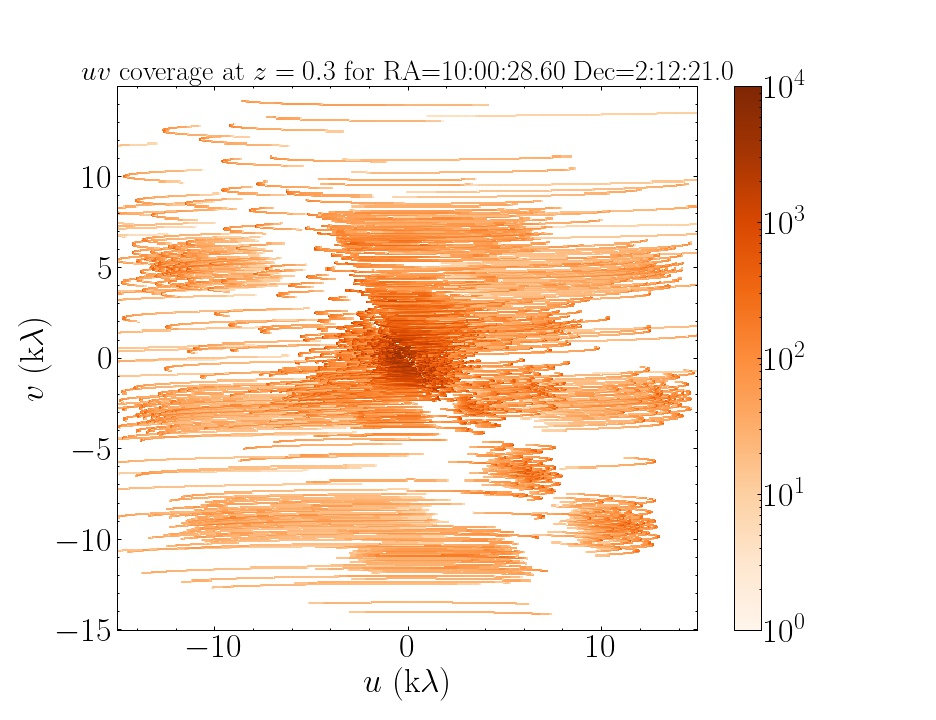
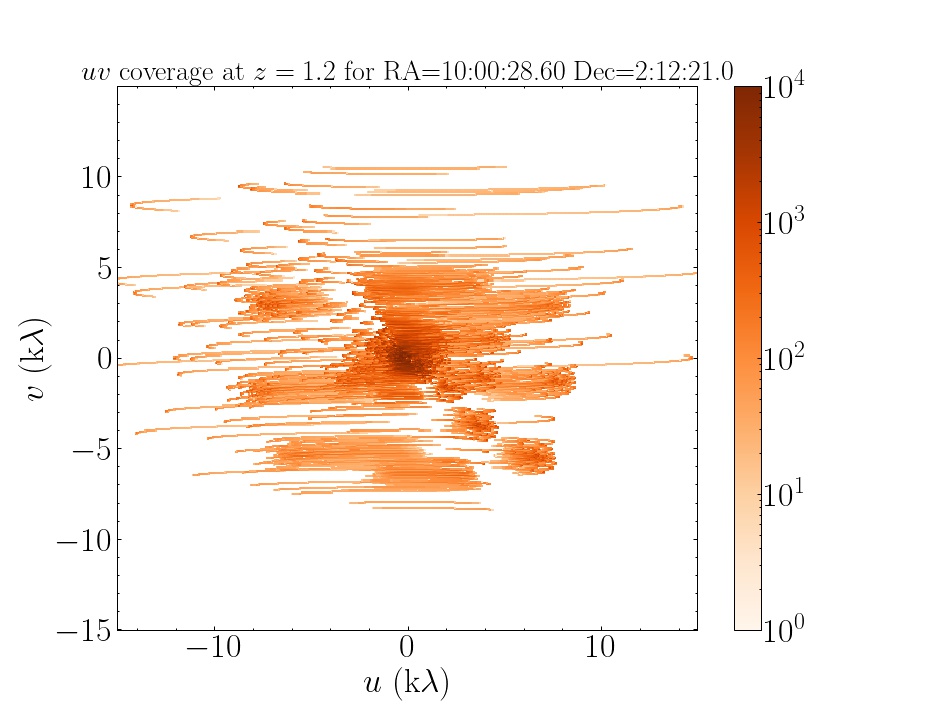
In Eq. (15), is the baseline density referring to the detailed coverage of a particular observation. We employ the actual MeerKAT antenna coordinates and assume tracking the COSMOS field (RA=10h01m, Dec=+02d12m) following Paul et al. (2021). Particularly, is also a function of frequency. We divide the full frequency range into dozen MHz sub-bands. The coverage is assumed to be uniform within each sub-band and simulated according to the center frequency of each sub-band. In Fig. 2, we show the simulated coverage corresponding to one of the sub-bands in the L-band centering at and one in UHF-band centering at in the left and right panels, respectively. For both cases, we assume h tracking observation of the COSMOS field spanning over two days (the start time is 14:15 and 13:33 at LST, respectively). The plane is segmented onto a discrete grid with cell size . The color represents the number of points within the grid. It is clear that, in the short distance region, there are more samples at the low-frequency band than at the high-frequency band.
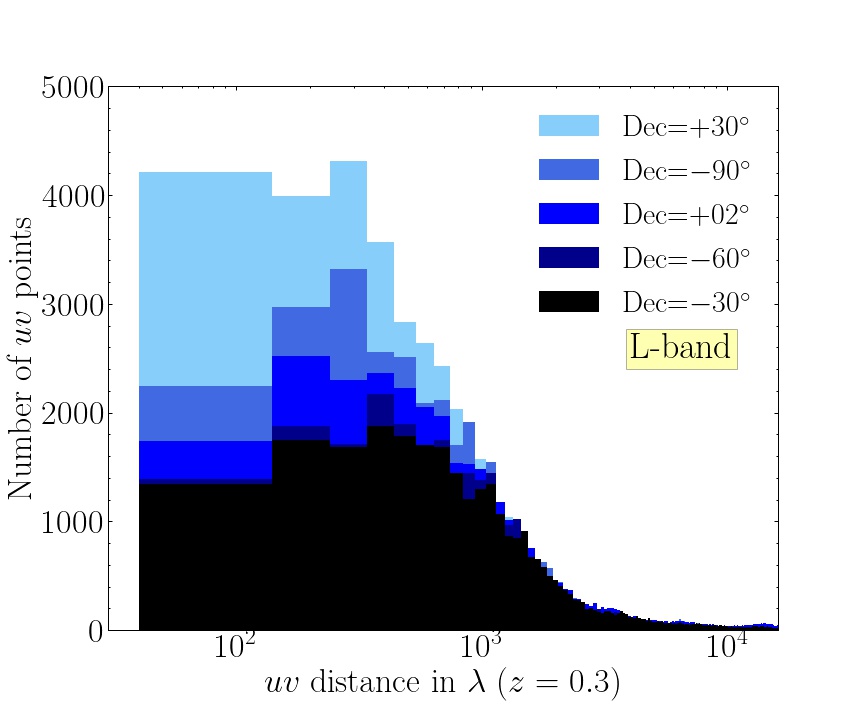
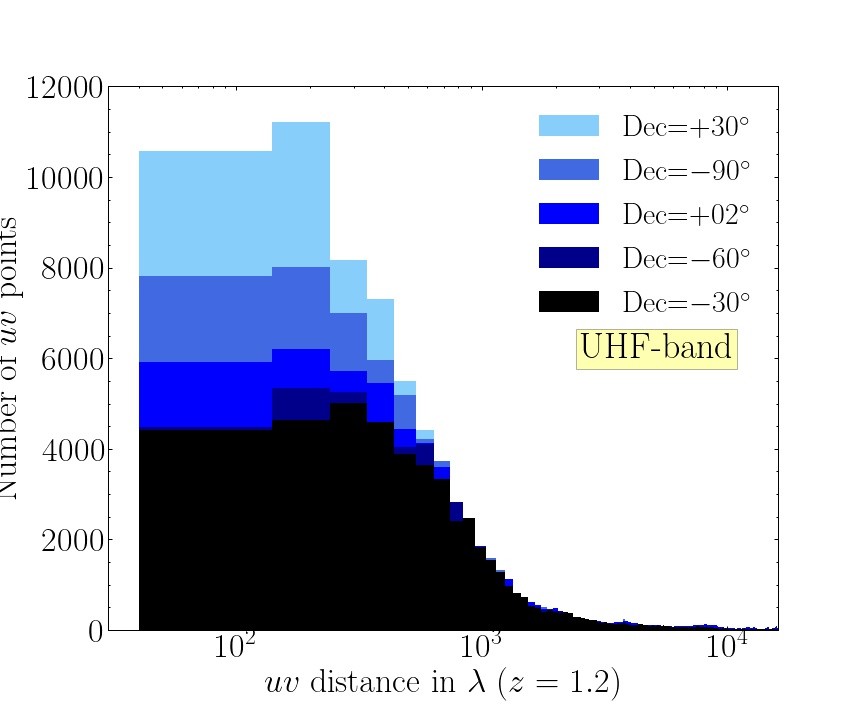
Because of the uniform coverage assumption across the sub-bands, in the same sub-band, the total thermal noise power spectrum is mainly determined by the baseline density that is related to . According to Eq. (6), is proportional to the distance, i.e. . The circular averaged coverage within a shell of width are shown in Fig. 3, where the left panel shows the distribution corresponding to the sub-band centering at and the right panel shows the one centering at . Since is proportional to the distance, the more densely populated points at smaller distances mean the higher sensitivity at the smaller modes.
It is known that the coverage also depends on the pointing direction. In order to investigate the influence of the different sky zones, we also show in Fig. 3 the numbers of points with 10 h tracking at different declinations: . The case of is the same as tracking the COSMOS field and the case of corresponds to tracking a field that the transit line passes near zenith of the MeerKAT site. It is obvious that when the field is targeted farther from the zenith, the number of short baselines rises substantially for both the L-band and the UHF-band, which potentially increases the sensitivity at the smaller modes.
2.4 The foreground wedge and shot noise
The foreground contamination, which is several orders of magnitude stronger than Hi signal, is the major challenge in recovering the Hi LSS. Since the foreground spectrum is smooth across frequency channels, it only contaminates the power spectrum close to the smallest . Therefore, we exclude the – space modes within the foreground wedge (Datta et al., 2010; Morales et al., 2012; Liu et al., 2014a, b; Pober, 2015; Seo & Hirata, 2016) that can be expressed as
| (16) |
where denotes the field of view of the interferometer. The foregrounds only play a dominant role within the lower-end of and the foreground wedge region. In our analysis, the foreground contaminated region is masked. However, in real observation, instrumental issues, such as beam response and polarization leakage effect, can exacerbate foreground contamination. It is inevitable to cause foreground leakage into the high- modes, even though deep learning methods can help solve this problem to some extent (Ni et al., 2022; Gao et al., 2022a). More recently, Paul et al. (2023) presented a groundbreaking approach to Hi IM by employing a foreground avoidance method. They successfully suppressed foreground power leakage to higher modes by multiplying the visibility function with the Blackman-Harris spectral window function. In this work, we simplify this process and assume that foreground leakage can be completely avoided.
In addition, shot noise needs to be taken into account in Hi IM survey. Because of Poisson fluctuations in halo number, the shot noise power spectrum is written as (Bull et al., 2015)
| (17) |
Here Hi mass model is consistent with the description in the Hi signal power spectrum. Since shot noise is very low according to our calculation, it makes a very small contribution to the total noise.
3 Results
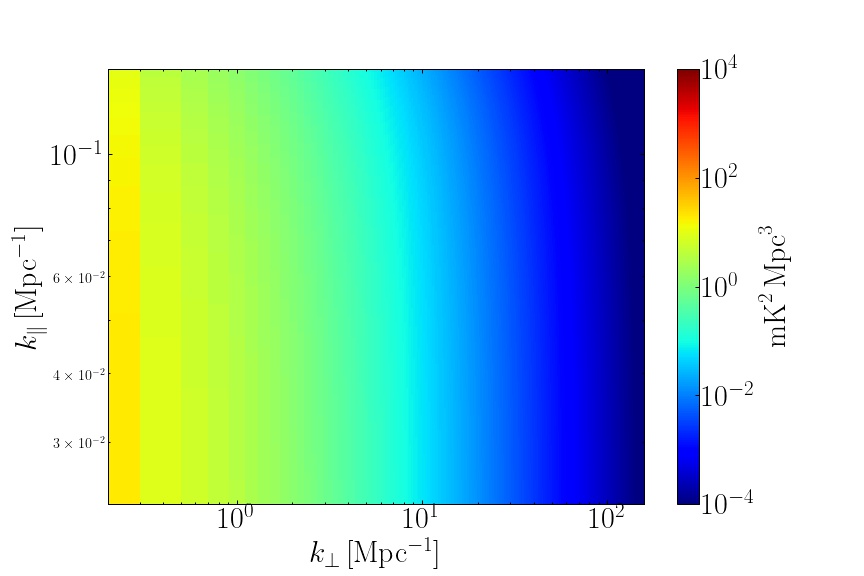
(a) Hi power spectrum
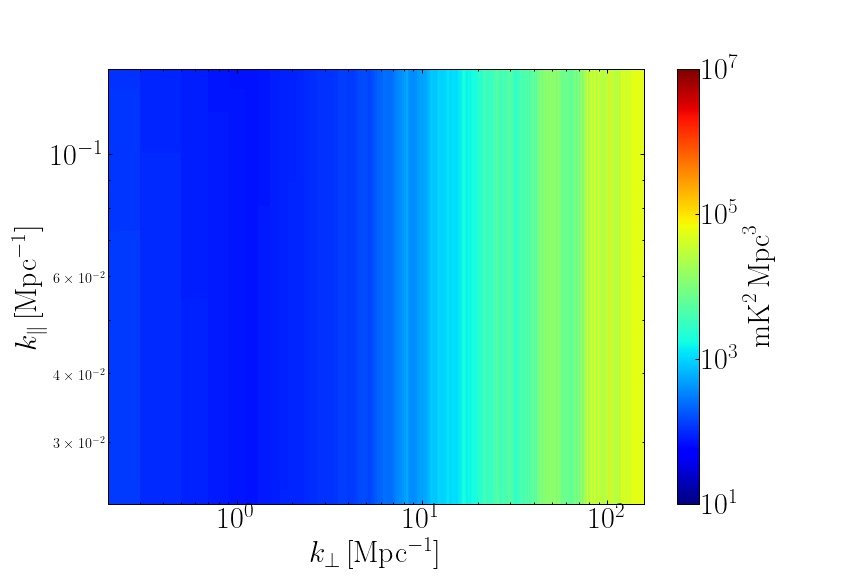
(b) Total power spectrum
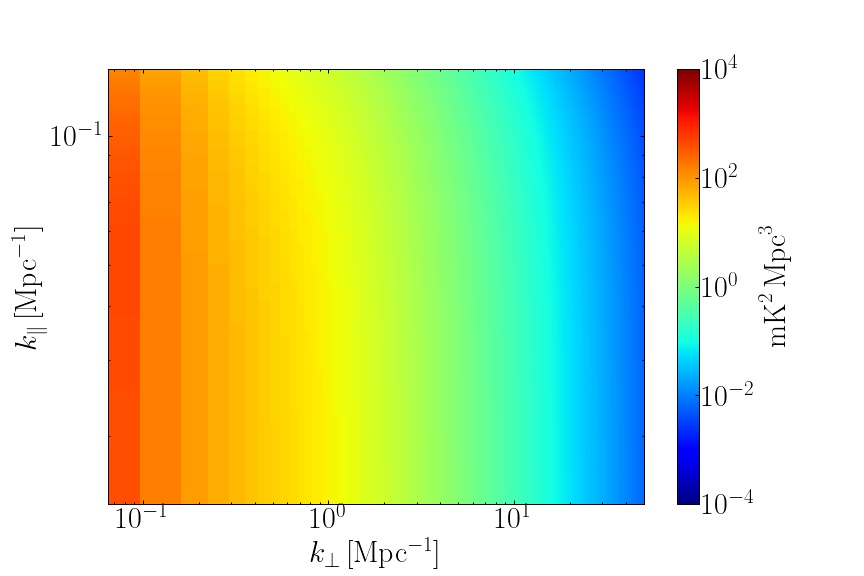
(a) Hi power spectrum
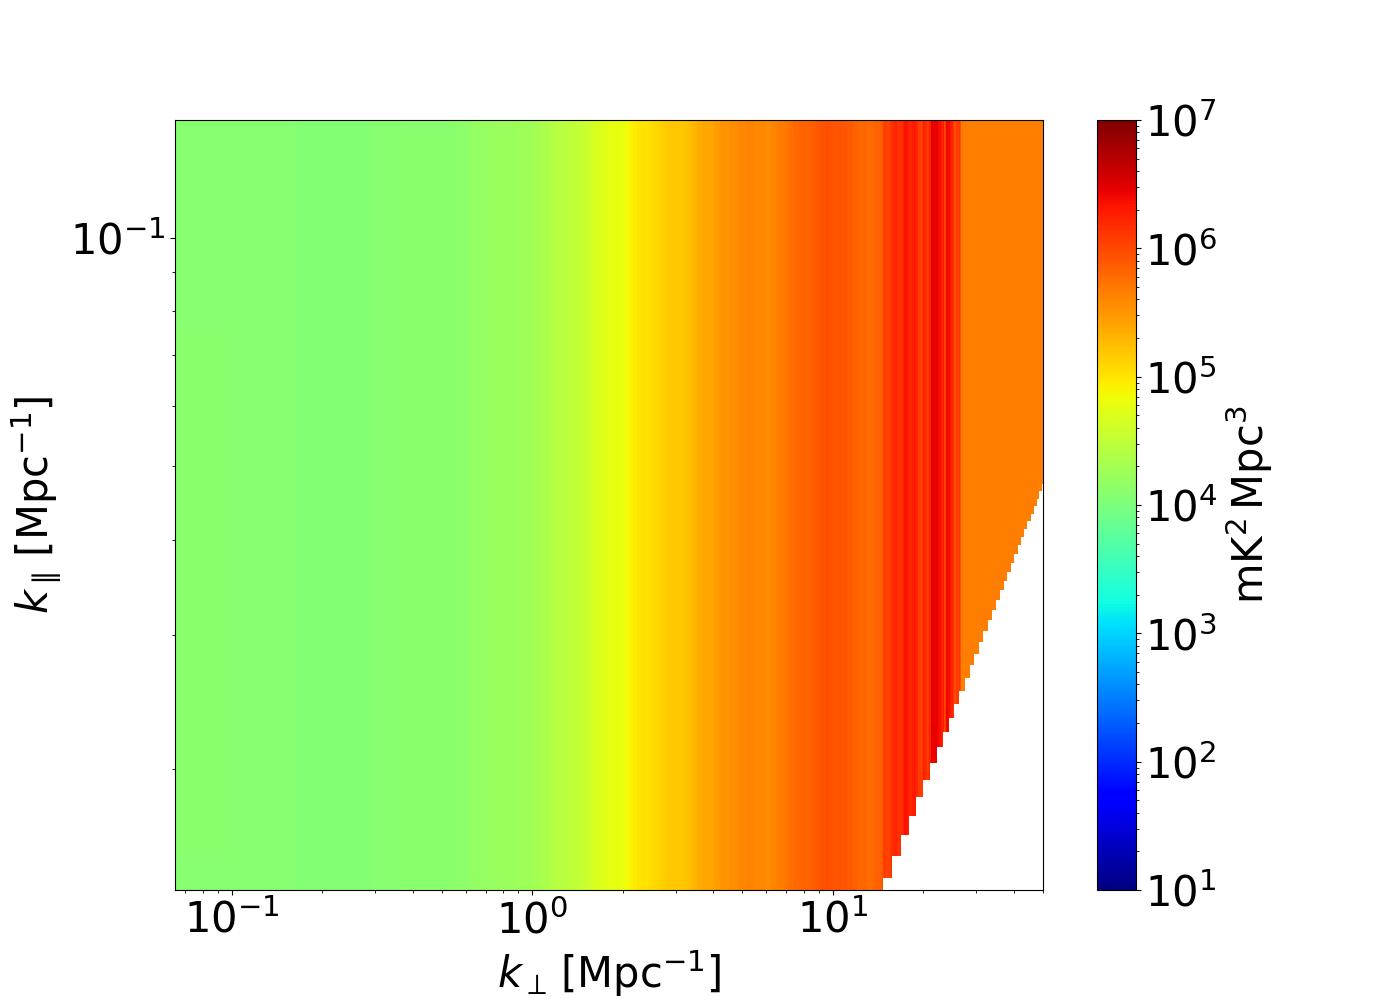
(b) Total power spectrum
In this section, we present the results of Hi IM survey analysis. In Section 3.1, we give a detailed analysis of the power spectrum in the different survey strategies. The relative errors on , and and the constraints on cosmological parameters in different dark energy models are showed in Section 3.2.
3.1 Power spectrum estimation
The Hi detection is quantified with the relative error of the power spectrum,
| (18) |
where is the survey volume of each redshift bin with the survey area . represents the total power spectrum, which consists of the contributions of Hi signal, thermal noise, and shot noise. The effects of foreground contamination are taken into account by restricting the integration area in the - space.
The signal-to-noise ratio is related to the integration area in the - space. The scales available for Hi IM in interferometer mode observation are limited by the detailed configuration. In particular, the scale limits for Hi IM survey are:
| (19) |
where and are minimum and maximum interferometer baselines, respectively (Bull et al., 2015). As we discussed in Section. 2.4, the foreground contamination should exist at the lower end of and restrict for Hi IM survey. In our analysis, we assume the foreground spectrum to be smooth and only exist in the mode corresponding to the largest scale. Thus, the lower bound of set by the foreground contamination overlaps with that set by the survey bandwidth.
In addition, the integration area in the - space also restricted by the foreground wedge, which is defined in Eq. (16). We show the 2D Hi power spectrum at (in L-band) and (in UHF-band) in the left panels of Figs. 4 and 5, respectively. The corresponding total power spectra are shown in the right panels. A clear foreground wedge (the blank area) is shown in the total power spectrum at . At lower redshift, the foreground wedge is pushed to larger , which is outside the upper bound set by the MeerKAT baseline configuration.
The power spectrum of the thermal noise is calculated by assuming h tracking observation. The Hi power spectra are totally below the thermal noise level for both the L-band and UHF-band. We also assume the thermal noise power spectrum can be efficiently removed and achieve unbiased Hi power spectrum estimation before proceeding to the cosmology studies. In reality, the thermal noise power spectrum can be eliminated by cross-correlating the observations of the same survey cube at different sessions (Switzer et al., 2013b; Paul et al., 2023).


Firstly, we investigate the influence on the error when tracking the source at the different declinations. As is shown in Fig. 3, when tracking the source at , completely different numbers of points are obtained, e.g. there are more points in the shorter distance for the case of . In the top panel of Fig. 6, the relative errors of the power spectrum with different tracking declinations are shown in different colors. For all the cases, we assume a 10 h observation time. The results with L-band and UHF-band are shown in solid and dashed lines, respectively. Here, we divide the whole range of into logarithmic bins. It is clear that the power spectrum uncertainty is reduced by more than a factor of two when tracking compared to tracking or . The results show that, with limited observation time, the tracking declination has an obvious influence on the results of the constraints on the power spectrum.
Next, in order to assess the influence of integration time, we increase the integration time by assuming observations on the same field at the same local sidereal time as the existing data on different days, which means that we obtain the same points from multiple days coherently to increase the sensitivity of the same modes. In addition to the current h observation, we further consider , and h observations. In the middle panel of Fig. 6, we show the fractional errors on the power spectrum for 10, 100, 1000 and 10000 hours observation of tracking the COSMOS field with MeerKAT L-band (in blue) and UHF-band (in red). The results with different integration times are shown with different color saturations. It can be seen that, compared to L-band, using the UHF-band could measure smaller modes down to Mpc-1, which makes it possible to detect cosmological LSS on larger scales. In addition, it is expected that the lower can be obtained with the observation time increasing as is shown in the middle panel of Fig. 6. With MeerKAT UHF-band 10 h observation, the value of could reach 1 roughly. The values of are distinctly reduced when tracking 1000 h, approximately reaching 0.1. However, we find that when the integration time increases from 1000 h to 10000 h, the reduction of is not significant at low . It is mainly because the cosmic variance, which is limited by the survey volume, plays the dominating role.
Therefore, we consider tracking multiple points equally in the total 10000 h observation. In this case, compared to tracking one point with 10000 h, the survey volume and the thermal noise power spectrum are increased by a factor of the number of points . In our analysis, we calculate the additional fractional error on for and in the 10000 h observation, as shown in the bottom panel of Fig. 6. In order to constrain cosmological parameters, we expect to obtain lower in low . We find that the lower values of in low are obtained when tracking 100 points for MeerKAT L-band in the total 10000 h observation while tracking 10 points for MeerKAT UHF-band. Therefore, we employ these two survey strategies for MeerKAT L-band and UHF-band, respectively, in the next subsection.
3.2 Cosmological parameters


In this subsection, we explore the capability of MeerKAT Hi IM survey with interferometer mode of constraining cosmological parameters.
Given the power spectrum measurement at a given redshift, the Fisher matrix for a set of observables can be written as
| (20) |
Here, we take the set of observables as {, , , , } in each redshift bin . The nuisance parameters and can be marginalized by selecting the submatrix of with only the appropriate columns and rows. Therefore, we can derive the measurement errors on , and .
For MeerKAT L-band (900-1200 MHz) and UHF-band (580-1000 MHz), we divide these frequency bands into some bins with equal bandwidth and then obtain the estimates for the measurement errors on observables in the corresponding redshift bins. We plot the fractional measurement errors on , and with MeerKAT 10000 h observation in Fig. 7. We find that the survey with interferometer mode has a better measurement on , of which the fractional errors can reach roughly for MeerKAT L-band and UHF-band. Comparatively speaking, the fractional measurement errors on and seem slightly larger, though MeerKAT UHF-band performs slightly better than MeerKAT L-band.
In each redshift bin, the quantities , and are in some correlation, and thus we should take the correlation into account in the cosmological parameter inference. In a redshift bin, the function is given by
| (21) |
where the Fisher matrix serves as the inverse covariance matrix concerning , , , and , with denoting a set of cosmological parameters (such as {, , , }). Here, the superscripts “th” and “obs” represent the theoretical values in a cosmological model and the mock observational data in our simulation, respectively. The total function is the sum of of all redshift bins. Furthermore, we adopt the Markov Chain Monte Carlo (MCMC) approach to maximize the likelihood to infer the posterior probability distributions of the cosmological parameters. We use the publicly accessible CosmoMC code to perform the MCMC analysis. In the cosmological parameter inference, we also employ the CMB angular power spectra data of Planck 2018 TT,TE,EE+lowE.
The errors of the cosmological parameters are summarized in Table 1. The and posterior distribution contours of cosmological parameters are shown in Figs. 8–10.

| Error | CDM | CDM | CDM | |||||||||
|---|---|---|---|---|---|---|---|---|---|---|---|---|
| Planck | L-band | UHF-band | Planck | Planck+L-band | Planck+UHF-band | Planck | Planck+L-band | Planck+UHF-band | ||||
| N/A | N/A | |||||||||||
| N/A | ||||||||||||
In the CDM model, we obtain and with MeerKAT L-band and and with MeerKAT UHF-band. We find that UHF-band performs better than L-band in constraining and . Recently, Cunnington (2022) gave a result of from the position of the turnover location with MeerKAT UHF-band 4000 h survey with single-dish mode. It is found that a better constraint on with MeerKAT UHF-band interferometer mode can be given although a longer observational time of 10000 h is needed. In comparison with other radio telescopes, MeerKAT L-band and BINGO perform similarly, while MeerKAT UHF-band performs nearly as well as FAST in constraining and in the CDM model (Wu & Zhang, 2022). Compared to the Stage-III dark energy experiments, such as DES, we find that MeerKAT UHF-band gives a smaller error on than DES with in the CDM model (Abbott et al., 2020).
In the CDM model, in order to help break the parameter degeneracy, we combine MeerKAT Hi IM survey with Planck TT,TE,EE+lowE power spectrum (Aghanim et al., 2020) in the MCMC analysis. The and measurement error contours for , and are shown in Fig. 9. We obtain , and with Planck+L-band and , and with Planck+UHF-band. It can be seen that MeerKAT UHF-band combined with Planck data gives tighter constraints on cosmological parameters in the CDM model, with the conclusion the same as in the CDM model. We find that MeerKAT has a very limited capability of constraining , and the error on is still larger even in combination with Planck data. Given that current cosmological observations favor a value of , as indicated by the result of obtained from Planck+BAO+Supernova (Aghanim et al., 2020), it remains challenging to distinguish between CDM and CDM using MeerKAT Hi IM survey.
Finally, we forecast the constraints on cosmological parameters in the CDM model. The and measurement error contours are shown in Fig. 10. We focus on the dark-energy equation of state parameters and . We obtain and with Planck+L-band, and and with Planck+UHF-band. In comparison, the most advanced constraints on and are derived from the Planck+BAO+Supernova data (Aghanim et al., 2020), providing an constraint on and an error of 0.3 for . Therefore, it is not recommended to use interferometer mode Hi IM survey with MeerKAT to study the cosmological evolution of the dark-energy equation of state. On the other hand, by utilizing the single-dish mode, MeerKAT could potentially achieve a large survey volume and more stringent constraints. Additionally, we can anticipate that future larger radio telescopes, such as SKA, will facilitate precise measurements of dark energy (Wu & Zhang, 2022; Wu et al., 2023a, b).


4 Conclusions
In this work, we give a detailed analysis on measuring the Hi IM delay power spectrum using the MeerKAT interferometer mode. We also discuss the capability of MeerKAT interferometer mode of constraining cosmological parameters.
We use the Fisher matrix method to estimate the Hi power spectrum with MeerKAT IM observation. We find that the different survey fields have distinct impacts on determining the power spectrum errors in the limited observational time of 10 hours. As the observational time increases from 10 h to 10000 h, the power spectrum errors are reduced evidently until the cosmic variance begins to dominate. We also discuss the different survey strategies and find that the lower fractional errors on power spectrum at low are obtained when tracking 100 points for L-band and tracking 10 points for UHF-band in a total 10000 h observation.
We obtain the measurement errors on , and by using the Fisher matrix, and then use these measurements to constrain cosmological parameters in typical dark energy models, including CDM, CDM and CDM models, by performing the MCMC analysis. We obtain and km s-1 Mpc-1 with MeerKAT UHF-band which are better than the results of and km s-1 Mpc-1 with MeerKAT L-band in the CDM model. However, MeerKAT has a very limited constraining power for the dark-energy equation of state, such as in the CDM model and and in the CDM model, even though in combination with Planck data.
Though MeerKAT L-band and UHF-band Hi IM surveys in interferometer mode have very limited constraining power for dark energy, our analysis still provides a useful guide for the near future MeerKAT survey. It is expected that future larger radio telescope arrays, such as SKA, will have a much better and more powerful performance in cosmological research. In addition, MeerKAT baselines are not short enough for detecting large cosmological scales, but the measurements with MeerKAT interferometer mode on these scales are still very useful in detecting Hi content of galaxies, obtaining the cross-correlation between Hi content and star formation rates (Wolz et al., 2016), constraining warm dark matter (Carucci et al., 2015) and breaking the degeneracy between and (Chen et al., 2021). These aspects deserve further detailed investigations in the future.
Acknowledgements
We thank Peng-Ju Wu and Li-Yang Gao for the helpful discussions. This work was supported by the National SKA Program of China (Grants Nos. 2022SKA0110200 and 2022SKA0110203), the National Natural Science Foundation of China (Grants Nos. 11975072, 11875102, and 11835009), and the 111 Project (Grant No. B16009).
Data Availability
The data underlying this article will be shared on reasonable request to the corresponding author.
References
- Abbott et al. (2018) Abbott T. M. C., et al., 2018, Phys. Rev. D, 98, 043526
- Abbott et al. (2020) Abbott T. M. C., et al., 2020, Phys. Rev. D, 102, 023509
- Aghanim et al. (2020) Aghanim N., et al., 2020, Astron. Astrophys., 641, A6
- Alam et al. (2017) Alam S., et al., 2017, Mon. Not. Roy. Astron. Soc., 470, 2617
- Amendola et al. (2018) Amendola L., et al., 2018, Living Rev. Rel., 21, 2
- Anderson et al. (2018) Anderson C. J., et al., 2018, Mon. Not. Roy. Astron. Soc., 476, 3382
- Ansari et al. (2012) Ansari R., et al., 2012, Astron. Astrophys., 540, A129
- Bacon et al. (2020) Bacon D. J., et al., 2020, Publ. Astron. Soc. Austral., 37, e007
- Bagla et al. (2010) Bagla J. S., Khandai N., Datta K. K., 2010, Mon. Not. Roy. Astron. Soc., 407, 567
- Ballardini et al. (2019) Ballardini M., Matthewson W. L., Maartens R., 2019, Mon. Not. Roy. Astron. Soc., 489, 1950
- Bandura et al. (2014) Bandura K., et al., 2014, Proc. SPIE Int. Soc. Opt. Eng., 9145, 22
- Battye et al. (2004) Battye R. A., Davies R. D., Weller J., 2004, Mon. Not. Roy. Astron. Soc., 355, 1339
- Bean et al. (2005) Bean R., Carroll S., Trodden M., 2005, arXiv e-prints, pp astro–ph/0510059
- Berti et al. (2022) Berti M., Spinelli M., Haridasu B. S., Viel M., Silvestri A., 2022, JCAP, 01, 018
- Beutler et al. (2011) Beutler F., et al., 2011, Mon. Not. Roy. Astron. Soc., 416, 3017
- Blake et al. (2011) Blake C., et al., 2011, Mon. Not. Roy. Astron. Soc., 418, 1707
- Bull et al. (2015) Bull P., Ferreira P. G., Patel P., Santos M. G., 2015, Astrophys. J., 803, 21
- Cai et al. (2021) Cai R.-G., Guo Z.-K., Li L., Wang S.-J., Yu W.-W., 2021, Phys. Rev. D, 103, 121302
- Camera et al. (2013) Camera S., Santos M. G., Ferreira P. G., Ferramacho L., 2013, Phys. Rev. Lett., 111, 171302
- Carucci et al. (2015) Carucci I. P., Villaescusa-Navarro F., Viel M., Lapi A., 2015, JCAP, 07, 047
- Chang et al. (2008) Chang T.-C., Pen U.-L., Peterson J. B., McDonald P., 2008, Phys. Rev. Lett., 100, 091303
- Chang et al. (2010) Chang T.-C., Pen U.-L., Bandura K., Peterson J. B., 2010, Nature, 466, 463
- Chen (2012) Chen X., 2012, Int. J. Mod. Phys. Conf. Ser., 12, 256
- Chen et al. (2021) Chen Z., Wolz L., Spinelli M., Murray S. G., 2021, Mon. Not. Roy. Astron. Soc., 502, 5259
- Cheng et al. (2020) Cheng G., Ma Y.-Z., Wu F., Zhang J., Chen X., 2020, Phys. Rev. D, 102, 043517
- Chevallier & Polarski (2001) Chevallier M., Polarski D., 2001, Int. J. Mod. Phys. D, 10, 213
- Chisari et al. (2019) Chisari N. E., et al., 2019, Astrophys. J. Suppl., 242, 2
- Cole et al. (2005) Cole S., et al., 2005, Mon. Not. Roy. Astron. Soc., 362, 505
- Colless et al. (2001) Colless M., et al., 2001, Mon. Not. Roy. Astron. Soc., 328, 1039
- Cunnington (2022) Cunnington S., 2022, Mon. Not. Roy. Astron. Soc., 512, 2408
- Cunnington et al. (2020) Cunnington S., Camera S., Pourtsidou A., 2020, Mon. Not. Roy. Astron. Soc., 499, 4054
- Cunnington et al. (2023) Cunnington S., et al., 2023, MNRAS, 518, 6262
- Datta et al. (2010) Datta A., Bowman J. D., Carilli C. L., 2010, Astrophys. J., 724, 526
- Dey et al. (2019) Dey A., et al., 2019, Astron. J., 157, 168
- Di Valentino et al. (2021) Di Valentino E., et al., 2021, Class. Quant. Grav., 38, 153001
- Dickinson (2014) Dickinson C., 2014, in 49th Rencontres de Moriond on Cosmology. pp 139–142 (arXiv:1405.7936)
- Ding et al. (2020) Ding Q., Nakama T., Wang Y., 2020, Sci. China Phys. Mech. Astron., 63, 290403
- Drinkwater et al. (2010) Drinkwater M. J., et al., 2010, Mon. Not. Roy. Astron. Soc., 401, 1429
- Gao et al. (2021) Gao L.-Y., Zhao Z.-W., Xue S.-S., Zhang X., 2021, JCAP, 07, 005
- Gao et al. (2022a) Gao L.-Y., Li Y., Ni S., Zhang X., 2022a, arXiv e-prints, p. arXiv:2212.08773
- Gao et al. (2022b) Gao L.-Y., Xue S.-S., Zhang X., 2022b, arXiv e-prints, p. arXiv:2212.13146
- Guo et al. (2019) Guo R.-Y., Zhang J.-F., Zhang X., 2019, JCAP, 02, 054
- Guo et al. (2020) Guo R.-Y., Zhang J.-F., Zhang X., 2020, Sci. China Phys. Mech. Astron., 63, 290406
- Irfan et al. (2021) Irfan M. O., et al., 2021, Mon. Not. Roy. Astron. Soc., 509, 4923
- Ivezić et al. (2019) Ivezić v., et al., 2019, Astrophys. J., 873, 111
- Jarvis et al. (2018) Jarvis M. J., et al., 2018, PoS, MeerKAT2016, 006
- Jin et al. (2020) Jin S.-J., He D.-Z., Xu Y., Zhang J.-F., Zhang X., 2020, JCAP, 03, 051
- Jin et al. (2021) Jin S.-J., Wang L.-F., Wu P.-J., Zhang J.-F., Zhang X., 2021, Phys. Rev. D, 104, 103507
- Jones et al. (2009) Jones D. H., et al., 2009, Mon. Not. Roy. Astron. Soc., 399, 683
- Kaiser (1987) Kaiser N., 1987, Mon. Not. Roy. Astron. Soc., 227, 1
- Karagiannis et al. (2020) Karagiannis D., Slosar A., Liguori M., 2020, JCAP, 11, 052
- Karagiannis et al. (2021) Karagiannis D., Fonseca J., Maartens R., Camera S., 2021, Phys. Dark Univ., 32, 100821
- Knowles et al. (2021) Knowles K., et al., 2021, Mon. Not. Roy. Astron. Soc., 504, 1749
- Lewis et al. (2000) Lewis A., Challinor A., Lasenby A., 2000, Astrophys. J., 538, 473
- Li & Ma (2017) Li Y.-C., Ma Y.-Z., 2017, Phys. Rev. D, 96, 063525
- Li et al. (2021) Li Y., Santos M. G., Grainge K., Harper S., Wang J., 2021, MNRAS, 501, 4344
- Lidz et al. (2011) Lidz A., Furlanetto S. R., Oh S. P., Aguirre J., Chang T.-C., Dore O., Pritchard J. R., 2011, Astrophys. J., 741, 70
- Linder (2003) Linder E. V., 2003, Phys. Rev. Lett., 90, 091301
- Liu & Shaw (2020) Liu A., Shaw J. R., 2020, Publ. Astron. Soc. Pac., 132, 062001
- Liu et al. (2014a) Liu A., Parsons A. R., Trott C. M., 2014a, Phys. Rev. D, 90, 023018
- Liu et al. (2014b) Liu A., Parsons A. R., Trott C. M., 2014b, Phys. Rev. D, 90, 023019
- Liu et al. (2020) Liu M., Huang Z., Luo X., Miao H., Singh N. K., Huang L., 2020, Sci. China Phys. Mech. Astron., 63, 290405
- Loeb & Wyithe (2008) Loeb A., Wyithe S., 2008, Phys. Rev. Lett., 100, 161301
- Maartens et al. (2015) Maartens R., Abdalla F. B., Jarvis M., Santos M. G., 2015, PoS, AASKA14, 016
- Maddox, N. et al. (2021) Maddox, N. et al., 2021, A&A, 646, A35
- Masui et al. (2013) Masui K. W., et al., 2013, Astrophys. J. Lett., 763, L20
- McQuinn et al. (2006) McQuinn M., Zahn O., Zaldarriaga M., Hernquist L., Furlanetto S. R., 2006, Astrophys. J., 653, 815
- Morales et al. (2012) Morales M. F., Hazelton B., Sullivan I., Beardsley A., 2012, Astrophys. J., 752, 137
- Nan et al. (2011) Nan R., et al., 2011, Int. J. Mod. Phys. D, 20, 989
- Newburgh et al. (2016) Newburgh L. B., et al., 2016, Proc. SPIE Int. Soc. Opt. Eng., 9906, 99065X
- Ni et al. (2022) Ni S., Li Y., Gao L.-Y., Zhang X., 2022, ApJ, 934, 83
- Obuljen et al. (2018) Obuljen A., Castorina E., Villaescusa-Navarro F., Viel M., 2018, JCAP, 05, 004
- Olivari et al. (2018) Olivari L. C., Dickinson C., Battye R. A., Ma Y.-Z., Costa A. A., Remazeilles M., Harper S., 2018, Mon. Not. Roy. Astron. Soc., 473, 4242
- Parsons & Backer (2009) Parsons A. R., Backer D. C., 2009, Astron. J., 138, 219
- Parsons et al. (2012) Parsons A. R., Pober J. C., Aguirre J. E., Carilli C. L., Jacobs D. C., Moore D. F., 2012, Astrophys. J., 756, 165
- Paul et al. (2016) Paul S., et al., 2016, Astrophys. J., 833, 213
- Paul et al. (2021) Paul S., Santos M. G., Townsend J., Jarvis M. J., Maddox N., Collier J. D., Frank B. S., Taylor R., 2021, Mon. Not. Roy. Astron. Soc., 505, 2039
- Paul et al. (2023) Paul S., Santos M. G., Chen Z., Wolz L., 2023, arXiv e-prints, p. arXiv:2301.11943
- Perivolaropoulos & Skara (2022) Perivolaropoulos L., Skara F., 2022, New Astron. Rev., 95, 101659
- Pober (2015) Pober J. C., 2015, Mon. Not. Roy. Astron. Soc., 447, 1705
- Poulin et al. (2019) Poulin V., Smith T. L., Karwal T., Kamionkowski M., 2019, Phys. Rev. Lett., 122, 221301
- Pourtsidou (2018) Pourtsidou A., 2018, PoS, MeerKAT2016, 037
- Pourtsidou et al. (2017) Pourtsidou A., Bacon D., Crittenden R., 2017, Mon. Not. Roy. Astron. Soc., 470, 4251
- Pritchard & Loeb (2012) Pritchard J. R., Loeb A., 2012, Rept. Prog. Phys., 75, 086901
- Riess (2019) Riess A. G., 2019, Nature Rev. Phys., 2, 10
- Sahni & Starobinsky (2000) Sahni V., Starobinsky A. A., 2000, Int. J. Mod. Phys. D, 9, 373
- Santos et al. (2015) Santos M. G., et al., 2015, PoS, AASKA14, 019
- Santos et al. (2017) Santos M. G., et al., 2017, in MeerKAT Science: On the Pathway to the SKA. (arXiv:1709.06099)
- Scelfo et al. (2022) Scelfo G., Spinelli M., Raccanelli A., Boco L., Lapi A., Viel M., 2022, JCAP, 01, 004
- Seo & Hirata (2016) Seo H.-J., Hirata C. M., 2016, Mon. Not. Roy. Astron. Soc., 456, 3142
- Seo et al. (2010) Seo H.-J., Dodelson S., Marriner J., Mcginnis D., Stebbins A., Stoughton C., Vallinotto A., 2010, Astrophys. J., 721, 164
- Sprenger et al. (2019) Sprenger T., Archidiacono M., Brinckmann T., Clesse S., Lesgourgues J., 2019, JCAP, 02, 047
- Switzer et al. (2013a) Switzer E. R., et al., 2013a, MNRAS, 434, L46
- Switzer et al. (2013b) Switzer E. R., et al., 2013b, Mon. Not. Roy. Astron. Soc., 434, L46
- Terni de Gregory et al. (2021) Terni de Gregory B., et al., 2021, Mon. Not. Roy. Astron. Soc., 504, 2924
- Tramonte & Ma (2020) Tramonte D., Ma Y.-Z., 2020, Mon. Not. Roy. Astron. Soc., 498, 5916
- Vagnozzi (2020) Vagnozzi S., 2020, Phys. Rev. D, 102, 023518
- Vedantham et al. (2012) Vedantham H., Shankar N. U., Subrahmanyan R., 2012, Astrophys. J., 745, 176
- Verde et al. (2019) Verde L., Treu T., Riess A. G., 2019, Nature Astron., 3, 891
- Viljoen et al. (2021) Viljoen J.-A., Fonseca J., Maartens R., 2021, JCAP, 11, 010
- Villaescusa-Navarro et al. (2015) Villaescusa-Navarro F., Bull P., Viel M., 2015, Astrophys. J., 814, 146
- Wang et al. (2021) Wang J., et al., 2021, Mon. Not. Roy. Astron. Soc., 505, 3698
- Wolz et al. (2016) Wolz L., Tonini C., Blake C., Wyithe J. S. B., 2016, Mon. Not. Roy. Astron. Soc., 458, 3399
- Wolz et al. (2022) Wolz L., et al., 2022, Mon. Not. Roy. Astron. Soc., 510, 3495
- Wu & Zhang (2022) Wu P.-J., Zhang X., 2022, JCAP, 01, 060
- Wu et al. (2021) Wu F., et al., 2021, Mon. Not. Roy. Astron. Soc., 506, 3455
- Wu et al. (2023a) Wu P.-J., Shao Y., Jin S.-J., Zhang X., 2023a, JCAP, 06, 052
- Wu et al. (2023b) Wu P.-J., Li Y., Zhang J.-F., Zhang X., 2023b, Sci. China Phys. Mech. Astron., 66, 270413
- Wuensche et al. (2020) Wuensche C. A., et al., 2020, Exper. Astron., 50, 125
- Wyithe et al. (2008) Wyithe S., Loeb A., Geil P., 2008, Mon. Not. Roy. Astron. Soc., 383, 1195
- Xiao et al. (2021) Xiao L., Costa A. A., Wang B., 2021, Mon. Not. Roy. Astron. Soc., 510, 1495
- Xu & Zhang (2020) Xu Y., Zhang X., 2020, Sci. China Phys. Mech. Astron., 63, 270431
- Xu et al. (2015) Xu Y., Wang X., Chen X., 2015, Astrophys. J., 798, 40
- Xu et al. (2018) Xu X., Ma Y.-Z., Weltman A., 2018, Phys. Rev. D, 97, 083504
- Zhang & Huang (2020) Zhang X., Huang Q.-G., 2020, Sci. China Phys. Mech. Astron., 63, 290402
- Zhang et al. (2020) Zhang J.-F., Wang B., Zhang X., 2020, Sci. China Phys. Mech. Astron., 63, 280411
- Zhang et al. (2021) Zhang M., Wang B., Wu P.-J., Qi J.-Z., Xu Y., Zhang J.-F., Zhang X., 2021, Astrophys. J., 918, 56
- Zlatev et al. (1999) Zlatev I., Wang L.-M., Steinhardt P. J., 1999, Phys. Rev. Lett., 82, 896
- de Villiers & Cotton (2022) de Villiers M. S., Cotton W. D., 2022, Astron. J., 163, 135