\ul
Towards Answering Climate Questionnaires
from Unstructured Climate Reports
Abstract
The topic of Climate Change (CC) has received limited attention in NLP despite its urgency. Activists and policymakers need NLP tools to effectively process the vast and rapidly growing unstructured textual climate reports into structured form. To tackle this challenge we introduce two new large-scale climate questionnaire datasets and use their existing structure to train self-supervised models. We conduct experiments to show that these models can learn to generalize to climate disclosures of different organizations types than seen during training. We then use these models to help align texts from unstructured climate documents to the semi-structured questionnaires in a human pilot study. Finally, to support further NLP research in the climate domain we introduce a benchmark of existing climate text classification datasets to better evaluate and compare existing models.111Corresponding Author:dspokoyn@cs.cmu.edu
1 Introduction
Globally, tens of thousands of climate reports have been generated by different stakeholders such as corporations, cities, states, and national governments either voluntarily or in response to regulatory pressure. These reports disclose vital information on carbon emissions, impacts, and risks – for example, a firm’s emissions reduction targets or a city’s water risk and exposure to drought. Increasingly, NLP is a critical technology supporting large scale processing of climate reports to enable downstream applications like detecting corporate greenwashing Bingler et al. (2021) or identifying misinformation about climate change Meddeb et al. (2022). However, for climate researchers to make use of the information contained in these unstructured text documents, their contents must first be collated into semi-structured questionnaires that have consistent fields across reporting bodies and report types. These structured questionnaires, in turn, allow climate researchers to compare progress across different stakeholders and identify which areas need financing, education, policy changes or other resources. Currently, this extraction process requires an immense amount of manual effort resulting in whole organizations focused on mapping a single type of unstructured reports (Nationally Determined Contribution) to a single type of semi-structured questionnaires (Sustainable Development Goals).222World Resources Institute’s: www.climatewatchdata.org333For more background info see Appendix B.
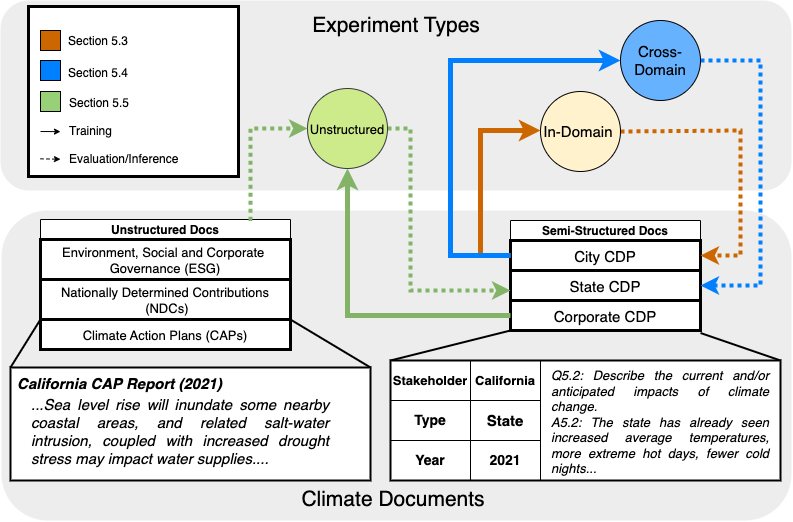
In order to facilitate NLP research for this task, we introduce two new datasets, Clima-CDP and Clima-Ins, which are composed of publicly accessible semi-structured questionnaires from different stakeholders including cities, states and corporations. We utilize the structure of the questionnaires to train self-supervised classification models to align answers to questions (Section 5.3). Further, we show how the setup of our objective allows our model to generalize to a more challenging scenario where the set of questions and the stakeholder-type are both different at test time (Section 5.4). Finally, we show that models trained on Clima-CDP can be directly applied to map passages from unstructured documents into questionnaire categories, which matches the real-world use-case that climate researchers need solved (Section 5.5). In Figure 1 we depict all three of these experiments as well as examples of the different reports and stakeholder-types.
There are other existing climate-specific datasets for detecting relevance to climate Leippold and Varini (2020), identifying stance detection Vaid et al. (2022a) and fact-checking Leippold and Diggelmann (2020) of social media claims. In contrast, the questionnaires we introduce have an order of magnitude more data, are comprehensive in both the breadth of topics covered and the depth of detail provided making our models most suitable for a wide range of climate applications.
Climate reports have also been used as a source of unlabeled data to continue pretraining large language models to better adapt them for climate specific tasks Luccioni et al. (2020); Webersinke et al. (2021). However, it remains an open question whether these domain-specific models can effectively generalize since evaluation of these models has been limited on the climate domain. To address this gap in comprehensive evaluation, we collate five existing climate datasets, along with our two new datasets into a benchmark dataset (ClimaBench), and find that the domain-specific models like ClimateBERT underperform compared to existing general models (Section 5.2).
In summary, our contributions are as follows:
-
1.
We introduce two new datasets, Clima-CDP and Clima-Ins, consisting of difficult classification tasks that are analogous to current manual work done by climate researchers, and conduct extensive in-domain experiments.
-
2.
We collate and release ClimaBench, an evaluation dataset of climate-related text classification tasks and show that, counter-intuitively, general-purpose ML models outperform domain-specific models across tasks within the benchmark.
-
3.
We conduct a pilot study, evaluated manually by a climate researcher, that uses a model trained on Clima-CDP to populate a questionnaire from real-world unstructured climate reports.
We believe our contributions are an important step for an emerging domain of building NLP tools for climate researchers. To that end, we release our benchmark444https://github.com/climabench/climabench and open-source our trained models555https://huggingface.co/climabench/miniLM-cdp-all to encourage researchers to extend our existing datasets and contribute new ones.
2 Related Work
Climate policy evaluation is an active area of research in climate sciences where the goal is to evaluate the effectiveness of current climate policies so as to inform future policy decisions Swarnakar and Modi (2021); Cação et al. (2021). It allows for the development, assessment, and improvement of regulation, increases transparency and public support, and encourages public and private sector entities to make pledges or increase their levels of action Fujiwara et al. (2019); Rolnick et al. (2022). NLP has the potential to derive understandable insights from policy texts for these applications.
Academic literature provides a valuable source of information for conducting these evaluation studies. However, a necessary first step is systematic evidence mapping or identifying which papers are relevant to a particular policy. Berrang-Ford et al. (2021), for instance, build a machine learning system to filter scientific literature relevant to climate adaptation.
Another area of research involves utilizing unstructured climate documents for topic classification. Corringham et al. (2021) attempt to use document headers from unstructured Nationally Determined Contribution (NDC) reports as coarse-grained labels to train a supervised classifier. Most similar to our Clima-QA work is Luccioni et al. (2020) who trained a model to map text passages from public financial disclosures to the 14 questions in Task Force on Climate-related Financial Disclosures (TCFD). They recruited experts to manually label the text passages to the TCFD questions and only train their models on this labeled data. Our work focuses on using the existing structure of large-scale public questionnaires to first train models and then apply them to unstructured texts.
NLP is also used to analyze social media data to understand public opinions and discourse around climate change (Kirilenko and Stepchenkova, 2014). ClimaText Leippold and Varini (2020) and ClimateFEVER Leippold and Diggelmann (2020) extracted and filtered documents from Wikipedia and other sources to curate a CC corpus that was further annotated by humans. In climate finance, Kölbel et al. (2020) have built NLP classifiers to distinguish texts describing physical climate risk versus transition risk. While these studies have independently analyzed small annotated datasets, we make use of semi-structured disclosure forms comprising a much larger set of supervised data, made available to the CC and NLP communities in a clean and accessible format. Similar work has been conducted manually in the CC policy evaluation community (e.g., ClimateWatch) but not over the breadth and scope of documents we consider.
Finally, benchmarks have been an effective way to track progress and highlight the shortcomings of NLP models in both general-purpose understanding (GLUE Wang et al. (2018), SuperGLUE Wang et al. (2019)) as well as specific domains such as legal NLP (LexGLUE Chalkidis et al. (2022)) or biomedical NLP (BLURB Gu et al. (2022)). ClimaBench follows on this chain of thought to provide a unified way to evaluate models on CC-specific problems.
3 Datasets
| Free-form Text/Answer | Class / Question | # Classes | |
|---|---|---|---|
| Clima-Ins | …Each year Aflac reports its US operations Scope 1 and Scope 2 emissions to the Carbon Disclosure Project. Since 2007, Aflac’s owned facilities in terms of square feet have increased by more than 10% while total Scope 1 and 2 CO2e emissions have significantly decreased compared to 2007 emissions… | Does the company have a plan to assess, reduce or mitigate its emissions in its operations or organizations? | 8 |
| CDP-Topic | …These Plans must include management of CD&E waste, both through on-site recycling and re-use and on-site waste processing prior to disposal.Westminster will contribute to the London Plan target of net self-sufficiency (managing 100% of London’s waste within London) by 2026 by planning for Westminster’s apportionment targets… | Governance and Data Management | 12 |
| CDP-QA (Cities) | Flooding from sea level rise will damage building and roads in the coastal neighborhoods of the city. Flooding also represents a risk to major transportation hubs infrastructure in the region. Coastal flooding can have a long-term effect on major industrial and commercial activities along the coastal areas of the city as well as damage urban forestry and local natural biodiversity. | Please describe the impacts experienced so far, and how you expect the hazard to impact in the future. | 294 |
| Dataset | Source | Task Type | Domain | Stakeholder | # Train | # Dev | # Test | # Classes |
| Clima-Ins | Ours | Multi-class Classification | NAIC | Corporations | 13.7K | 1.7K | 1.7K | 8 |
| CDP-Topic | Ours | Topic Classification | CDP | Cities | 46.8K | 8.7K | 8.9K | 12 |
| Cities | 48.2K | 8.5K | 9.3K | 294 | ||||
| CDP-QA | Ours | Question Answering | CDP | States | 8.7K | 0.9K | 1.1 K | 132 |
| Corporations | 34.5K | 3.6K | 4.9K | 43 | ||||
| ClimaText | Leippold and Varini (2020) | Binary Classification | Wikipedia, 10-K | - | 6K | 0.3K | 1.6K | 2 |
| ClimateStance | Vaid et al. (2022b) | Ternary Classification | - | 3.0 K | 0.3K | 0.3K | 3 | |
| ClimateEng | Vaid et al. (2022b) | Multi-class Classification | - | 3K | 0.3K | 0.3K | 5 | |
| ClimateFEVER | Leippold and Diggelmann (2020) | Fact-Checking | Wikipedia | - | - | - | 1.5K | 3 |
| SciDCC | Mishra and Mittal (2021) | Topic Classification | Science Daily | - | 9.2K | 1.1K | 1.1K | 20 |
In this section we first describe our two new questionnaire datasets, Clima-CDP and Clima-Ins, and then present all the text classification datasets we collected into ClimaBench. We consider a questionnaire, a semi-structured document, filled out by a stakeholder for a particular year to have a set of questions and answers, (, ) where the i-th question-answer pair {, } are both free-form text. Table 1 lists a few interesting examples from the newly introduced datasets. The overall statistics of each dataset are given in Table 2, the token length distribution is given in Appendix Table 9 and details are explained below.
3.1 Clima-Ins
The annual NAIC Climate Risk Disclosure Survey666https://interactive.web.insurance.ca.gov is a U.S. insurance regulation tool where insurers file non-confidential disclosures of their assessments and management of climate-related risks. The purpose of the survey is to enhance transparency about how insurers manage climate-related risks and opportunities to enable better-informed collaboration on climate-related issues. The dataset contains survey responses for the years 2012-2021, where each survey consists of eight questions all shown in Appendix A and examples in Table 1. Companies have an option to fill the survey individually or as a group (in case of a conglomerate). In the case of group filing, there may be duplicate answers repeated across all subsidiaries. We remove such responses resulting in a total of 17K question-answer pairs. Further, we delete the first sentence in each response as it contains obvious markers (like "Yes, we do X." or "No, we do not participate in Y."). The splits for training, validation and testing (80%, 10%, 10%) are created by stratifying based on the company so that similar responses from the same company are not seen during train and test.
3.2 Clima-CDP
Carbon Disclosure Project (CDP) is an international organisation that runs a global disclosure questionnaire for various stakeholders to report their environmental information. In 2021 alone over 14,000 organizations filled out the questionnaire which contains hundreds of unique questions.
The Clima-CDP, , is composed of parts [, , ] where each part is a set of questionnaires filled out by a city, company, or state respectively. From the questionnaires we construct two tasks: topic classification (CDP-Topic) and question classification (CDP-QA).
CDP-Topic The CDP questionnaire contains a hierarchy of questions organized by topics such as energy, food, waste. We utilize these topics as labels for a classification task and show the mapping in Appendix Table 8. Thus, for each question-answer pair {, } we also have a topic label. We formulate a topic classification task where the goal is to predict the topic given the text of the answer.
CDP-QA Our aim is to construct controlled experiments with proper evaluation metrics which closely resemble the real-world scenario of aligning unstructured climate reports to semi-structured ones. For example, the CDP dataset allows us to test whether models can generalize to questionnaires of different stakeholder-type. However, since the set of questions for each stakeholder type (, , ) are different from one another, a classifier predicting the question type will not be able to transfer to a new stakeholder type. By using the text of the questions directly we can handle new questions at test time, which allows us to train on questionnaires from cities and test their generalization on questionnaires for states. Since organization may file yearly reports which contain similar information we build train, dev and test splits stratified by the organizations. Further we filter out duplicate, non-English, and short (less than 10 words) responses.
3.3 ClimaBench
In this section we introduce ClimaBench, a benchmark of climate related text classification tasks for evaluating NLP models. We collate five existing climate change related text datasets, described in detail below along with Clima-Ins and CDP-Topic.
ClimaText is a dataset for sentence-based climate change topic detection (Leippold and Varini, 2020). Each sentence is labelled indicating whether it is relevant to climate change or not. Sentences were collected from the general web and Wikipedia as well as the climate-related risks section of US public companies’ 10-K reports.
ClimateStance and ClimateEng Vaid et al. (2022b) extracted Twitter data consisting of 3777 tweets posted during the 2019 United Nations Framework Convention on Climate Change. Each tweet was labelled for two tasks: stance detection and categorical classification. For the stance detection the authors labelled each tweet as In Favour, Against or Ambiguous towards climate change prevention. For categorical classification, the five classes are Disaster, Ocean/Water, Agriculture/Forestry, Politics, and General.
ClimateFEVER Leippold and Diggelmann (2020) adopts the FEVER Thorne et al. (2018) format for a fact-verification task based on climate change claims found on the Internet. The dataset consists of 1,535 claims and five relevant evidence passages from Wikipedia for each claim. The label set for each claim-evidence pair is Supports, Refutes, or Not Enough Info for a total 7675 labelled examples. For ClimateFEVER, we concatenate the texts of each claim-evidence pair as a single input to the model.
SciDCC Mishra and Mittal (2021) The Science Daily Climate Change or SciDCC dataset is curated by scraping news articles from the Science Daily website Mishra and Mittal (2021). It contains around 11k news articles with 20 labeled categories relevant to climate change such as Earthquakes, Pollution and Hurricanes. Each article comprises of a title, a summary, and a body which on average is much longer (500-600 words) than the other climate text datasets. For SciDCC, we concatenate the text fields (title, summary and body) and provide a train, validation and test split (80%, 10%, 10%) for this data, ensuring the distribution of categories in the splits matches the overall distribution.
4 Models
Next, we are going to describe the various baselines and models that we use to conduct experiments using the datasets described above. Most tasks are classification tasks that require in-domain finetuning. For the text classification tasks in ClimaBench, we examine Transformer-based Vaswani et al. (2017) pre-trained language models like BERT Devlin et al. (2019), RoBERTa Liu et al. (2019), distilled versions like DistilRoBERTa Sanh et al. (2019), longer context models like Longformer Beltagy et al. (2020), and domain specific models like ClimateBERT Webersinke et al. (2021) and SciBERT Beltagy et al. (2019). This helps us contrast the effects of model architecture, input length and in-domain pretraining on downstream tasks. We provide more details about models in Appendix Section A.3 and Table 10. For a baseline, we consider a linear kernel Support Vector Machine (SVM) trained using TF-IDF transformed n-gram (1,2,3-gram) features. We also include a simple Majority and Random class voting baselines.
For experimentation on CDP-QA we consider a pre-trained Cross-Encoder MiniLM Wang et al. (2020) model which was separately finetuned on the MS MARCO Passage Retrieval Dataset Campos et al. (2016) by Reimers and Gurevych (2019). The MS MARCO dataset contains real user queries together with annotated relevant text passages. The model takes in as input the query concatenated with the passage and is trained to predict the pair’s binary relevance score. This model achieved state of the art performance across many retrieval tasks Thakur et al. (2021). We consider this as a strong general purpose model in contrast to ClimateBERT which is a domain specific model.
5 Experiments
In our work we conduct four experiments: (1) climabench classification, (2) in-domain self-supervised questionnaire filling, (3) cross-domain questionnaire filling, and (4) unstructured questionnaire filling. For the first experiment, we examine the performance of existing general models as well as climate-specific models on our new ClimaBench evaluation dataset. Experiments 2 and 3 focus on how we can utilize the semi-structured Clima-QA dataset to create a self-supervised version of the unstructured document alignment task in a controlled setting with proper evaluation metrics. Finally, in experiment 4 we will evaluate using human relevance judgements a model trained using the semi-structured CDP dataset can aid in aligning an unstructured climate report to the CDP questionnaire.
5.1 Task Learning Details
Each task has its own supervised training data that allows for in-domain finetuning for the target classification task. In all experiments for all transformer models except MiniLM, we will add a classification head and do full finetuning. For all the pre-trained models, we use publicly available Hugging Face Wolf et al. (2020) checkpoints.777We use the *-base configuration of each pre-trained model, i.e., 12 Transformer blocks, 768 hidden units, and 12 attention heads. For ClimateBERT we report scores for the F variant model on Huggingface. For the QA Cross-encoder, we use the MiniLM (12 layer, 384 hidden-unit) finetuned on MSMARCO available at https://huggingface.co/cross-encoder/ms-marco-MiniLM-L-12-v2 For the Longformer, we use the default settings (windows of 512 tokens and a single global token). We use the Scikit-learn API Pedregosa et al. (2011) for the simple classifiers (Random and Majority class) and TF-IDF-based linear SVM models. We grid-search the hyper parameters for SVM with 5-fold validation (Table 12).
We use a training batch size of 32 and optimize using AdamW Loshchilov and Hutter (2019) with a learning rate of 5e-5 (linear warm-up ratio of 0.1, weight decay of 0.01) for 10 epochs with early stopping based on performance on development data (F1). We use mixed precision (fp16), gradient checkpointing and gradient accumulation steps of 2 to train models efficiently on the limited compute (Appendix A.1). We truncate the input text when it exceeds the maximum input length of the model and otherwise pad the input.
5.2 Text Classification on ClimaBench
| Clima- | Cdp | Clima- | Climate- | Climate- | Climate- | |||
| Models | Ins | Topic | Text | Stance | Eng | SciDCC | FEVER | Avg. |
| Majority | 4.11 | 3.65 | 42.08 | 29.68 | 13.83 | 0.79 | 26.08 | 20.10 |
| Random | 12.14 | 6.45 | 46.86 | 25.52 | 16.71 | 5.05 | 30.62 | 24.09 |
| SVM | 86.00 | 58.34 | 83.39 | 42.92 | 51.81 | 48.02 | - | - |
| BERT | 84.57 | 64.64† | 87.04† | 55.37† | 71.78 | 54.74† | 62.47† | 70.57† |
| RoBERTa | 85.61† | 65.22 | 85.97 | 59.69 | 74.58 | 52.90 | 60.74 | 71.14 |
| DistilRoBERTa | 84.38 | 63.61 | 86.06 | 52.51 | 72.33† | 51.13 | 61.54 | 69.27 |
| Longformer | 84.35 | 64.03 | 87.80 | 34.68 | 72.28 | 54.79 | 60.82 | 67.72 |
| SciBERT | 84.43 | 63.62 | 83.29 | 48.67 | 70.50 | 51.83 | 62.68 | 68.45 |
| ClimateBERT | 84.80 | 64.24 | 85.14 | 52.84 | 71.83 | 52.97 | 61.54 | 69.44 |
In this section we use the new text classification ClimaBench dataset as an evaluation framework to compare the performance of the different models. We use macro-averaged F1 score as our evaluation metric since the datasets are imbalanced and all classes are equally important. For the pre-trained transformer models, we add a single linear classification layer on top of the final token representation and use a weighted cross-entropy loss with class balanced weights.888We do not evaluate linear models on fact-checking or QA as the heterogeneity of the input in these tasks do not align with the linear setup.
5.2.1 Results on ClimaBench
We report text classification results on ClimaBench in Table 3 as well as an average across all tasks. We find there is no single model that does the best across the board, but RoBERTa is a clear winner as it beats the other baselines on four out of eight tasks. Both of the domain adapted models, SciBERT and ClimateBERT do worse than their non-adapted counterparts. For example, ClimateBERT and the model it was warm-started from, DistilRoBERTa, are very similar in performance. Overall, the transformer models have significantly better gains over linear ones except on Clima-Ins where the TF-IDF+SVM model is superior. It shows that simple word co-occurrence statistics are enough for certain tasks and deep language models might not be the right solution in such cases.
5.3 In-Domain CDP-QA
| CDP-Cities | CDP-States | CDP-Corp | ||
| Model | MRR@10 | MRR@10 | MRR@10 | |
| No Finetuning on CDP | ||||
| BM25 | 0.055 | 0.084 | 0.153 | |
| MiniLM | 0.099 | 0.120 | 0.320 | |
| Finetuned on CDP | ||||
| In-Domain | In-Domain | In-Domain | ||
| ClimateBERT | 0.331 | 0.422 | 0.753 | |
| MiniLM | 0.366 | 0.482 | 0.755 | |
| Best Model Finetuned on all | ||||
| MiniLM | 0.352 | 0.489 | 0.745 | |
We utilize the semi-structured nature of the questionnaire to train models in self-supervised fashion. Specifically, we concatenate the free-form text of the answer and question and train a binary classifier to predict whether, in fact, the input answer matches the input question – i.e. does , the th answer in our dataset, provide an answer to , the th question in our dataset: . Since we assume that the indices are setup so that matches if and only if , the ground truth labels are given by .
We use the filled out questionnaires as positive or relevant pairs and randomly sample five negative QA pairs for each relevant pair. We train separate models on each stakeholder-type partition of the CDP dataset and evaluate them on the corresponding in-domain test sets. During inference time, given an answer we compute a relevance score for all combinations of QA pairs from the full set of questions of a particular stakeholder-type.
Since there is a large number of questions, instead of accuracy we consider the Mean Reciprocal Rank at (MRR@) scores for the top items returned by a model. MRR, a popular metric used in the Information Retrieval field, is the average of the reciprocal ranks of results for a sample of queries where the relevance grading is binary (Yes/No).
We narrow down to two models, MiniLM and the ClimateBERT model to study the effects of fine-tuning and transfer learning on the three subdomains: CDP-Cities, CDP-States and CDP-Corp. We also use BM25 Robertson and Zaragoza (2009) and MiniLM with no training as baselines.
5.3.1 Results
We report the results of our in-domain experiments on Clima-QA in Table 4 (detailed results in Appendix Table 13). We find that MiniLM, a much smaller model, beats ClimateBERT across all three different subsets. It is hard to diagnose the exact reason why domain adaptation does not help in this case as well since the data used to further pretrain ClimateBERT is non-public. There may be further room for improvement in domain adaptation for the MiniLM, but we leave this as future work. Lastly, the best performing model, MiniLM, when finetuned on all three subsets, achieves comparable performance on Cities and Corporations while ranking highest on States.
5.4 Transfer CDP-QA
| CDP-States | CDP-Corp | |
| Model | MRR@10 | MRR@10 |
| No Finetuning | ||
| BM25 | 0.084 | 0.153 |
| MiniLM | 0.120 | 0.320 |
| Finetuned on CDP-Cities | ||
| Transfer | Transfer | |
| ClimateBERT | 0.298 | 0.465 |
| MiniLM | 0.353 | 0.489 |
In this section we explore whether it is possible for transfer learning to adapt to questionnaire from a new unseen stakeholder-type. Since the dataset is the largest we use this partition as our training data. Furthermore, since we have the ground truth questionnaires for both states and corporations we are able to evaluate the performance in a controlled setting. At test time we follow the same procedure as for the in-domain experiment however, we marginalize over the set of questions from the unseen stakeholder-type.
5.4.1 Results
We summarize the MRR@ (=10) results for the transfer learning experiments in Table 5 (detailed results in Appendix Table 14). We show that both models are able to beat the no-training baselines. We again find that the MiniLM model outperforms the ClimateBERT model across both transfer learning scenarios. We do observe a significant drop in performance as compared to the in-domain finetuning experiments. This gap is the largest for the corporations dataset, where the MRR@10 drops from 0.745 to 0.48. Overall, we find that the transfer learning models are able to adapt to the unseen stakeholder-type but that there is still room for improvement.
| Ex. | Text Segment from State Climate Action Plans | Top Questions from CDP-States (using fine-tuned MiniLM) | |
|---|---|---|---|
| 1 | Sea level rise will inundate some nearby coastal areas, and related salt-water intrusion, coupled with increased drought stress may impact water supplies. | Q1: Please describe the current and/or anticipated impacts of climate change. | |
| Q3: Please detail any compounding factors that may worsen the impacts of climate change in your region. | |||
| 2 | The afforestation goal is to increase the area of forested lands in the state by 50,000 acres annually through 2025. | Q1: Please provide the details of your region’s target(s). | |
| Q2: Please provide details of your climate actions in the Land use sector. | |||
| 3 | State law defines environmental justice as the fair treatment of people of all races, cultures, and incomes with respect to the development, adoption, implementation, and enforcement of environmental laws, regulations, and policies. | Q1: Please explain why you do not have policies on deforestation and/or forest degradation. | |
| Q4: Please provide details of your climate actions in the Governance sector. |
5.5 Questionnaire Filling
| Prec@1 | Prec@2 | Prec@3 | Prec@4 | Prec@5 | |
|---|---|---|---|---|---|
| Relevant | 63.0 | 67.0 | 68.6 | 69.5 | 71.0 |
| Highly Relevant | 30.0 | 32.0 | 32.3 | 32.5 | 35.6 |
In our final experiment we consider the task of filling in a questionnaire based on an unstructured text document – specifically, we assume a State’s Climate Action Plan (CAP) is available but the corresponding structured CDP report is not. Typically the CAPs are much longer (100 pages) and more comprehensive than any particular disclosure report. The CAPs include quantitative data, such as emission values or renewable electricity generation capacity, and qualitative data such as specific policy interventions across different sectors. Populating CDP questionnaires allows for consistent comparisons to existing datasets which could further be used to compare strategies, identify gaps, or rank jurisdictions on the content and level of ambition in their stated plans. However, this process is time-consuming and requires expert manual effort.
We select our best model, MiniLM, finetuned on the full Clima-CDP dataset to conduct our unstructured questionnaire filling. We can consider a State CAP as an unstructured document , to be a collection of texts, , where is a text segment. The task is then to align a text segment to its corresponding CDP-State question , i.e. . Since we do not have the ground truth alignment we use a climate change researcher in a procedure as follows: 1) First, the expert (climate policy researcher on our team and co-author) selected 5 pages at random from a collection of 20 State CAPs and then selected a random paragraph from each page as a text segment . 2) Then, using our model we calculated relevance scores for each text segment question pair and selected the top 5 scoring questions for each text segment. 3) We then presented each segment along with the five questions to the climate change researcher and had them annotate the relevance for each pair on a three point scale: No Relevance, Relevant, Highly Relevant.999By construction, in our rating there may be multiple relevant questions found for each text segment.
5.5.1 Human Evaluation
Table 7 shows the climate change researcher’s evaluation metrics for our model. Overall, 71.0% of the 500 questions retrieved were judged Relevant and 35.6% rated Highly Relevant. One pitfall of our model is that there were more very relevant predictions ranked fifth than first. One possible explanation for this is that the top retrieved questions were often more general while the questions that were ranked lower were more specific and easier to match (see Table 15 in the Appendix).
We show some examples of text segments and the selected questions in Table 6 and more in the Appendix Table 16. The first two examples show high degrees of success. In example 1, our model correctly identifies the state CAP text as impact-related and captures the specific discussion of compound risks. However, example 3 appears to highlight a gap in the CDP questionnaire related to the topic of environmental justice, a result in itself of considerable interest. Although our pilot study is quite limited, it shows both the promise and the challenges of aligning unstructured climate documents to semi-structured questionnaires.
6 Conclusion
In summary, we introduced two climate questionnaire datasets and illustrated how using their existing structure we can train self-supervised models for climate question answering tasks analogous to real-world challenges faced by climate researchers. Finally we lay the groundwork for future work in this domain by introducing a collated benchmark of existing climate text classification datasets.
7 Limitations
One current limitation of our benchmark is that the datasets are English only, thus restricting evaluation to English trained models. Although the CDP dataset has disclosures in other languages it represents a small portion of the reports. We plan to include relevant climate change datasets from the multilingual European Union Public Data Catalog101010data.europa.edu in the future, while encouraging contributions from the broader community. Another limitation is that for our human evaluation pilot study we were able to only get results for a single model. We wish to build a small labeled dataset where climate experts map State climate action plans to their corresponding CDP questions for evaluation purposes. Doing such manual labeling is particularly difficult for CDP due to the large number of questions but this resource could then be used efficiently to evaluate multiple models and baselines.
We do not thoroughly investigate the efficiency-accuracy trade-offs of the Transformer models in this work. We provide the compute and training efficiency statistics in A.2 and Table 11 as only a step in this direction. In this work we used the MiniLM model, a cross-encoder, for the CDP-QA experiments. Although this model is much smaller, at test time it requires a forward pass for each question-answer pair, which is computationally expensive. In future work it would be interesting to compare the cross-encoder to bi-encoders model architectures to better understand the accuracy vs. performance trade-off. We encourage future work on ClimaBench to leverage models that are both performant and efficient.
Finally, there exists more types of carbon disclosures (TCFD, SBTi) as well as publicly accessible corporate sustainability reports that we wish to include but require more time-consuming scraping and data preprocessing.
References
- esg (2004) 2004. Who cares wins: Connecting the financial markets to a changing world? Technical report, United Nations, The Global Compact.
- tcf (2022) 2022. 2022 status report. Technical report, TCFD.
- cli (2022) 2022. Climate watch. Technical report, World Resources Institute, Washington, D.C.
- Beltagy et al. (2019) Iz Beltagy, Kyle Lo, and Arman Cohan. 2019. SciBERT: A pretrained language model for scientific text. In Proceedings of the 2019 Conference on Empirical Methods in Natural Language Processing and the 9th International Joint Conference on Natural Language Processing (EMNLP-IJCNLP), pages 3615–3620, Hong Kong, China. Association for Computational Linguistics.
- Beltagy et al. (2020) Iz Beltagy, Matthew E. Peters, and Arman Cohan. 2020. Longformer: The long-document transformer. ArXiv, abs/2004.05150.
- Berrang-Ford et al. (2021) Lea Berrang-Ford, Anne J Sietsma, Max W. Callaghan, Jan C. Minx, Pauline F. D. Scheelbeek, Neal Robert Haddaway, Andy Haines, and Alan D. Dangour. 2021. Systematic mapping of global research on climate and health: a machine learning review. The Lancet. Planetary Health, 5:e514 – e525.
- Bills et al. (2022) Amy Bills, Beth Mackay, Chang Deng-Beck, George Bush, Maia Kutner, Rachel Carless, and Simeran Bachra. 2022. Protecting people and the planet: Putting people at the heart of city climate action. Technical report, CDP.
- Bingler et al. (2021) Julia Anna Bingler, Mathias Kraus, and Markus Leippold. 2021. Cheap talk and cherry-picking: What climatebert has to say on corporate climate risk disclosures. Corporate Finance: Governance.
- Brown et al. (2007) Halina Szejnwald Brown, Martin de Jong, and Teodorina Lessidrenska. 2007. The rise of the global reporting initiative (gri) as a case of institutional entrepreneurship. Working Paper 36, John F. Kennedy School of Government, Harvard University.
- Campos et al. (2016) Daniel Fernando Campos, Tri Nguyen, Mir Rosenberg, Xia Song, Jianfeng Gao, Saurabh Tiwary, Rangan Majumder, Li Deng, and Bhaskar Mitra. 2016. Ms marco: A human generated machine reading comprehension dataset. ArXiv, abs/1611.09268.
- Carroll (2009) Archie B. Carroll. 2009. A history of corporate social responsibility: Concepts and practices. In Andrew Crane, Dirk Matten, Abagail McWilliams, Jeremy Moon, and Donald S. Siegel, editors, The Oxford Handbook of Corporate Social Responsibility. Oxford University Press, Oxford.
- Cação et al. (2021) Flávio N Cação, Anna Helena Reali Costa, Natalie Unterstell, Liuca Yonaha, Taciana Stec, and Fábio Ishisaki. 2021. Deeppolicytracker: Tracking changes in environmental policy in the brazilian federal official gazette with deep learning. In ICML 2021 Workshop on Tackling Climate Change with Machine Learning.
- Chalkidis et al. (2022) Ilias Chalkidis, Abhik Jana, Dirk Hartung, Michael James Bommarito, Ion Androutsopoulos, Daniel Martin Katz, and Nikolaos Aletras. 2022. Lexglue: A benchmark dataset for legal language understanding in english. In ACL.
- Corringham et al. (2021) Tom Corringham, Daniel Spokoyny, Eric Xiao, Christopher Cha, Colin Lemarchand, Mandeep Syal, Ethan Olson, and Alexander Gershunov. 2021. Bert classification of paris agreement climate action plans. In ICML 2021 Workshop on Tackling Climate Change with Machine Learning.
- Devlin et al. (2019) Jacob Devlin, Ming-Wei Chang, Kenton Lee, and Kristina Toutanova. 2019. BERT: Pre-training of deep bidirectional transformers for language understanding. In Proceedings of the 2019 Conference of the North American Chapter of the Association for Computational Linguistics: Human Language Technologies, Volume 1 (Long and Short Papers), pages 4171–4186, Minneapolis, Minnesota. Association for Computational Linguistics.
- Fujiwara et al. (2019) Noriko. Fujiwara, Harro van Asselt, Stefan Böner, Sebastian Voigt, Niki-Artemis Spyridaki, Alexandros Flamos, Emilie Alberola, Keith Williges, Andreas Türk, and Michael ten Donkelaar. 2019. The practice of climate change policy evaluations in the european union and its member states: results from a meta-analysis. Sustainable Earth, 2:1–16.
- Gu et al. (2022) Yuxian Gu, Robert Tinn, Hao Cheng, Michael R. Lucas, Naoto Usuyama, Xiaodong Liu, Tristan Naumann, Jianfeng Gao, and Hoifung Poon. 2022. Domain-specific language model pretraining for biomedical natural language processing. ACM Transactions on Computing for Healthcare (HEALTH), 3:1 – 23.
- Kirilenko and Stepchenkova (2014) Andrei P. Kirilenko and Svetlana O. Stepchenkova. 2014. Public microblogging on climate change: One year of twitter worldwide. Global Environmental Change, 26:171–182.
- Kölbel et al. (2020) Julian F. Kölbel, Markus Leippold, Jordy Rillaerts, and Qian Wang. 2020. Does the cds market reflect regulatory climate risk disclosures.
- Lacoste et al. (2019) Alexandre Lacoste, Alexandra Luccioni, Victor Schmidt, and Thomas Dandres. 2019. Quantifying the carbon emissions of machine learning. arXiv preprint arXiv:1910.09700.
- Leippold and Diggelmann (2020) Markus Leippold and Thomas Diggelmann. 2020. Climate-fever: A dataset for verification of real-world climate claims. In NeurIPS 2020 Workshop on Tackling Climate Change with Machine Learning.
- Leippold and Varini (2020) Markus Leippold and Francesco Saverio Varini. 2020. Climatext: A dataset for climate change topic detection. In NeurIPS 2020 Workshop on Tackling Climate Change with Machine Learning.
- Liu et al. (2019) Yinhan Liu, Myle Ott, Naman Goyal, Jingfei Du, Mandar Joshi, Danqi Chen, Omer Levy, Mike Lewis, Luke Zettlemoyer, and Veselin Stoyanov. 2019. Roberta: A robustly optimized bert pretraining approach. ArXiv, abs/1907.11692.
- Loshchilov and Hutter (2019) Ilya Loshchilov and Frank Hutter. 2019. Decoupled weight decay regularization. In ICLR.
- Luccioni et al. (2020) Alexandra Sasha Luccioni, Emily Baylor, and Nicolas Anton Duchêne. 2020. Analyzing sustainability reports using natural language processing. ArXiv, abs/2011.08073.
- Meddeb et al. (2022) Paul Meddeb, Stefan Ruseti, Mihai Dascalu, Simina Terian, and Sébastien Travadel. 2022. Counteracting french fake news on climate change using language models. Sustainability.
- Mishra and Mittal (2021) Prakamya Mishra and Rohan Mittal. 2021. Neuralnere: Neural named entity relationship extraction for end-to-end climate change knowledge graph construction. In ICML 2021 Workshop on Tackling Climate Change with Machine Learning.
- Pedregosa et al. (2011) F. Pedregosa, G. Varoquaux, A. Gramfort, V. Michel, B. Thirion, O. Grisel, M. Blondel, P. Prettenhofer, R. Weiss, V. Dubourg, J. Vanderplas, A. Passos, D. Cournapeau, M. Brucher, M. Perrot, and E. Duchesnay. 2011. Scikit-learn: Machine learning in Python. Journal of Machine Learning Research, 12:2825–2830.
- Reimers and Gurevych (2019) Nils Reimers and Iryna Gurevych. 2019. Sentence-bert: Sentence embeddings using siamese bert-networks. In Proceedings of the 2019 Conference on Empirical Methods in Natural Language Processing. Association for Computational Linguistics.
- Robertson and Zaragoza (2009) Stephen Robertson and Hugo Zaragoza. 2009. The probabilistic relevance framework: Bm25 and beyond. Found. Trends Inf. Retr., 3(4):333–389.
- Rolnick et al. (2022) David Rolnick, Priya L. Donti, Lynn H. Kaack, Kelly Kochanski, Alexandre Lacoste, Kris Sankaran, Andrew Slavin Ross, Nikola Milojevic-Dupont, Natasha Jaques, Anna Waldman-Brown, Alexandra Sasha Luccioni, Tegan Maharaj, Evan D. Sherwin, S. Karthik Mukkavilli, Konrad P. Kording, Carla P. Gomes, Andrew Y. Ng, Demis Hassabis, John C. Platt, Felix Creutzig, Jennifer Chayes, and Yoshua Bengio. 2022. Tackling climate change with machine learning. ACM Comput. Surv., 55(2).
- Sachs (2012) Jeffrey D. Sachs. 2012. From millennium development goals to sustainable development goals. The Lancet, 379(9832):2206–2211.
- Sanh et al. (2019) Victor Sanh, Lysandre Debut, Julien Chaumond, and Thomas Wolf. 2019. Distilbert, a distilled version of bert: smaller, faster, cheaper and lighter. ArXiv, abs/1910.01108.
- Stede and Patz (2021) Manfred Stede and Ronny Patz. 2021. The climate change debate and natural language processing. In Proceedings of the 1st Workshop on NLP for Positive Impact, pages 8–18, Online. Association for Computational Linguistics.
- Swarnakar and Modi (2021) Pradip Swarnakar and Ashutosh Modi. 2021. Nlp for climate policy: Creating a knowledge platform for holistic and effective climate action. ArXiv, abs/2105.05621.
- Thakur et al. (2021) Nandan Thakur, Nils Reimers, Andreas Ruckl’e, Abhishek Srivastava, and Iryna Gurevych. 2021. Beir: A heterogenous benchmark for zero-shot evaluation of information retrieval models. ArXiv, abs/2104.08663.
- Thorne et al. (2018) James Thorne, Andreas Vlachos, Christos Christodoulopoulos, and Arpit Mittal. 2018. FEVER: a large-scale dataset for fact extraction and VERification. In NAACL-HLT.
- Vaid et al. (2022a) Roopal Vaid, Kartikey Pant, and Manish Shrivastava. 2022a. Towards fine-grained classification of climate change related social media text. In ACL.
- Vaid et al. (2022b) Roopal Vaid, Kartikey Pant, and Manish Shrivastava. 2022b. Towards fine-grained classification of climate change related social media text. In Proceedings of the 60th Annual Meeting of the Association for Computational Linguistics: Student Research Workshop, pages 434–443, Dublin, Ireland. Association for Computational Linguistics.
- Vaswani et al. (2017) Ashish Vaswani, Noam Shazeer, Niki Parmar, Jakob Uszkoreit, Llion Jones, Aidan N Gomez, Ł ukasz Kaiser, and Illia Polosukhin. 2017. Attention is all you need. In Advances in Neural Information Processing Systems, volume 30. Curran Associates, Inc.
- Wang et al. (2019) Alex Wang, Yada Pruksachatkun, Nikita Nangia, Amanpreet Singh, Julian Michael, Felix Hill, Omer Levy, and Samuel Bowman. 2019. Superglue: A stickier benchmark for general-purpose language understanding systems. In Advances in Neural Information Processing Systems, volume 32. Curran Associates, Inc.
- Wang et al. (2018) Alex Wang, Amanpreet Singh, Julian Michael, Felix Hill, Omer Levy, and Samuel Bowman. 2018. GLUE: A multi-task benchmark and analysis platform for natural language understanding. In Proceedings of the 2018 EMNLP Workshop BlackboxNLP: Analyzing and Interpreting Neural Networks for NLP, pages 353–355, Brussels, Belgium. Association for Computational Linguistics.
- Wang et al. (2020) Wenhui Wang, Furu Wei, Li Dong, Hangbo Bao, Nan Yang, and Ming Zhou. 2020. Minilm: Deep self-attention distillation for task-agnostic compression of pre-trained transformers.
- Webersinke et al. (2021) Nicolas Webersinke, Mathias Kraus, Julia Anna Bingler, and Markus Leippold. 2021. Climatebert: A pretrained language model for climate-related text. ArXiv, abs/2110.12010.
- Wolf et al. (2020) Thomas Wolf, Lysandre Debut, Victor Sanh, Julien Chaumond, Clement Delangue, Anthony Moi, Pierric Cistac, Tim Rault, Rémi Louf, Morgan Funtowicz, Joe Davison, Sam Shleifer, Patrick von Platen, Clara Ma, Yacine Jernite, Julien Plu, Canwen Xu, Teven Le Scao, Sylvain Gugger, Mariama Drame, Quentin Lhoest, and Alexander M. Rush. 2020. Transformers: State-of-the-art natural language processing. In Proceedings of the 2020 Conference on Empirical Methods in Natural Language Processing: System Demonstrations, pages 38–45, Online. Association for Computational Linguistics.
Appendix A Appendix
A.1 Compute Details
We used a 24 core AMD Ryzen CPU machine with 128 GB RAM for data processing. For training and inference of the deep learning models, we utilize 4 Nvidia RTX 2080Ti GPUs with 11GB memory each. Each model was trained on a single GPU at a time.
| Section | Category/Label |
|---|---|
| Hazards: Adaptation | Adaptation |
| Adaptation | Adaptation |
| Buildings | Buildings |
| Hazards: Climate Hazards | Climate Hazards |
| Hazards: Social Risks | Climate Hazards |
| Climate Hazards | Climate Hazards |
| Climate Hazards and Vulnerability | Climate Hazards |
| Climate Hazards & Vulnerability | Climate Hazards |
| City-wide Emissions | Emissions |
| Emissions Reduction | Emissions |
| GHG Emissions Data | Emissions |
| Local Government Emissions | Emissions |
| Emissions Reduction: City-wide | Emissions |
| City Wide Emissions | Emissions |
| Emissions Reduction: Local Government | Emissions |
| Local Government Operations GHG Emissions Data | Emissions |
| Energy Data | Energy |
| Energy | Energy |
| Food | Food |
| Governance and Data Management | Governance and Data Management |
| Opportunities | Opportunities |
| Strategy | Strategy |
| Urban Planning | Strategy |
| Transport | Transport |
| Waste | Waste |
| Water | Water |
| Water Security | Water |
| Task | Average | Max | Min | Std |
|---|---|---|---|---|
| Clima-Ins | 203 | 4588 | 11 | 326 |
| Clima-Ins | 206 | 4588 | 11 | 335 |
| Clima-CDP | 73 | 801 | 11 | 83 |
| Clima-QA | 105 | 834 | 15 | 88 |
| ClimaText | 23 | 124 | 11 | 10 |
| ClimateStance | 30 | 98 | 11 | 12 |
| ClimateEng | 30 | 98 | 11 | 12 |
| ClimateFEVER | 47 | 311 | 11 | 19 |
| SciDCC | 580 | 2014 | 13 | 223 |
| Model | Source | # Params | Vocab Size | Max Length |
|---|---|---|---|---|
| BERT | Devlin et al. (2019) | 110M | 30K | 512 |
| RoBERTa | Liu et al. (2019) | 125M | 50K | 512 |
| DistilRoBERTa | Sanh et al. (2019) | 82M | 50K | 512 |
| Longformer | Beltagy et al. (2020) | 149M | 50K | 4096 |
| SciBERT | Beltagy et al. (2019) | 110M | 30K | 512 |
| ClimateBERT | Webersinke et al. (2021) | 82M | 50K | 512 |
A.2 CO2 Emission Related to Experiments
A cumulative of 338 hours of computation was performed on hardware of type RTX 2080 Ti (TDP of 250W). Total emissions are estimated to be 36.5 kgCO2eq. Estimations were conducted using the MachineLearning Impact calculator presented in Lacoste et al. (2019).
| Model | Avg. Runtime (in hours) | Avg. Train Samples/Second | Avg. Train Steps/Second |
|---|---|---|---|
| ClimateBERT | 0.40 | 104.83 | 1.64 |
| DistilRoBERTa | 0.40 | 101.04 | 1.58 |
| SciBERT | 0.70 | 53.86 | 0.84 |
| RoBERTa | 0.80 | 50.46 | 0.79 |
| BERT | 0.85 | 49.32 | 0.77 |
| Longformer | 14.95 | 13.82 | 0.76 |
A.3 Pretrained Transformer Models
BERT Devlin et al. (2019) is a popular Transformer-based language model pre-trained on masked language modeling and next sentence prediction tasks. It makes use of WordPiece tokenization algorithm that breaks a word into several subwords, such that commonly seen subwords can also be represented by the model.
RoBERTa Liu et al. (2019) uses dynamic masking and eliminates the next sentence prediction pre-training task, while using a larger vocabulary and pre-training on much larger corpora compared to BERT. Another notable difference is the use of byte pair encoding compared to wordPiece in BERT.
DistilRoBERTa Sanh et al. (2019) leverages knowledge distillation during the pre-training phase reducing the size of the RoBERTa model by 40%, while retaining 97% of its language understanding capabilities and being 60% faster. Sanh et al. (2019) originally distilled the BERT model but we utilize the better performing RoBERTa version in our experiments.
Longformer Beltagy et al. (2020) extends Transformer-based models to support longer sequences with the help of sparse-attention. It uses a combination of local attention and global attention mechanism that allows for linear attention complexity and thus makes it feasible to run on longer documents (max 4096 tokens). It however takes much longer to train than the shorter context (512 tokens) models.
SciBERT Beltagy et al. (2019), a pretrained language model based on BERT, leverages unsupervised pretraining on a large multi-domain corpus of scientific publications to improve performance on downstream scientific NLP tasks. It was evaluated on tasks like sequence tagging, sentence classification and dependency parsing with datasets from scientific domains. SciBERT gives significant improvements over BERT on these datasets.
ClimateBERT Webersinke et al. (2021) was warm-started from the DistilRoBERTa model and pretrained on text corpora from climate-related research paper abstracts, corporate and general news and reports from companies that were not publicly released with the model. It was evaluated on tasks like sentiment analysis (using a private dataset), and public datasets like ClimaText and ClimateFEVER. In this paper, we evaluate and compare the performance of ClimateBERT on diverse CC tasks for the first time, providing a comprehensive, publicly available and reproducible evaluation.
| Parameter | Values |
|---|---|
| loss | hinge, squared_hinge |
| C | 0.01, 0.1, 1, 10 |
| class_weight | none, balanced |
| CDP-Cities | CDP-States | CDP-Corp | |||||
| Model | MRR@10 | MRR@All | MRR@10 | MRR@All | MRR@10 | MRR@All | |
| No Finetuning on CDP | |||||||
| BM25 | 0.055 | 0.077 | 0.084 | 0.105 | 0.153 | 0.180 | |
| MiniLM | 0.099 | 0.118 | 0.120 | 0.142 | 0.320 | 0.342 | |
| Finetuned on CDP | |||||||
| In-Domain | In-Domain | In-Domain | |||||
| ClimateBERT | 0.331 | 0.344 | 0.422 | 0.431 | 0.753 | 0.754 | |
| MiniLM | 0.366 | 0.378 | 0.482 | 0.491 | 0.755 | 0.757 | |
| Best Model Finetuned on all | |||||||
| MiniLM | 0.352 | 0.364 | 0.489 | 0.497 | 0.745 | 0.747 | |
| CDP-States | CDP-Corp | |||
| Model | MRR@10 | MRR@All | MRR@10 | MRR@All |
| No Finetuning | ||||
| BM25 | 0.084 | 0.105 | 0.153 | 0.180 |
| MiniLM | 0.120 | 0.142 | 0.320 | 0.342 |
| Finetuned on CDP-Cities | ||||
| Transfer | Transfer | |||
| ClimateBERT | 0.298 | 0.314 | 0.465 | 0.477 |
| MiniLM | 0.353 | 0.366 | 0.489 | 0.500 |
| Question | MRR@132 | ||
|---|---|---|---|
| Please provide details of your climate actions in the Agriculture sector. | 0.870 | ||
| Please provide details of your climate actions in the Waste sector. | 0.789 | ||
| Please provide details of your climate actions in the Transport sector. | 0.774 | ||
| Please provide details of your climate actions in the Buildings & Lighting sector. | 0.597 | ||
| Please describe these current and/or anticipated impacts of climate change. | 0.492 | ||
| Please complete the table below. | 0.487 | ||
| Please indicate the opportunities and describe how the region is positioning itself to take advantage of them. | 0.445 | ||
| Please provide details of your climate actions in the Energy sector. | 0.397 | ||
| Please describe the adaptation actions you are taking to reduce the vulnerability of your region’s citizens, businesses and infrastructure to the impacts of climate change identified in 6.6a. | 0.378 | ||
| Please describe these current and/or future risks due to climate change. | 0.327 | ||
| List any emission reduction, adaptation, water related or resilience projects that you have planned within your region for which you hope to attract financing, and provide details on the estimated costs and status of the project. If your region does not have any relevant projects, please select “No relevant projects” under Project Area. | 0.319 | ||
| Please provide details of your climate actions in the Land use sector. | 0.286 | ||
| Please provide the details of your region-wide base year emissions reduction target(s). You may add rows to provide the details of your sector-specific targets by selecting the relevant sector in the sector field. | 0.252 | ||
| Please describe the adaptation actions you are taking to reduce the vulnerability of your region’s citizens, businesses and infrastructure to the risks due to climate change identified in 5.4a. | 0.247 |
Appendix B Climate Text Sources
The reports considered here include climate assessments, climate legislation, agency reports, regulatory filings, climate action plans (CAPs), and corporate ESG (Environmental, Social, and Governance) and CSR (Corporate Social Responsibility) documents esg (2004); Carroll (2009).
A key step in curbing emissions and mitigating climate change has been the development of standards and frameworks for climate reporting such as GRI (Global Reporting Initiative), TCFD (Task Force on Climate-Related Financial Disclosures), CDP (Carbon Disclosure Project), SASB (Sustainability Accounting Standards Board), and SDG (Sustainable Development Goals) Brown et al. (2007); tcf (2022); Bills et al. (2022); Sachs (2012)
For example, the World Resources Institute has built Climate Watch cli (2022) to keep track of progress and commitments nations have made under the 2015 Paris Agreement. One element of their work has been the manual labeling of Nationally Determined Contributions (NDCs) with a number of descriptors including cross references to the UN Sustainable Development Goals which strongly overlap with the categories in our CDP dataset and task.
Although SDGs were first established by the United Nations to measure the progress of nation states towards development goals, they have been adopted by both corporations and regional and local jurisdictions to measure their sustainability efforts.
However, since the cross-referencing with SDGs is largely voluntary many cities, for example, have CAPs that are hundreds of pages in length but that provide no alignment with SDGs. Being able to effectively align the text between different climate documents to the various standards and disclosure frameworks is a critical component of climate policy evaluation and a real-world challenge. See also Stede and Patz (2021) for more in-depth information.
| Ex. | Text Segment from State Climate Action Plans | Top Questions from CDP-States (using fine-tuned MiniLM) | |
|---|---|---|---|
| 1 | By a majority vote, the ICCAC presents a policy option that, if deemed necessary, would build one new 1200-megawatt nuclear power plant in Iowa by January 1, 2020. | Q3: Please provide details of your renewable energy or electricity target(s). | |
| Q4: Please provide details of your climate actions in the Energy sector. | |||
| 2 | California maintains a GHG inventory that is consistent with IPCC practices … Reports from facilities and entities that emit more than 25,000 MTCO2e are verified by a CARB-accredited third-party verification body. | Q1: Please give the name of the primary protocol, standard, or methodology you have used to calculate your government’s GHG emissions. | |
| Q3: Please provide the following information about the emissions verification process. | |||
| 3 | A leading driver of these high emissions is the fact that the District’s daytime population swells by 400,000 workers every workday, which is the largest percentage increase in daytime population of any large city in the nation. | Q4: Please indicate if your region-wide emissions have increased, decreased, or stayed the same since your last emissions inventory, and please describe why. | |
| Q5: Please report your region-wide base year emissions in the table below. |