Pseudopotential Bethe-Salpeter calculations for shallow-core x-ray absorption near-edge structures: excitonic effects in -Al2O3
Abstract
We present an ab initio description of optical and shallow-core x-ray absorption spectroscopies in a unified formalism based on the pseudopotential plane-wave method at the level of the Bethe-Salpeter equation (BSE) within Green’s functions theory. We show that norm-conserving pseudopotentials are reliable and accurate not only for valence, but also for semicore electron excitations. In order to validate our approach, we compare BSE absorption spectra obtained with two different codes: the pseudopotential-based code EXC and the all-electron full-potential code Exciting. We take corundum -Al2O3 as an example, being a prototypical material that presents strong electron-hole interactions for both valence and core electron excitations. We analyze in detail the optical absorption spectrum as well as the Al L1 and L2,3 edges in terms of anisotropy, crystal local fields, interference and excitonic effects. We perform a thorough inspection of the origin and localization of the lowest-energy excitons, and conclude highlighting the purely electronic character off the pre-edge of L1 and the dichroic nature of the optical and L23 spectra.
I Introduction
X-ray absorption spectroscopy (XAS) and optical absorption are complementary techniques to determine materials properties. In optical absorption, valence electrons are excited into unoccupied conduction states across the band gap (or the Fermi energy in metals). Their excitations determine the color (or the transparency) of materials and are crucial to many materials properties and functionalities, spanning from optoelectronics to solar energy conversion and storage. In XAS, promoted to unoccupied conduction bands are instead core electrons, tightly bound to the nuclei. X-ray absorption near-edge structures (XANES), also known as near-edge X-ray absorption fine structure (NEXAFS), being element specific, is a probe of the atomic environment, giving structural and chemical informationvan Bokhoven and Lamberti (2016). In the simplest independent-particle picture, XANES spectra are proportional to the unoccupied density of states, projected on the absorbing atom and the angular momentum component that is selected by dipole selection rules, whereas optical spectra can be interpreted on the basis of the joint density of states of valence and conduction bands. In both spectroscopies, the interaction between the excited electron and the hole left behind can strongly alter this independent-particle picture. Indeed, the electron-hole attraction can give rise to excitons, i.e bound electron-hole pairs, leading to a transfer of spectral weight to lower energies in the spectra, including the formation of sharp peaks at their onset.
Given the importance of XANES spectroscopy, several theoretical methods have been developed to interpret the measured spectra in solids, taking care of core-hole effects at different levels of approximationde Groot et al. (2021). The most efficient approaches are, on one side, multiple scattering methodsFujikawa (1983); Tyson et al. (1992); Ahlers et al. (1998); Rehr and Albers (2000); Rehr et al. (2009, 2010), and, on the other side, multiplet modelsde Groot (2005); De Groot and Kotani (2008); Haverkort et al. (2012). While the former usually neglect the electronic interactions, the latter are often semiempirical (i.e., not entirely parameter-free) and generally neglect solid-state effects, being a many-body solution of finite-cluster models. Since the excitations of the core electrons are localised at the absorbing atoms, delta-self-consistent-field (SCF) methods can be also employed, nowadays usually within first-principles density-functional theoryMo and Ching (2000); Gougoussis et al. (2009); Taillefumier et al. (2002); Bunău and Calandra (2013); Mazevet et al. (2010); Hetényi et al. (2004); Prendergast and Galli (2006); Gao et al. (2009); Prentice et al. (2020). The core-excited atom is treated as an impurity in a supercell approach, and the presence of the core hole is taken into account in different ways, from the Z+1 approximationHjalmarson et al. (1981); Lie et al. (1999) (the absorbing atom is assumed to have one additional nuclear charge), to the half core-hole approximation Triguero et al. (1998); Klein et al. (2021) (also known as Slater’s transition-state method) or the full core-hole approximation (the electron removed from the core is put at lowest conduction band, or ionized). Alternatively, XANES excitation spectra can be directly obtained within linear-response theoryRehr et al. (2005); Liang et al. (2017), which is the standard approach for valence excitations and optical spectra as wellOnida et al. (2002). In this case, two possible options are time-dependent density-functional theoryBesley et al. (2009); Bunău and Joly (2012, 2012) (TDDFT) and the Bethe-Salpeter equationStrinati (1982, 1984); Shirley (1998); Carlisle et al. (1999); Shirley (2000) (BSE) of Green’s function theoryMartin et al. (2016); Bechstedt (2014). Since TDDFT lacks of efficient approximations for describing accurately excitonic effects in solidsBotti et al. (2007), the BSE, even though computationally more expensive, is usually more reliableOnida et al. (2002). In the present work, the solution of the BSE will therefore be also our preferred choice to simulate valence and shallow-core excitation spectra within the same formalism.
In the simulation of core excitation spectra, the intuitive technique to represent the single-particle wave functions are all-electron methods. They explicitly deal with core electrons in extended materials by partitioning the space into interstitial and muffin-tin (MT) regions, where wave functions are described differently according to their localisation degreeWills et al. (2010); Andersen (1975); Sjöstedt et al. (2000); Madsen et al. (2001). Instead, methods that are based on plane-wave expansions cannot deal explicitly with the quickly oscillatory behavior of core electrons, tightly localised near the nuclei, which are instead generally taken into account effectively through the design of suitable pseudopotentialsPayne et al. (1992). Plane-wave methods are computationally cheaper and new theoretical developments are easier to implement in plane-wave computer codes. Moreover, the separation between core electrons, kept frozen, and valence electrons, treated explicitly, is often not rigid. Between valence and deep core electrons, there are often also shallow-core (or semicore) electrons, which in the pseudopotential framework can be in principle also treated as valence electrons, although at a price of higher computational cost. However, in all the cases, the pseudopotential formalism also introduces an important approximation, requiring a pseudization of the valence wave functions near the nuclei that makes them smoother and node free.
In the recent past, much work has been devoted to assess pseudopotential calculations for ground state Willand et al. (2013); Lejaeghere et al. (2014); Prandini et al. (2018); Lejaeghere et al. (2016) and excited-state properties with respect to all-electron methods, notably for self-energy calculations of quasiparticle band structure energies Ku and Eguiluz (2002); Delaney et al. (2004); Tiago et al. (2004); van Schilfgaarde et al. (2006a); Friedrich et al. (2006); Gómez-Abal et al. (2008); Luppi et al. (2008); Klimeš et al. (2014); Friedrich et al. (2011a, b); Jiang and Blaha (2016); Jiang (2018). In the present work, we directly address the question of the validity of the pseudopotential approximation for XANES spectra of shallow-core edges (i.e., for electron binding energies smaller than 180 eV), investigating the limits of use of pseudo wave functions for shallow-core states in many-body BSE calculations. It is clear that the description of deep core levels will be always out of reach for plane-wave basis methods. However, the high plane-wave cutoff required by semicore states can be now alleviated by the new generation of ultrasoft norm-conserving pseudopotentialsHamann (2013). Besides the promised lower computational cost for shallower core levels, an advantage of pseudopotential plane-wave calculations with respect to all-electron methods is that they do not make any hypothesis concerning the localisation of the core hole inside the muffin tin of the absorbing atom 111The same hypothesis is made when the core orbitals are obtained from a calculation of the isolated atomShirley (2004); Blöchl (1994); Unzog et al. (2022)..
In particular, here we investigate the effects of the electron-hole interactions on the optical absorption and shallow-core XANES spectra of alumina. -Al2O3 is a wide-gap insulator, with many possible applications as a structural ceramic (e.g. as a replacement to SiO2 gate oxide technology) and optical material (also thanks to the high-damage threshold for UV laser applications), and a prototypical system to investigate core-hole effects in XANES spectroscopyFrench (1990); French et al. (1994); Tanaka and Adachi (1996); Cabaret et al. (1996); Ildefonse et al. (1998); Mo and Ching (2000); van Bokhoven et al. (2001).
The article is organised as follows. After a short description of the employed methodology in Sec. II, comprising a review of the theoretical background (Sec. II.1) and a summary of the computational details (Sec. II.2), Sec. III presents the results of the calculations together with their analysis. In Sec. III.2 pseudopotential calculations are assessed with respect to all-electron benchmarks for both optical and Al L2,3 XANES spectra, while Sec. III.3 contains a discussion on the issue of the core-hole localisation in the muffin tin for the Al L1 XANES spectrum. Sec. III.4 compares the calculated spectra with available experiments and analyses the effects of the electron-hole interactions on the spectra. Finally, Sec. IV draws the conclusions summarizing the results of the work.
II Methodology
II.1 Theoretical background
In the framework of Green’s function theoryMartin et al. (2016), the Bethe-Salpeter equation (BSE) yields the density response function from the solution of a Dyson-like equation for the two-particle correlation functionStrinati (1988). In the GW approximation (GWA) to the self-energyHedin (1965), with a statically screened Coulomb interaction , the BSE takes the form of an excitonic HamiltonianOnida et al. (2002) in the basis of transitions between occupied and unoccupied bands (i.e., uncorrelated electron-hole pairs):
| (1) |
Here are the interband transition energies calculated in the GWA, while is the Coulomb interaction without its macroscopic component (i.e., the component in reciprocal space). The statically screened Coulomb interaction is usually calculated adopting the random-phase approximation (RPA) for the inverse dielectric function .
The GWA-BSE is nowadays the state-of-the-art approach for the simulation, interpretation and prediction of optical spectra in solidsAlbrecht et al. (1998); Benedict et al. (1998); Rohlfing and Louie (2000); Bechstedt (2014); Martin et al. (2016), and is more and more used also for the simulation of core-level excitation spectraVinson et al. (2011); Vinson and Rehr (2012); Gilmore et al. (2015, 2021); Geondzhian and Gilmore (2018); Dashwood et al. (2021); Vinson (2022); Olovsson et al. (2009a, b, 2011); Vorwerk et al. (2017, 2019, 2020); Laskowski and Blaha (2010); Yao et al. (2022); de Groot et al. (2021); Vorwerk et al. (2022); Unzog et al. (2022). A great advantage of theory with respect to experiments is the possibility to separately suppress (or activate) the various interactions at play in the materials, which allows one to single out their specific effect on the spectra and the materials properties. By setting to zero the two electron-hole interactions, and , the excitonic Hamiltonian (1) reduces to a diagonal matrix and corresponds to the independent-particle approximation (IPA). By switching on the electron-hole exchange interaction in Eq. (1), one retrieves the RPA. With respect to the IPA, the RPA includes the so-called crystal local field effectsAdler (1962); Wiser (1963). They are related to the inhomogeneous charge response of materials through the induced microscopic Hartree potentials counteracting the external perturbations. Finally, by also switching on the electron-hole direct interaction , the full BSE (1) describes excitonic effects, which are due to the electron-hole attraction222There is also the possibility to include and exclude , which corresponds to the description of triplet excitations.. The electron-hole interactions contributing to the off-diagonal matrix elements of the BSE (1) give rise to a mixing of the independent-particle transitions, which is formally obtained from the solution of the eigenvalue equation for the excitonic hamiltonian: .
The absorption spectra, expressed both in the optical and XANES regimes by the imaginary part of the macroscopic dielectric function in the long wavelength limit , in the so-called Tamm-Dancoff approximation can be directly written in terms of eigenvectors and eigenvalues of the BSE Hamiltonian (1) as:
| (2) |
where is the crystal volume, and
| (3) |
are the independent-particle oscillator strengths. Here the single-particle orbitals are usually Kohn-Sham orbitals. If the exciton energy is smaller than the smallest independent-particle transition energy , the exciton is said to be bound: the difference between and is its binding energy.
The contribution of each exciton to the spectrum can be analysed by introducing the cumulative function:
| (4) |
Since the eigenvectors and the oscillator strengths are both complex quantities, the cumulative function (4) is not a monotonic function of . The limit is the oscillator strength of the exciton in the absorption spectrum. If it is negligibly small, the exciton is said to be dark, otherwise it is called a bright exciton, for it contributes to the spectrum. Even in the limit, the oscillator strengths depends on the direction of , so each exciton can at the same time be a bright exciton in one polarization direction and dark in another.
Finally, the investigation of the electron-hole correlation function for each exciton ,
| (5) |
gives information about the localisation in real space of the electron-hole pair, which results from the electron-hole attraction. Assuming that the hole is in a specific position , one can visualize the corresponding density distribution of the electron .
II.2 Computational details
We have performed calculations using both a pseudopotential (PP) plane-wave method and a full-potential all-electron (AE) linearized augmented plane-wave method. AE calculations have been done in particular to assess the validity of PP calculations for the core-level excitations (see Sec. III.2). The converged BSE absorption spectra and their analysis (see Sec. III.4) have been then obtained in the PP framework. In the pseudopotential case, we have used the Abinit codeGonze et al. (2016) for the ground-state and screening calculations, and the EXC codeReining et al. for the BSE calculations. In the all-electron case, we have used the Exciting codeGulans et al. (2014) for obtaining all the benchmark results.
The Kohn-Sham ground-state calculations have been performed within the local density approximationKohn and Sham (1965) (LDA).
We have employed norm-conserving Troullier-Martins Troullier and Martins (1991) (TM) and optimized norm-conserving Vanderbilt Hamann (2013); van Setten et al. (2018) (ONCVPSP) pseudopotentials. In particular, for the absorption spectra a special TM pseudopotentialZhou et al. (2020) treating also Al and states as valence electrons has been used. Calculation with the ONCVPSP pseudopotential converged with 42 Hartree cutoff of the plane-wave expansion, while the hard TM pseudopotential required 320 Hartree.
The statically screened Coulomb interaction has been obtained (within the RPA) with the ONCVPSP pseudopotential (without Al and core levels), including 100 bands, and with a cutoff of 8 and 14.7 Hartree for the Kohn-Sham wave functions for the optical and shallow-core excitations, respectively. The size of the screening matrix in the plane-wave basis was 6 Hartree for the optical and 8 Hartree for the core spectrum. We have verified that, contrary to calculations of the screened interaction for other materials like siliconLuppi et al. (2008) or simple metalsSturm et al. (1990); Quong and Eguiluz (1993); Zhou et al. (2018), the effect of core polarization is negligible in -Al2O3.
For the all-electron results, the ground-state calculations were performed using a plane wave cutoff, , of 18 Hartree and muffin-tin (MT) spheres of 2 bohr and 1.45 bohr for aluminum and oxygen, respectively. The RPA screening was obtained with 100 conduction bands and a cutoff in the matrix size of 5 Hartree (maintaining the same cutoff of the ground state for the plane waves).
The GW band structure has been approximated within a scissor correction model. The LDA conduction bands have been rigidly shifted upwards by 2.64 eV, which corresponds to the band gap correction obtained within the perturbative G0W0 scheme by Marinopoulos and GrüningMarinopoulos and Grüning (2011).
The BSE calculations for the absorption spectra have been performed with shifted -point grids (i.e., not containing high-symmetry points), which allowed for a quicker convergence of the spectraBenedict et al. (1998). The optical absorption spectrum converged with a 101010 -point grid, while the XANES spectra at the Al L2,3 and L1 edges converged with a 888 -point grid. The exciton analysis and plot have been instead done with a smaller -centered 444 -point grid.
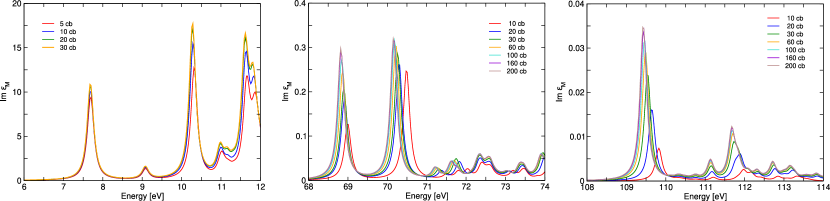
The BSE spectra for the optical spectrum or the XANES spectra at the Al L2,3 and L1 edges had a different convergence rate with respect to the number of empty bands considered in the BSE hamiltonian. Fig. 1 shows their convergence study (carried out here with a reduced number of points in a -centered 222 -point grid). While the optical spectrum (left panel) quickly converges with the number of empty bands, the XANES spectra (middle and right panels) require many more empty bands, also to converge the lowest energy peak. In the converged spectra, obtained with many more points, this slow convergence is partially attenuated by the fact that the spectra become smoother. The optical absorption spectra have been thus obtained with 12 valence bands and 12 unoccupied bands. The XANES spectra at the L2,3 and L1 edges included all the corresponding core levels together with 30 unoccupied bands. A 0.1 eV Lorentzian broadening has been applied to the spectra.
In the all-electron BSE calculations, we considered the same parameters used in the calculation of the screening: 9 Hartree for the wavefunction cutoff and 5 Hartree to describe the electron-hole interactions. In the pseudopotential BSE calculations, we have used a cutoff of 30 Hartree (110 Hartree) for the Kohn-Sham wavefunctions expansion in the optical (semi-core) spectra, and 7.3 Hartree for the plane-wave representation of the electron-hole interactions. We note that, as usual (see e.g.Lorin et al. (2021)), the plane-wave cutoffs for the BSE matrixelements can be significantly reduced with respect to the high cutoff needed for the ground-state calculation. Therefore, even for pseudopotential BSE calculations of shallow-core excitations, the limiting factor remains the large size of the BSE hamiltonian (1) in extended systems, which is given by the number of electron-hole transitions (i.e., the number of occupied bands the number of unoccupied bands the number of points in the full Brillouin zone).
III Results
III.1 Crystal and electronic structure of -Al2O3
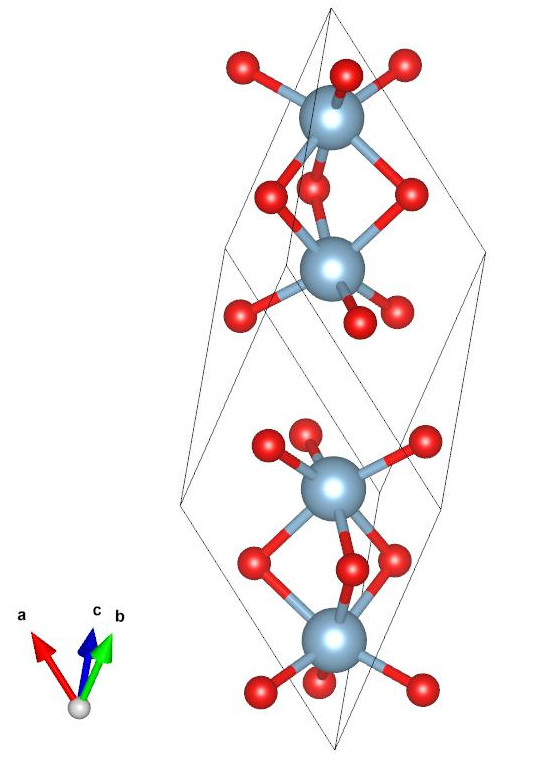
The crystal structure of corundum -Al2O3 is trigonal (see Fig. 2). In the primitive rhombohedral unit cell (space group Rc, number 167) there are two formula units. The corundum structure can also be viewed as a hexagonal cell containing six formula units with alternate layers of Al and O atoms in planes perpendicular to the hexagonal axis. In the -Al2O3 structure all Al atoms occupy octahedral sites coordinated with 6 O atoms, which form two equilateral triangles located respectively slightly above and below each Al atom along the direction.
We adopted the experimental lattice parameters from Ref. Newnham and Haan (1962): = 4.7589 Å and = 12.991 Å in the hexagonal unit cell, which corresponds to = 5.128 Å and in the rhombohedral primitive cell. In the reference frame used in the simulations, the hexagonal axis is aligned along the cartesian axis, which is the vertical direction in Fig. 2.
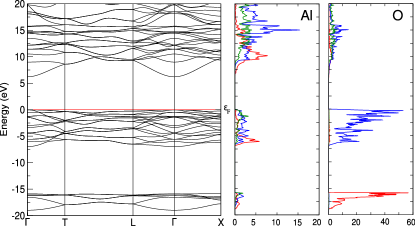
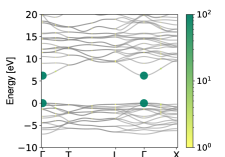
The left panel of Fig. 3 shows the Kohn-Sham LDA band structure along a high symmetry path in the first Brillouin zone, together with the projected density of states on the Al (middle panel) and O (right panel) atoms. -Al2O3 has a direct bandgap at the point, which amounts to 6.21 eV in the LDA. This value is in very good agreement with the result of Ref. Mackrodt et al., 2019 obtained with the same experimental lattice parameters. CalculationsAhuja et al. (2004); Marinopoulos and Grüning (2011); Santos et al. (2015); Mackrodt et al. (2019) that adopt a crystal structure optimised within the LDA, rather than the experimental one, instead obtain larger band gaps. In particular, the difference with respect to Ref. Marinopoulos and Grüning, 2011 is 0.51 eV. We refer to Ref. Santos et al., 2015 for a detailed analysis of the dependence on the band gap on the lattice parameters. As usual, the Kohn-Sham band gap underestimates the experimental fundamental gap, estimated to be 9.57 eV from temperature-dependent vacuum ultraviolet (VUV) spectroscopyFrench et al. (1994) and 9.6 eV from conductivity measurementsWill et al. (1992).
The 6 bands located between -19 eV and -15.9 eV are the O states, while the upper 18 valence bands, starting at -7 eV, are mostly due to O states, partially hybridised with Al states. The valence bands are quite flat along the entire path. The bottom conduction band consists of Al hybridised with O at the point and also with O elsewhere, showing a strong dispersion around the point. The higher conduction bands have mainly Al and character, also hybridised with O states. This overview of the electronic properties confirms the intermediate covalent-ionic nature of the chemical bond in -Al2O3.
Finally, the Al and core levels (not shown in Fig. 3) in LDA are located 61.7 eV and 99.4 eV below the top valence, which, as usual, largely underestimates the experimental valuesCrist (2004) of 70.7 eV and 115.6 eV, respectively. The calculations do not include the spin-orbit coupling, so the and levels are not split. In all cases, we have verified that pseudopotential and all-electron calculations give the same band structures and core-level energies.
III.2 All-electron benchmark at the Al L2,3 edge
One of the main goals of this work is to demonstrate that shallow-core spectra can be calculated with high accuracy also using the pseudopotential approximation. Even when reliable pseudopotentials provide accurate results in ground-state DFT calculations for the charge density or the total energy, or in GW calculations for quasiparticle excitations, the question whether they also give accurate XANES spectra should be examined carefully. In DFT or GW calculations, the quantities of interest result from many integrals where the details of the single matrix elements are not crucial. Instead, optical absorption and XANES spectra additionally reflect directly the quality of the individual dipole matrix elements in Eq. (3), which is a much more stringent requirement. In the XANES regime, indeed, excitation energies are substantially higher than those found in optical spectra, which implies that the matrix elements involve regions of space closer to the ionic cores. In a norm-conserving pseudopotential approach, the true shallow core wavefunction is replaced by a pseudo-wavefunction. While their norms are identical, the true wavefunction and the pseudo-wavefunction are different for distances to the ionic cores that are smaller than the cutoff radii. Therefore, as a consequence of the pseudization of the wavefunctions, the dipole matrix elements (3) for the XANES spectra could be inaccurate in a pseudopotential scheme, even for accurate pseudopotentials that are reliable for DFT and GW calculations (such as the ones used in the present work). The limits of the accuracy of pseudopotentials for XANES spectra of shallow core levels, to the best of our knowledge, have not been explored so far.
We used full-potential all-electron calculations, considered as the gold-standard computational method Puschnig and Ambrosch-Draxl (2002); Gulans et al. (2014), to benchmark the optical and core spectra calculated with PPs. In order to perform this comparison properly, for both optical absorption and Al L2,3 edge XANES spectra, the same choice has been made for the occupied states included explicitly in the two calculations, and the resulting spectra were converged consistently in the two cases (see Sec. II.2).
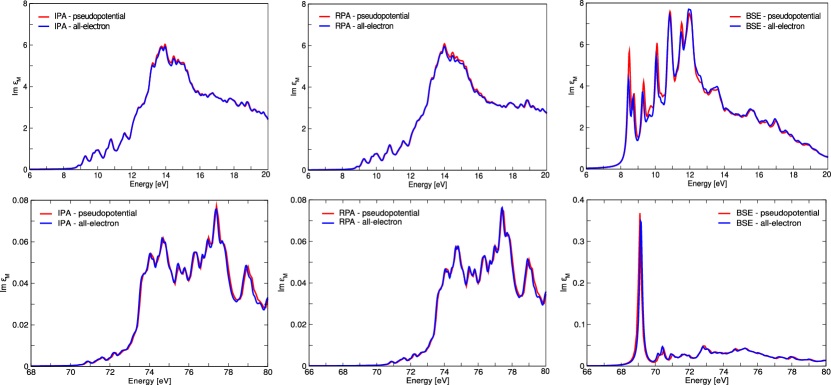
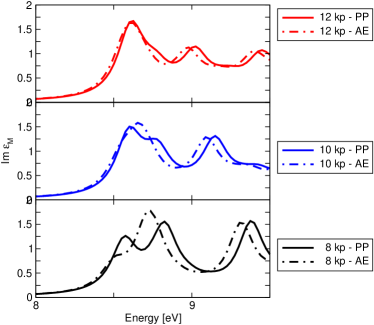
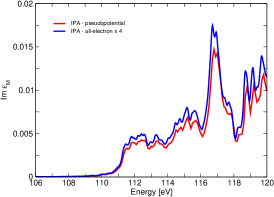
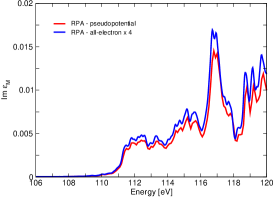
The valence and L2,3 spectra obtained at different levels of approximations, IPA, RPA and BSE, are shown in the top and bottom panels of Fig. 4, respectively. We can make several observations for both optical absorption and XANES spectra: i) The results of the left panels of Fig. 4 show that the pseudopotential approximation reproduces the all-electron spectra with excellent accuracy within the IPA. ii) For the RPA spectra (central panels) we find a similar result. This is in part related to the fact that local fields effects are not important in the energy ranges considered here. iii) Finally, also the full BSE calculations (right panels) with the two approaches are in very good agreement. To have an idea of what can be expected, we note that a recent comparison between different BSE calculations of XAS spectra presented larger discrepanciesUnzog et al. (2022). The origin of the residual difference between the BSE spectra in Fig. 4 lies in the different treatment between the two codes of the integrable singularity of the diagonal matrix elements of electron-hole attraction in Eq. (1), calculated in reciprocal space, when and the reciprocal-lattice vectors are . We note that the different treatment of this singularity has been recently identified as the origin of numerically different results also in a comparison among different codes for GW quasiparticle calculations Rangel et al. (2020). This singularity is, in fact, eliminated in the BSE by evaluating the integral
where . In order to carry out, numerically or analytically, this integral, one has to define the shape for the little volume around the origin of the Brillouin zone and, in anisotropic materials, choose the direction in order to evaluate the inverse dielectric function . The different details about how this integral is performed can be found in Ref.Albrecht (1999) and Refs. Puschnig (2002), for EXC and Exciting, respectively. If we exclude this singular contribution, the two BSE results become superimposed, as in the IPA case. In addition, this contribution vanishes (more or less rapidly according to the kind of excitonFuchs et al. (2008); Gorelov et al. (2022)) in the convergency with points. Fig. 5 indeed shows that the differences in the spectra obtained with the two codes tend to vanish with increasing number of points.
Most importantly for the scope of the present work, for this detailed comparison we find that the differences between the PP and AE codes remain always of the same order of magnitude for both valence and shallow-core spectra. Therefore, in summary, we can safely conclude that the benchmarks with respect to the all-electron approach show that pseudopotential calculations for optical and XANES spectroscopies for semicore states are reliable and accurate.
III.3 Interference effects at the Al L1 edge

The comparison between all-electron and pseudopotential calculations is more delicate for the Al L1 edge, since in this case the semicore electrons are treated differently by the two codes. While Exciting considers the Al states as core states, entirely contained inside the muffin tin, in EXC they are treated in the same manner as the valence electrons. Moreover, Exciting fixes the core hole at a single specific atomic site, whereas EXC treats all the atomic sites on equal footing.
One of the limitations of the linearized augmented-plane-wave (LAPW) method is that it could give a wrong description of semicore states when they are considered to be contained only inside the muffin-tin (MT) sphere, but they actually overlap significantly with valence electrons or are too extended to be entirely contained inside the MT Goedecker (1993); Gulans et al. (2014). In order to overcome this problem, local orbitals are included to complement the basis. However, the quality of this basis set depends on the choice of energy parameters Singh (1991); Gulans et al. (2014). In addition, interference effects between different atomic sites could play an important role, but they would not be straightforwardly taken into account when considering the core states only inside a single muffin-tin Vorwerk et al. (2022). For all these reasons, since we have already validated the pseudopotential approach for the Al L2,3 edge spectra, we can now conversely use EXC to benchmark the Al L1 edge spectra obtained with Exciting.
The L1 edge absorption spectra calculated using different levels of approximations are shown in Fig. 6. Notice that in EXC all the 4 bands corresponding to the 2s state of the 4 Al atoms need to be included in the calculations in order to properly represent the electronic transitions, while in Exciting only one occupied level is considered: the state of the Al atom where the core hole is sitting. For a quantitative comparison between the two approaches, since there are 4 equivalent Al atoms in the unit cell, the spectrum obtained with Exciting has been multiplied by 4.
In all level of approximations, the pseudopotential and all-electron spectra differ slightly (and more than in the optical or L2,3 edge cases), showing that interference effects among the Al atoms come to play. These interferences are quite small in -Al2O3, also because the Al atoms lie at equivalent positions in the unit cell, but they are in any case clearly detectable in the comparison in Fig. 6. It has been shown that these effects can be even more significant in other materials Vorwerk et al. (2022). While including these effects is still possible with Exciting (and with all approaches that fix the core hole in a specific position) by doing multiple calculations and generalizing Eq. (2), as described in detail in Ref. Vorwerk et al., 2022, interferences are naturally taken into account by pseudopotential approaches, where all atoms are treated on the same footing and only a single calculation is needed.
III.4 Optical and XANES spectra: valence and shallow-core excitations
III.4.1 Comparison with experiments
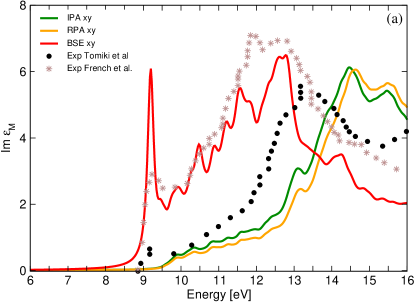
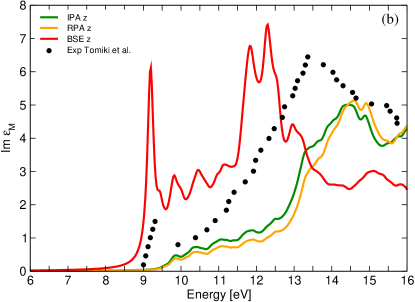
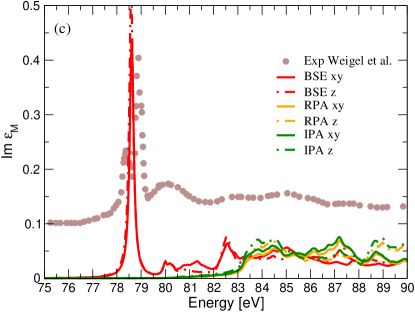
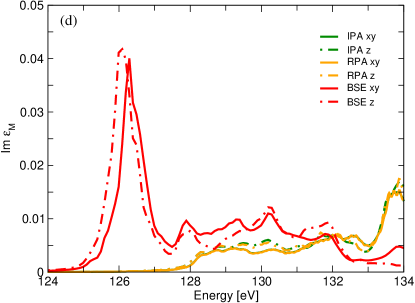
Fig. 7 compares the calculated absorption spectra with experiment, for both the optical absorption corresponding to valence excitations and the XANES spectrum of the shallow-core excitations at the Al L2,3 edge. The same figure also displays the results of the calculations at the Al L1 edge, where, to best of our knowledge, no experimental XANES spectra are available for -Al2O3, since this core level excitation is less commonly studied than the Al K edgeCabaret et al. (1996); Ildefonse et al. (1998); van Bokhoven et al. (1999); Mizoguchi et al. (2009). In all cases, the presence of sharp and pronounced peaks at the onset of the BSE spectra (red lines), which are absent in the RPA and IPA spectra (orange and green lines), is an evidence of strong excitonic effects. Taking into account the electron-hole attraction in the BSE is the key to bring the calculations in agreement with experiment.
As already discussed in Ref. Marinopoulos and Grüning, 2011, for the optical absorption in the polarization direction perpendicular to the axis (i.e. in the plane), where two VUV spectroscopy experiments Tomiki et al. (1993); French et al. (1998) are available, there are large discrepancies between the experimental spectra themselves [see Fig. 7(a)]. They agree on the position of the absorption onset and the presence of a sharp peak at 9.2 eV, while they largely differ in the intensities of the various spectral features. Those differences can be attributed to the fact that both absorption spectra have been obtained from measured reflectivity data using the Kramers-Kroning relations, which introduces uncertainties in the spectra. The calculated optical spectra in Fig. 7(a)-(b) have been blueshifted by 0.7 eV. This underestimation of the onset of the absorption spectrum is a manifestation of the underestimation of the band gap by the perturbative G0W0 approach, which is a systematic error for large gap materialsvan Schilfgaarde et al. (2006b). As a matter of fact, the 2.64 eV scissor correction that we have employed here, which is taken from the G0W0 calculation in Ref. Marinopoulos and Grüning, 2011, underestimates the band gap correction to the LDA. The BSE calculation in Ref. Marinopoulos and Grüning, 2011 is also in very good agreement with the present result: the difference in the peak positions is actually due to the LDA band gap difference (see Sec. III.1). The BSE spectrum in the polarization reproduces well the spectral shape measured by French et al.French et al. (1998), while there are larger differences with the experimental spectra in both polarizations measured by Tomiki et al.Tomiki et al. (1993).
At the Al L2,3 edge, see Fig. 7(c), the calculated spectra have been blueshifted by 9.75 eV, which matches well the needed correction to the LDA Al core level energy (see Sec. III.1). The calculations neglect the spin-orbit coupling and therefore miss the splitting of the main peak into a doublet separated by 0.47 eV in the high-resolution experimental XANES spectrum from Ref. Weigel et al., 2008 (which also agrees well with previous experiments O’Brien et al. (1991, 1993); Tomiki et al. (1993)). In the spectra, the first, most prominent, excitonic peak is followed by a series of lower intensity peaks. While the absolute intensity of the experimental spectrum is arbitrary, the relative intensity of the first and second peaks gives information about the coordination number of Al and the nature of the chemical bond: a lower symmetry enhances the intensity of the second peak. Moreover, a lower coordination shifts the edge to lower energies, while higher bond ionicity shifts the edge to higher energies van Bokhoven et al. (2001); Weigel et al. (2008).
At the Al L1 edge there is no available experiment. Therefore, the curves in Fig. 7(d) have been shifted by 19.5 eV, in order for the smallest independent-particle transition energy, from the Al band to the bottom-conduction band, to match the experimental value of 125.2 eV, which corresponds to the sum of the fundamental band gap plus the binding energy of the Al states French et al. (1994); Crist (2004) (see Sec. III.1). We find that the main prominent excitonic peak in the BSE spectra is preceded by a pre-edge structure, more evident in the direction (solid lines). At the Al K edge, which mainly probes the analogous transition, there has been much work to explain the origin of a similar prepeak structureCabaret et al. (1996); Mo and Ching (2000); Cabaret et al. (2005); Cabaret and Brouder (2009); Brouder et al. (2010); Manuel et al. (2012); Nemausat et al. (2016); Delhommaye et al. (2021), which has been finally interpreted in terms of atomic vibrations enabling monopole transitions to unoccupied Al states. In the present case, the calculations do not take into account the coupling with atomic vibrations and nevertheless the BSE spectra show a prepeak structure. This finding therefore calls for a detailed comparison with other calculations including atomic vibrations and, possibly, experiments at the Al L1 edge.
III.4.2 Anisotropy and local field effects
The -Al2O3 crystal is optically uniaxial. As shown by Fig. 7(a)-(b), at the onset of the optical spectrum the anisotropy is rather small, while it becomes larger for higher energy features. The lowest energy exciton is visible along the polarization, while it is dark in the perpendicular polarization. It is separated by 25 meV from a pair of degenerate excitons that are visible in the perpendicular direction and, conversely, dark in the direction. Tomiki et al.Tomiki et al. (1993) experimentally determined a similar splitting of the exciton peaks in the two polarization directions (35 meV at room temperature and 86 meV at 10 K). We find that the binding energy of these excitons is of order of 0.3 eV, which is more than twice the 0.13 eV value estimated from temperature-dependent VUV spectroscopyFrench et al. (1994). A similar splitting of the lowest energy exciton occurs also at the L2,3 edgeTomiki et al. (1993), where its binding energy largely increases up to 1.6 eV. For the optical and the L2,3 cases, both the lowest energy exciton in the BSE spectrum and the excitation at the smallest independent-particle transition energy in the IPA spectrum have a significant oscillator strength. Instead, at the L1 edge the lowest energy transitions have a character and are dipole forbidden. We find that the binding energy of the lowest dark exciton at the L1 edge is 1.2 eV. The lowest bright excitons in the and polarization directions are located 1.6 eV and 1.8 eV above it, respectively. They belong to the prepeak in the spectrum. In this case, we define their binding energy as the difference with respect to the corresponding first allowed transition in the IPA spectrum: it amounts to 0.6 eV. The splitting of the main exciton peak in the two polarizations is also the largest one at the L1 edge, being more than 0.2 eV.
By comparing the RPA and IPA optical spectra, orange and green lines in Fig. 7(a)-(b), respectively, we note that the effect of crystal local fields is quite small for both polarizations, in contrast to typical layered van der Waals materials like graphite, where local field effects are strong for the polarization along the hexagonal axisMarinopoulos et al. (2002). Marinopoulos and GrüningMarinopoulos and Grüning (2011) also found that local field effects are not essential to describe satisfactorily the low energy part of the experimental spectra, whereas they become crucial for higher energies (above 16 eV, not shown in Fig. 7), in correspondence to the excitation of the more localised O electrons. Indeed, the degree of electron localisation directly correlates with the degree of charge inhomogeneity, which is a key factor for the induced microscopic local fields. One may therefore expect that the excitation spectra of shallow-core levels, which are even more localised, should be more affected by local field effects. This phenomenon has been in fact observed for many shallow-core levelsVast et al. (2002); Dash et al. (2007); Huotari et al. (2010); Cudazzo et al. (2014); Ruotsalainen et al. (2021). However, in -Al2O3 for both the L2,3 and L1 edges the comparison of the absorption spectra calculated within the RPA and in the IPA shows that local field effects are actually negligible333It is well known that local field effects, expressed as electron-hole exchange interaction in the BSE framework, are essential to get the correct branching ratios between L2 and L3 components, see e.g. Gilmore et al. (2015); Vinson and Rehr (2012); Ankudinov et al. (2005). However, in the present case the neglect of spin-orbit coupling does not allow us to resolve the two components. For -Al2O3 an electron–hole exchange energy of 0.3 eV has been estimated Weigel et al. (2008); O’Brien et al. (1991). (even weaker than in the optical regime). We can understand this result by noticing that the intensity of the L2,3 and L1 absorption spectra is one or two orders of magnitude smaller than for the optical absorption. This large intensity difference reflects the fact that Al and states are much less polarizable than valence states. Therefore, even though their electronic charge is much more localized and inhomogeneous, local fields associated to the excitations of Al and are small because they are weakly polarizable, which also leads to weak induced potentials.
III.4.3 Analysis of excitonic effects
Excitonic effects in solids can be understood as the result of the mixing of the independent-particle, vertical interband transitions at various points in the Brillouin zone, which are weighted by the excitonic coefficients , i.e., the eigenvectors of the excitonic Hamiltonian (1). The analysis of the excitonic coefficients therefore directly informs on the character of the exciton.
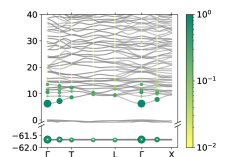
Fig. 8 represents, projected on the LDA band structure, the partial contributions to the oscillator strength of the lowest energy bright excitons in the absorption spectra of Fig. 7.
Each independent-particle transition is represented by a pair of circles, one in the occupied band and one in the unoccupied band , whose size is proportional to the value of the contribution. For the optical spectrum (left panel of Fig. 8), we consider the exciton giving rise to the first peak in the absorption spectrum in the polarization. Our analysis shows that the largest contribution stems from the top-valence bottom-conduction transition at the point, in correspondence to the direct band gap. The next points along the LX line in the conduction band give a contribution that is already 10 times smaller. The others are even smaller. This is due to the fact that for this exciton the top-valence bottom-conduction transition at the point has the predominant coefficient , together with a large single-particle oscillator strength in the direction. Instead, the same is negligibly small in the or direction, explaining why the same exciton is dark in the plane.
For the L2,3 and L1 excitation spectra, all the points for the corresponding core levels are involved in the spectra, as one may expect from the fact that the core levels are not dispersive. Also for first exciton peak in the L2,3 XANES spectrum (middle panel of Fig. 8), the lowest conduction band at the point gives the largest contribution, having a large Al character (see Sec. 3). However, in this case the other points of the bottom conduction band and the higher conduction bands significantly contribute to the spectrum as well. This illustrate the deviation from a simple independent-particle picture of a Al atomic transition, since many transitions are mixed together to produce the excitonic peak at the onset of the L2,3 XANES spectrum.
For the L1 XANES spectrum (right panel of Fig. 8), we consider the first bright exciton in the polarization direction, which belongs to the prepeak in the spectrum in Fig. 7(d). Contrary to the other two cases, the bottom-conduction band at the point gives no contribution, consistently with the character of the transition, which is dipole forbidden. The largest contributions are instead given by the points along the T line of the bottom conduction band, which have character as well. Even in this case higher conduction bands contribute significantly to the intensity of the excitonic prepeak.
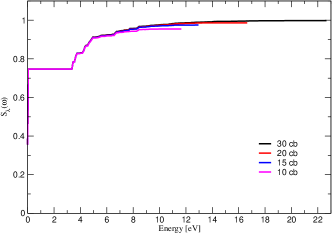
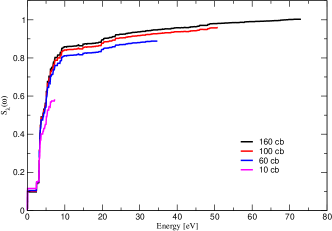
The plot in Fig. 9 of the cumulative sums , see Eq. (4), as a function of the number of conduction bands explains the different convergence behavior between the optical and XANES spectra shown in Fig. 1. By increasing the number of conduction bands in the BSE Hamiltonian (1), the largest possible independent-particle transition energy progressively increases. Therefore, the curves for larger numbers of conduction bands extend to higher energies. However, in the case of the optical spectrum (top panel), the cumulative sum rapidly converges to the final result. Already considering transition energies within 12 eV from the smallest one and including 15 conduction bands in the BSE hamiltonian give a result of the oscillator strength very close to 100%. Instead, in the case of the L2,3 edge (bottom panel), the range of transition energies needed to get close to 100% has to be much larger, of the order of 50 eV above the smallest transition energy. Moreover, the various curves in the bottom panel of Fig. 9 do not overlap, as it is the case for the optical spectrum in the upper panel. This behavior indicates that at the L2,3 edge interband transitions to higher conduction bands in the BSE hamiltonian mix together with transitions to lower conductions bands, which affects the behavior of the cumulative sum also at lower energies. The reason of this strong mixing is the fact that at the L2,3 edge there are many interband transitions with similar intensity. This, in turns, explains why the convergence of the XANES spectrum with the number of conduction bands is slow (see Fig. 1), and requires extra care.
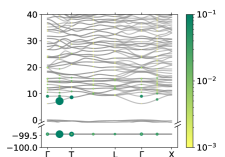
The lowest-energy dark excitons, both in the optical spectrum and the L2,3 edge, have a cumulative sum that is always close to zero. It means that all the independent-particle oscillator strengths are always small, indicating dipole forbidden transitions. The situation is instead different for the lowest dark exciton at the L1 edge. In this case, some transitions to the lowest conduction bands have a weak but not zero contribution to the spectrum, as shown by their representation on the LDA band structure in the top panel of Fig. 10. The corresponding cumulative sum , bottom panel of Fig. 10, is indeed not always zero: it has even two distinct peaks, before progressively decreasing to zero, giving rise to a dark exciton. This suggests the occurrence of destructive interference of contributions of different sign, involving transitions over a large range of energy. Moreover, it also shows that including not enough conduction bands in the BSE hamiltonian (1) would produce a weak excitonic peak in the spectrum. It is another indication that an independent-particle picture is here inadequate, whereas the strong electron-hole interaction manifest itself as the (positive or negative) interference of many electron-hole pairs.
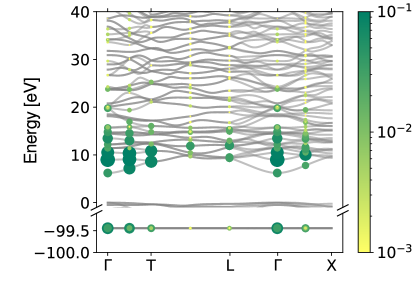
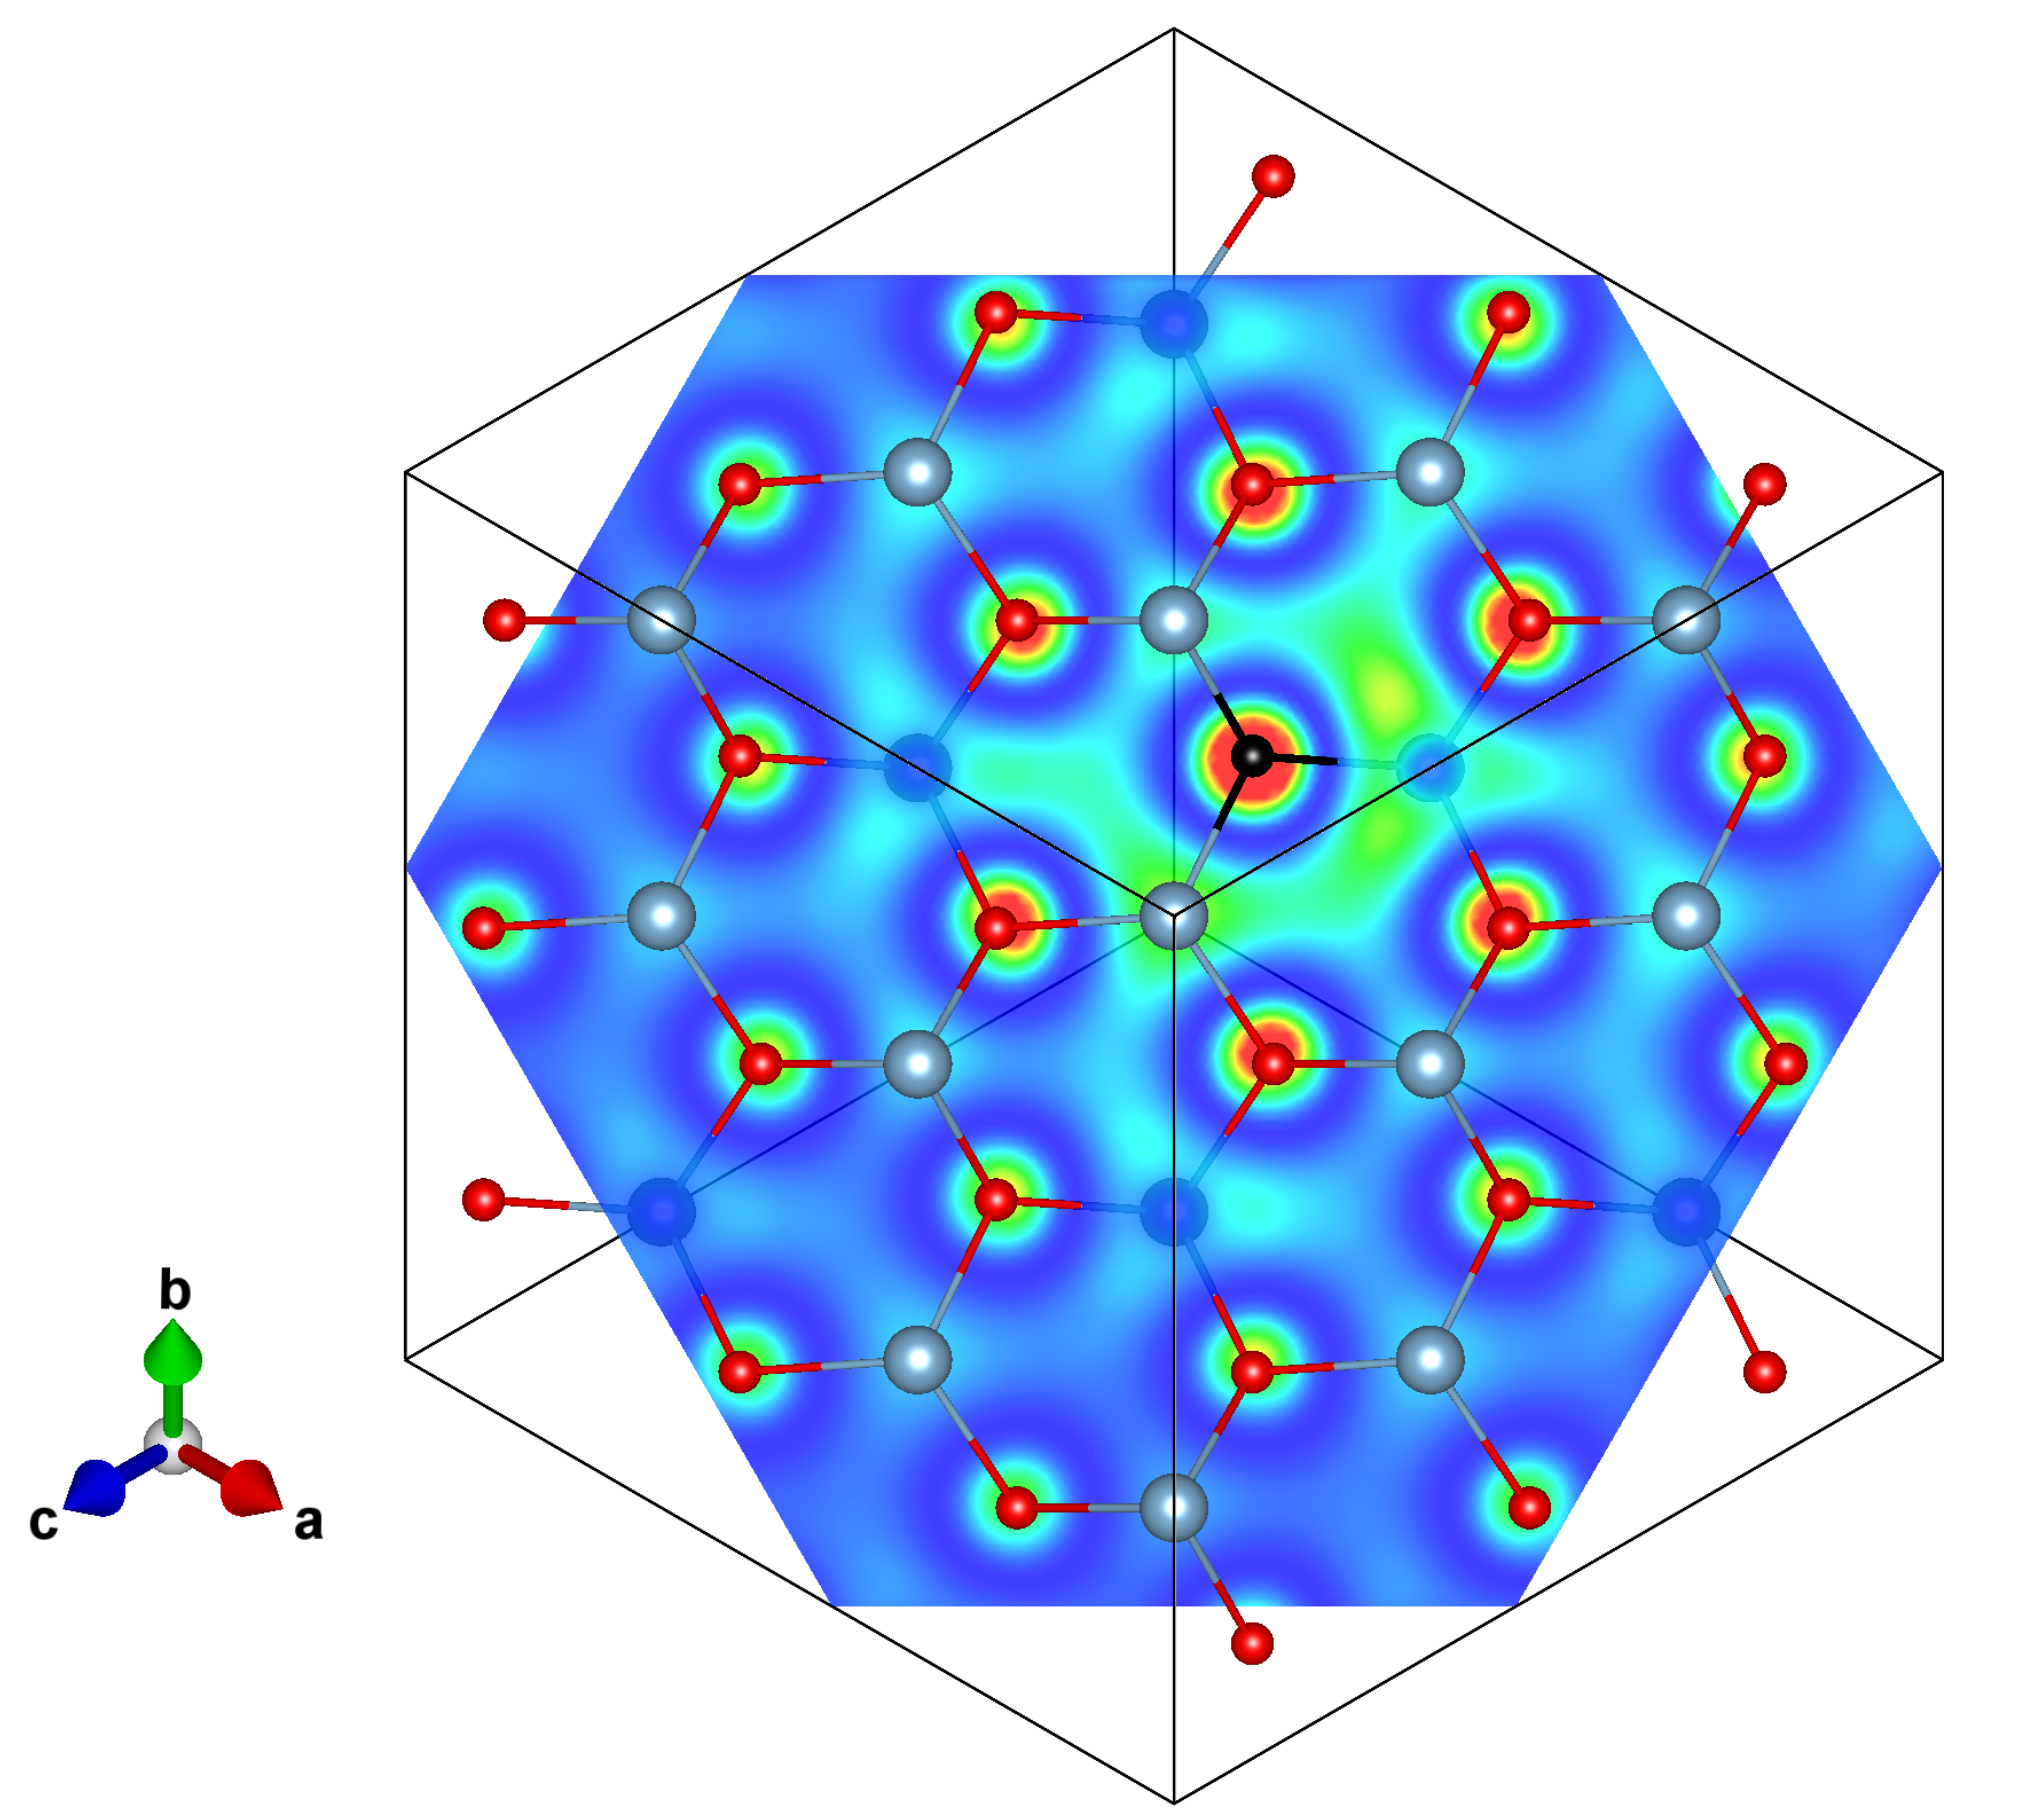
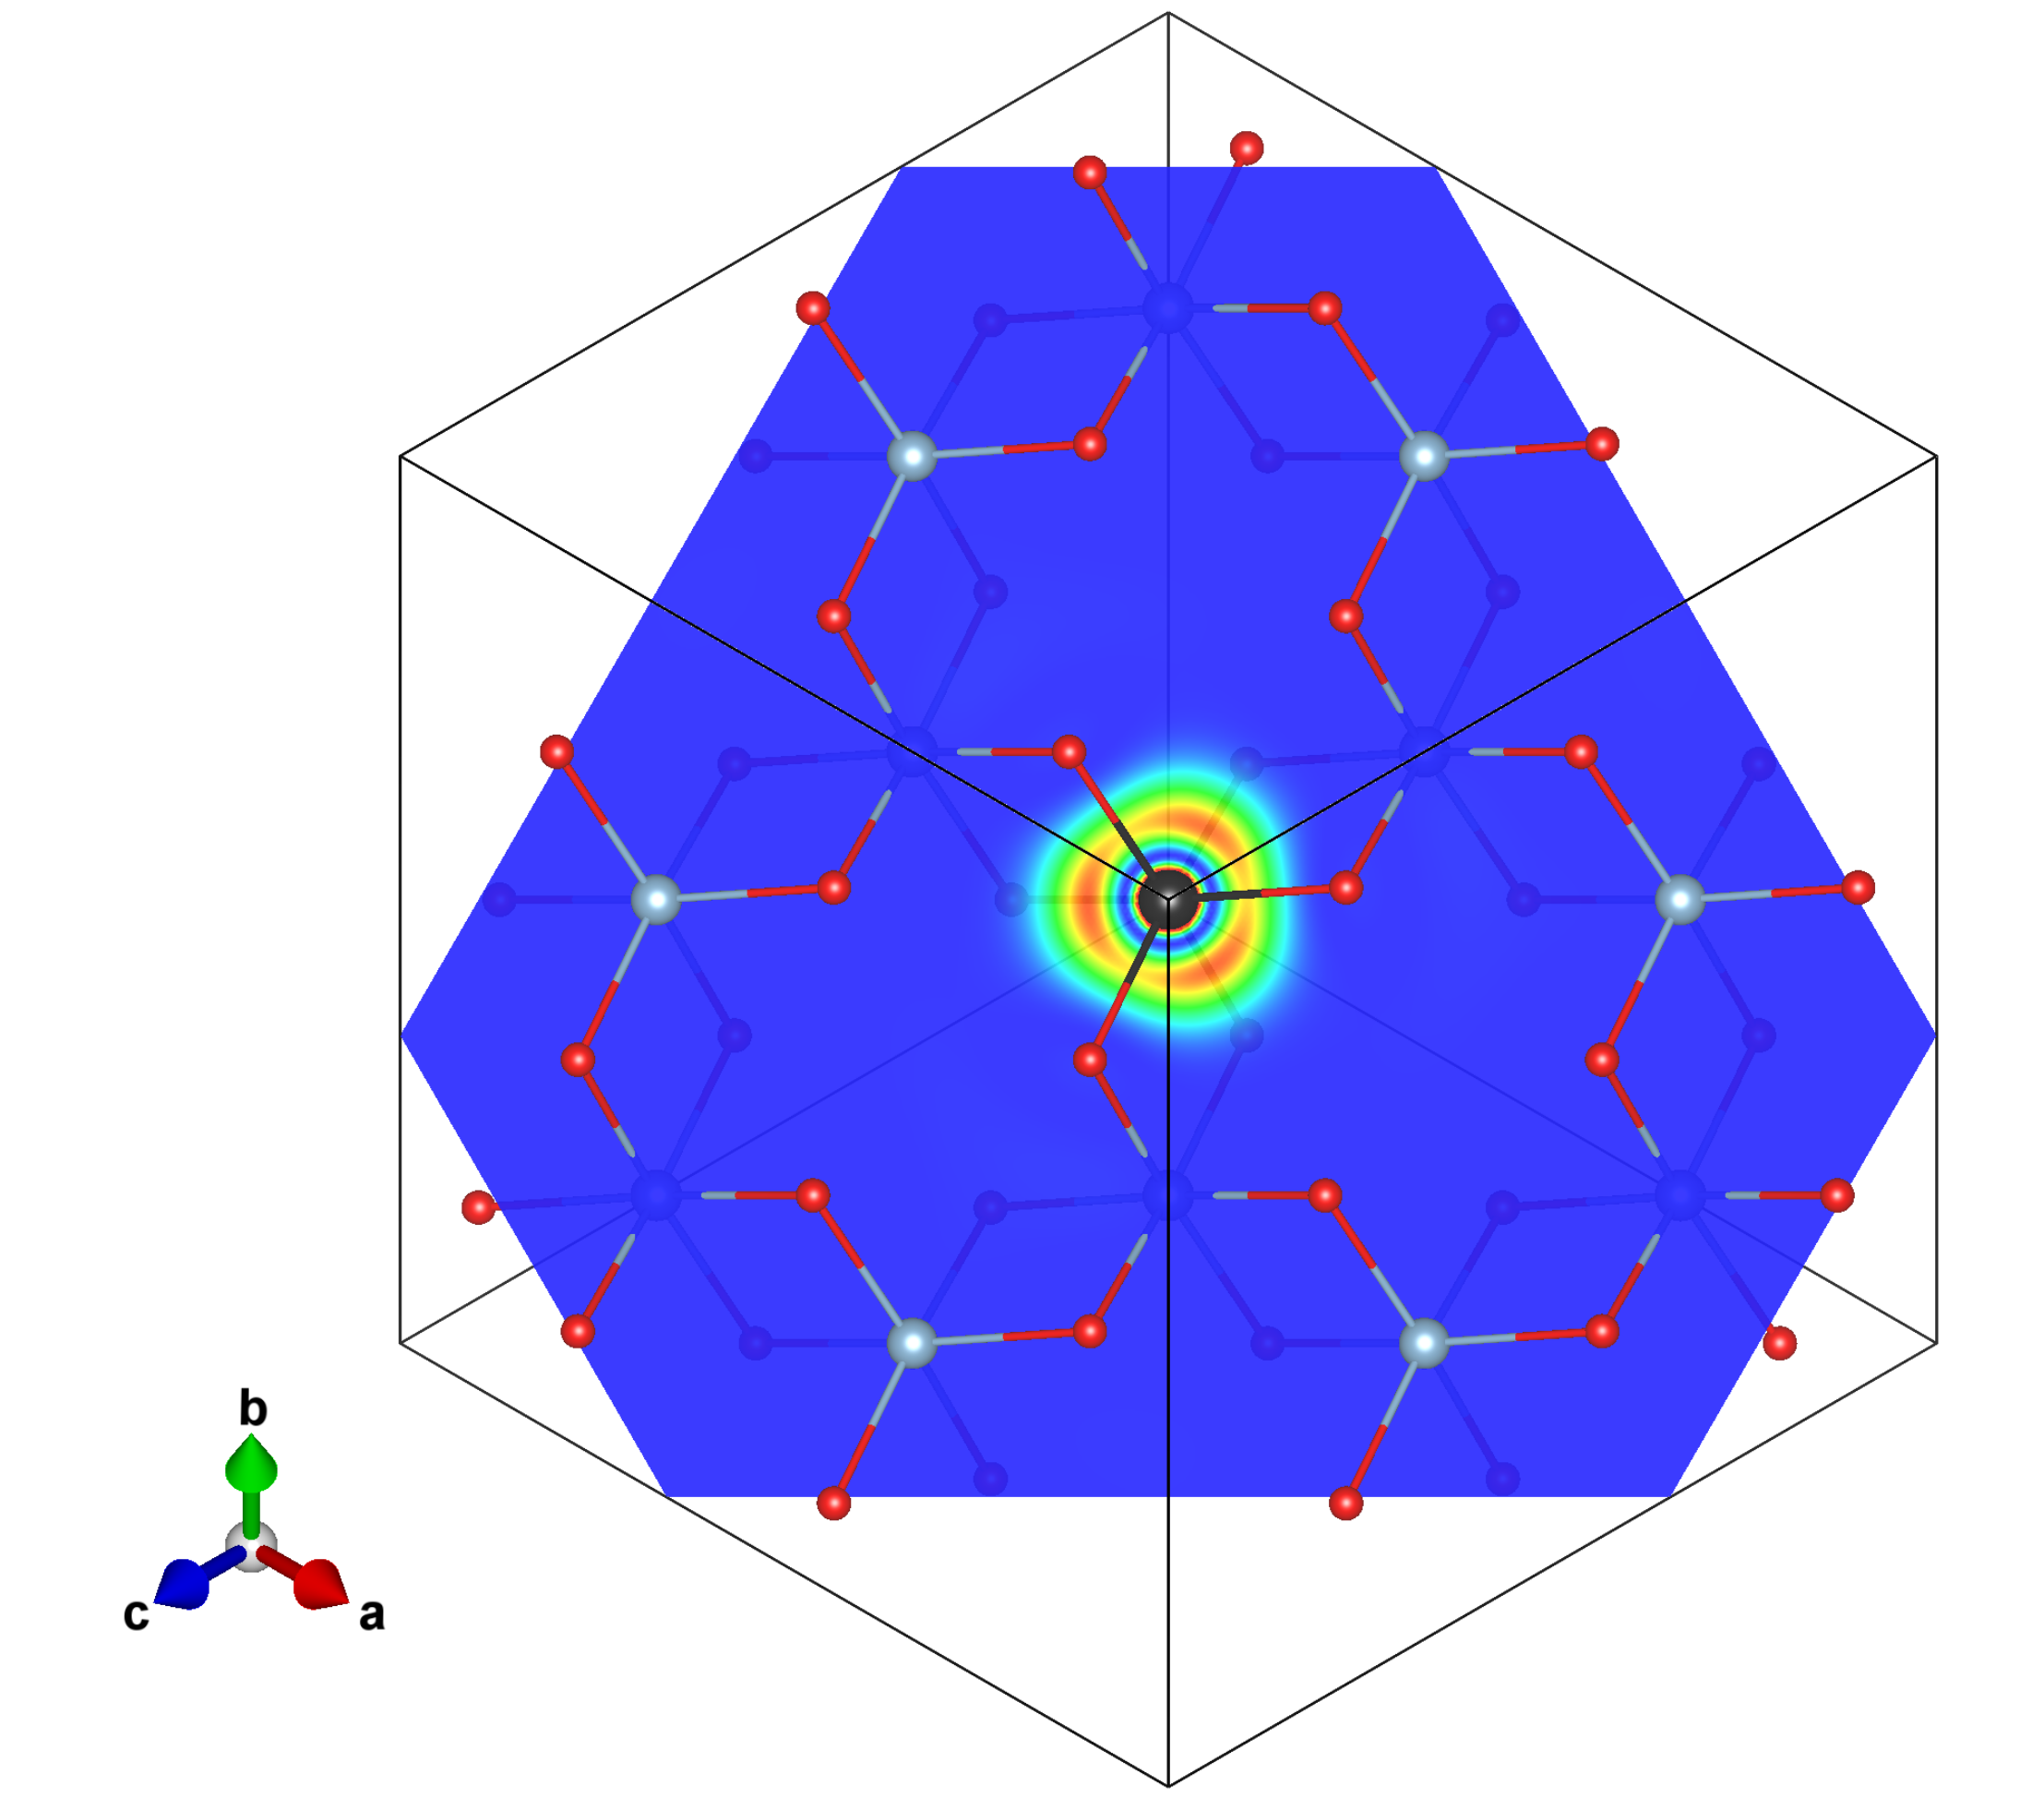
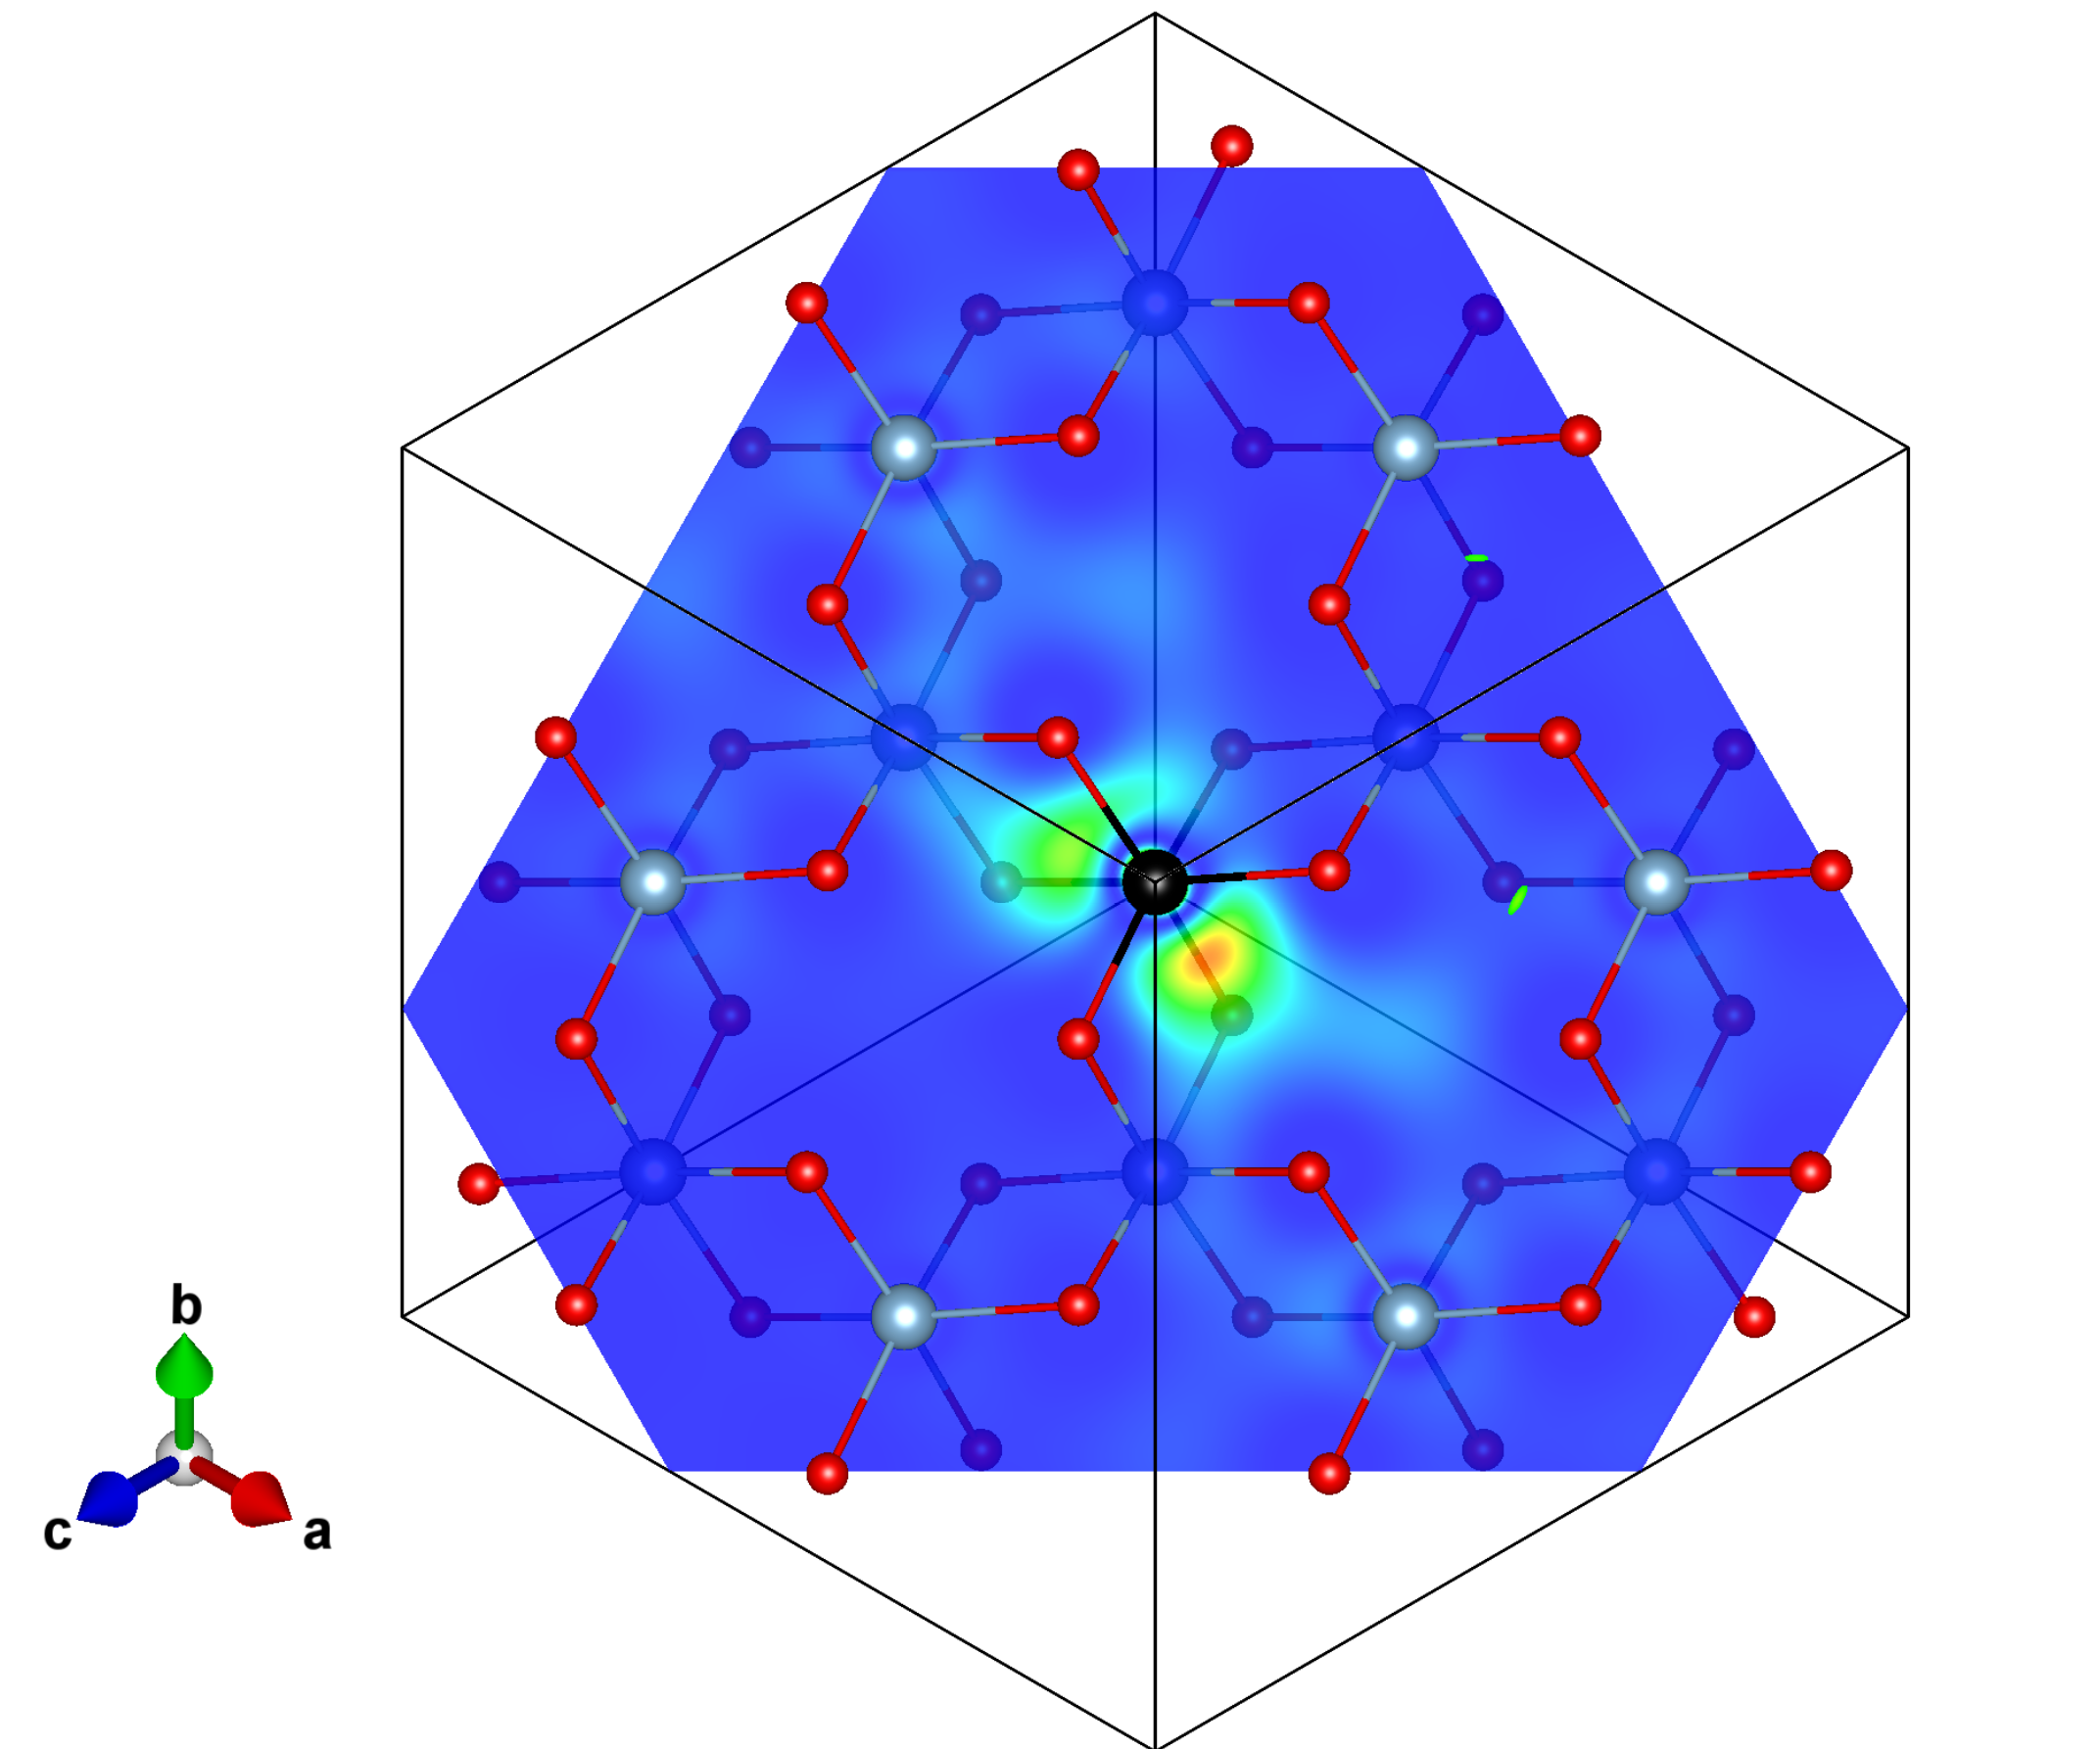

Fig. 11 displays the electron density distribution for a fixed position of the hole for the wavefunction of the lowest bright excitons in the spectra. In the color plots, we consider a cut of the three-dimensional distribution in the plane, perpendicular to the axis, containing the hole. In all cases, the hole position (represented by the black ball in Fig. 11) has been chosen slightly away from the atoms along the rhombohedral direction, in order to avoid the nodes of the orbitals. This is the reason why the electron distribution is not symmetrical around the hole. For an uncorrelated electron-hole pair, the electron density would be delocalised all over the crystal, corresponding to a Bloch wavefunction. The effect of the electron-hole correlation is instead to localise the electron density around the hole.
For the optical spectrum (left panel), the hole has been placed near an O atom, consistently with the main character of the valence band (see Sec. III.1). Here we discover that the electron charge is also surprisingly located at the O atoms, and quite delocalised in the plane. This picture is indeed in contrast with the naive expectation of a charge transfer O Al nature of the exciton, which is based on the largely ionic character of the electronic properties of -Al2O3. However, the strong Al-O hybridisation of the bottom conduction bands makes it possible for the exciton to localise entirely on the O atoms. The nature of the exciton in -Al2O3 therefore turns out to be similar to what foundRohlfing and Louie (1998); Gatti and Sottile (2013) in other ionic materials like LiF, where, analogously, for a hole fixed at a F atom, the electron charge is located mainly on F atoms as well.
Finally, the other two panels of Fig. 11 show the wavefunctions of the first bright exciton at the L2,3 edge and in the prepeak of the L1 edge. In both cases, the hole is localised close to an Al atom. For the L2,3 edge, the resulting electron charge has the shape of an Al orbital. For the L1 edge, the cut shows a distorted Al orbital pointing to the next neighbor O atom. In these cases, the electron charge is entirely localised around the same Al site, displaying the atomic nature and the Frenkel character of the core excitons.
IV Conclusions
In summary, we have presented a pseudopotential computational scheme that permits one to evaluate optical and XANES spectra on the same footing, using the same basis set for valence and shallow-core electrons. We have validated the approach by comparison with full potential all-electron calculations, at three different levels of theory, independent-particle approximation, RPA and full excitonic calculation, within the BSE formalism. We have applied this approach to study the optical and semicore excitations of corundum -Al2O3, a promising material for its optical and structural properties. Both optical and XANES spectra present strong many-body effects that require the highest level of theory for an accurate description. In particular, the intense exciton feature in the XANES spectrum at the L1 edge could be measurable. To the best of our knowledge, this edge has never been measured. Our prediction therefore opens up new avenues for the measurement of unoccupied Al 3p states also by means of soft x-ray spectroscopy.
The anisotropy in the optical regime reveals a different order of excitons in the and perpendicular directions: the first exciton is bright along , followed by dark excitons, while it is the opposite in the perpendicular direction. This indicates a fully linear dichroic character of the spectra. The same splitting occurs also for the L2,3 edge. Moreover, we find a pre-edge feature at the Al L1 edge that has a purely electronic nature. This seems to contrast with the origin of the pre-edge observed in XANES spectra at the Al K edge attributed to the coupling with phonons. Our work therefore calls for a careful examination of the role of phonons at the Al L1 edge as well. Finally, the main exciton peak in the optical absorption spectrum of -Al2O3 does not have a OAl charge transfer character, as one would expect from the largely ionic nature of the electronic structure of -Al2O3. Instead, as a consequence of the electron-hole correlation, the exciton is localised on O atoms only.
This work opens the way for an accurate description of other shallow-core spectroscopies within a pseudopotential scheme, such as electron energy loss near-edge structures (ELNES) or x-ray Raman scattering (XRS). Finally, treating shallow-core, valence, and conduction states on the same footing can be particularly useful to describe resonant inelastic x-ray scattering (RIXS).
Acknowledgements.
We acknowledge valuable discussions with Christian Vorwerk. We thank the French Agence Nationale de la Recherche (ANR) for financial support (Grant Agreements No. ANR-19-CE30-0011). Computational time was granted by GENCI (Project No. 544).References
- van Bokhoven and Lamberti (2016) J. van Bokhoven and C. Lamberti, eds., X-Ray Absorption and X-Ray Emission Spectroscopy: Theory and Applications (Wiley, 2016).
- de Groot et al. (2021) F. M. de Groot, H. Elnaggar, F. Frati, R. pan Wang, M. U. Delgado-Jaime, M. van Veenendaal, J. Fernandez-Rodriguez, M. W. Haverkort, R. J. Green, G. van der Laan, Y. Kvashnin, A. Hariki, H. Ikeno, H. Ramanantoanina, C. Daul, B. Delley, M. Odelius, M. Lundberg, O. Kuhn, S. I. Bokarev, E. Shirley, J. Vinson, K. Gilmore, M. Stener, G. Fronzoni, P. Decleva, P. Kruger, M. Retegan, Y. Joly, C. Vorwerk, C. Draxl, J. Rehr, and A. Tanaka, Journal of Electron Spectroscopy and Related Phenomena 249, 147061 (2021).
- Fujikawa (1983) T. Fujikawa, Journal of the Physical Society of Japan 52, 4001 (1983).
- Tyson et al. (1992) T. A. Tyson, K. O. Hodgson, C. R. Natoli, and M. Benfatto, Phys. Rev. B 46, 5997 (1992).
- Ahlers et al. (1998) D. Ahlers, G. Schütz, V. Popescu, and H. Ebert, Journal of Applied Physics 83, 7082 (1998).
- Rehr and Albers (2000) J. J. Rehr and R. C. Albers, Rev. Mod. Phys. 72, 621 (2000).
- Rehr et al. (2009) J. J. Rehr, J. J. Kas, M. P. Prange, A. P. Sorini, Y. Takimoto, and F. Vila, Comptes Rendus Physique 10, 548 (2009).
- Rehr et al. (2010) J. J. Rehr, J. J. Kas, F. D. Vila, M. P. Prange, and K. Jorissen, Phys. Chem. Chem. Phys. 12, 5503 (2010).
- de Groot (2005) F. de Groot, Coordination Chemistry Reviews 249, 31 (2005), synchrotron Radiation in Inorganic and Bioinorganic Chemistry.
- De Groot and Kotani (2008) F. De Groot and A. Kotani, Core level spectroscopy of solids (CRC press, 2008).
- Haverkort et al. (2012) M. W. Haverkort, M. Zwierzycki, and O. K. Andersen, Phys. Rev. B 85, 165113 (2012).
- Mo and Ching (2000) S.-D. Mo and W. Y. Ching, Phys. Rev. B 62, 7901 (2000).
- Gougoussis et al. (2009) C. Gougoussis, M. Calandra, A. P. Seitsonen, and F. Mauri, Phys. Rev. B 80, 075102 (2009).
- Taillefumier et al. (2002) M. Taillefumier, D. Cabaret, A.-M. Flank, and F. Mauri, Phys. Rev. B 66, 195107 (2002).
- Bunău and Calandra (2013) O. Bunău and M. Calandra, Phys. Rev. B 87, 205105 (2013).
- Mazevet et al. (2010) S. Mazevet, M. Torrent, V. Recoules, and F. Jollet, High Energy Density Physics 6, 84 (2010).
- Hetényi et al. (2004) B. Hetényi, F. De Angelis, P. Giannozzi, and R. Car, The Journal of Chemical Physics 120, 8632 (2004).
- Prendergast and Galli (2006) D. Prendergast and G. Galli, Phys. Rev. Lett. 96, 215502 (2006).
- Gao et al. (2009) S.-P. Gao, C. J. Pickard, A. Perlov, and V. Milman, Journal of Physics: Condensed Matter 21, 104203 (2009).
- Prentice et al. (2020) J. C. A. Prentice, J. Aarons, J. C. Womack, A. E. A. Allen, L. Andrinopoulos, L. Anton, R. A. Bell, A. Bhandari, G. A. Bramley, R. J. Charlton, R. J. Clements, D. J. Cole, G. Constantinescu, F. Corsetti, S. M.-M. Dubois, K. K. B. Duff, J. M. Escartín, A. Greco, Q. Hill, L. P. Lee, E. Linscott, D. D. O’Regan, M. J. S. Phipps, L. E. Ratcliff, A. R. Serrano, E. W. Tait, G. Teobaldi, V. Vitale, N. Yeung, T. J. Zuehlsdorff, J. Dziedzic, P. D. Haynes, N. D. M. Hine, A. A. Mostofi, M. C. Payne, and C.-K. Skylaris, The Journal of Chemical Physics 152, 174111 (2020), https://doi.org/10.1063/5.0004445 .
- Hjalmarson et al. (1981) H. P. Hjalmarson, H. Büttner, and J. D. Dow, Phys. Rev. B 24, 6010 (1981).
- Lie et al. (1999) K. Lie, R. Brydson, and H. Davock, Phys. Rev. B 59, 5361 (1999).
- Triguero et al. (1998) L. Triguero, L. G. M. Pettersson, and H. Ågren, Phys. Rev. B 58, 8097 (1998).
- Klein et al. (2021) B. P. Klein, S. J. Hall, and R. J. Maurer, Journal of Physics: Condensed Matter 33, 154005 (2021).
- Rehr et al. (2005) J. J. Rehr, J. A. Soininen, and E. L. Shirley, Physica Scripta 2005, 207 (2005).
- Liang et al. (2017) Y. Liang, J. Vinson, S. Pemmaraju, W. S. Drisdell, E. L. Shirley, and D. Prendergast, Phys. Rev. Lett. 118, 096402 (2017).
- Onida et al. (2002) G. Onida, L. Reining, and A. Rubio, Rev. Mod. Phys. 74, 601 (2002).
- Besley et al. (2009) N. A. Besley, M. J. G. Peach, and D. J. Tozer, Phys. Chem. Chem. Phys. 11, 10350 (2009).
- Bunău and Joly (2012) O. Bunău and Y. Joly, Phys. Rev. B 85, 155121 (2012).
- Bunău and Joly (2012) O. Bunău and Y. Joly, Journal of Physics: Condensed Matter 24, 215502 (2012).
- Strinati (1982) G. Strinati, Phys. Rev. Lett. 49, 1519 (1982).
- Strinati (1984) G. Strinati, Phys. Rev. B 29, 5718 (1984).
- Shirley (1998) E. L. Shirley, Phys. Rev. Lett. 80, 794 (1998).
- Carlisle et al. (1999) J. A. Carlisle, E. L. Shirley, L. J. Terminello, J. J. Jia, T. A. Callcott, D. L. Ederer, R. C. C. Perera, and F. J. Himpsel, Phys. Rev. B 59, 7433 (1999).
- Shirley (2000) E. Shirley, Journal of Physics and Chemistry of Solids 61, 445 (2000).
- Martin et al. (2016) R. M. Martin, L. Reining, and D. M. Ceperley, Interacting Electrons: Theory and Computational Approaches (Cambridge University Press, 2016).
- Bechstedt (2014) F. Bechstedt, Many-Body Approach to Electronic Excitations: Concepts and Applications, Springer Series in Solid-State Sciences (Springer Berlin Heidelberg, 2014).
- Botti et al. (2007) S. Botti, A. Schindlmayr, R. D. Sole, and L. Reining, Reports on Progress in Physics 70, 357 (2007).
- Wills et al. (2010) J. Wills, M. Alouani, P. Andersson, A. Delin, O. Eriksson, and O. Grechnyev, Full-Potential Electronic Structure Method: Energy and Force Calculations with Density Functional and Dynamical Mean Field Theory, Springer Series in Solid-State Sciences (Springer Berlin Heidelberg, 2010).
- Andersen (1975) O. K. Andersen, Phys. Rev. B 12, 3060 (1975).
- Sjöstedt et al. (2000) E. Sjöstedt, L. Nordström, and D. Singh, Solid State Communications 114, 15 (2000).
- Madsen et al. (2001) G. K. H. Madsen, P. Blaha, K. Schwarz, E. Sjöstedt, and L. Nordström, Phys. Rev. B 64, 195134 (2001).
- Payne et al. (1992) M. C. Payne, M. P. Teter, D. C. Allan, T. A. Arias, and J. D. Joannopoulos, Rev. Mod. Phys. 64, 1045 (1992).
- Willand et al. (2013) A. Willand, Y. O. Kvashnin, L. Genovese, A. Vázquez-Mayagoitia, A. K. Deb, A. Sadeghi, T. Deutsch, and S. Goedecker, The Journal of Chemical Physics 138, 104109 (2013).
- Lejaeghere et al. (2014) K. Lejaeghere, V. V. Speybroeck, G. V. Oost, and S. Cottenier, Critical Reviews in Solid State and Materials Sciences 39, 1 (2014).
- Prandini et al. (2018) G. Prandini, A. Marrazzo, I. E. Castelli, N. Mounet, and N. Marzari, npj Computational Materials 4, 2057 (2018).
- Lejaeghere et al. (2016) K. Lejaeghere, G. Bihlmayer, T. Björkman, P. Blaha, S. Blügel, V. Blum, D. Caliste, I. E. Castelli, S. J. Clark, A. D. Corso, S. de Gironcoli, T. Deutsch, J. K. Dewhurst, I. D. Marco, C. Draxl, M. Dułak, O. Eriksson, J. A. Flores-Livas, K. F. Garrity, L. Genovese, P. Giannozzi, M. Giantomassi, S. Goedecker, X. Gonze, O. Grånäs, E. K. U. Gross, A. Gulans, F. Gygi, D. R. Hamann, P. J. Hasnip, N. A. W. Holzwarth, D. Iuşan, D. B. Jochym, F. Jollet, D. Jones, G. Kresse, K. Koepernik, E. Küçükbenli, Y. O. Kvashnin, I. L. M. Locht, S. Lubeck, M. Marsman, N. Marzari, U. Nitzsche, L. Nordström, T. Ozaki, L. Paulatto, C. J. Pickard, W. Poelmans, M. I. J. Probert, K. Refson, M. Richter, G.-M. Rignanese, S. Saha, M. Scheffler, M. Schlipf, K. Schwarz, S. Sharma, F. Tavazza, P. Thunström, A. Tkatchenko, M. Torrent, D. Vanderbilt, M. J. van Setten, V. V. Speybroeck, J. M. Wills, J. R. Yates, G.-X. Zhang, and S. Cottenier, Science 351, aad3000 (2016).
- Ku and Eguiluz (2002) W. Ku and A. G. Eguiluz, Phys. Rev. Lett. 89, 126401 (2002).
- Delaney et al. (2004) K. Delaney, P. García-González, A. Rubio, P. Rinke, and R. W. Godby, Phys. Rev. Lett. 93, 249701 (2004).
- Tiago et al. (2004) M. L. Tiago, S. Ismail-Beigi, and S. G. Louie, Phys. Rev. B 69, 125212 (2004).
- van Schilfgaarde et al. (2006a) M. van Schilfgaarde, T. Kotani, and S. V. Faleev, Phys. Rev. B 74, 245125 (2006a).
- Friedrich et al. (2006) C. Friedrich, A. Schindlmayr, S. Blügel, and T. Kotani, Phys. Rev. B 74, 045104 (2006).
- Gómez-Abal et al. (2008) R. Gómez-Abal, X. Li, M. Scheffler, and C. Ambrosch-Draxl, Phys. Rev. Lett. 101, 106404 (2008).
- Luppi et al. (2008) E. Luppi, H.-C. Weissker, S. Bottaro, F. Sottile, V. Veniard, L. Reining, and G. Onida, Phys. Rev. B 78, 245124 (2008).
- Klimeš et al. (2014) J. c. v. Klimeš, M. Kaltak, and G. Kresse, Phys. Rev. B 90, 075125 (2014).
- Friedrich et al. (2011a) C. Friedrich, M. C. Müller, and S. Blügel, Phys. Rev. B 83, 081101 (2011a).
- Friedrich et al. (2011b) C. Friedrich, M. C. Müller, and S. Blügel, Phys. Rev. B 84, 039906 (2011b).
- Jiang and Blaha (2016) H. Jiang and P. Blaha, Phys. Rev. B 93, 115203 (2016).
- Jiang (2018) H. Jiang, Phys. Rev. B 97, 245132 (2018).
- Hamann (2013) D. R. Hamann, Phys. Rev. B 88, 085117 (2013).
- Note (1) The same hypothesis is made when the core orbitals are obtained from a calculation of the isolated atomShirley (2004); Blöchl (1994); Unzog et al. (2022).
- French (1990) R. H. French, Journal of the American Ceramic Society 73, 477 (1990).
- French et al. (1994) R. H. French, D. J. Jones, and S. Loughin, Journal of the American Ceramic Society 77, 412 (1994).
- Tanaka and Adachi (1996) I. Tanaka and H. Adachi, Phys. Rev. B 54, 4604 (1996).
- Cabaret et al. (1996) D. Cabaret, P. Sainctavit, P. Ildefonse, and A.-M. Flank, Journal of Physics: Condensed Matter 8, 3691 (1996).
- Ildefonse et al. (1998) P. Ildefonse, D. Cabaret, P. Sainctavit, G. Calas, A.-M. Flank, and P. Lagarde, Physics and Chemistry of Minerals 25, 112 (1998).
- van Bokhoven et al. (2001) J. A. van Bokhoven, T. Nabi, H. Sambe, D. E. Ramaker, and D. C. Koningsberger, Journal of Physics: Condensed Matter 13, 10247 (2001).
- Strinati (1988) G. Strinati, Rivista del Nuovo Cimento 11, 1 (1988).
- Hedin (1965) L. Hedin, Phys. Rev. 139, A796 (1965).
- Albrecht et al. (1998) S. Albrecht, L. Reining, R. Del Sole, and G. Onida, Phys. Rev. Lett. 80, 4510 (1998).
- Benedict et al. (1998) L. X. Benedict, E. L. Shirley, and R. B. Bohn, Phys. Rev. Lett. 80, 4514 (1998).
- Rohlfing and Louie (2000) M. Rohlfing and S. G. Louie, Phys. Rev. B 62, 4927 (2000).
- Vinson et al. (2011) J. Vinson, J. J. Rehr, J. J. Kas, and E. L. Shirley, Phys. Rev. B 83, 115106 (2011).
- Vinson and Rehr (2012) J. Vinson and J. J. Rehr, Phys. Rev. B 86, 195135 (2012).
- Gilmore et al. (2015) K. Gilmore, J. Vinson, E. Shirley, D. Prendergast, C. Pemmaraju, J. Kas, F. Vila, and J. Rehr, Computer Physics Communications 197, 109 (2015).
- Gilmore et al. (2021) K. Gilmore, J. Pelliciari, Y. Huang, J. J. Kas, M. Dantz, V. N. Strocov, S. Kasahara, Y. Matsuda, T. Das, T. Shibauchi, and T. Schmitt, Phys. Rev. X 11, 031013 (2021).
- Geondzhian and Gilmore (2018) A. Geondzhian and K. Gilmore, Phys. Rev. B 98, 214305 (2018).
- Dashwood et al. (2021) C. D. Dashwood, A. Geondzhian, J. G. Vale, A. C. Pakpour-Tabrizi, C. A. Howard, Q. Faure, L. S. I. Veiga, D. Meyers, S. G. Chiuzbăian, A. Nicolaou, N. Jaouen, R. B. Jackman, A. Nag, M. García-Fernández, K.-J. Zhou, A. C. Walters, K. Gilmore, D. F. McMorrow, and M. P. M. Dean, Phys. Rev. X 11, 041052 (2021).
- Vinson (2022) J. Vinson, Phys. Chem. Chem. Phys. 24, 12787 (2022).
- Olovsson et al. (2009a) W. Olovsson, I. Tanaka, P. Puschnig, and C. Ambrosch-Draxl, Journal of Physics: Condensed Matter 21, 104205 (2009a).
- Olovsson et al. (2009b) W. Olovsson, I. Tanaka, T. Mizoguchi, P. Puschnig, and C. Ambrosch-Draxl, Phys. Rev. B 79, 041102 (2009b).
- Olovsson et al. (2011) W. Olovsson, I. Tanaka, T. Mizoguchi, G. Radtke, P. Puschnig, and C. Ambrosch-Draxl, Phys. Rev. B 83, 195206 (2011).
- Vorwerk et al. (2017) C. Vorwerk, C. Cocchi, and C. Draxl, Phys. Rev. B 95, 155121 (2017).
- Vorwerk et al. (2019) C. Vorwerk, B. Aurich, C. Cocchi, and C. Draxl, Electronic Structure 1, 037001 (2019).
- Vorwerk et al. (2020) C. Vorwerk, F. Sottile, and C. Draxl, Phys. Rev. Research 2, 042003 (2020).
- Laskowski and Blaha (2010) R. Laskowski and P. Blaha, Phys. Rev. B 82, 205104 (2010).
- Yao et al. (2022) Y. Yao, D. Golze, P. Rinke, V. Blum, and Y. Kanai, Journal of Chemical Theory and Computation 18, 1569 (2022).
- Vorwerk et al. (2022) C. Vorwerk, F. Sottile, and C. Draxl, Phys. Chem. Chem. Phys. 24, 17439 (2022).
- Unzog et al. (2022) M. Unzog, A. Tal, and G. Kresse, Phys. Rev. B 106, 155133 (2022).
- Adler (1962) S. L. Adler, Phys. Rev. 126, 413 (1962).
- Wiser (1963) N. Wiser, Phys. Rev. 129, 62 (1963).
- Note (2) There is also the possibility to include and exclude , which corresponds to the description of triplet excitations.
- Gonze et al. (2016) X. Gonze, F. Jollet, F. Abreu Araujo, D. Adams, B. Amadon, T. Applencourt, C. Audouze, J.-M. Beuken, J. Bieder, A. Bokhanchuk, E. Bousquet, F. Bruneval, D. Caliste, M. Côté, F. Dahm, F. Da Pieve, M. Delaveau, M. Di Gennaro, B. Dorado, C. Espejo, G. Geneste, L. Genovese, A. Gerossier, M. Giantomassi, Y. Gillet, D. Hamann, L. He, G. Jomard, J. Laflamme Janssen, S. Le Roux, A. Levitt, A. Lherbier, F. Liu, I. Lukačević, A. Martin, C. Martins, M. Oliveira, S. Poncé, Y. Pouillon, T. Rangel, G.-M. Rignanese, A. Romero, B. Rousseau, O. Rubel, A. Shukri, M. Stankovski, M. Torrent, M. Van Setten, B. Van Troeye, M. Verstraete, D. Waroquiers, J. Wiktor, B. Xu, A. Zhou, and J. Zwanziger, Comput. Phys. Commun. 205, 106 (2016).
- (94) L. Reining, V. Olevano, F. Sottile, S. Albrecht, and G. Onida, “The exc code,” https://etsf.polytechnique.fr/software/Ab_Initio/, unpublished.
- Gulans et al. (2014) A. Gulans, S. Kontur, C. Meisenbichler, D. Nabok, P. Pavone, S. Rigamonti, S. Sagmeister, U. Werner, and C. Draxl, Journal of Physics: Condensed Matter 26, 363202 (2014).
- Kohn and Sham (1965) W. Kohn and L. J. Sham, Phys. Rev. 140, A1133 (1965).
- Troullier and Martins (1991) N. Troullier and J. L. Martins, Phys. Rev. B 43, 1993 (1991).
- van Setten et al. (2018) M. van Setten, M. Giantomassi, E. Bousquet, M. Verstraete, D. Hamann, X. Gonze, and G.-M. Rignanese, Computer Physics Communications 226, 39 (2018).
- Zhou et al. (2020) J. S. Zhou, L. Reining, A. Nicolaou, A. Bendounan, K. Ruotsalainen, M. Vanzini, J. J. Kas, J. J. Rehr, M. Muntwiler, V. N. Strocov, F. Sirotti, and M. Gatti, Proceedings of the National Academy of Sciences 117, 28596 (2020).
- Sturm et al. (1990) K. Sturm, E. Zaremba, and K. Nuroh, Phys. Rev. B 42, 6973 (1990).
- Quong and Eguiluz (1993) A. A. Quong and A. G. Eguiluz, Phys. Rev. Lett. 70, 3955 (1993).
- Zhou et al. (2018) J. S. Zhou, M. Gatti, J. J. Kas, J. J. Rehr, and L. Reining, Phys. Rev. B 97, 035137 (2018).
- Marinopoulos and Grüning (2011) A. G. Marinopoulos and M. Grüning, Phys. Rev. B 83, 195129 (2011).
- Lorin et al. (2021) A. Lorin, M. Gatti, L. Reining, and F. Sottile, Phys. Rev. B 104, 235149 (2021).
- Newnham and Haan (1962) E. E. Newnham and Y. M. Haan, Zeitschrift fur Kristallographie - Crystalline Materials 117, 235 (1962).
- Mackrodt et al. (2019) W. C. Mackrodt, M. Rérat, F. S. Gentile, and R. Dovesi, Journal of Physics: Condensed Matter 32, 085901 (2019).
- Ahuja et al. (2004) R. Ahuja, J. M. Osorio-Guillen, J. S. de Almeida, B. Holm, W. Y. Ching, and B. Johansson, Journal of Physics: Condensed Matter 16, 2891 (2004).
- Santos et al. (2015) R. Santos, E. Longhinotti, V. Freire, R. Reimberg, and E. Caetano, Chemical Physics Letters 637, 172 (2015).
- Will et al. (1992) F. G. Will, H. G. DeLorenzi, and K. H. Janora, Journal of the American Ceramic Society 75, 295 (1992).
- Crist (2004) B. Crist, Handbooks of Monochromatic XPS Spectra: Volume 2 : Commercially Pure Binary Oxides (XPS International LLC, 2004).
- Gonze et al. (1991) X. Gonze, R. Stumpf, and M. Scheffler, Phys. Rev. B 44, 8503 (1991).
- Puschnig and Ambrosch-Draxl (2002) P. Puschnig and C. Ambrosch-Draxl, Phys. Rev. B 66, 165105 (2002).
- Rangel et al. (2020) T. Rangel, M. D. Ben, D. Varsano, G. Antonius, F. Bruneval, F. H. da Jornada, M. J. van Setten, O. K. Orhan, D. D. O’Regan, A. Canning, A. Ferretti, A. Marini, G.-M. Rignanese, J. Deslippe, S. G. Louie, and J. B. Neaton, Computer Physics Communications 255, 107242 (2020).
- Albrecht (1999) S. Albrecht, Optical Absorption Spectra of Semiconductors and Insulators: ab initio calculations of many-body effects, Ph.D. thesis, Ecole Polytechnique, Palaiseau (1999).
- Puschnig (2002) P. Puschnig, Excitonic Effects in Organic Semi-Conductors - An Ab-initio Study within the LAPW Method, Ph.D. thesis (2002).
- Fuchs et al. (2008) F. Fuchs, C. Rödl, A. Schleife, and F. Bechstedt, Phys. Rev. B 78, 085103 (2008).
- Gorelov et al. (2022) V. Gorelov, L. Reining, W. R. L. Lambrecht, and M. Gatti, “Robustness of electronic screening effects in electron spectroscopies: example of v2o5,” (2022), https://arxiv.org/abs/2211.06285.
- Goedecker (1993) S. Goedecker, Phys. Rev. B 47, 9881 (1993).
- Singh (1991) D. Singh, Phys. Rev. B 43, 6388 (1991).
- Tomiki et al. (1993) T. Tomiki, Y. Ganaha, T. Shikenbaru, T. Futemma, M. Yuri, Y. Aiura, S. Sato, H. Fukutani, H. Kato, T. Miyahara, A. Yonesu, and J. Tamashiro, Journal of the Physical Society of Japan 62, 573 (1993).
- French et al. (1998) R. H. French, H. Müllejans, and D. J. Jones, Journal of the American Ceramic Society 81, 2549 (1998).
- Weigel et al. (2008) C. Weigel, G. Calas, L. Cormier, L. Galoisy, and G. S. Henderson, Journal of Physics: Condensed Matter 20, 135219 (2008).
- van Bokhoven et al. (1999) J. A. van Bokhoven, H. Sambe, D. E. Ramaker, and D. C. Koningsberger, The Journal of Physical Chemistry B 103, 7557 (1999).
- Mizoguchi et al. (2009) T. Mizoguchi, I. Tanaka, S.-P. Gao, and C. J. Pickard, Journal of Physics: Condensed Matter 21, 104204 (2009).
- van Schilfgaarde et al. (2006b) M. van Schilfgaarde, T. Kotani, and S. Faleev, Phys. Rev. Lett. 96, 226402 (2006b).
- O’Brien et al. (1991) W. L. O’Brien, J. Jia, Q.-Y. Dong, T. A. Callcott, J.-E. Rubensson, D. L. Mueller, and D. L. Ederer, Phys. Rev. B 44, 1013 (1991).
- O’Brien et al. (1993) W. L. O’Brien, J. Jia, Q.-Y. Dong, T. A. Callcott, D. R. Mueller, D. L. Ederer, and C.-C. Kao, Phys. Rev. B 47, 15482 (1993).
- Cabaret et al. (2005) D. Cabaret, E. Gaudry, M. Taillefumier, P. Sainctavit, and F. Mauri, Physica Scripta 2005, 131 (2005).
- Cabaret and Brouder (2009) D. Cabaret and C. Brouder, Journal of Physics: Conference Series 190, 012003 (2009).
- Brouder et al. (2010) C. Brouder, D. Cabaret, A. Juhin, and P. Sainctavit, Phys. Rev. B 81, 115125 (2010).
- Manuel et al. (2012) D. Manuel, D. Cabaret, C. Brouder, P. Sainctavit, A. Bordage, and N. Trcera, Phys. Rev. B 85, 224108 (2012).
- Nemausat et al. (2016) R. Nemausat, C. Brouder, C. Gervais, and D. Cabaret, Journal of Physics: Conference Series 712, 012006 (2016).
- Delhommaye et al. (2021) S. Delhommaye, G. Radtke, C. Brouder, S. P. Collins, S. Huotari, C. Sahle, M. Lazzeri, L. Paulatto, and D. Cabaret, Phys. Rev. B 104, 024302 (2021).
- Marinopoulos et al. (2002) A. G. Marinopoulos, L. Reining, V. Olevano, A. Rubio, T. Pichler, X. Liu, M. Knupfer, and J. Fink, Phys. Rev. Lett. 89, 076402 (2002).
- Vast et al. (2002) N. Vast, L. Reining, V. Olevano, P. Schattschneider, and B. Jouffrey, Phys. Rev. Lett. 88, 037601 (2002).
- Dash et al. (2007) L. Dash, F. Bruneval, V. Trinité, N. Vast, and L. Reining, Computational Materials Science 38, 482 (2007), selected papers from the International Conference on Computational Methods in Sciences and Engineering 2004.
- Huotari et al. (2010) S. Huotari, J. A. Soininen, G. Vankó, G. Monaco, and V. Olevano, Phys. Rev. B 82, 064514 (2010).
- Cudazzo et al. (2014) P. Cudazzo, K. O. Ruotsalainen, C. J. Sahle, A. Al-Zein, H. Berger, E. Navarro-Moratalla, S. Huotari, M. Gatti, and A. Rubio, Phys. Rev. B 90, 125125 (2014).
- Ruotsalainen et al. (2021) K. Ruotsalainen, A. Nicolaou, C. J. Sahle, A. Efimenko, J. M. Ablett, J.-P. Rueff, D. Prabhakaran, and M. Gatti, Phys. Rev. B 103, 235136 (2021).
- Note (3) It is well known that local field effects, expressed as electron-hole exchange interaction in the BSE framework, are essential to get the correct branching ratios between L2 and L3 components, see e.g. Gilmore et al. (2015); Vinson and Rehr (2012); Ankudinov et al. (2005). However, in the present case the neglect of spin-orbit coupling does not allow us to resolve the two components. For -Al2O3 an electron–hole exchange energy of 0.3 eV has been estimated Weigel et al. (2008); O’Brien et al. (1991).
- Rohlfing and Louie (1998) M. Rohlfing and S. G. Louie, Phys. Rev. Lett. 81, 2312 (1998).
- Gatti and Sottile (2013) M. Gatti and F. Sottile, Phys. Rev. B 88, 155113 (2013).
- Shirley (2004) E. L. Shirley, Journal of Electron Spectroscopy and Related Phenomena 136, 77 (2004), progress in Core-Level Spectroscopy of Condensed Systems.
- Blöchl (1994) P. E. Blöchl, Phys. Rev. B 50, 17953 (1994).
- Ankudinov et al. (2005) A. L. Ankudinov, Y. Takimoto, and J. J. Rehr, Phys. Rev. B 71, 165110 (2005).