Astrophysical properties of 600 bonafide single stars in the Hyades open cluster
Abstract
The determination of the astrophysical properties of stars remains challenging, and frequently relies on the application of stellar models. Stellar sequences in nearby open clusters provide some of the best means to test and calibrate stellar evolutionary models and isochrones, and to use these models to assign astrophysical properties consistently to a large sample of stars. We aim at updating the single star sequence of members of the Hyades cluster, identifying the best-fitting isochrones, and determining the astrophysical properties of the stars. The Gaia Catalogue of Nearby Stars provides a comprehensive sample of high-probability members of the Hyades cluster. We apply a multi-step method to flag photometric outliers, and to identify bonafide single stars and likely binary and multiple systems. The single stars define a tight sequence, which in the mass range 0.12 to 2.2 M⊙ is well-fitted by PARSEC isochrones for a supersolar metallicity of [M/H] = and an age of Myr. The isochrones enable us to assign mass, effective temperature, luminosity, and surface gravity to each of the 600 bonafide single main-sequence stars. The observed sequence validates the PARSEC isochrones. The derived stellar properties can serve as benchmarks for atmospheric and evolutionary models, and for all-sky catalogs of stellar astrophysical properties. The stellar properties are also relevant for studies of exoplanet properties among Hyades exoplanet hosts.
1 Introduction
Studies of proto-cluster environments and Galactic starburst clusters at ages well below 10 Myr suggest that clustered star formation occurs quasi instantaneous, with a maximum age spread among cluster members of the order of 0.1 to 0.4 Myr (Kudryavtseva et al., 2012; Parmentier et al., 2014; Williams et al., 2022). Galactic open clusters with typical ages of a few to several 100 Myr also exhibit small spreads in age and metallicity among their members, suggesting close-to-coeval formation out of the homogeneously mixed material of the parental giant molecular cloud (Bovy, 2016; Magrini et al., 2017; Jeffries, 2017; Krumholz & McKee, 2020).
Star clusters are thus suited particularly well for studying stellar astrophysical properties as a function of stellar mass, or its proxies stellar effective temperature and luminosity. Due of its proximity and richness in stellar members, the nearby Hyades open cluster is frequently used for testing and calibrating stellar evolutionary models (Castellani et al., 2001; Kopytova et al., 2016; Jeffery et al., 2022).
Based on Gaia Early Data Release 3 (EDR3) astrometry and radial velocities, Gaia Collaboration et al. (2021) identify more than 3000 potential members of the Hyades cluster within 100 pc of the Sun. After application of a local density filter, they reduce this to a sample of 920 candidate members. In Brandner et al. (2023) we use this sample as a basis for benchmarking MESA evolutionary models (Choi et al., 2016; Dotter, 2016), and find a significant discrepancy between the observational sequence and theoretical isochrones in the stellar mass range 0.25 to 0.85 M⊙.
A possible fix to resolve this discrepancy is a modification of the temperature-Rosseland mean optical depth (T-) relation in the stellar models, as introduced by Chen et al. (2014) for the PAdova and TRieste Stellar Evolution Code (PARSEC, Girardi et al. (2002); Marigo et al. (2008); Bressan et al. (2012)).
In the present paper, we test PARSEC isochrones against the cleaned-up single star sequence of the Hyades open cluster, and use the family of best fitting isochrones to assign astrophysical properties to 600 candidate members of the Hyades. The structure of the paper is as follows: in section 2 we describe the processing of the Gaia data and the identification of the single stars. In section 3 we identify the best fitting PARSEC isochrones, and determine the stellar properties. In section 4 we close with a discussion and outlook.
2 The single star sequence: cleaning the Gaia data set
While in general of exquisite and unprecedented quality, Gaia DR3 includes some problematic data. This in particular concerns bright sources saturating too many pixel on the Gaia detectors, and faint sources, which can be subject to photometric blends in particular in the spectrally dispersed BP and RP bands. The Gaia Catalogue of Nearby Stars (GCNS) also includes faint red stars with significant detections in the G and RP bands, and with BP magnitudes at or below the formal Gaia detection limit (Gaia Collaboration et al., 2021).
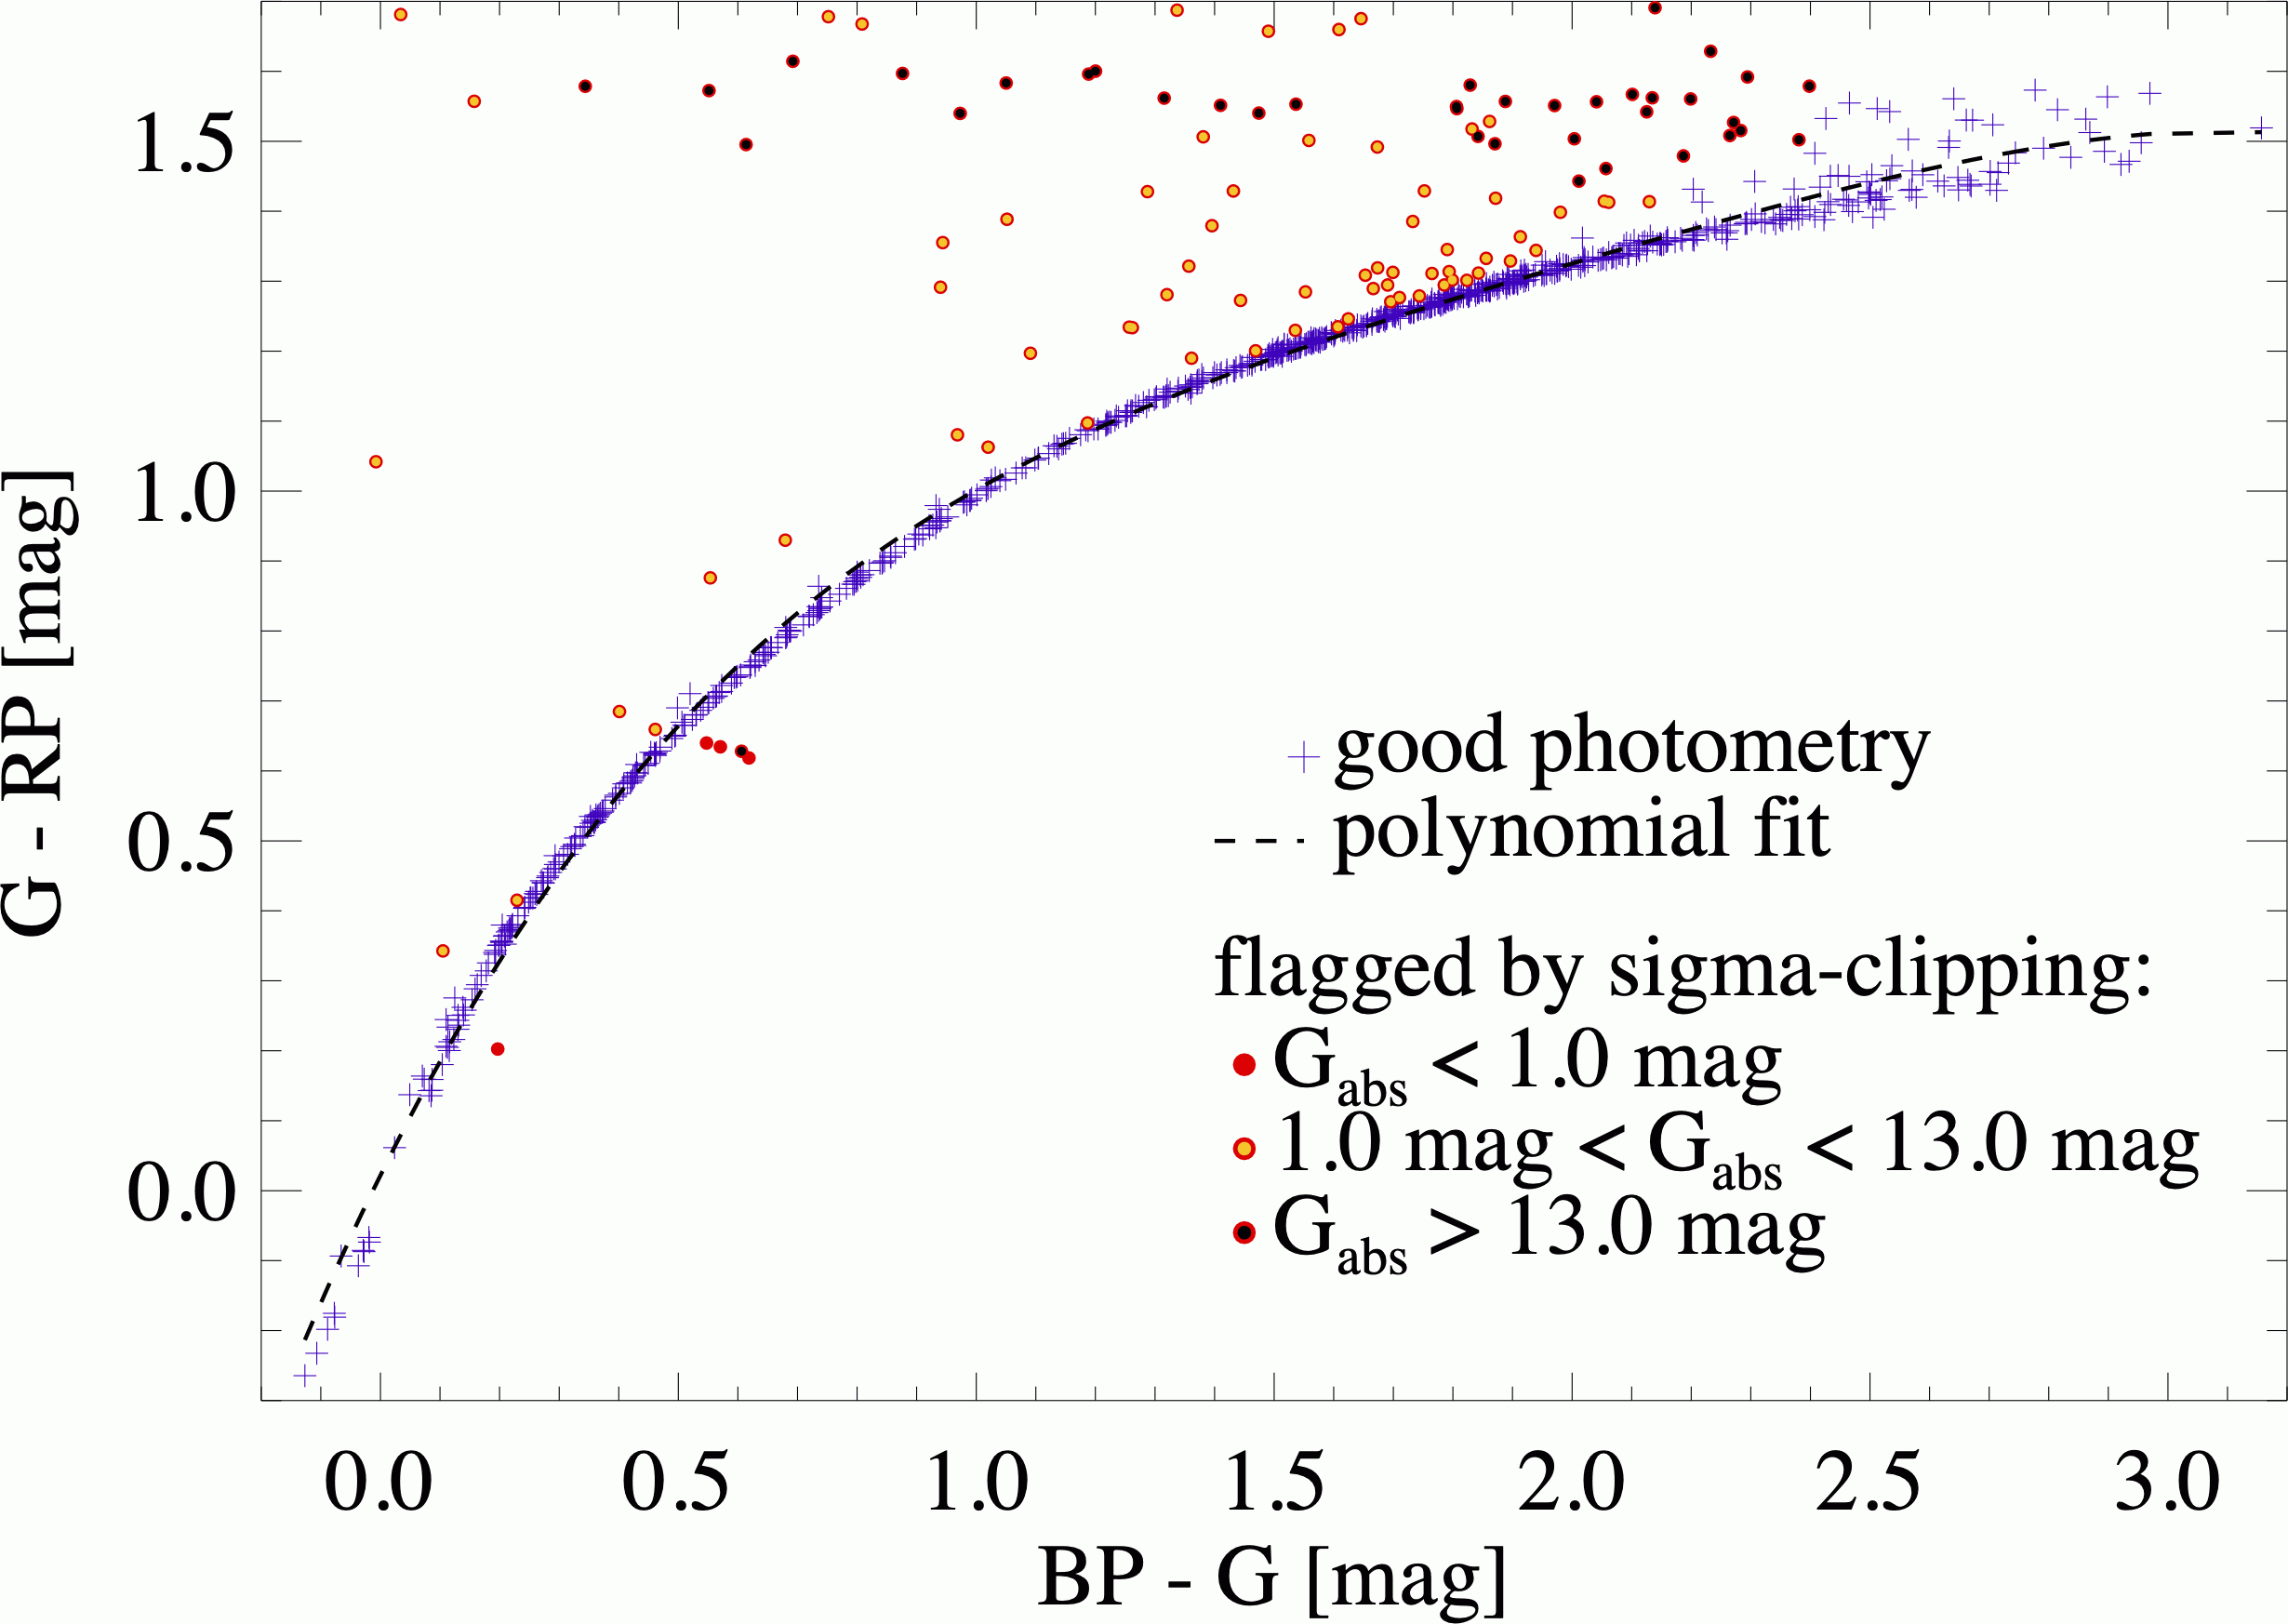
In Brandner et al. (2023) we defined a multi-step process to classify the 920 GCNS candidate members of the Hyades open cluster into four groups: bonafide single stars, probable binary and multiple systems, white dwarfs, and sources with problematic photometry in at least one of the Gaia photometric bands. In order to flag sources with potentially unreliable photometry, we iteratively fit a 4th order polynomial to the Gaia DR3111In Brandner et al. (2023) we used Gaia EDR3 G magnitudes, which had not been corrected for the processing error described in section 8.3 of Riello et al. (2021). This error, which amounts to up to 0.0025 mag, affected 100 of the 920 GCNS candidate members of the Hyades. data in G-RP vs. BP-G color-color space, and then apply sigma-clipping at the 3 level (Figure 1), resulting in 783 sources with reliable photometry. The stars flagged with potentially unreliable photometry fall into three classes: i) four giant stars ( Tau, Tau, Tau, and Tau, filled red circles) in the Hyades with G mag, which are brighter than the nominal saturation limit of Gaia (E)DR3 (Riello et al. (2021), Appendix C.1). ii) 38 stars with G mag (red circles with yellow (light) inserts). These stars have G19.5 mag and an apparent BP brightness below the nominal Gaia epoch detection threshold of BP=20.3 mag, which results in an overestimate of the mean flux (Riello et al. (2021), section 8.1). In the two color diagram, these stars occupy a band around G-RP1.5 to 1.6 mag, the only exception being Gaia EDR3 1988661087451017856, which has a photo-geometric distance of 96 pc (Bailer-Jones et al., 2021) and is classified as a candidate white dwarf by Gentile Fusillo et al. (2021). iii) 67 stars with 1 mag G mag, which have G13.9 mag (red circles with black (dark) inserts). In the two color diagram these stars are all located to the left (bluer BP-G color) and above (redder G-RP color) of the typical sequence defined by the photospheres of Hyades members. We were not able to assign any plausible astrophysical reason for their peculiar Gaia colors.
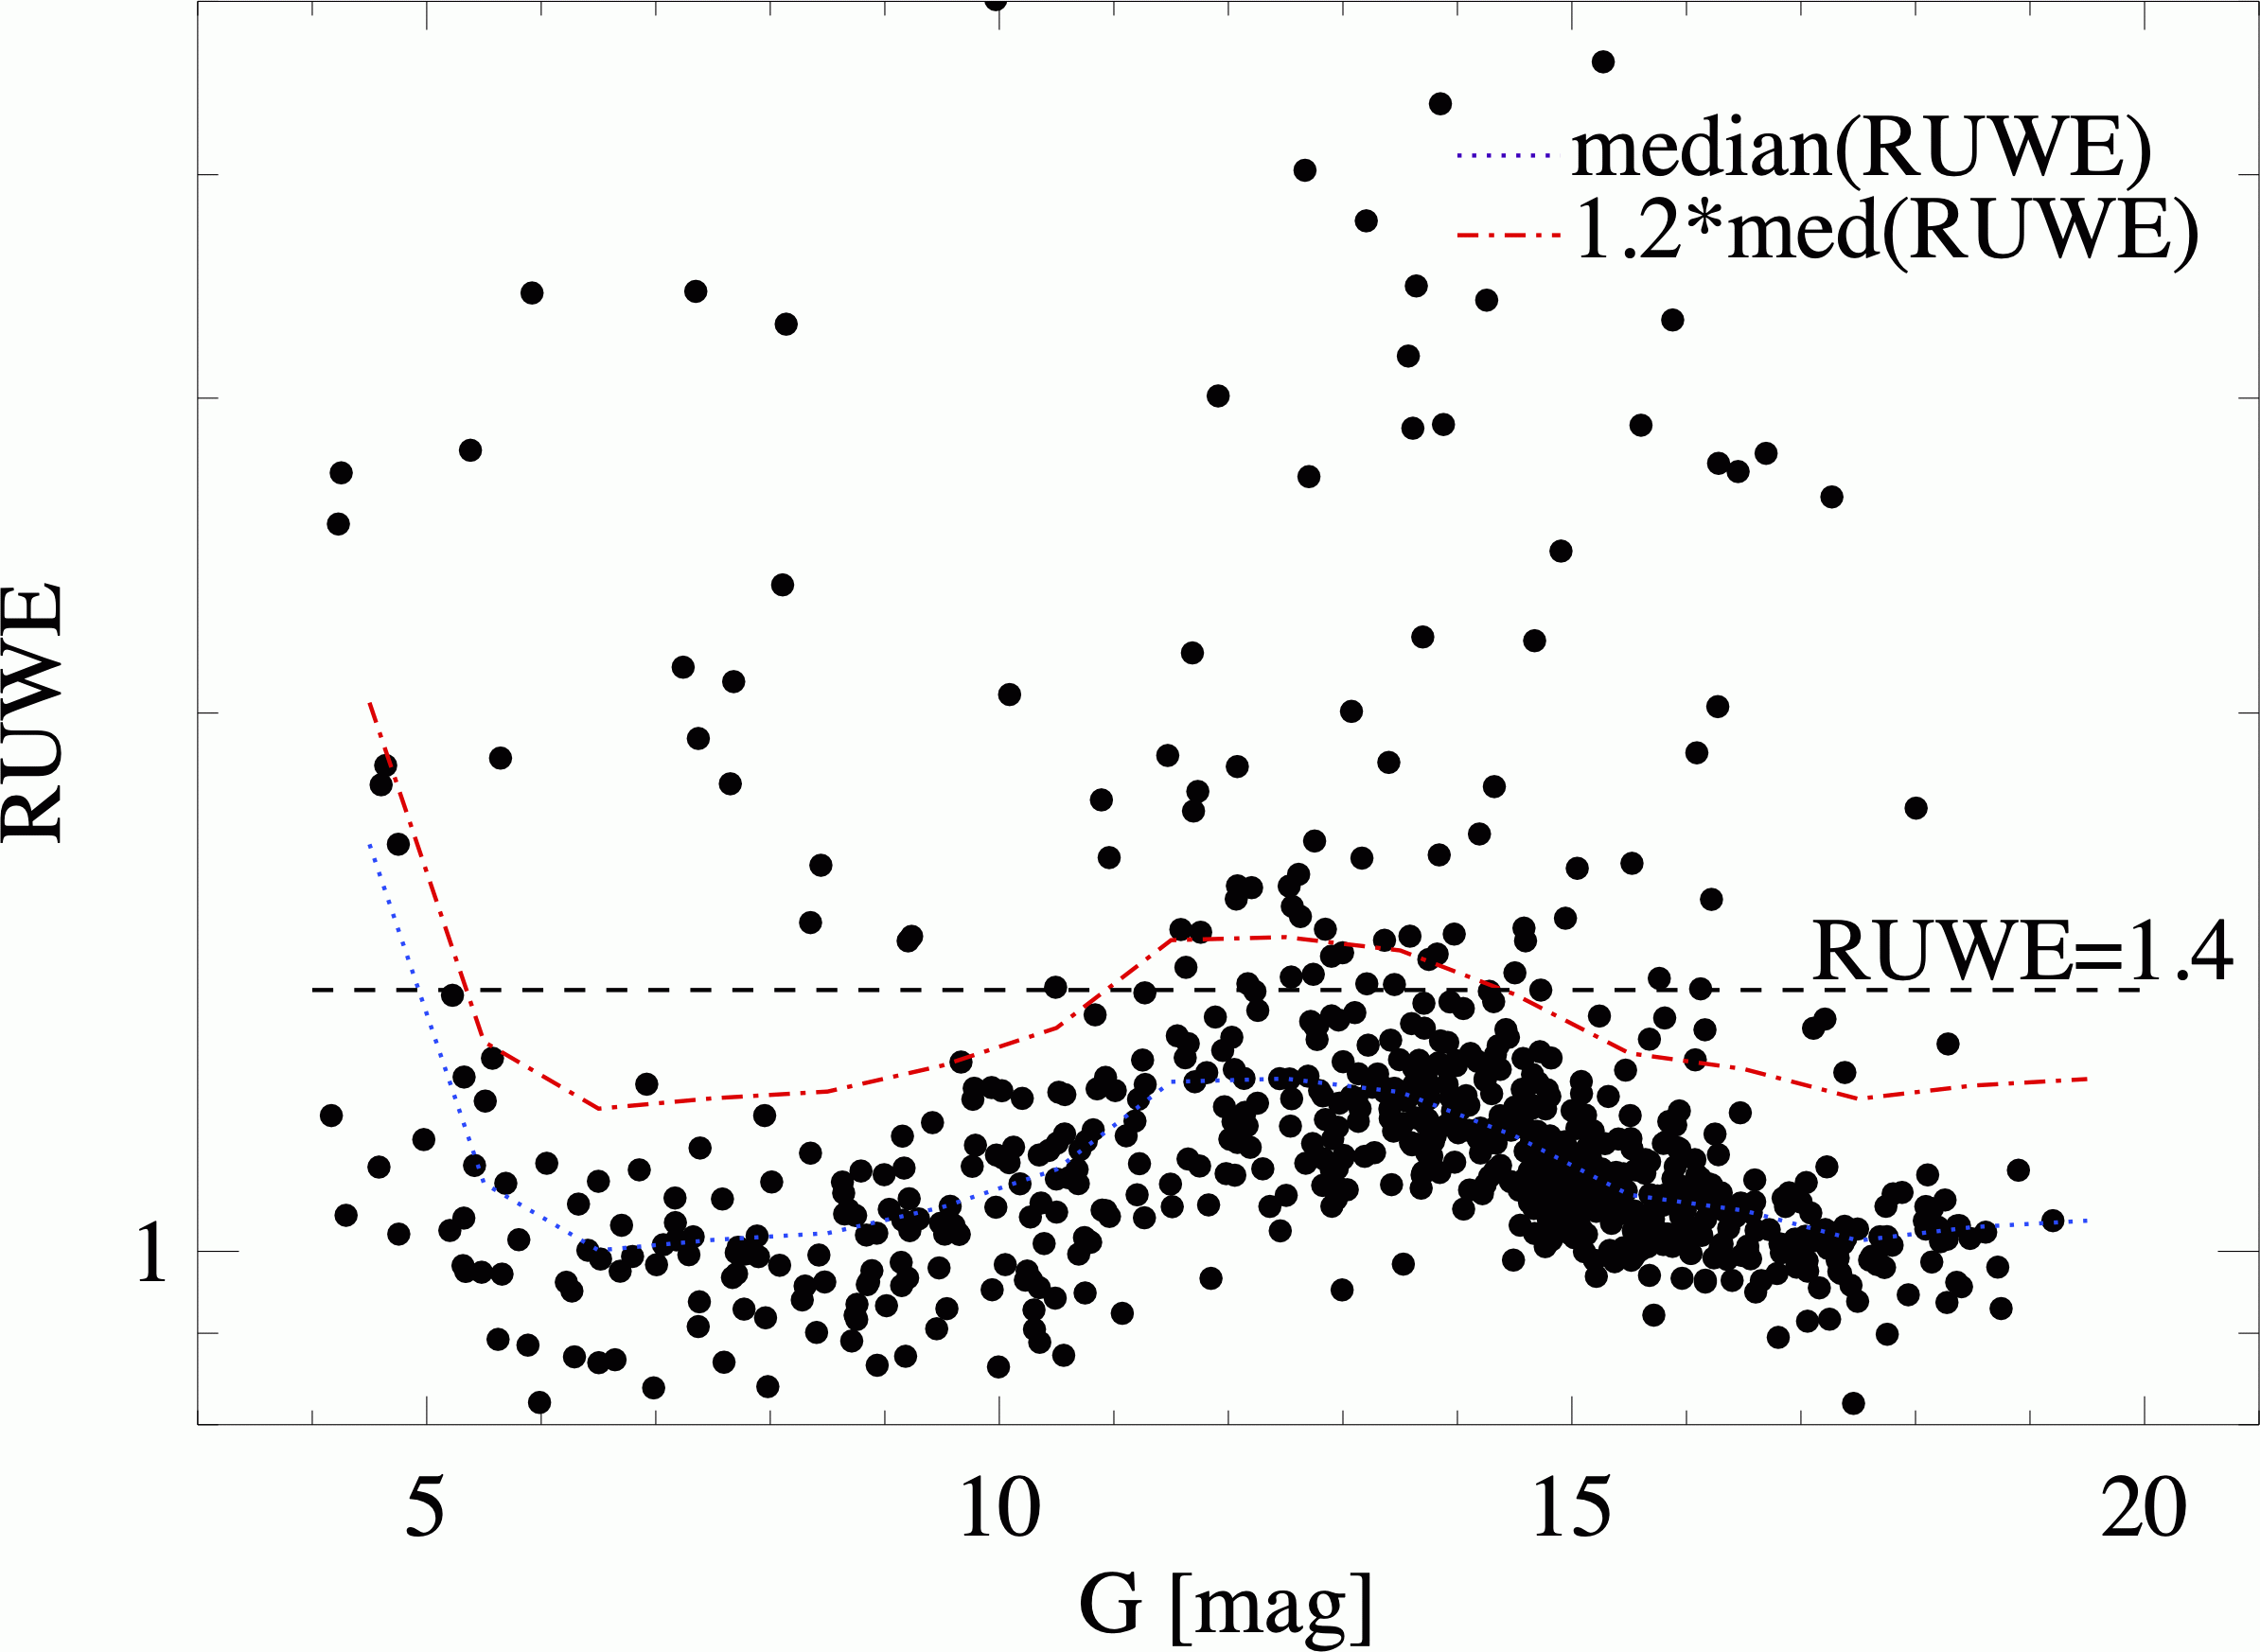
Next we use the Re-normalized Unit Weight Error (RUWE, see GAIA-Collaboration (2020); Lindegren et al. (2021)) to classify stars with RUWE1.4 as bonafide single stars. The sensitivity of the astrometric selection varies with projected separation, orbital period, and mass ratio of the binaries. Very close binaries, e.g., are in general not identified by the RUWE selection. In a color-absolute magnitude diagram, though, binaries composed of two main sequence stars stand out as being brighter sources located above and potentially redwards of the single star main sequence (see, e.g., Elson et al. (1998)). Similary, binaries composed of a main-sequence star and a white dwarf (such as HZ 9, see below) would be located bluewards (and below) of the single star main sequence. In order to reject these sources from the sequence of bonafide single stars, we iteratively fitted an 8th order polynomial and applied sigma-clipping at the 3 level in a color-absolute magnitude diagram to all sources classified to have good photometry, and with RUWE 1.4. After the convergence of the iterative process, the majority of the sources on the binary sequence are flagged as likely binaries.
Golovin et al. (2023) discuss that the distinction between likely binary and multiple systems and bonafide single stars at RUWE = 1.4 irrespective of G band magnitude or BP - RP color might introduce a bias in terms of sample completeness. For the Hyades sample, though, the effect is small. Using, e.g., 1.2 times the sliding window median value of RUWE as function of G as the dividing line would add 3 stars with G5 mag and 8 stars with 10.5G14.5 mag to – and remove 10 stars with G15 mag from – our sample of 600 bonafide single stars (Figure 2).
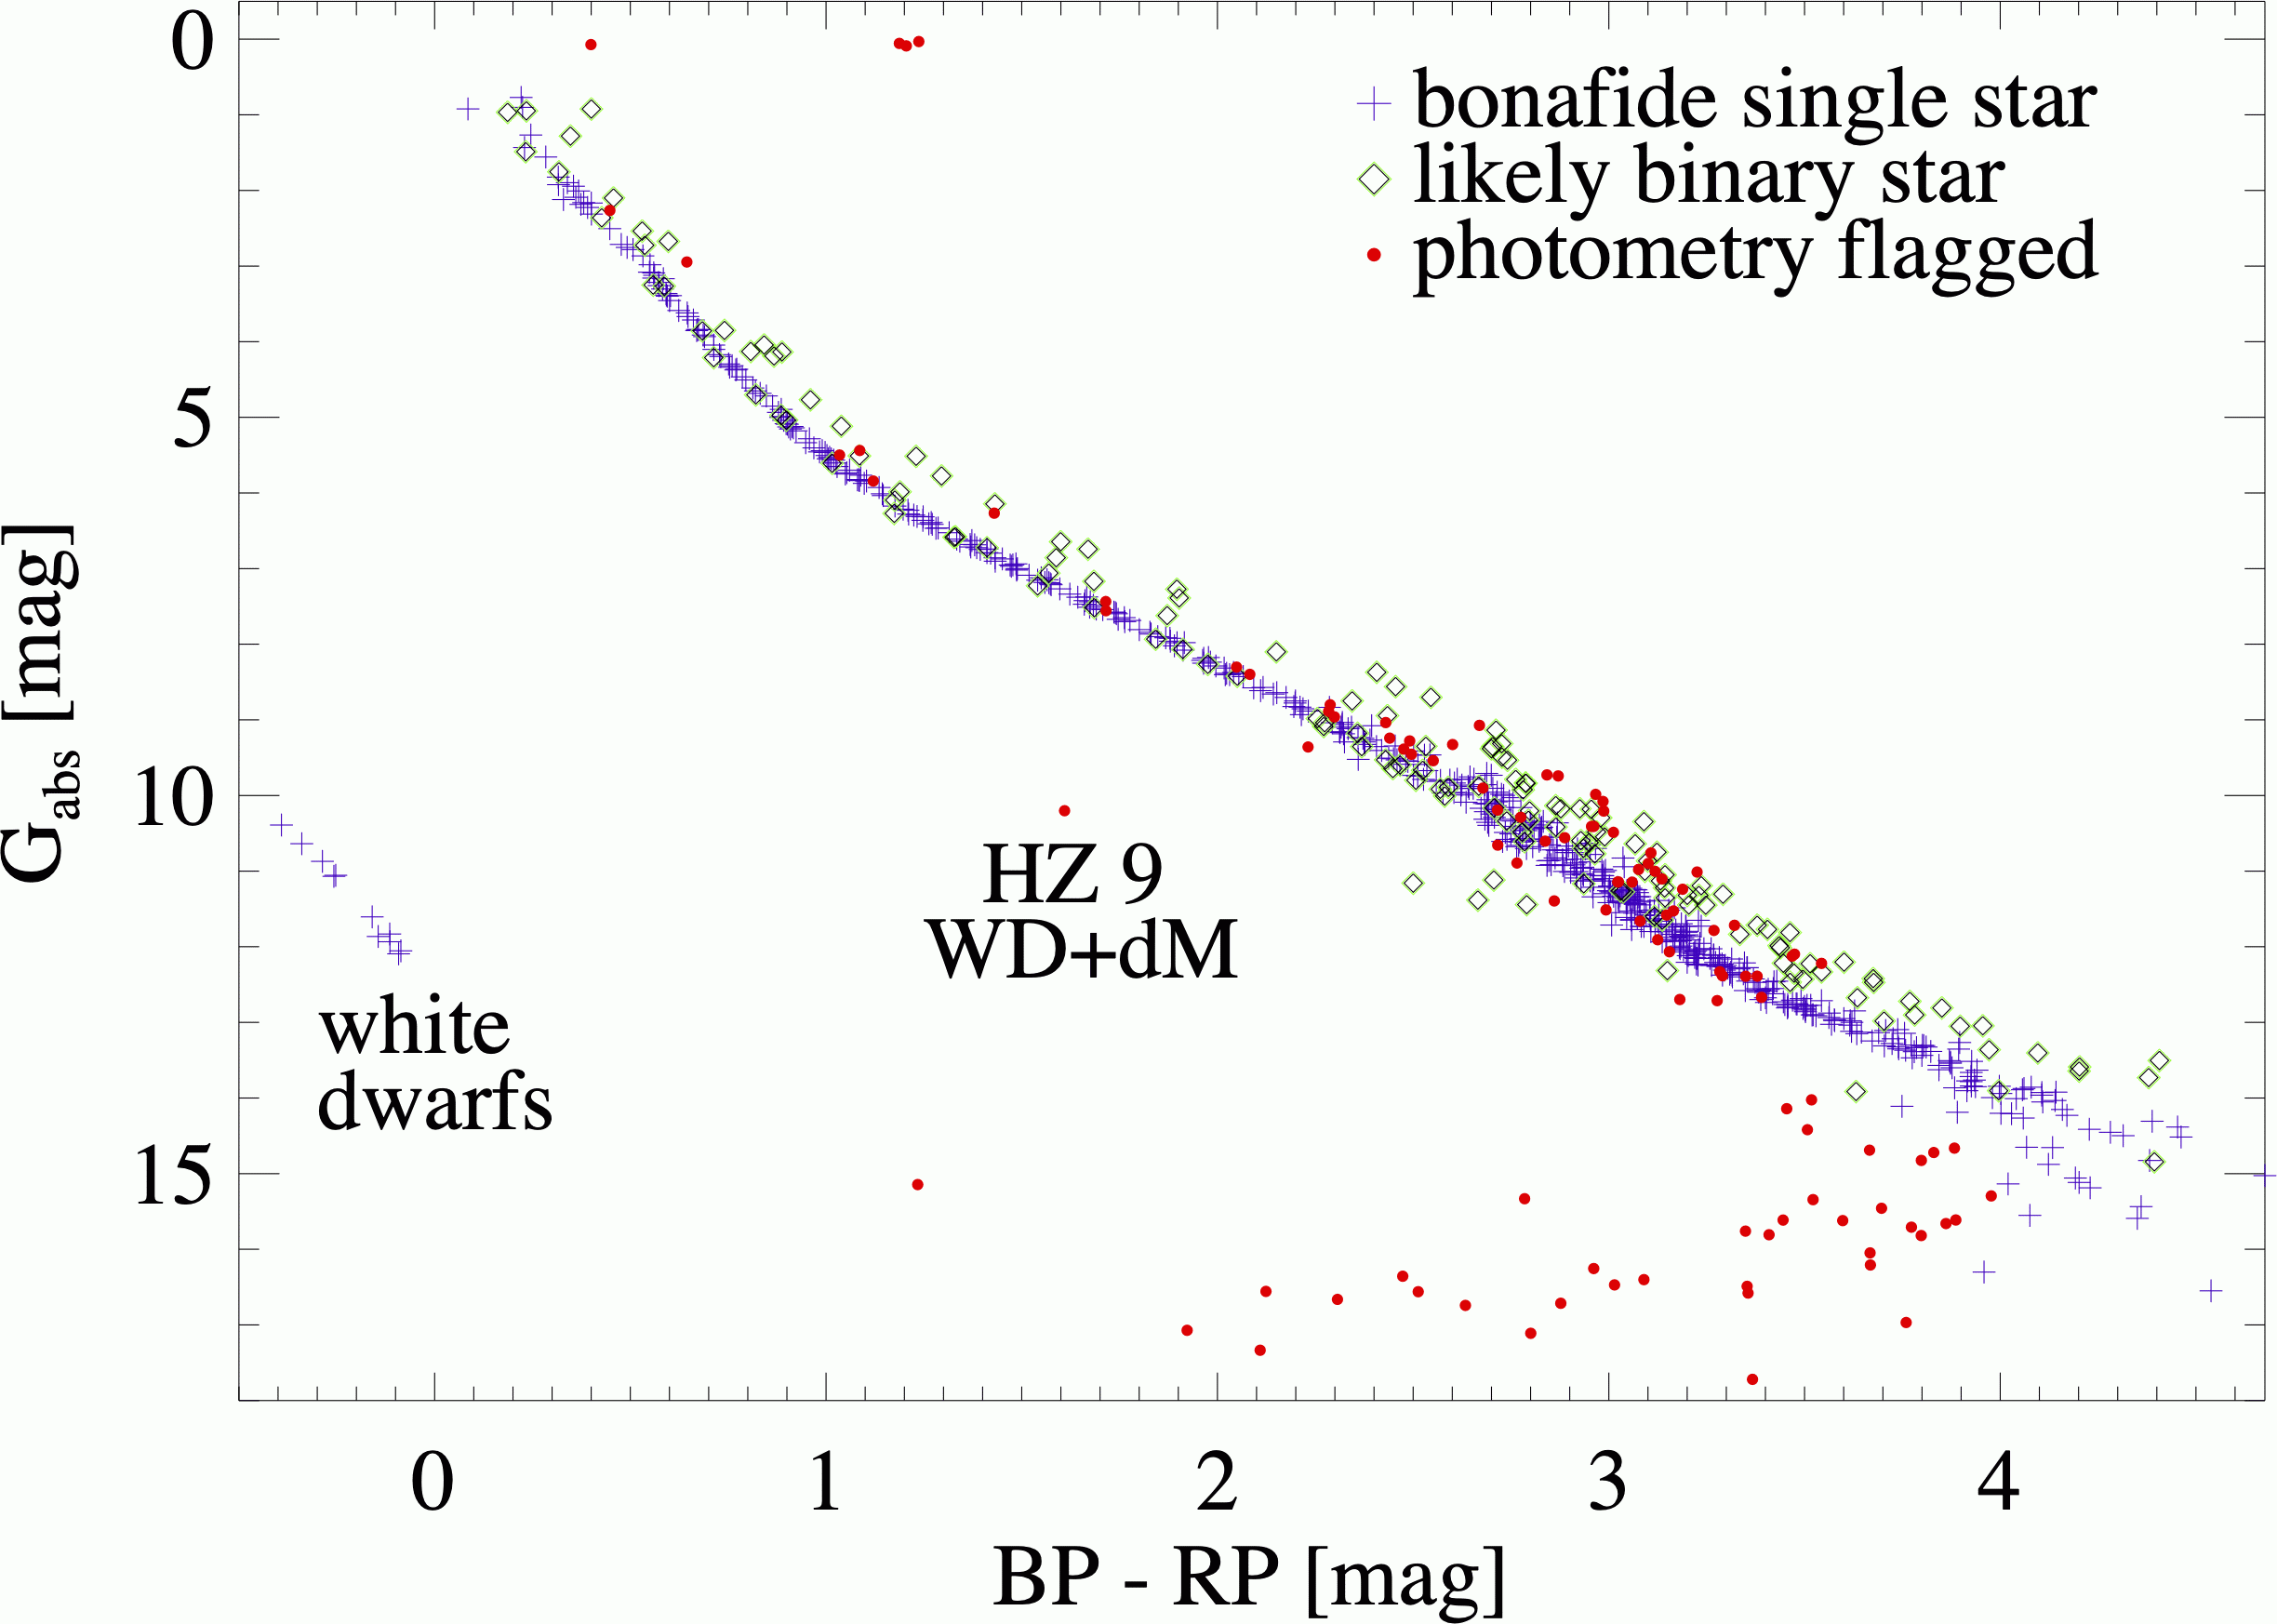
For the transformation to absolute G magnitudes, we use the photgeo distance estimates from Bailer-Jones et al. (2021). In Figure 3 we show the color-absolute magnitude diagram of the Hyades after the completion of the classification process. Of the sources with good photometry, we classify 601 sources as bonafide hydrogen burning single stars, 171 sources as likely binary stars, and 11 sources as single white dwarfs with BP - RP 0 mag. The single stars form a tight and well-defined sequence with median uncertainties of = 3.3 mmag and = 4.1 mmag, which presents a factor of 20 reduction of uncertainty in absolute magnitude and color compared to Kopytova et al. (2016). In addition to the single white dwarfs, in Figure 3 we also label the post-common envelope white dwarf – mid-M dwarf binary HZ 9 (Rios-Venegas et al., 2020). This source is misclassified by our two color rejection due to its atypical composite spectral energy distribution, resulting in BP-G=0.68 mag and G-RP=0.93 mag. Nevertheless, HZ 9 would be excluded from the single star sample due to its binary nature.
3 Stellar astrophysical parameters: fitting PARSEC isochrones
Using the PARSEC version 1.2S CMD web interface222http://stev.oapd.inaf.it/cmd, we obtain families of isochrones in the Gaia DR3 photometric system. The range of age and abundance values is based on literature values from isochrone fitting to stars in the Hyades open cluster as compiled by Brandner et al. (2023), i.e. log age [yr] = 8.70 to 8.95, and [M/H] = 0.10 to 0.25. We assume an average visual extinction of A mmag (Taylor, 2006). We use minimization to identify the best fitting non-rotating PARSEC isochrones to the 80 brightest (G mag) bonafide single upper main sequence and main sequence turn-off stars, which yields age [yr] = 8.890.01, and [M/H] = 0.180.03.
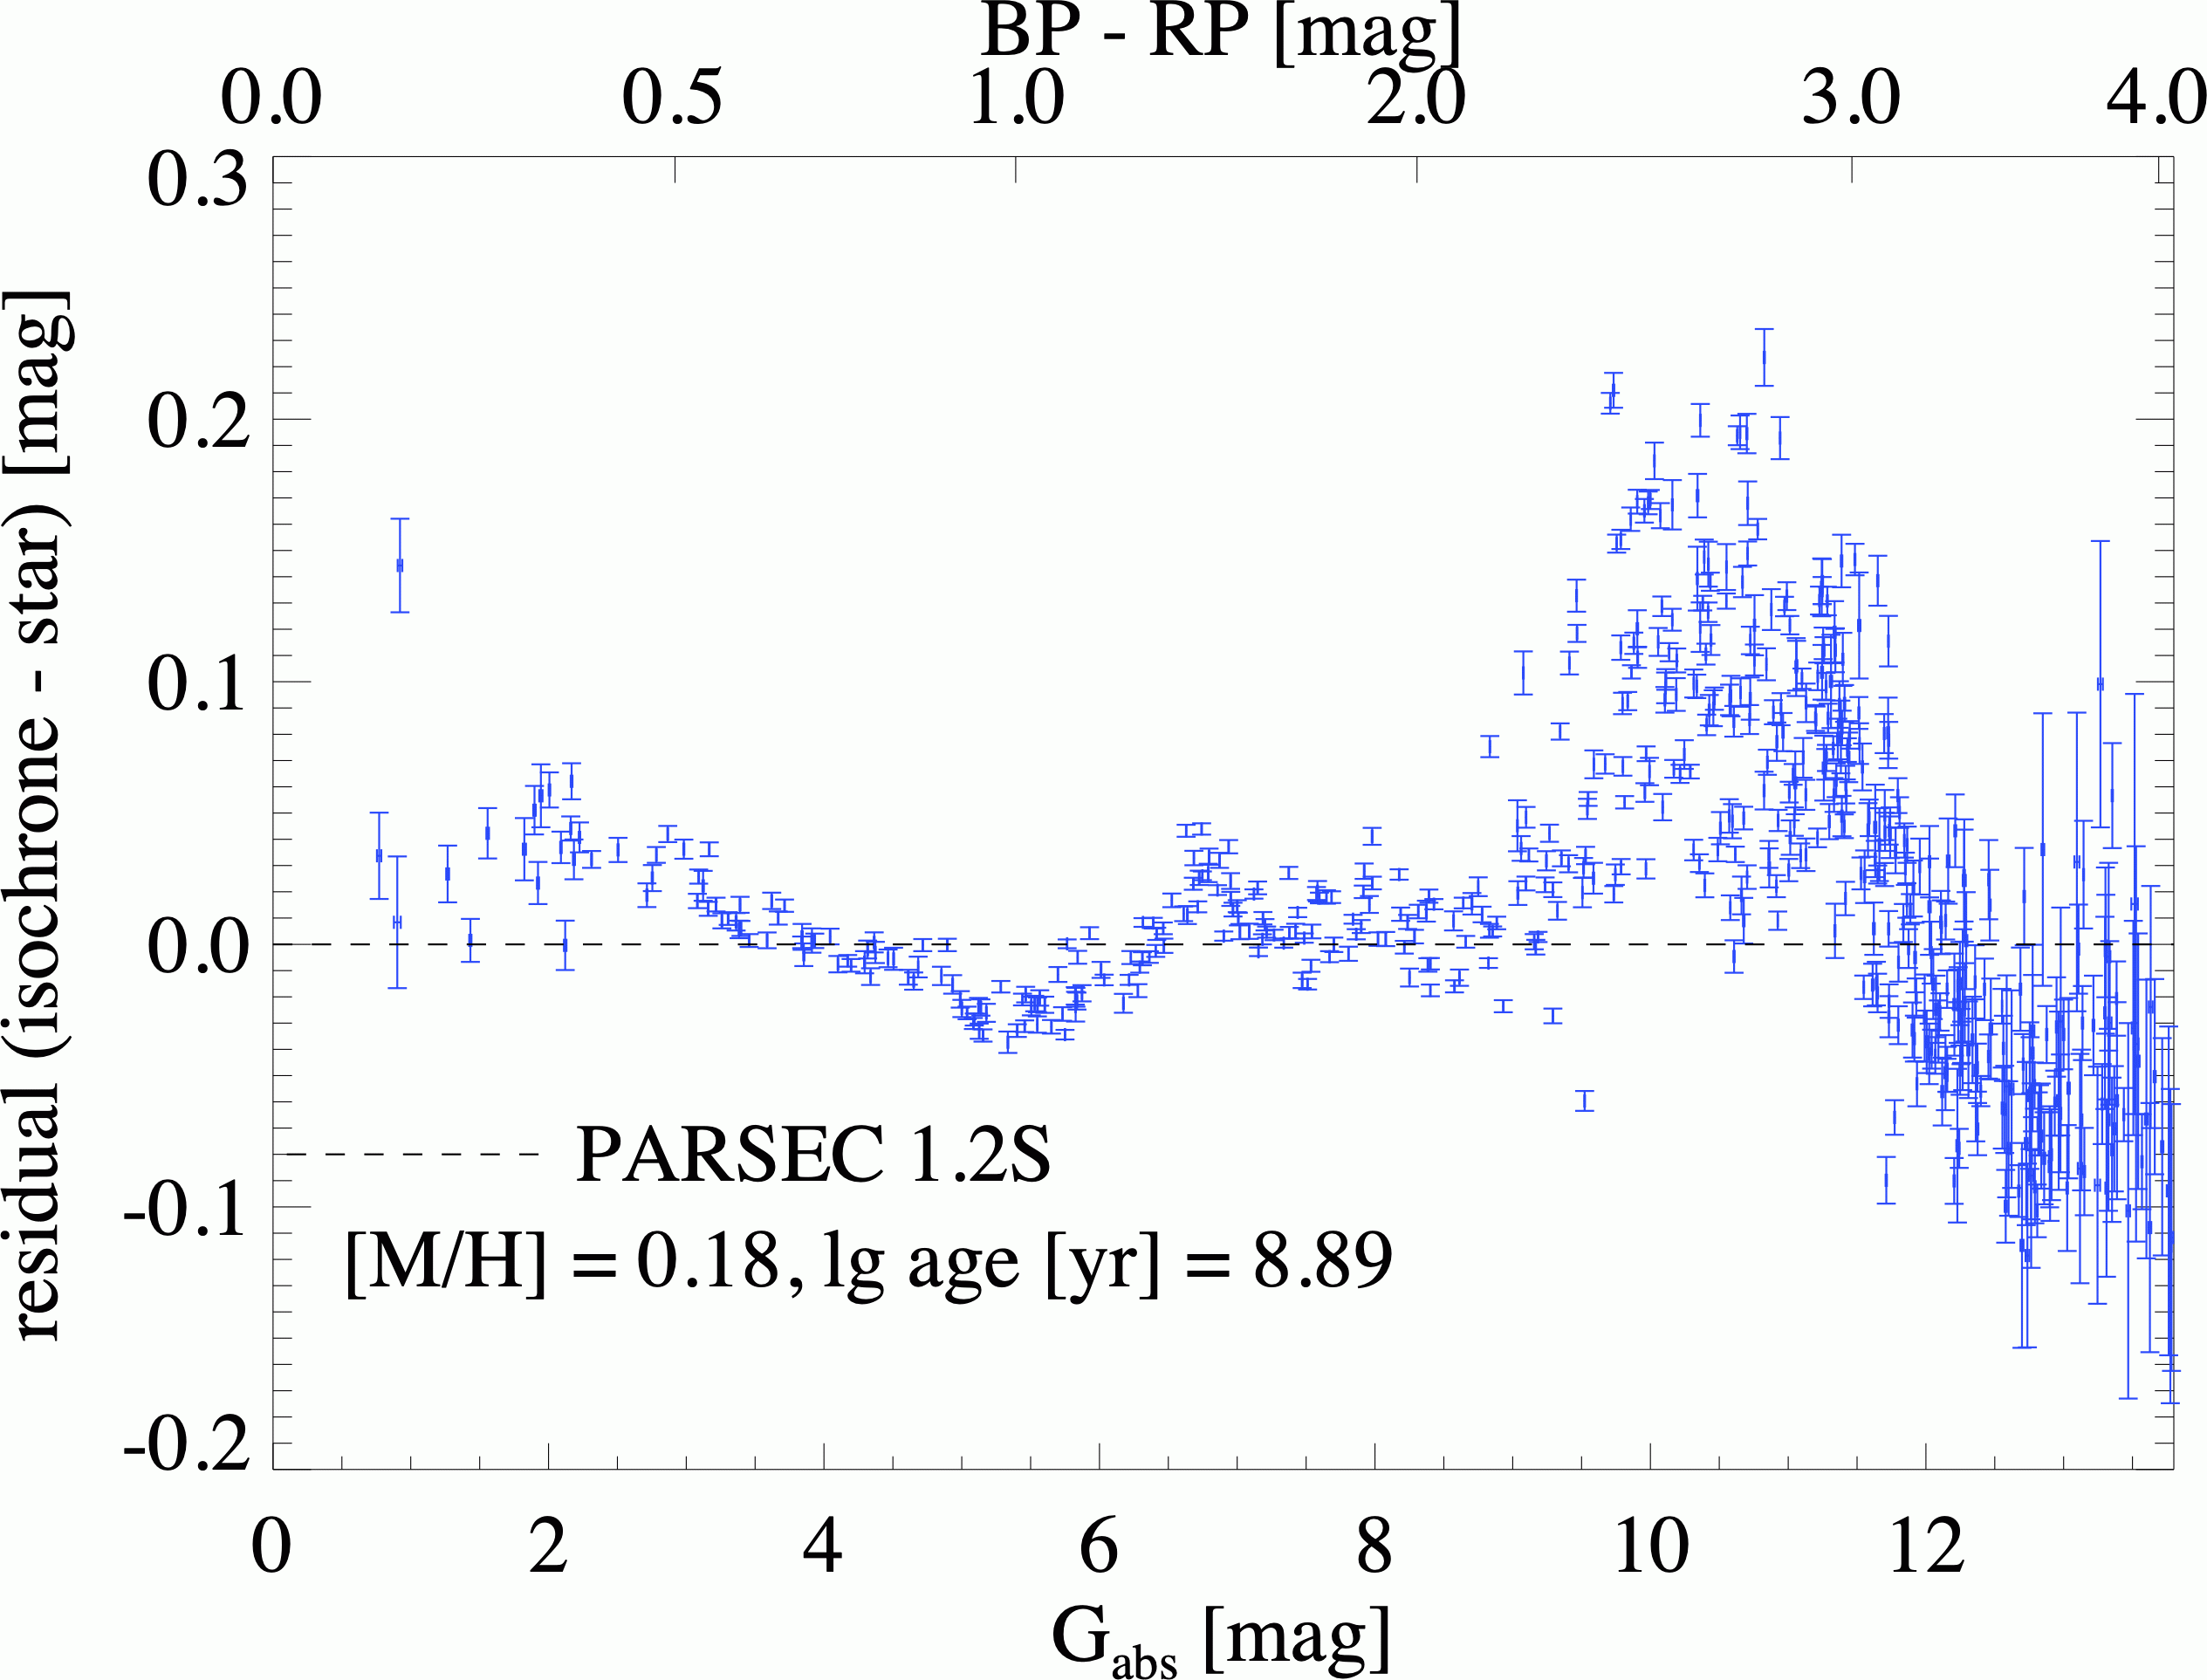
In Figure 4 we show the minimum distance in color-magnitude space of each star to the best fitting isochrone. Overall the residuals between the observed stellar sequence and the PARSEC isochrone are considerably smaller than is the case for the best fitting MESA 1.2 isochrone (Brandner et al., 2023). Noticeable is the systematic deviation for stars with 10 magG12 mag. Stars in this brightness range also exhibit a large scatter, which is not explained by the intrinsic photometric uncertainty of the Gaia DR3 measurements.
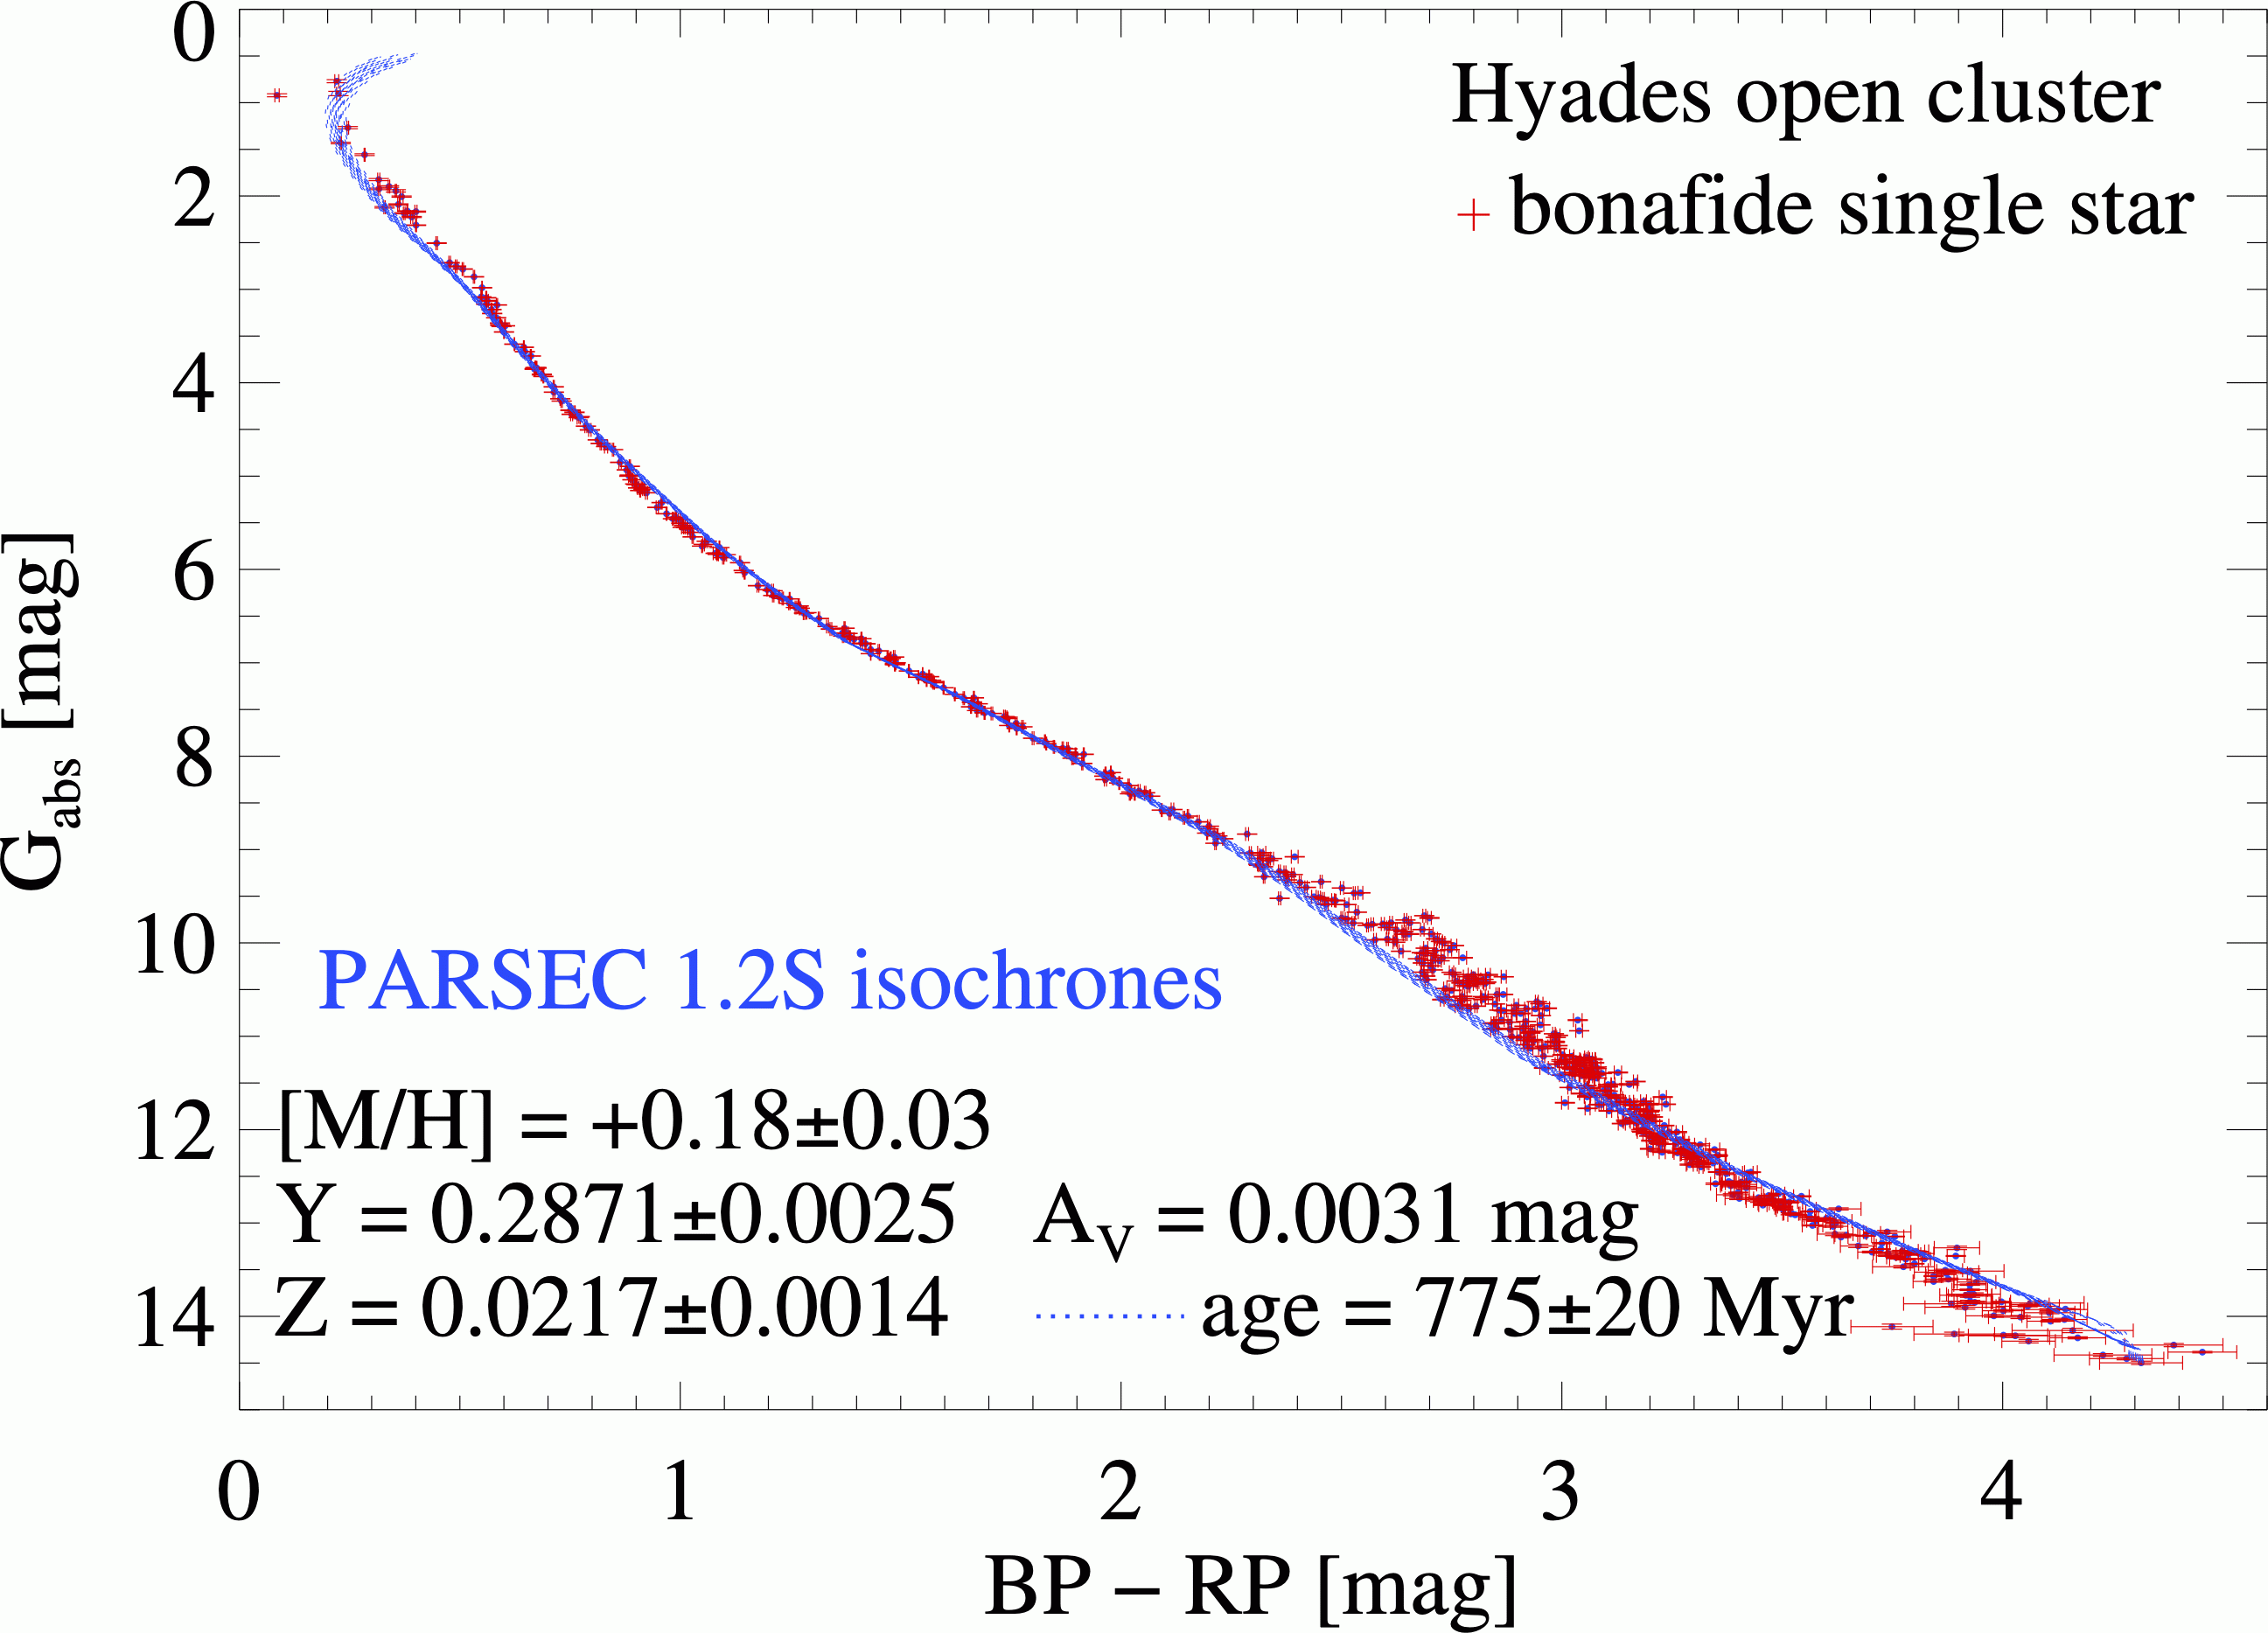
Figure 5 shows the single star main sequence of the Hyades with the family of best-fitting isochrones overplotted. We use the point of minimum distance on the isochrones to determine Teff, g, L, and (present-day) mass, and the associated uncertainties for each star, and present the results in Table 1.
| GAIA DR3 ID | RA | DEC | d | G | mass | log Teff | log L | log g | |||||||||||
|---|---|---|---|---|---|---|---|---|---|---|---|---|---|---|---|---|---|---|---|
| (deg) | (deg) | (pc) | (mag) | (M⊙) | (M⊙) | (K) | (K) | (L⊙) | (L⊙) | (cm/s2 | (cm/s2) | ||||||||
| 395696646953688448 | 0.653134 | 51.945348 | 59.611 | 10.7791 | 0.7431 | 0.0025 | 3.6508 | 0.0004 | -0.7832 | 0.0021 | 4.6464 | 0.0008 | |||||||
| 393017579491591168 | 2.016317 | 47.275403 | 64.815 | 17.0372 | 0.1691 | 0.0036 | 3.4495 | 0.0020 | -2.6195 | 0.0198 | 5.0443 | 0.0052 | |||||||
| 420637590762193792 | 2.509754 | 55.443035 | 83.610 | 18.4767 | 0.1460 | 0.0054 | 3.4278 | 0.0063 | -2.8203 | 0.0554 | 5.0717 | 0.0098 | |||||||
| 385502112574538624 | 3.829797 | 43.743120 | 42.821 | 14.3729 | 0.3025 | 0.0032 | 3.4899 | 0.0008 | -2.1138 | 0.0064 | 4.9403 | 0.0046 | |||||||
| 394413482520591744 | 4.297654 | 49.937840 | 68.621 | 16.6537 | 0.1960 | 0.0033 | 3.4621 | 0.0012 | -2.4837 | 0.0113 | 5.0242 | 0.0048 | |||||||
| 394913657235233664 | 4.962093 | 50.735753 | 65.757 | 17.0534 | 0.1703 | 0.0032 | 3.4502 | 0.0016 | -2.6123 | 0.0159 | 5.0434 | 0.0050 |
Note. — Table 1 is published in its entirety in the machine-readable format. The first six entries, and omitting some of the columns with uncertainties on the distance estimates, and part of the Gaia DR3 photometry, are shown here for guidance regarding its form and content.
4 Discussion
The inherently exquisite photometric and astrometric precision of Gaia DR3 reveals a very well defined and tight single star sequence in the Hyades. Families of PARSEC version 1.2S isochrones explain this as a stellar population with a small intrinsic spread in metallicity and age, and thus provide very accurate measurements of the absolute metallicity and age of the Hyades stellar open cluster in this frame of reference (Figure 5).
The strongest systematic deviations between observations and isochrones are in the mass range 0.22 to 0.40 M⊙, where stars are systematically brighter and/or redder than predicted by the isochrone by 0.02 to 0.2 mag, and below 0.18 M⊙, where stars are fainter and/or bluer by 0.01 to 0.1 mag. This is akin to a mismatch found between dynamical mass estimates and masses derived from isochrones for M-dwarf binaries and multiple system in the solar neighborhood, like, e.g., GJ 2060, which is a member of the 50 to 100 Myr old AB Dor moving group (Rodet et al., 2018), or 2MASS J10364483+1521394, which has an age of 400 to 600 Myr (Calissendorff et al., 2017, 2018).
For masses between 0.4 and 2 M⊙, the observed stellar sequence is in excellent agreement with the isochrones, and never deviates by more than 0.03 mag in color-brightness space. This is different from the findings by Jaehnig et al. (2019), who studied 69 presumed members of the Hyades open cluster in the mass range 0.5 to 1.0 M⊙. They report 15 stars with a radius inflation 10% with respect to a “nominal” isochrone. Seven of these 15 stars are in the GCNS sample of likely members of the Hyades. We find that two of these (2MASS J04084015+2333257, 2MASS J04115620+2338108) have problematic photometry in at least one of the Gaia photometric bands. According to Jaehnig et al. (2019) four of the remaining five stars are binary stars (2MASS J04175061+1828307, 2MASS J04181077+2317048, 2MASSJ04322565+1306476, 2MASSJ 04491296+2448103). Gaia DR3 detects evidence for orbital motion (i.e. RUWE1.4) in 2MASS J04175061+1828307 and 2MASS J04491296+2448103. In Brandner et al. (2023) we flag 2MASS J04235070+0912193 as a probably binary stars due to its location on the binary sequence. Jaehnig et al. (2019) assign a radius inflation of R/R6.6% to this star. Observations at high angular resolution, possibly combined with radial velocity monitoring could help to decipher the true nature of this star, i.e. if it is an actual single star subject to radius inflation, or a close, thus far unresolved binary star.
While the PARSEC isochrones overall provide a considerable better fit to the Hyades single star sequence than, e.g., the MESA 1.2 isochrones, we note some caveats:
i) PARSEC version 1.2S does not consider stellar rotation. Stellar rotation should affect in particular the upper main sequence and main-sequence turn-off region in the Hyades, which is the region also most sensitive to the isochronal age.333Gossage et al. (2018) find that MESA models considering rotation result in lower effective temperature due to gravity darkening. When fitting MESA isochrones in the TYCHO photometric system to the Hyades, they derive a lower age estimate for the models with than for the non-rotating models. For the majority of the stars in our sample, the effect on the determined astrophysical parameters should be minimal. We note that stellar rotation is considered in the PARSEC evolutionary tracks and isochrones starting with version 2.0. However, at the time the present research was carried out, PARSEC version 2.0 was limited to , which is below the canonical metal abundance estimates for the Hyades.
ii) the [He/H] abundance in the PARSEC models follows the solar-scaled Y=0.2485+1.78Z relation, while there is some evidence in the literature for a super-solar He abundance, see, e.g., the discussion in Tognelli et al. (2021). A consequence of an underestimate of the He abundance would be an underestimate of the energy production for lower mass Hyades members, which still remember their primordial He abundance (i.e. these stars should not yet have reached perfect equilibrium on the p-p I 3He chain of nuclear fusion, see, e.g., Baraffe & Chabrier (2018)).
iii) the astrometric and photometric identification of likely binary and multiple system is most efficient for approximately equal brightness and equal mass systems, i.e. systems with mass ratios 0.5 (see, e.g., Elson et al. (1998)). More extreme brightness and mass ratio binary systems should still be present in our sample.
iv) our sample is ignorant about stellar activity and variability, and individual extinction for each star. Here multi-wavelength SED fitting, as might be facilitated by the next generation of space-based infrared surveys like Euclid and Roman, should provide vastly improved characterizations.
Despite these limitations, the sample should be useful for a multitude of applications like benchmarking stellar evolutionary models, or the testing and verification of the calibration of large surveys such as the Gaia Astrophysical Parameters Inference System (APSIS, see, e.g., Fouesneau et al. (2023)). The table with astrophysical properties of 600 bonafide single stars in the Hyades could also be useful to calibrate, e.g., different spectroscopic surveys with little or no internal overlap in their samples, against each other by using sources in common with our sample as a reference. The sample also provides a homogeneous characterisation of the exoplanet hosts in the Hyades open cluster (see, e.g., Mann et al. (2016, 2018); Ciardi et al. (2018); Livingston et al. (2018); Vanderburg et al. (2018)), which facilitates a differential comparison of exoplanet properties in an open cluster.
For stars in the mass range exhibiting radius anomalies, a more detailed study of rotation periods and activity levels is required. This might reveal insights into the stellar structure, and could probe the region susceptible to the convective kissing instability (van Saders & Pinsonneault, 2012; Baraffe & Chabrier, 2018; Mansfield & Kroupa, 2021, 2022).
References
- Bailer-Jones et al. (2021) Bailer-Jones, C. A. L., Rybizki, J., Fouesneau, M., Demleitner, M., & Andrae, R. 2021, AJ, 161, 147, doi: 10.3847/1538-3881/abd806
- Baraffe & Chabrier (2018) Baraffe, I., & Chabrier, G. 2018, A&A, 619, A177, doi: 10.1051/0004-6361/201834062
- Bovy (2016) Bovy, J. 2016, ApJ, 817, 49, doi: 10.3847/0004-637X/817/1/49
- Brandner et al. (2023) Brandner, W., Calissendorff, P., & Kopytova, T. 2023, MNRAS, 518, 662, doi: 10.1093/mnras/stac2247
- Bressan et al. (2012) Bressan, A., Marigo, P., Girardi, L., et al. 2012, MNRAS, 427, 127, doi: 10.1111/j.1365-2966.2012.21948.x
- Calissendorff et al. (2017) Calissendorff, P., Janson, M., Köhler, R., et al. 2017, A&A, 604, A82, doi: 10.1051/0004-6361/201730725
- Calissendorff et al. (2018) —. 2018, A&A, 618, C6, doi: 10.1051/0004-6361/201730725e
- Castellani et al. (2001) Castellani, V., Degl’Innocenti, S., & Prada Moroni, P. G. 2001, MNRAS, 320, 66, doi: 10.1046/j.1365-8711.2001.03958.x
- Chen et al. (2014) Chen, Y., Girardi, L., Bressan, A., et al. 2014, MNRAS, 444, 2525, doi: 10.1093/mnras/stu1605
- Choi et al. (2016) Choi, J., Dotter, A., Conroy, C., et al. 2016, ApJ, 823, 102, doi: 10.3847/0004-637X/823/2/102
- Ciardi et al. (2018) Ciardi, D. R., Crossfield, I. J. M., Feinstein, A. D., et al. 2018, AJ, 155, 10, doi: 10.3847/1538-3881/aa9921
- Dotter (2016) Dotter, A. 2016, ApJS, 222, 8, doi: 10.3847/0067-0049/222/1/8
- Elson et al. (1998) Elson, R. A. W., Sigurdsson, S., Davies, M., Hurley, J., & Gilmore, G. 1998, MNRAS, 300, 857, doi: 10.1046/j.1365-8711.1998.01948.x
- Fouesneau et al. (2023) Fouesneau, M., Frémat, Y., Andrae, R., et al. 2023, A&A, arXiv:2206.05992, doi: 10.1051/0004-6361/202243919
- GAIA-Collaboration (2020) GAIA-Collaboration. 2020, Gaia eDR3 source catalogue ”light”, VO resource provided by the GAVO Data Center. https://dc.zah.uni-heidelberg.de/tableinfo/gaia.edr3lite
- Gaia Collaboration et al. (2021) Gaia Collaboration, Smart, R. L., Sarro, L. M., et al. 2021, A&A, 649, A6, doi: 10.1051/0004-6361/202039498
- Gentile Fusillo et al. (2021) Gentile Fusillo, N. P., Tremblay, P. E., Cukanovaite, E., et al. 2021, MNRAS, 508, 3877, doi: 10.1093/mnras/stab2672
- Girardi et al. (2002) Girardi, L., Bertelli, G., Bressan, A., et al. 2002, A&A, 391, 195, doi: 10.1051/0004-6361:20020612
- Golovin et al. (2023) Golovin, A., Reffert, S., Just, A., et al. 2023, A&A, arXiv:2211.01449, doi: 10.1051/0004-6361/202244250
- Gossage et al. (2018) Gossage, S., Conroy, C., Dotter, A., et al. 2018, ApJ, 863, 67, doi: 10.3847/1538-4357/aad0a0
- Jaehnig et al. (2019) Jaehnig, K., Somers, G., & Stassun, K. G. 2019, ApJ, 879, 39, doi: 10.3847/1538-4357/ab21cf
- Jeffery et al. (2022) Jeffery, E. J., Taylor, B. J., & Joner, M. D. 2022, ApJ, 936, 153, doi: 10.3847/1538-4357/ac8474
- Jeffries (2017) Jeffries, R. D. 2017, Mem. Soc. Astron. Italiana, 88, 637. https://arxiv.org/abs/1709.01736
- Kopytova et al. (2016) Kopytova, T. G., Brandner, W., Tognelli, E., et al. 2016, A&A, 585, A7, doi: 10.1051/0004-6361/201527044
- Krumholz & McKee (2020) Krumholz, M. R., & McKee, C. F. 2020, MNRAS, 494, 624, doi: 10.1093/mnras/staa659
- Kudryavtseva et al. (2012) Kudryavtseva, N., Brandner, W., Gennaro, M., et al. 2012, ApJ, 750, L44, doi: 10.1088/2041-8205/750/2/L44
- Lindegren et al. (2021) Lindegren, L., Klioner, S. A., Hernández, J., et al. 2021, A&A, 649, A2, doi: 10.1051/0004-6361/202039709
- Livingston et al. (2018) Livingston, J. H., Dai, F., Hirano, T., et al. 2018, AJ, 155, 115, doi: 10.3847/1538-3881/aaa841
- Magrini et al. (2017) Magrini, L., Randich, S., Kordopatis, G., et al. 2017, A&A, 603, A2, doi: 10.1051/0004-6361/201630294
- Mann et al. (2016) Mann, A. W., Gaidos, E., Mace, G. N., et al. 2016, ApJ, 818, 46, doi: 10.3847/0004-637X/818/1/46
- Mann et al. (2018) Mann, A. W., Vanderburg, A., Rizzuto, A. C., et al. 2018, AJ, 155, 4, doi: 10.3847/1538-3881/aa9791
- Mansfield & Kroupa (2021) Mansfield, S., & Kroupa, P. 2021, A&A, 650, A184, doi: 10.1051/0004-6361/202140536
- Mansfield & Kroupa (2022) —. 2022, A&A, 661, C1, doi: 10.1051/0004-6361/202140536e
- Marigo et al. (2008) Marigo, P., Girardi, L., Bressan, A., et al. 2008, A&A, 482, 883, doi: 10.1051/0004-6361:20078467
- Parmentier et al. (2014) Parmentier, G., Pfalzner, S., & Grebel, E. K. 2014, ApJ, 791, 132, doi: 10.1088/0004-637X/791/2/132
- Riello et al. (2021) Riello, M., De Angeli, F., Evans, D. W., et al. 2021, A&A, 649, A3, doi: 10.1051/0004-6361/202039587
- Rios-Venegas et al. (2020) Rios-Venegas, C., Contreras-Quijada, A., Vogt, N., et al. 2020, MNRAS, 493, 1197, doi: 10.1093/mnras/staa331
- Rodet et al. (2018) Rodet, L., Bonnefoy, M., Durkan, S., et al. 2018, A&A, 618, A23, doi: 10.1051/0004-6361/201832924
- Taylor (2006) Taylor, B. J. 2006, AJ, 132, 2453, doi: 10.1086/508610
- Tognelli et al. (2021) Tognelli, E., Dell’Omodarme, M., Valle, G., Prada Moroni, P. G., & Degl’Innocenti, S. 2021, MNRAS, 501, 383, doi: 10.1093/mnras/staa3686
- van Saders & Pinsonneault (2012) van Saders, J. L., & Pinsonneault, M. H. 2012, ApJ, 751, 98, doi: 10.1088/0004-637X/751/2/98
- Vanderburg et al. (2018) Vanderburg, A., Mann, A. W., Rizzuto, A., et al. 2018, AJ, 156, 46, doi: 10.3847/1538-3881/aac894
- Williams et al. (2022) Williams, B. A., Walker, D. L., Longmore, S. N., et al. 2022, MNRAS, 514, 578, doi: 10.1093/mnras/stac1378