Two Different Weak Modulations in ab-type RR Lyrae Variable V838 Cyg, and Potential Influence of Metal Abundance on Blazhko Modulation
Abstract
Noting the weakest modulation and relatively high metal abundance of the ab-type RR Lyrae star V838 Cyg, we collected the photometric data of this star from several sky surveys to carry out an in-depth analysis. The diagram shows that the pulsation period of V838 Cyg increases linearly over a long timescale. In a reanalysis of the high-precision data, we confirmed the modulation with a period of days found by Benkő et al., (2014), and also found an additional weak modulation with a longer period ( days). After a series of analyses, we incline to the view that the mechanisms causing the two modulations are different: the former is more similar to the typical Blazhko effect, while the mechanism leading to the latter may be an extrinsic factor. We also collected and compared the modulation and physical parameters of other Blazhko RR Lyrae stars from several works in the literature, and find that there is a potential negative correlation between the modulation amplitude (or upper limit of amplitude) and the metal abundance. We infer that the relatively high metal abundance will promote convection in the outer stellar atmosphere, and then inhibit those factors (turbulence, shock wave, etc.) that may cause Blazhko modulation. Future observations and research work can be carried out with reference to this viewpoint. We also introduce the moiré effects that appear in the long-cadence light curves and their possible interference in the previous analyses.
1 Introduction
RR Lyrae stars are short-period pulsating variables in the evolutionary stage of the horizontal branch (HB), generally with pulsation periods of 0.2 - 1.2 days and pulsation amplitudes of 0.2 - 1 mag in the band. Because of these pulsating characteristics, they are easy to identify in observations. In fact, RR Lyrae stars have been discovered for more than 100 years, and have a long history of research and systematic achievements (Smith, 2004). In the recently released Gaia DR3 catalog, scientists have provided up to 270,000 RR Lyrae stars located in the Milky Way and nearby galaxies (Gaia Collaboration, 2022). Due to their wide distribution and large number, RR Lyrae stars are often used as probes to study the chemical, evolutionary, and dynamical properties of old low-mass stars in the Milky Way (Smith, 2004).
However, in the field of RR Lyrae stars, there has always been an important feature of observations and research, that is, the Blazhko effect (Blažko, 1907) and the dominant physical mechanism behind it. Most RR Lyrae stars are single-mode pulsating variables: the ab type of RR Lyrae stars (RRab stars) dominated by the fundamental mode or the c type (RRc stars) dominated by the first overtone mode. In the observations, the light curves of some RR Lyrae stars show good stability, but a considerable number of stars show phenomena similar to the amplitude and frequency modulations in radio technology (Benkő et al., 2011), which are specifically manifested as periodic or quasi-periodic changes of pulsation parameters over time with periods from a few days to hundreds of days (Kolenberg, 2008). With the acquisition of ground-based and space-based photometric data in recent years (especially the mission, Borucki et al. 2010; Koch et al. 2010), some discoveries have been made from the perspective of observation, including the conclusion that about 40% - 50% of the Galactic RRab stars exhibit the Blazhko effect (Jurcsik et al., 2009; Nemec et al., 2013; Prudil & Skarka, 2017). Of course, there are also studies that suggest that more than 90% of RR Lyrae stars have additional components in the frequency spectrum of the light curves (Kovacs, 2018, 2021). This difference in the rate of incidence should be caused by different definitions of the Blazhko effect. As a macroscopic phenomenon, stellar pulsation is affected by a variety of factors throughout the process. When the observational accuracy is high enough, all RR Lyrae stars should be found to have additional oscillation and modulation components. Our viewpoint is to limit the Blazhko effect to those modulations that exhibit periodicity or quasi-periodicity. Otherwise, arbitrarily expanding the definition will cause the research to lose its pertinence.
Several theoretical models have been proposed to explain the Blazhko effect, but no consensus has been reached so far (Bryant, 2015). Perhaps it is valuable to find more clues and summarize more patterns from observations (Le Borgne et al., 2012; Skarka et al., 2020). Some works have been done on the statistical analysis of pulsation parameters and Blazhko modulation parameters. Jurcsik et al. (2005) studied the relationship between the modulation amplitude and pulsation frequency of Blazhko stars, and found that both the modulation amplitude and the pulsation amplitude increased with decreasing of the pulsation period.
Metal abundance is one of the most important parameters in stellar evolution. In the study of HB stars in globular clusters, metal abundance is the first factor affecting HB morphology (the ’first parameter’, Sandage & Wallerstein 1960). Metal abundance is also very important in the field of RR Lyrae stars. It is associated with absolute magnitude: metal-poor RR Lyrae stars are brighter and more massive (Bono et al., 2007; Sandage, 2010). Metal abundance is also related to pulsation characteristics (i.e., the - - [Fe/H] relation, see Mullen et al. 2021, 2022, and references therein). Some works have also accumulated on whether there is a relationship between metal abundance and the Blazhko effect. Szeidl (1976) found that the proportion of Blazhko RRab stars increased with , and pointed out that the Blazhko stars generally have rather low metal abundance. Smith (2004) compared the distribution of metal abundance in Blazhko RRab stars with the distribution of bright RRab stars, and concluded that ”No trend in prevalence of the Blazhko effect as a function of metallicity is evident in this comparison.” Smolec (2005) studied the Blazhko RRab stars in the Galactic bulge and the Large Magellanic Cloud, and found that the photometric metal abundance distributions of non-Blazhko and Blazhko variables are similar, and the difference in metal abundance cannot explain the rate of incidence of modulation that occurs in the two systems. Based on the studies on RR Lyrae stars in the field, Benkő & Szabó (2015) have noticed that there seems to be some relationship between the metal abundance and the amplitude of modulation, but did not carry out further research. Skarka et al. (2020) found that the possible range of modulation amplitudes decreases with increasing pulsation period and deduced that the Blazhko effect was suppressed in more metal-poor RR Lyrae stars. It can be seen that, from the perspective of observation, researchers do not have a unified view and understanding of the correlation between metal abundance and Blazhko modulation.
V838 Cyg had been examined at the Maria Mitchell Observatory for about 50 years (Sands, 1978). A total of 70 times of light maximum were available in the GEOS database111http://rr-lyr.irap.omp.eu/dbrr/. Based on these these data and data, Nemec et al. (2011) obtained the long-term rate of change of period of V838 Cyg: 0.05(4) day Myr-1. At first, V838 Cyg was considered as a non-Blazhko RRab star (Benkő et al., 2010; Nemec et al., 2011), but Nemec et al. (2013) found that this variable star exhibited amplitude and frequency modulations with the lowest range, and identified it as a Blazhko star. In addition, they further pointed out that there is a variation in the modulation period, from 47, 54 to 64 days. Benkő et al. (2014) used an independent method to detect this weak amplitude modulation with a period of 59.5 days, and also pointed out that V838 Cyg shows the period doubling phenomenon (Kolenberg et al., 2010; Szabó et al., 2010) and the second radial overtone mode . In addition, the metal abundance of V838 Cyg is the largest among all Blazhko RRab stars in the field ([M/H] = -1.01, Nemec et al. 2013). Noting these characteristics, we use the photometric data collected from different sky surveys to conduct targeted analysis on V838 Cyg, and try to find some relevant indications. In Section 2, we present the photometric data from different sky surveys, including ground-based and space-based data. We describe the detailed analysis in Section 3, and provide the corresponding discussions in Section 4. We discuss the moiré patterns in the long-cadence light curves and their influence on and interference in the analyses in Section 5. The potential relationship between metal abundance and modulations is discussed in Section 6. In Section 7, we present our summary.
2 Light curves from sky surveys
We collect the photometric data of V838 Cyg from several sky survey projects, including the ground data provided by SWASP and ASAS-SN, and the space data from and TESS. The former are mainly used to study the long-term change in pulsation period, while the data with high accuracy are used to study the weak modulation of V838 Cyg (Nemec et al., 2013; Benkő et al., 2014). In addition, the GEOS RR Lyr database provides 70 times of light maximum for V838 Cyg (Le Borgne et al., 2007), and we use those published ones for analysis. We introduce these data from different sources in the following subsections.
2.1 SWASP
SWASP222https://www.superwasp.org/ (SuperWASP, Super Wide Angle Search for Planets) is one of the early sky survey projects to carry out ground-based observations searching for exoplanets. It consists of two robotic observatories, respectively located on the island of La Palma and in South Africa, allowing the observations to cover both the northern and southern hemispheres of the sky. Their observation equipment comprises eight wide-angle cameras, and the effective aperture of each lens is about 20 cm (see Butters et al. 2010 for more details). The project was carried out from 2004 to 2008, used the transit method to find exoplanets, and was one of the important exploration projects in related fields before the space mission (Smith & WASP Consortium, 2014). In addition, studies of variable stars and other fields also benefit from SWASP (i.e. Norton et al. 2011; Smalley et al. 2011; Skarka 2014; Bernhard et al. 2015; Liška et al. 2016; Rigon et al. 2017). For V838 Cyg, SWASP provides more than 7600 photometric data points from different cameras. Based on the accuracy of the data, we use the data observed by cameras 141 and 144 for analysis.
2.2 ASAS-SN
The science goal of ASAS-SN333https://www.astronomy.ohio-state.edu/asassn (All-Sky Automated Survey for Supernovae), as its name suggests, is to search for bright supernovae and transients (Shappee et al., 2014). This project now has 24 telescopes distributed around the globe, surveying the entire visible sky down to about 18th magnitude. This project provides 384 photometry data in the band for V838 Cyg (Jayasinghe et al., 2018). We use these data to study the long-term change in the pulsation period (see Subsection 3.2).
2.3 and TESS
The goal of the mission is to discover exoplanets by the transit method (Borucki et al., 2010), and it opened up a new era in this field. The number of exoplanets discovered by the project has reached thousands444http://exoplanet.eu/. This mission also greatly promoted research in the field of RR Lyrae stars (Plachy & Szabó, 2021). Based on data, V838 Cyg has been studied by Benkő et al. (2010, 2014) and Nemec et al. (2011, 2013). In the present paper, we use the rectified data (Quarters 1-16) provided by Benkő et al. (2014) and the Quarter 17 long-cadence data taken from MAST (Barbara A. Mikulski Archive for Space Telescopes555https://mast.stsci.edu/portal/Mashup/Clients/Mast/Portal.html) for analysis. 61,183 long-cadence data points in total were used in our analysis.
Similar to , the goal of TESS (Transiting Exoplanet Survey Satellite) is to search for exoplanets near the solar system by using the transit method (Ricker et al., 2015). However, due to the huge field of view, its resolution is very low, only 21 arcseconds/pixel666https://tess.mit.edu/science/. Faint targets, such as V838 Cyg, are easily affected by nearby starlight. We download the pixel image cutouts of five sectors (Sectors 14, 15, 40, 41, and 53, Brasseur et al. 2019777https://mast.stsci.edu/tesscut/), and obtain the light curves of V838 Cyg in flux by using the following equation:
| (1) |
where represents the flux in the central pixels of each cutout, and represents the flux of the 16 pixels around the central nine pixels. Here we need to explain why Equation (1) is used to obtain the light curves. There is a brighter variable star near V838 Cyg (KIC 10789302, identified as a rotating variable, McQuillan et al. 2014), and the difference in position between the two stars is only about 70 arcseconds (only two pixels apart in the frame image). This makes it difficult to produce the light curves of V838 Cyg from the images. We have tried various equations, and Equation (1) probably produces the best results. We ultimately obtained 13,495 data points for analysis, which are available in machine-readable format in a .tar.gz package. It should be mentioned that the flux amplitude of the light curve is not the true amplitude. We use these data to determine the times of light maximum and minimum for analysis.
3 Analyses
The analysis methods we adopt are mainly the method, Fourier spectrum method, and corresponding research methods for modulation (Le Borgne et al., 2012), while the objects of study are those values, pulsation parameters, and Fourier coefficients, etc. We introduce the method and process of obtaining these parameters and further analyses in the following subsections.
3.1 Data Processing and Preanalysis
In the analysis of pulsating variable stars, most scholars choose the light maximum as the reference phase, and calculate the times of the corresponding phase. The common method is to select the observation data near the light maximum phase, fit the data with a linear polynomial, and then obtain the times of light maximum by using the calculated first derivatives (Sterken, 2005). This method is applied to SWASP data: we use the fifth-order polynomial as the fitting formula and determine 25 times of maximum (see Table 1). However, the time resolutions of the photometric data from other sky surveys are lower, so this method is no longer suitable. Therefore, we utilize the same method as in Li & Qian (2014) to obtain the times of light maximum and minimum. We first divide the light curves into many small segments, and then use the following equation to fit each segment:
| (2) |
where is the time, is the mean magnitude, is the amplitude of the component , is its phase in the sine term, and is the adopted number of terms. Then, according to the fitting results, we can obtain the times of light extrema, pulsation parameters (the full amplitude, , and magnitude at light maximum ), and Fourier coefficients (including the amplitude ratios, =, and the phase differences, ). In the present paper, we provide the values of , , , and of each segment. Because of the different characteristics of sky surveys, the selections of values are different in specific analyses. For ASAS-SN data, = 5, and for TESS data, = 10. For data, after many attempts, we set = 10 when determining the times of light extrema to avoid the potential impact of the moiré effect (see Section 5), and set = 15 when obtaining the Fourier parameters and coefficients (the pulsation amplitude is systematically overestimated when = 10). This series of analysis methods have been successfully applied (Li & Qian, 2014; Li et al., 2018, 2021, 2022).
Table 1 lists the times of light maximum of V838 Cyg obtained from the sky surveys. The time standard given by and TESS is BJD_TDB. To unify, we convert all the times to HJD_UTC (Eastman et al., 2010). The errors of the times of light maximum listed in the second column are obtained based on Method I in Mikulášek et al. (2006). These data are used to analyze the long-term period change of V838 Cyg (see Section 3.2). To study the weak modulation in V838 Cyg, we also obtained the pulsation parameters and Fourier coefficients from data, including the times of light maximum and minimum, the full pulsation amplitude, the magnitude at light maximum, , , , , and . These data are provided as supplementary data (see Subsection 3.3).
3.2 Long-term period changes
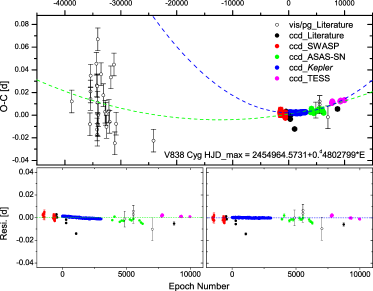
Based on the data provided by the GEOS database and , Nemec et al. (2011) proposed that the pulsation period of V838 Cyg is constant or increases slowly; in the latter case the change in value is day Myr-1. Based on the times of light maximum in Table 1 and those provided in the literature (Meinunger 1970; Sands 1978; Hubscher et al. 2009, 2010; Hubscher 2011, and four visual data provided by J. Vandenbroere and S. Ferrand), we obtained a new diagram (see Figure 1) by using the following linear ephemeris of Nemec et al. (2011):
| (3) |
In Figure 1, the diagram shows a clear parabolic shape, which means that the pulsation period increases linearly. Under the two different conditions of whether to consider the early points (Epoch -20,000), or not, we fitted the diagram with a quadratic polynomial and obtained the corresponding rate of change of period: 0.050(2) day Myr-1 (dotted green line) and 0.211(7) day Myr-1 (dotted blue line). The former result is consistent with those of Nemec et al. (2011), while the latter result without considering the early data is four times larger. It can be seen that although the accuracy of early data is low, it is still very important in the study of long-term period changes. We also plotted the residuals after removing the parabolic component for the two situations (bottom panels in Figure 1). It can be seen from the distribution of residuals on the vertical axis that the accuracy of data is the highest. Therefore, we focus on data to study the weak modulation components.
3.3 The modulations in data
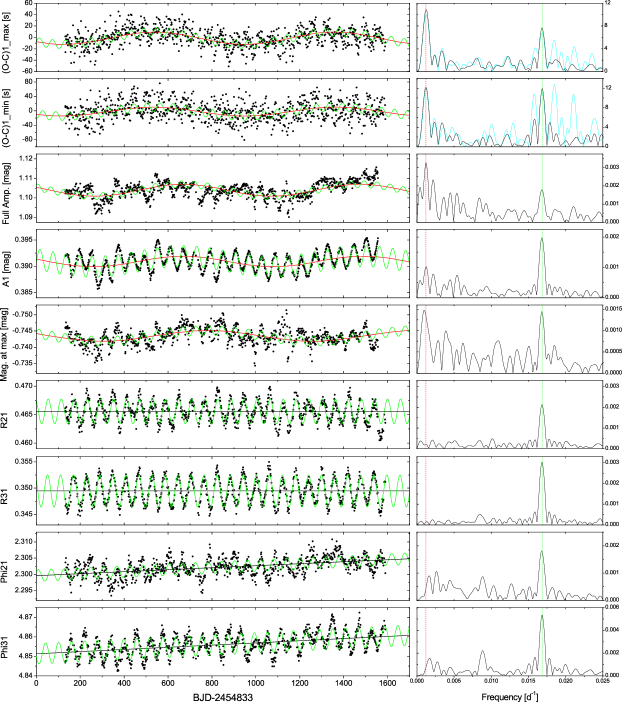
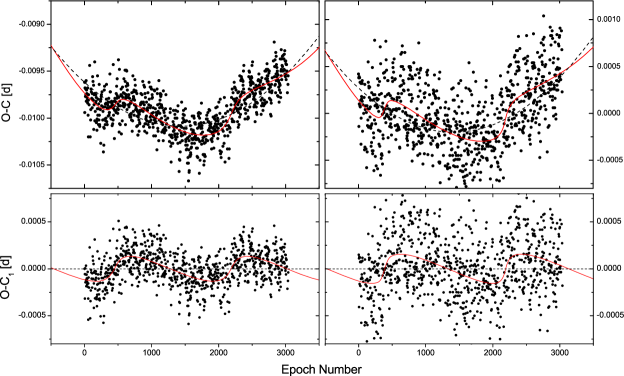
The weak modulation with a period of tens of days in the light curves of V838 Cyg was discovered by Nemec et al. (2013) and Benkő et al. (2014). In this subsection, we use the pulsation parameters and Fourier coefficients to carry out a more detailed analysis. We regard these time series data as signals, process them with a Fourier transform by using the software Period04 (Lenz & Breger, 2005), and obtain the corresponding spectrum information. The panels in the left column of Figure 2 are the parameters and coefficients plotted as time series, in which and denote the residuals after the parabola component has been removed (long-term changes may interfere with the analysis of periodic signals). The red solid lines refer to the change in long-period modulation, while the green solid lines refer to the modulation component with a short period. In the panels of and , the data also show a linear increase (black solid lines). Therefore, before Fourier transforms, we remove the linear components (3.06510-6 and 5.56810-6 rad day-1).
The panels in the right column are the corresponding Fourier amplitude spectra in the low-frequency range. It can be seen that all the spectra show significant peaks at the frequency 0.0168 day-1, corresponding to the modulation previously discovered (Benkő et al., 2014). However, in the upper five spectra, it is obvious that there is also a peak with lower frequency (the mean value is about day-1, and the corresponding period is about days), but there is no corresponding component in the amplitude spectra of , , , and . This suggests that the low-frequency component seems to be some simpler modulation. The red and green vertical dotted lines indicate the frequencies of the two modulation components. In the upper right two panels, the cyan line represents the amplitude spectra when = 15 (see the introduction in Subsection 3.1). It can be seen that there are several peaks around the short-period modulation, and their frequencies are 0.01577, 0.01684, 0.01848, and 0.02105 day-1 (the corresponding periods are 63, 59, 54, and 47 days), respectively. This means that, when = 15, the analysis results are affected by the moiré effect (see Section 5 for details).
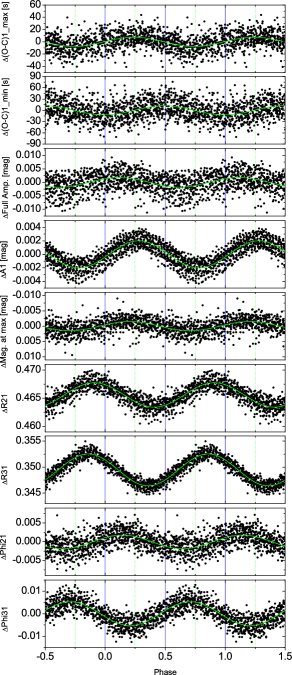
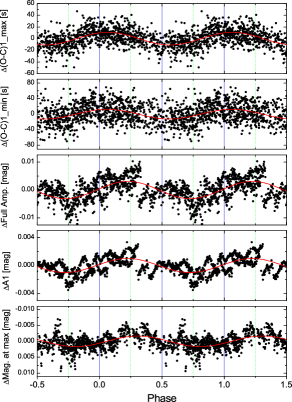
To further study the modulations, we also plot their parameter phase diagrams in Figure 3 and 4. Figure 3 shows the phase diagrams of short-period modulation. It can be seen that the phase difference between and is about , while the changes between and (and ) are basically in phase. In addition, we also found that the is in phase with , while and are just opposite. For the long-period modulation (see Figure 4), the phases of and are the same, and the changes in the other three parameters related to the amplitude, full amplitude, , and magnitude at light maximum are basically in phase. Table 2 lists the corresponding parameter results and their estimated errors. The parameters are obtained by fitting with double sine functions. In actual analysis, the software Period04 was used, and the method for calculating the errors of frequencies was provided by Montgomery & O’Donoghue (1999). The mean period values calculated from the mean frequencies are listed in the bottom row of Table 2. An error propagation formula was used to calculate the errors of the mean period.
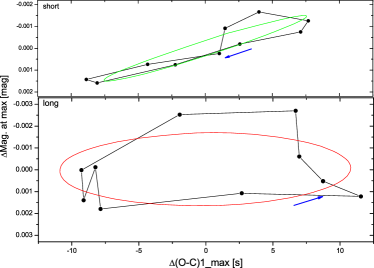
To demonstrate the varieties of phenomenology, Le Borgne et al. (2012) used the and magnitude at light maximum folded with modulation period to plot the closed curves that describe the shape of the Blazhko effect. Using their method, we also plot the versus diagram of the two modulations of V838 Cyg in Figure 5. The black points refer to the binned observation points, while the green and red solid lines are the corresponding fitting results. For the short-period modulation, the change is clockwise, and the two parameters are roughly in phase, which is consistent with the situation in Fig. 9 of Le Borgne et al. (2012). The change in long-period modulation is counterclockwise, and the correlation between and is not obvious, showing that it is indeed different from the short-period modulation.
4 The modulations in V838 Cyg
The light curves of V838 Cyg show two different weak modulations. The component with a short period causes the changes in pulsation period, amplitude, and the Fourier coefficients, while the component with a long period only causes the change in period and amplitude. The former exhibits typical Blazhko modulation characteristics, and it seems that it is intrinsic (due to the changes in the stellar atmosphere, i.e., multimode resonance, Szabó et al. 2010; Buchler & Kolláth 2011; Kolláth et al. 2011; Bryant 2015; the variation of turbulent convection strength due to oscillatory magnetic field, Stothers 2006, 2010; or shock waves, Gillet 2013), while the latter may be extrinsic (such as due to the light travel time effect, LiTE, Irwin 1952).
Li & Qian (2014) found similar changes in the diagrams of the other two RR Lyrae stars FN Lyr and V894 Cyg in the field. According to the same trends in changes in the diagrams obtained from the times of light maximum and minimum, they supposed the mechanism of the changes is the LiTE caused by the presence of a companion star. We assume that this effect also exists in V838 Cyg, use an eccentric orbit model to fit the diagrams (Li & Qian, 2014), and obtain the partial orbital parameters (see Table 3). Figure 6 plots the corresponding diagrams, in which the same trends in changes can be observed.
In this case, assuming the mass of the pulsating primary star is 0.6 M⨀, the calculated lower mass limit of the companion is about 0.0126 M⨀, and it should be a massive planet. But one problem that needs to be considered is whether the presence of a planet causes amplitude variation and a change in . The general viewpoint is that a companion with a long orbital period will only cause modulation of the pulsation frequency (Shibahashi & Kurtz, 2012). Eclipsing may occur, but it is difficult to recognize because of the interference of pulsation. However, in the field of binary stars and cataclysmic variable stars, there is a reflection effect between companions (Wilson, 1990), and perhaps the companion can influence the pulsation amplitude and of the pulsating host star through this effect.
The long-term weak changes found in the field were believed to be caused by an instrumental effect (Benkő et al., 2019). The most important factor should be the frequency (it is the reciprocal of the -year, Bányai et al. 2013). This phenomenon is manifested in the light curves of some stars that show variability with a period equal a -year, and the amplitude and phase of the variations are related to the position of the targets in the field of view (see Figure 5 and 6 of Bányai et al. 2013). This means that the -year mainly manifests in its impact on the flux (or magnitude), which may interfere with the related parameters (such as in this paper). The variations of values mainly reflect the changes in pulsation frequency/period (Benkő et al., 2011), and the effect of amplitude modulation is small. Moreover, in our analysis, the long-cadence data were detrended, and the factor of a -year can be effectively removed before the analysis.
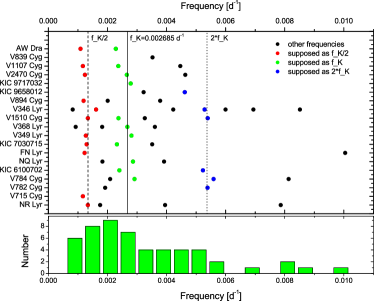
Benkő et al. (2019) pointed out that the components in the low-frequency spectral region of the diagrams for the non-Blazhko RRab stars in the field are mostly harmonics or subharmonics of the frequency. Therefore, it can be expected that the frequencies in the corresponding spectral diagrams should be strictly equal to the frequency and the harmonics. However, their diagrams are different, and the corresponding frequency values are also different (see Figure 13 and Table 4 in Benkő et al. 2019). We conducted statistical analysis on the frequency components given in Table 4 of Benkő et al. (2019), and plotted Figure 7. The red dots in the upper panel indicate those components that belong to , green dots those to , blue dots those to , and the black dots represent other detected components. The bottom panel shows the histogram of all components. It can be seen that the components within the range 0 - 0.006 day-1 are almost uniformly distributed. It is unnecessary to consider those components with frequencies close to , , and as related to instrumental factors.
In fact, in other fields of variable star research, scholars have found weak variations in the diagrams based on the data and conducted further and deeper research (Tran et al., 2013; Murphy et al., 2013; Derekas et al., 2012, 2017). The photometry data are still some of the most accurate data that we can obtain. Researchers should be encouraged to dig deeper, analyze, and research them. Based on our analyses and discussions, the long-period modulation in V838 Cyg shows different characteristics from the general Blazhko modulation. We initially propose that the corresponding mechanism is the LiTE; at least it should be an external factor.
5 Moiré patterns and beat frequencies
Due to the characteristics of data, the long-cadence light curves of many variable stars show a significant moiré pattern. We found that the moiré effect may have a greater impact on the corresponding analysis than the -year. We will provide a detailed introduction to this effect in this section and explore its interference in V838 Cyg analysis.
The observations are made in two cadences: long cadence (LC) and short cadence (SC). The LC data, which result from 270 exposures coadded with a total integration time of 29.4 min, have a low time resolution, but are given continuously. For SC data, nine frames coadded with a total of 58.85 s are given in some Quarters. The original data available at the Multimission Archive at the Space Telescope Science Institute (STScI)888http://archive.stsci.edu/kepler/ consist of raw and corrected flux counts as a function of time. Corrected fluxes have been processed by the presearch data conditioning (PDC) pipeline, and the signatures in the light curves that are correlated with systematic error sources have been removed999https://archive.stsci.edu/kepler/manuals/Data_Characteristics.pdf. Benkő et al. (2014) and Benkő & Szabó (2015) used the tailor-made apertures to process the pixel photometric data, and presented rectified light curves of some RR Lyrae stars in the field101010http://www.konkoly.hu/KIK/data_en.html. In this analysis, we use corrected PDC fluxes mainly, but use the rectified data of V838 Cyg for more accurate results. The data processing and reduction methods used here are the same as those described in Li & Qian (2014). We use the linear ephemerides in Table 4 (columns 2 and 3) to calculate the values of stars.
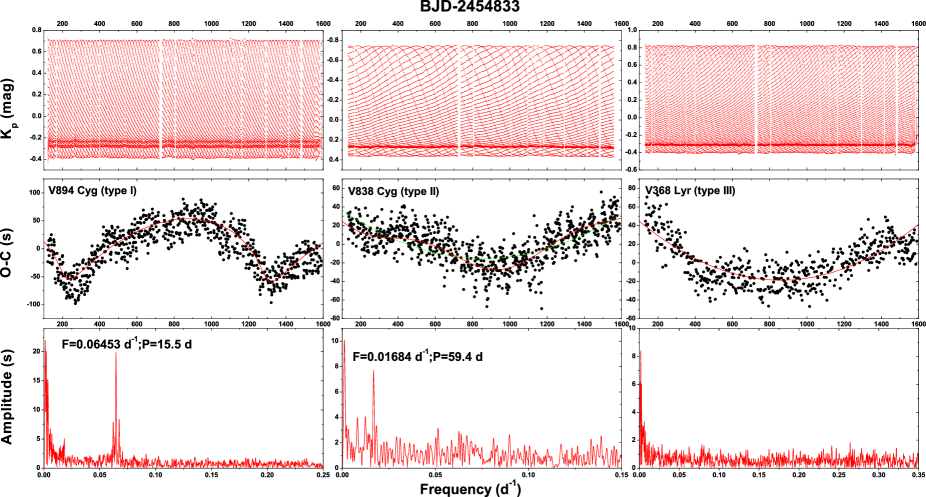
The moiré patterns exhibited in the LC data of RR Lyrae stars are common. One of the conditions to produce these phenomena is that the ratio of the pulsation period of the RR Lyrae star () and the LC sampling period ( 1765.5 s 29.4 minutes) is close to an integer (e.g. for V894 Cyg, = 27.96309 28, Nemec et al. 2011). Column 4 in Table 4 shows the examples. These moiré patterns have a remarkable influence on the analysis: prominent beat components are observed in the curves and corresponding Fourier spectrum (Rappaport et al., 2013). As an example, the left panels in Figure 8 show the light curves and the diagram of V894 Cyg. The moiré pattern can be seen clearly in the light curve. In addition, there is spurious periodicity exhibited in the curves. This periodicity cannot be observed clearly, but causes the points to show a diffuse distribution in the vertical direction. For the sake of a better view, we present the Fourier spectrum of the diagram (see the bottom left panel in Figure 8). One can observe the significant peak in the spectrum. Column 5 of Table 4 lists the corresponding frequencies. Moreover, in the diagram, the curves show clear periodic variations on a longer timescale, which has been explained as a consequence of the LiTE caused by the star following an elliptical orbit in a binary system (Li & Qian, 2014).
Rappaport et al. (2013) gave the formulae to calculate this type of beat frequencies:
| (4) |
or
| (5) |
where “int” gives the values, which are rounded down to the nearest integer, is the pulsation frequency, and . Column 6 of Table 4 contains the two beat frequencies, and those calculated values labeled with asterisks are consistent with the results given by the Fourier analysis (column 5 of Table 4).
All of these stars match this condition except two: V838 Cyg and V368 Lyr. Their light curves both clearly show moiré patterns (see the top middle panel and top right panel in Figure 8), but their ratios () are close to half-integer (23.50442) and 1/3-integer (22.33997), respectively. According to this feature, we divide the moiré patterns into three types (type I for integer, type II for half-integer, and type III for 1/3-integer; we also investigate those ratios close to 1/4-integer (e.g. NQ Lyr, KIC 9717032), but the scalloped patterns at extremum are no longer clear; so only these three types are discussed in this section).
The beat frequencies of V838 Cyg (type II) and V368 Lyr (type III) can be calculated as:
| (6) |
and
| (7) |
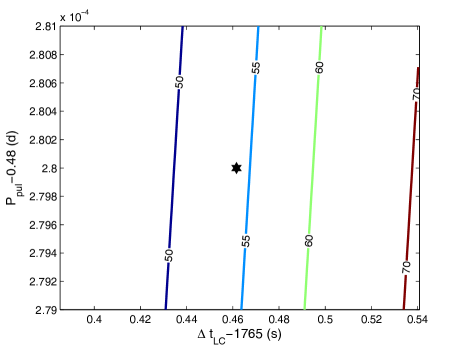
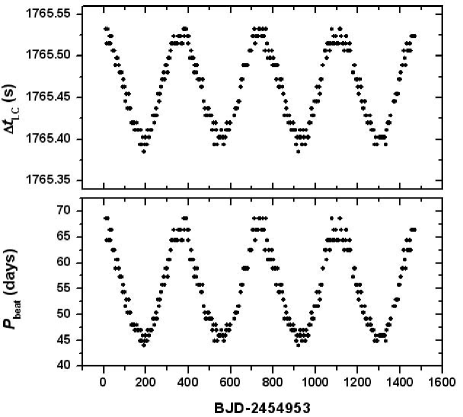
Column 6 of Table 4 lists the beat frequencies. From Equations (6, 7), type II and III beat frequencies can be described as the further beats of type I beat frequencies, and their intensities can be expected to be weaker than type I. The beat frequency of V838 Cyg is 0.0184 day-1, and the beat period is about 54.3 days. This result agrees with Nemec et al. (2013). However, Nemec et al. (2013) also pointed out that the modulation period for V838 Cyg was varying, and they identified multiple periods of 54, 64, and 47 days. The reason for this phenomenon should be the small changes of with time. From Equations (4, 5, 6), we can see that the beat frequency in V838 Cyg is dependent on and (i.e. and ), both of which may change with time. In order to study the relationship between the two parameters and the beat period, we provide the corresponding contour map in Figure 9. It can be seen that the contour lines are basically vertical, which means that the gradient direction is basically horizontal. This indicates that when the on the abscissa changes while on the ordinate remains unchanged, the beat period changes the most, that is, the beat period is more sensitive to than to . Therefore, in the following discussion, we set as a constant (= 0.48028 days), and only explore the impact of changes in on the beat period. Actually, the changes periodically in one -year ( days), ranging from 1765.38528 to 1765.54080 s (see the top panel in Figure 10, these values are obtained by data time subtracting its previous data time that listed in LC data). We substitute these values into Equations (4, 5, and 6), and obtain the values of the beat period with time (see the bottom panel in Figure 10). We fit these values with the following function:
| (8) |
and the results are: days, days, days ( one -year), and . So the beat periods range from 45 to 66 days and the mean value is 55 days, which agrees with the dominant values of modulation period found by Nemec et al. (2013). Moreover, Nemec et al. (2013) pointed out that the waves are compressed around times and 550 (BJD 2,455,153 and 2,555,503) but were wider around and 750 (BJD 2,455,353 and 2,455,703). Comparing these values with the curve in Figure 10, they also agree with each other. So it is safe to say that the results of V838 Cyg given were influenced by the moiré pattern in the LC light curves.
In the Fourier spectrum of the diagram calculated from LC data, we find a frequency of day-1, or days (see middle panels in Figure 8). This agrees with the result obtained by Benkő et al. (2014). However, different from those type I beat frequencies, the frequency in the Fourier spectrum of V838 Cyg is not virtual, but is real modulation. It is a complete coincidence that the beat frequency (0.0184 day-1) and the modulation frequency (0.01684 day-1) are close to each other.
The beat frequency of V368 Lyr is 0.0436 day-1. But in the Fourier spectrum, we do not find a significant peak at the corresponding position (see the bottom right panel in Figure 8). However, we can obtain the period by counting the patterns in light curves, and the result is about 24 days, which roughly agrees with the calculated beat period (22.9 days). From our work, the influences of type II and III beat frequencies on the analysis are much weaker than those of type I. In most cases, they can be ignored safely, but sometimes they may influence the analysis, just like the situation in V838 Cyg.
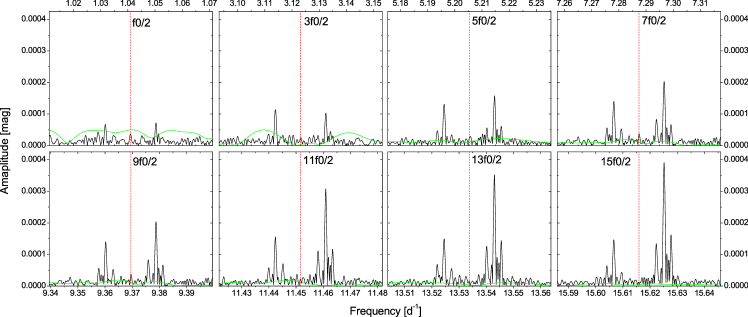
In addition, in the case of V838 Cyg, the moiré effect will also have an impact on the study of the period doubling phenomenon. We performed Fourier analysis on both LC and SC data of V838 Cyg. After pre-whitening the data with the pulsation frequency and its harmonics, the amplitude spectra near the half-integer pulsation frequencies (, , …) are presented in Figure 11. The black spectrum represents the result of LC data, and the green line represents the spectrum of SC data. It can be seen that there is no peak on the half-integer pulsation frequencies. But for LC data, there are double peaks around the half-integer frequencies with a frequency difference of 0.0184 day-1. These components are caused by the moiré effect, but are easy to consider as half-integer pulsation frequencies. The light curve of V838 Cyg does not actually show the period doubling phenomenon, and the moiré pattern misled the previous study (Benkő et al., 2014).
6 Metal abundance and Blazhko modulation
One of our aims is to explore the relationship between metal abundance and Blazhko modulation. Noting that V838 Cyg is the RRab star with the highest metal abundance and the weakest modulation among all Blazhko RRab stars in the field (Nemec et al., 2013), we define a similar parameter with reference to the amplitude modulation factor (characteristic modulation depth) in radio technology:
| (9) |
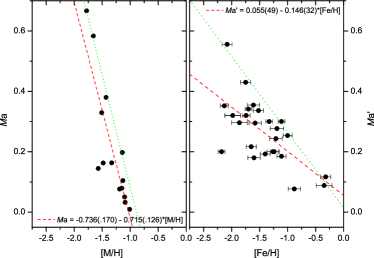
where , and are the maximum and minimum values of the full amplitude of the light curve, respectively. These values and the metal abundances are given in Tables 2 and 9 of Nemec et al. (2013). In the left panel of Figure 12 the metal abundances are plotted against . It can be seen that there is a significant negative correlation between the two parameters, that is, the higher the metal abundance, the weaker the Blazhko modulation. The red dashed line in the left panel refers to a linear fitting to the data, and the corresponding result is
| (10) |
The correlation coefficient of the model is -0.85. We also notice that all those RRab stars in the field with higher metal abundance than V838 Cyg are non-Blazhko stars, and there are also some non-Blazhko stars that show low metal abundances. These phenomena seem to indicate that metal abundance does not necessarily determine whether the modulation occurs, but when it occurs, the metal abundance has an important influence on the intensity of modulation: rich metals will ’suppress’ modulation.
The sample size of RR Lyrae stars is not large, and more information is collected in other literature. Le Borgne et al. (2012) provided the magnitude variation at the light maximum of some Blazhko stars (see their Table 1). We define a similar parameter:
| (11) |
The right panel of Figure 12 plots the metal abundance against the , where the metal abundances of the corresponding stars are given by Layden (1994). A similar trend can be seen in the diagram. The red dashed line in the right panel refers to a linear fitting, and the corresponding result is
| (12) |
The correlation coefficient of the model is -0.68. However, unlike the left panel, there are also some stars with weak modulations located in the range of poor metal abundance. But in the metal-rich range, the modulations are the weakest. This illustrates the ’suppression’ effect: large modulation is restricted to high metallicity.
The next question is how the metal abundance affects the Blazhko modulation. We are not familiar with the relevant theories and models, but only give a superficial viewpoint: in the stellar evolution model, the metal abundance is generally considered to mainly affect the opacity: greater metal abundance makes the opacity increase, the radiation temperature gradient increases accordingly, and this affects the convection in the atmosphere (intensity and boundary position). In this case, the turbulence, magnetic field activity, and shock wave that may cause the Blazhko modulation are suppressed. Based on observation, Chadid et al. (2014) proposed that the Blazhko effect originates from a dynamical interaction between a multishock structure and an outflowing wind in a coronal structure; and then Chadid et al. (2017) showed that the main shock intensity of metal-poor RR Lyrae stars is larger than that of metal-rich stars. According to their viewpoints, there is the following logical relationship: the metal abundance in the stellar atmosphere is negatively correlated with the shock intensity, thus suppressing the modulation caused by the shock waves.
The metal abundance is related to several other stellar intrinsic parameters (such as luminosity, mass, and effective temperature) and pulsation parameters. Whether some of these parameters are more closely related to modulation needs to be considered. We also compared the relationship between () and other pulsation parameters (, , and other stellar atmospheric parameters), but did not find any significant correlation as shown in Figure 12. However, this cannot be ruled out because some physical quantities are also interfered with by the effect of evolution. Li et al. (2022) studied the four RRc stars in field, and found that the intensities of changes in the diagram are related to the macroturbulent velocities. In fact, the metal abundances of those four stars are also negatively correlated with the macroturbulent velocity.
RR Lyrae stars with low metal abundance have greater luminosities and higher masses (Bono et al., 2007; Sandage, 2010; Nemec et al., 2013). If the correlations in Figure 12 are established, it would indicate that strong modulation tends to occur in those RR Lyrae stars with greater masses, high luminosities, and longer pulsation periods. However, this conflicts with the proposition of Skarka et al. (2020). In their study, the pulsation period is used as the abscissa value. This parameter is not related to the intrinsic parameters of stars, but is related to the evolutionary stage. A long pulsation period does not necessarily mean that the metal abundance of RR Lyrae stars must be low, and a short period does not necessarily mean that the metal abundance is high (see Figure 7 in Fabrizio et al. 2021). In addition, in the Bailey diagram, the pulsation amplitude decreases with the pulsation period, which may statistically cause the modulation amplitude to decrease accordingly. The samples studied by Skarka et al. (2020) are those RRab stars in the Galactic bulge, most of which have pulsation periods of less than 0.7 days. The median photometric metallicity of the whole sample is about -1 dex, which is systematically higher than those Galactic field RR Lyrae stars ([Fe/H] = -1.59, Fabrizio et al. 2019). The selection effect cannot therefore be ruled out.
It needs to be acknowledged that the samples in Figure 12 are still lacking, especially the relatively metal-rich RRab stars ([Fe/H] -1.0) and stars in globular clusters, as well as the samples of Blazhko RRc and RRd stars. In fact, metal abundance is also the general term for the abundance of elements heavier than hydrogen and helium. It is not expected that this single physical quantity can describe the complex modulation phenomenon, and it cannot be ruled out that other factors might also affect the modulations (e.g. helium and light-element abundances, Jang et al. 2014; Jurcsik et al. 2014). The RR Lyrae stars in the Galaxy have different formations and evolutions (Bobrick et al., 2022). In the study of their modulation phenomena, stars in different environments and with different properties may need targeted analyses.
Anyway, the potential relationship between metal abundance and Blazhko modulation needs to be further verified from an observational and theoretical perspective. Recently, based on the spectral data of different sky survey projects, the metal abundance of thousands of RR Lyrae stars has been obtained (Fabrizio et al., 2019; Liu et al., 2020); The TESS Space Telescope is capable of providing enough photometric data to study the pulsations and modulations that occur in bright RR Lyrae stars. The combination of the two data sources will certainly lead to more comprehensive research results. In terms of theoretical simulations, many models devoted to explaining the Blazhko effect do not consider the influence of different metal abundances, and perhaps new work can be considered from this perspective in the future.
7 Summary
Among the 16 Blazhko RRab stars studied by Nemec et al. (2013), V838 Cyg shows the weakest modulation and the highest metal abundance. After noting these characteristics, we made an in-depth study of V838 Cyg using data from several sky surveys, and made a comparative study of the modulations and physical parameters of some Blazhko RRab stars. Finally, we obtained the following results.
1. The diagram shows that the pulsation period of V838 Cyg increases on a long timescale. The specific rate of period change varies depending on whether the early data are used: the rate is 0.050 day Myr-1 if used, or 0.211 day Myr-1 when they are not considered in the analysis. Further accumulation of observations is needed to obtain a more exact value.
2. Based on the reanalysis of data, we confirmed the modulation component with a period of 59.45 days discovered in earlier literature, and also found an additional weak modulation with a longer period (about 840 days). The former shows the characteristics of the typical Blazhko effect, while the long-period modulation is simpler, and only shows the changes in pulsation period and amplitude. We suspected the corresponding mechanism is likely to be external (e.g. the LiTE).
3. Based on the modulation and stellar physical parameters provided by Nemec et al. (2013), we found that there is a significant negative correlation between the metal abundance and modulation amplitude of Blazhko RRab stars. We also collected the data from other samples (Layden, 1994; Le Borgne et al., 2012), and found that the metal abundances of the objects with the strongest modulations are poor, and the modulation factor also shows a downward trend with increasing metal abundance. This shows that the metal abundance plays an important role in Blazhko modulation (i.e. the inhibitory effect). This finding may provide some useful support for theoretical models to explain the Blazhko effect.
4. We found that the LC light curves of V838 Cyg show a moiré pattern that is easy to ignore, and this effect interferes with the relevant research: contrary to the finding of Benkő et al. (2014), V838 Cyg does not show period doubling, and the multiple modulation periods found by Nemec et al. (2013) are in fact caused by the moiré pattern.
When studying the weak modulation of scale from tens of days to hundreds of days, the ultraprecise and uninterrupted photometric data provided by the space telescope are invaluable. Although the accuracy and resolution of the data provided by the TESS space telescope are lower than those of the space telescope, TESS can still provide a sufficient number of RR Lyrae variable samples for analysis. Combined with the spectroscopic metal abundance data, it is believed that the relationship between Blazhko modulation and metal abundance can be more fully demonstrated.
References
- Bányai et al. (2013) Bányai, E., Kiss, L. L., Bedding, T. R., et al. 2013, MNRAS, 436, 1576
- Benkő et al. (2019) Benkő, J. M., Jurcsik, J., & Derekas, A. 2019, MNRAS, 485, 5897
- Benkő et al. (2014) Benkő, J. M., Plachy, E., Szabó, R., Molnár, L., & Kolláth, Z. 2014, ApJS, 213, 31
- Benkő & Szabó (2015) Benkő, J. M., & Szabó, R. 2015, ApJ, 809, L19
- Benkő et al. (2011) Benkő, J. M., Szabó, R., & Paparó, M. 2011, MNRAS, 417, 974
- Benkő et al. (2010) Benkő, J. M., Kolenberg, K., Szabó, R., et al. 2010, MNRAS, 409, 1585
- Bernhard et al. (2015) Bernhard, K., Hümmerich, S., & Paunzen, E. 2015, Astronomische Nachrichten, 336, 981
- Blažko (1907) Blažko, S. 1907, Astronomische Nachrichten, 175, 325
- Bobrick et al. (2022) Bobrick, A., Iorio, G., Belokurov, V., et al. 2022, arXiv e-prints, arXiv:2208.04332
- Bono et al. (2007) Bono, G., Caputo, F., & Di Criscienzo, M. 2007, A&A, 476, 779
- Borucki et al. (2010) Borucki, W. J., Koch, D., Basri, G., et al. 2010, Science, 327, 977
- Brasseur et al. (2019) Brasseur, C. E., Phillip, C., Fleming, S. W., Mullally, S. E., & White, R. L. 2019, Astrocut: Tools for creating cutouts of TESS images, Astrophysics Source Code Library, record ascl:1905.007, , , ascl:1905.007
- Bryant (2015) Bryant, P. H. 2015, ApJ, 802, 52
- Buchler & Kolláth (2011) Buchler, J. R., & Kolláth, Z. 2011, ApJ, 731, 24
- Butters et al. (2010) Butters, O. W., West, R. G., Anderson, D. R., et al. 2010, A&A, 520, L10
- Chadid et al. (2017) Chadid, M., Sneden, C., & Preston, G. W. 2017, ApJ, 835, 187
- Chadid et al. (2014) Chadid, M., Vernin, J., Preston, G., et al. 2014, AJ, 148, 88
- Derekas et al. (2012) Derekas, A., Szabó, G. M., Berdnikov, L., et al. 2012, MNRAS, 425, 1312
- Derekas et al. (2017) Derekas, A., Plachy, E., Molnár, L., et al. 2017, MNRAS, 464, 1553
- Eastman et al. (2010) Eastman, J., Siverd, R., & Gaudi, B. S. 2010, PASP, 122, 935
- Fabrizio et al. (2019) Fabrizio, M., Bono, G., Braga, V. F., et al. 2019, ApJ, 882, 169
- Fabrizio et al. (2021) Fabrizio, M., Braga, V. F., Crestani, J., et al. 2021, ApJ, 919, 118
- Gaia Collaboration (2022) Gaia Collaboration. 2022, VizieR Online Data Catalog, I/358
- Gillet (2013) Gillet, D. 2013, A&A, 554, A46
- Hubscher (2011) Hubscher, J. 2011, Information Bulletin on Variable Stars, 5984, 1
- Hubscher et al. (2010) Hubscher, J., Lehmann, P. B., Monninger, G., Steinbach, H.-M., & Walter, F. 2010, Information Bulletin on Variable Stars, 5941, 1
- Hubscher et al. (2009) Hubscher, J., Steinbach, H.-M., & Walter, F. 2009, Information Bulletin on Variable Stars, 5889, 1
- Irwin (1952) Irwin, J. B. 1952, ApJ, 116, 211
- Jang et al. (2014) Jang, S., Lee, Y. W., Joo, S. J., & Na, C. 2014, MNRAS, 443, L15
- Jayasinghe et al. (2018) Jayasinghe, T., Kochanek, C. S., Stanek, K. Z., et al. 2018, MNRAS, 477, 3145
- Jurcsik et al. (2014) Jurcsik, J., Smitola, P., Hajdu, G., & Nuspl, J. 2014, ApJ, 797, L3
- Jurcsik et al. (2005) Jurcsik, J., Sodor, A., & Varadi, M. 2005, Information Bulletin on Variable Stars, 5666, 1
- Jurcsik et al. (2009) Jurcsik, J., Sódor, Á., Szeidl, B., et al. 2009, MNRAS, 400, 1006
- Koch et al. (2010) Koch, D. G., Borucki, W. J., Basri, G., et al. 2010, ApJ, 713, L79
- Kolenberg (2008) Kolenberg, K. 2008, in Journal of Physics Conference Series, Vol. 118, Journal of Physics Conference Series, 012060
- Kolenberg et al. (2010) Kolenberg, K., Szabó, R., Kurtz, D. W., et al. 2010, ApJ, 713, L198
- Kolláth et al. (2011) Kolláth, Z., Molnár, L., & Szabó, R. 2011, MNRAS, 414, 1111
- Kovacs (2018) Kovacs, G. 2018, A&A, 614, L4
- Kovacs (2021) Kovacs, G. 2021, in Astronomical Society of the Pacific Conference Series, Vol. 529, RR Lyrae/Cepheid 2019: Frontiers of Classical Pulsators, ed. K. Kinemuchi, C. Lovekin, H. Neilson, & K. Vivas, 51
- Layden (1994) Layden, A. C. 1994, AJ, 108, 1016
- Le Borgne et al. (2007) Le Borgne, J. F., Paschke, A., Vandenbroere, J., et al. 2007, A&A, 476, 307
- Le Borgne et al. (2012) Le Borgne, J. F., Klotz, A., Poretti, E., et al. 2012, AJ, 144, 39
- Lenz & Breger (2005) Lenz, P., & Breger, M. 2005, Communications in Asteroseismology, 146, 53
- Li & Qian (2014) Li, L. J., & Qian, S. B. 2014, MNRAS, 444, 600
- Li et al. (2018) Li, L.-J., Qian, S.-B., Voloshina, I., et al. 2018, PASJ, 70, 71
- Li et al. (2022) Li, L. J., Qian, S. B., & Zhu, L. Y. 2022, MNRAS, 510, 6050
- Li et al. (2021) Li, L. J., Qian, S. B., Zhu, L. Y., He, J. J., & Fang, X. H. 2021, AJ, 161, 193
- Liu et al. (2020) Liu, G. C., Huang, Y., Zhang, H. W., et al. 2020, ApJS, 247, 68
- Liška et al. (2016) Liška, J., Skarka, M., Zejda, M., Mikulášek, Z., & de Villiers, S. N. 2016, MNRAS, 459, 4360
- McQuillan et al. (2014) McQuillan, A., Mazeh, T., & Aigrain, S. 2014, ApJS, 211, 24
- Meinunger (1970) Meinunger, L. 1970, Zentralinstitut fuer Astrophysik Sternwarte Sonneberg Mitteilungen ueber Veraenderliche Sterne, 5, 126
- Mikulášek et al. (2006) Mikulášek, Z., Wolf, M., Zejda, M., & Pecharová, P. 2006, Ap&SS, 304, 363
- Montgomery & O’Donoghue (1999) Montgomery, M. H., & O’Donoghue, D. 1999, Delta Scuti Star Newsletter, 13, 28
- Mullen et al. (2021) Mullen, J. P., Marengo, M., Martínez-Vázquez, C. E., et al. 2021, ApJ, 912, 144
- Mullen et al. (2022) —. 2022, ApJ, 931, 131
- Murphy et al. (2013) Murphy, S. J., Pigulski, A., Kurtz, D. W., et al. 2013, MNRAS, 432, 2284
- Nemec et al. (2013) Nemec, J. M., Cohen, J. G., Ripepi, V., et al. 2013, ApJ, 773, 181
- Nemec et al. (2011) Nemec, J. M., Smolec, R., Benkő, J. M., et al. 2011, MNRAS, 417, 1022
- Norton et al. (2011) Norton, A. J., Payne, S. G., Evans, T., et al. 2011, A&A, 528, A90
- Plachy & Szabó (2021) Plachy, E., & Szabó, R. 2021, Frontiers in Astronomy and Space Sciences, 7, 81
- Prudil & Skarka (2017) Prudil, Z., & Skarka, M. 2017, MNRAS, 466, 2602
- Rappaport et al. (2013) Rappaport, S., Deck, K., Levine, A., et al. 2013, ApJ, 768, 33
- Ricker et al. (2015) Ricker, G. R., Winn, J. N., Vanderspek, R., et al. 2015, Journal of Astronomical Telescopes, Instruments, and Systems, 1, 014003
- Rigon et al. (2017) Rigon, L., Scholz, A., Anderson, D., & West, R. 2017, MNRAS, 465, 3889
- Sandage (2010) Sandage, A. 2010, ApJ, 722, 79
- Sandage & Wallerstein (1960) Sandage, A., & Wallerstein, G. 1960, ApJ, 131, 598
- Sands (1978) Sands, S. 1978, JAVSO, 7, 79
- Shappee et al. (2014) Shappee, B. J., Prieto, J. L., Grupe, D., et al. 2014, ApJ, 788, 48
- Shibahashi & Kurtz (2012) Shibahashi, H., & Kurtz, D. W. 2012, MNRAS, 422, 738
- Skarka (2014) Skarka, M. 2014, A&A, 562, A90
- Skarka et al. (2020) Skarka, M., Prudil, Z., & Jurcsik, J. 2020, MNRAS, 494, 1237
- Smalley et al. (2011) Smalley, B., Kurtz, D. W., Smith, A. M. S., et al. 2011, A&A, 535, A3
- Smith & WASP Consortium (2014) Smith, A. M. S., & WASP Consortium. 2014, Contributions of the Astronomical Observatory Skalnate Pleso, 43, 500
- Smith (2004) Smith, H. A. 2004, RR Lyrae Stars
- Smolec (2005) Smolec, R. 2005, Acta Astron., 55, 59
- Sterken (2005) Sterken, C. 2005, in Astronomical Society of the Pacific Conference Series, Vol. 335, The Light-Time Effect in Astrophysics: Causes and cures of the O-C diagram, ed. C. Sterken, 3
- Stothers (2006) Stothers, R. B. 2006, ApJ, 652, 643
- Stothers (2010) —. 2010, PASP, 122, 536
- Szabó et al. (2010) Szabó, R., Kolláth, Z., Molnár, L., et al. 2010, MNRAS, 409, 1244
- Szeidl (1976) Szeidl, B. 1976, in Astrophysics and Space Science Library, Vol. 60, IAU Colloq. 29: Multiple Periodic Variable Stars, ed. W. S. Fitch, 133
- Tran et al. (2013) Tran, K., Levine, A., Rappaport, S., et al. 2013, ApJ, 774, 81
- Wilson (1990) Wilson, R. E. 1990, ApJ, 356, 613
| Max. | Error | Epoch | Ref. | |
|---|---|---|---|---|
| HJD-2400000 | (days) | (days) | ||
| 54231.66773 | 0.00161 | -1526 | 0.00176 | SWASP |
| 54232.62931 | 0.00126 | -1524 | 0.00278 | SWASP |
| 54256.64342 | 0.00083 | -1474 | 0.00290 | SWASP |
| 54257.60145 | 0.00194 | -1472 | 0.00036 | SWASP |
| 54280.65827 | 0.00228 | -1424 | 0.00375 | SWASP |
| 54282.57607 | 0.00259 | -1420 | 0.00042 | SWASP |
| 54283.53631 | 0.00219 | -1418 | 0.00011 | SWASP |
| 54284.50162 | 0.00213 | -1416 | 0.00485 | SWASP |
| 54609.64631 | 0.00158 | -739 | 0.00005 | SWASP |
| 54635.58402 | 0.00167 | -685 | 0.00266 | SWASP |
| … | … | … | … | … |
| (day-1) | (deg) | (day-1) | (deg) | |||
| (days) | 0.01685(3) | 0.00009(1) | 2(5) | 0.00122(2) | 0.00013(1) | 213(3) |
| (days) | 0.01685(4) | 0.00014(1) | 272(5) | 0.00121(4) | 0.00014(1) | 217(5) |
| Full amp. (mag) | 0.01683(4) | 0.00178(16) | 46(5) | 0.00124(2) | 0.00308(16) | 151(3) |
| (mag) | 0.01681(1) | 0.00202(5) | 347(1) | 0.00122(2) | 0.00100(5) | 155(3) |
| (mag) | 0.01679(3) | 0.00150(11) | 15(4) | 0.00105(2) | 0.00165(11) | 156(4) |
| 0.01682(1) | 0.00217(5) | 121(1) | ||||
| 0.01682(1) | 0.00307(4) | 140(1) | ||||
| (rad) | 0.01677(2) | 0.00181(9) | 38(3) | |||
| (rad) | 0.01683(1) | 0.00532(12) | 193(1) | |||
| Mean frequency | 0.01682(2) | 0.00119(3) | ||||
| Mean period | 59.45(7) | 840(21) |
Notes. The letters S and L represent the short-period modulation and the long-period modulation, respectively. The digits in parentheses are the errors in the final digits of the corresponding quantities. For example, 0.00122(2) means 0.001220.00002, and 213(3) means 2133.
| Parameter | V838 Cyg (MAX) | V838 Cyg (MIN) |
|---|---|---|
| (d Myr-1) | ||
| (deg) | ||
| (day) | ||
| Star Name | , | ||||
| (BJD-2400000) | (days) | (day-1) | (day-1) | ||
| Type I | |||||
| V715 Cyg | 54964.60622 | 0.47070588 | 23.03587 | 0.07629(2) | 0.0762*,2.0483 |
| V784 Cyg | 54964.80988 | 0.53409458 | 26.13805 | 0.25855(1) | 0.2585*,1.6138 |
| KIC 6100702 | 54953.84603 | 0.48814517 | 23.88934 | 0.226655(3) | 1.8219,0.2267* |
| V350 Lyr | 54964.78382 | 0.59423786 | 29.08141 | 0.137023(1) | 0.1370*,1.5458 |
| V894 Cyg | 54953.56580 | 0.57138644 | 27.96309 | 0.06453(1) | 1.6855,0.0646* |
| KIC 9658012 | 55779.94646 | 0.53319459 | 26.09401 | 0.17648(3) | 0.1763*,1.6992 |
| Type II | |||||
| V838 Cyg | 54964.57594 | 0.48028001 | 23.50442 | 0.01684(3) | 1.0503,1.0319 |
| 0.0184(=) | |||||
| Type III | |||||
| V368 Lyr | 54964.78830 | 0.45648601 | 22.33997 | - | 0.7448,1.4459 |
| 0.0436(=) |
Notes. The columns contain: (1) star name; (2) time of light maximum (BJD-2400000); (3) pulsation period in days; (4) the ratio of the pulsation period and the LC sampling period; (5) beat frequencies obtained from the Fourier spectrum of diagrams; (6) beat frequencies calculated from Equations. (4, 5, 6, 7). In type I, the beat frequencies from the spectrum of diagrams are approximately equal to the smaller of the two values in column 6 (labeled with asterisks).