Catching a Milky Way open cluster in its last breath
Abstract
Theoretical models have suggested peculiar velocity dispersion profiles of star clusters facing dissolution. They predicted that, besides bound stars that still belong to the star cluster, and unbound ones already stripped off, there is an intermediate population of stars that having acquired the enough energy to escape the cluster are still within the cluster Jacobi radius. Both, potential escapers and unbound stars, show hot kinematics, not observed along tidal tails of star clusters. We report on the first evidence of an open cluster with stars crossing such a transitional scenario, namely: ASCC 92. The open cluster gathers nearly 10 percent of its initial total mass, and is moving toward Galactic regions affected by higher interstellar absorption. Precisely, the obscured appearance of the cluster could have hampered disentangling its true internal dynamical evolutionary stage, previously.
keywords:
Galaxy: open clusters and associations: individual: ASCC 92 – methods: data analysis1 Introduction
The All-Sky Compiled Catalogue of more than 2.5 million stars (ASCC-2.5 Kharchenko, 2001) was used by Kharchenko et al. (2005) to identify known open clusters. They developed an iterative pipeline to be used in that search, which they took advantage to discover other 109 new open clusters. We focus here on ASCC-92, one of those new open clusters, that was also discovered from an analysis of the Tycho 2 catalogue (Høg, 2000) and the Digitized Sky Survey (DSS) plates, and named Alessi 31 (Alessi et al., 2003; Kronberger et al., 2006). The cluster was also named MWSC 2723 by Kharchenko et al. (2012). Surprisingly, the cross-match of the cluster names was performed for the first time very recently by Liu & Pang (2019). Indeed, there have been several studies on the cluster without acknowledging those that relies on different cluster names.
ASCC-92 caught our attention while analyzing it from the Gaia DR3 (Gaia Collaboration et al., 2016; Babusiaux et al., 2022) database, because some of the derived cluster’s properties hinted at, as far as we are aware, to be the first observed star cluster confirming the theoretical predictions by Küpper et al. (2010). Küpper et al. (2010) performed a comprehensive set of N-body simulations to study the evolution of surface density and velocity dispersion profiles of star clusters as a function of time until cluster dissolution. They modelled clusters for an interval of 4 Gyr, if they did not dissolve before reaching this age. without stellar evolution and without primordial binaries. They found that potential escapers - stars energetically unbound located inside the Jacobi radius () - are more numerous than bound stars at distances from the cluster centre 0.5, and that beyond 0.7 they compose nearly the whole cluster population. They also showed from the fit of nearly 104 computed surface density profiles that it is possible to derive reliable values using King models for extended clusters on nearly circular orbits, and that by including to them three more free parameters, it is possible to derive values with an accuracy of 10 per cent for clusters in eccentric orbits. Likewise, they studied tidal debris in the cluster’s outskirts and found that they are well represented by a power law with slope of -4 to -5, while close to apogalacticon it turns significantly shallower ( -1).
Numerical simulations of the 3D distribution of stars in clusters with tidal tails have been previously developed, for instance, by Kharchenko et al. (2009). They have shown to provide a satisfactory representation of stars along the leading and trailing tails in the Hyades (Röser & Schilbach, 2019a) and Preasepe (Röser & Schilbach, 2019b), respectively, uncovered using Gaia data. Likewise, AMUSE (Portegies Zwart & McMillan, 2018, and references therein), an astronomical multipurpose software environment that simulates the evolution of a Hyades-like cluster on a relistic orbit, has been recently used to confirm long tails in the Hyades (Jerabkova et al., 2021) discovered from Gaia data, while the N-body code PETAR (Wang et al., 2020) combined with GALPY (Bovy, 2015), was employed by Wang & Jerabkova (2021) to study the long-term evolution of young open clusters and their tidal streams. As can be seen, the simulations by Küpper et al. (2010) stands out in the sense that they predict a particular stage in the cluster internal dynamical evolution, rather than the existence of tidal tails.
In this work, we carried out a thorough analysis of ASCC 92 not easy handled open cluster. We discovered that it is entering into an interstellar cloud and, more importantly, it is facing its last breath before total disruption. As far as we are aware, there were not studied open clusters cautch in such a final evolutionary stage. Moreover, the present results provide the first evidence confirming theoretical speculations on the bound/unbound conditions of cluster stars from the analysis of their total energies. In Section 2 we describe our analysis and derive the cluster fundamental parameters, while in Section 3 we discuss the obtained results to the light of previous studies on the cluster and uncover the real disrupting cluster stage. Section 4 summarizes the main conclusions of this work.
| Ref. | radius | distance | log(age /yr) | [Fe/H] | pmra | pmdec | RV | |
|---|---|---|---|---|---|---|---|---|
| (arcmin) | (mag) | (pc) | (dex) | (mas/yr) | (mas/yr) | (km/s) | ||
| ASCC-92 | ||||||||
| 1 | 18 | 0.25 | 650 | 9.01 | -7.680.49 | -4.910.59 | ||
| 2 | 13.4 | 0.312 | 644 | 9.08 | -6.630.33 | -5,530.33 | ||
| 3 | 22.7 | 67820 | 8.540.02 | 0.25 | -1.1570.306 | -4.1150.280 | ||
| Alessi 31 | ||||||||
| 4 | -5.293.78 | -2.164.67 | ||||||
| 5 | -5.265.45 | -2.206.52 | ||||||
| 6,7,8 | 0.56 | 663.91.5 | 8.38 | -1.1640.225 | -4.1220.206 | 5.361.95 | ||
| 9 | 0.45-0.92 | 676.010.0 | 8.850.05 | 0.000.10 | -1.1530.128 | -4.2010.115 | 0.989.81 | |
2 Data analysis
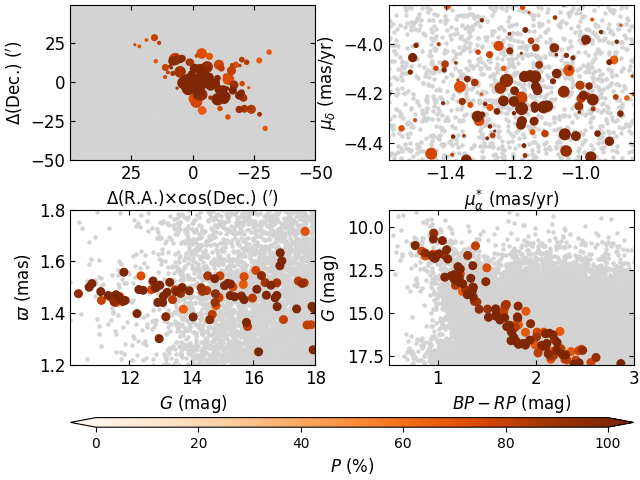
Machine learning techniques have become a powerful tool for discovering new open clusters using large databases (Hunt & Reffert, 2021; Jaehnig et al., 2021; Hao et al., 2022; Castro-Ginard et al., 2022). We tried to recognize star members of ASCC 92 using the widely recommended HDBSCAN (Hierarchical Density-Based Spatial Clustering of Applications with Noise, Campello et al., 2013) Gaussian mixture model technique (Hunt & Reffert, 2021). Cluster stars were recovered after extensively trying with different groups of searching variables on the Gaia DR3 (Gaia Collaboration et al., 2016; Babusiaux et al., 2022) database. Indeed, we firstly used only positions (RA, Dec.) as searching variables, and did not have success in identifying the bulk of the clusters members. With the aim of improving the clustering search, we then included proper motions, and the results did not improve the previous performance. We then constrained the search to stars located inside a circle of 50 centred on the cluster, 18 mag, and proper motion centred on (pmra,pmdec) = (-1.18,-4.15) mas/yr and within a circle of 0.4 mas/yr. Having the cluster area and, particularly, the proper motions constrained for a successful clustering search, HDBSCAN carried out a satisfactory search. The outcome of the position-proper motion driven search is shown in Fig. 1. As can be seen, the resulting cluster colour-magnitude diagram (CMD) is affected by differential reddening.
Recently, Cantat-Gaudin et al. (2018) recovered the largest number of cluster members identified up to date, 185, using the Unsupervised Photometric Membership Assignment in Stellar Clusters (UPMASK Krone-Martins & Moitinho, 2014) on Gaia DR2 data. We provide a comparison analysis between their results and the present ones in the Appendix. However, we refer the reader to the study of Hunt & Reffert (2021), who carried out a sound comparison of the performance of different clustering searching algorithms, and described advantages and disadvantages of them.
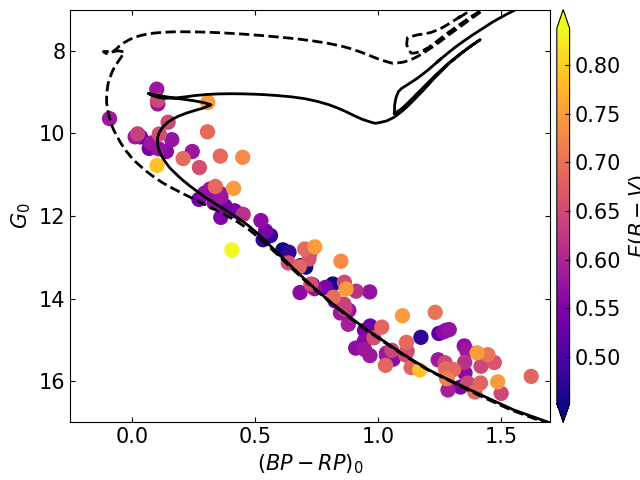
We used different Milky Way reddening map models through the GALExtin111http://www.galextin.org/ interface (Amôres et al., 2021) to obtain the mean interstellar reddening along the line of sight of the cluster, and surprisingly realised of the wide range of mean values retrieved, namely, 1.09 mag (Schlegel et al., 1998); 0.28 mag (Drimmel et al., 2003); 0.15-1.83 mag (Amôres & Lépine, 2005); 4.9 mag (Marshall et al., 2006); 1.05 mag (Planck Collaboration et al., 2014); 1.11 mag (Schlafly et al., 2014); and 0.67 mag (Chen et al., 2019), respectively. Since the reddening maps of Chen et al. (2019) were built specifically for Gaia bandpasses, and have better spatial resolution 6 arcmin than other reddening maps, we adopted them for interpolating individual reddening values for the selected cluster stars with membership probabilities 70 percent and corrected their magnitudes and colours using the total to selective absorption ratios given by Chen et al. (2019). The absorption uncertainties (() span from 0.003 up to 0.020 mag, with an average of 0.010 mag at any interval.) The reddening corrected cluster CMD is shown in Fig. 2, with stars coloured according to their values. Note that the spatial resolution of the reddening map allowed the detection of differential reddening (see Fig. 1).
In order to derive the cluster age and metallicity we fitted theoretical isochrones computed by Bressan et al. (2012, PARSEC v1.2S222http://stev.oapd.inaf.it/cgi-bin/cmd) and the Automated Stellar Cluster Analysis code (ASteCA, Perren et al., 2015). which explored the parameter space of synthetic CMDs through the minimization of the likelihood function defined by Tremmel et al. (2013, the Poisson likelihood ratio (eq. 10)) using a parallel tempering Bayesian MCMC algorithm, and the optimal binning Knuth (2018)’s method. Uncertainties in the resulting age and metallicity were estimated from the standard bootstrap method described in Efron (1982). While running ASteCA, we used the mean cluster distance obtained from the cluster member stars’ parallaxes. ASCC 92 turned out to be a Hyades-like aged open cluster with a solar metal content. Table 1 lists all the derived parameters, while Fig. 2 illustrates the matching performance of an isochrone with the derived age and metallicity of ASCC 92. Table 1 aslo summarizes the different works carried out on the cluster under different cluster names, for comparison purposes.
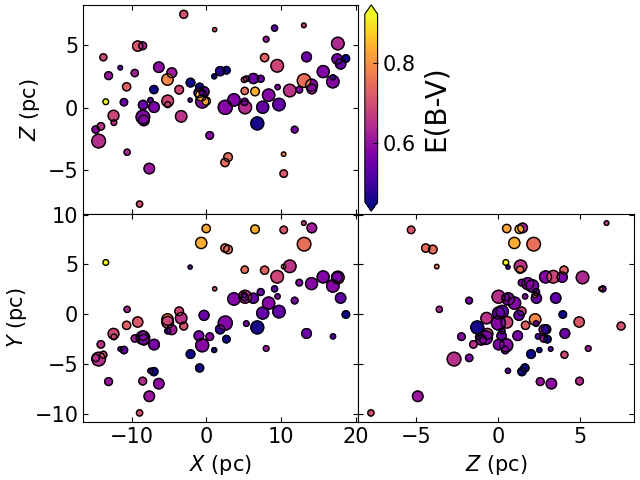
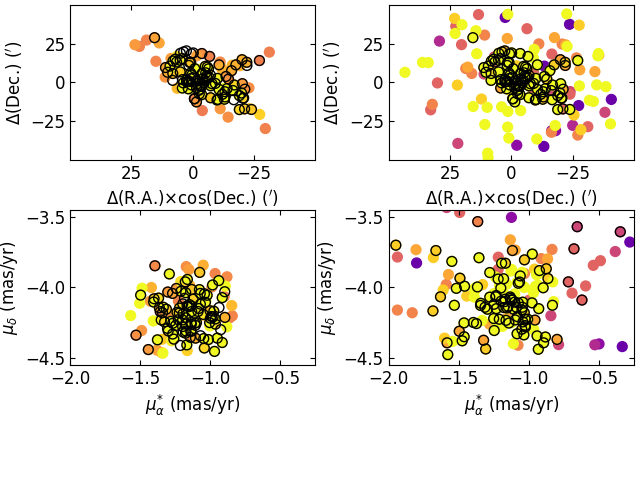
From Gaia DR3 coordinates, proper motions, parallaxes, and radial velocities of cluster members, we computed Galactic coordinates and space velocities employing the Astropy333http://www.astropy.org package (Astropy Collaboration et al., 2013, 2018), which simply required the input of Right Ascension, Declination, parallaxes, proper motions and radial velocity of each star. We adopted the default values for the Galactocentric coordinate frame, namely : ICRS coordinates (RA, DEC) of the Galactic centre = (266.4051, -28.936175); Galactocentric distance of the Sun = 8.122 kpc, height of the Sun above the Galactic midplane = 20.8 pc; and solar motion relative to the Galactic centre = (12.9, 245.6, 7.78) km/s. The position of the Sun is assumed to be on the axis of the final, right-handed system. That is, the axis points from the position of the Sun projected to the Galactic midplane to the Galactic centre - roughly towards (l,b)= (0,0). The axis points roughly towards Galactic longitude l=90, and the axis points roughly towards the North Galactic Pole (b=90). Gaia Collaboration et al. (2022) extensively analysed the uncertainties in the Galactic coordinates as a function of the heliocentric distance for stars with radial velocity measurements and found that at the ASCC 92 distance the relative errors are less than 1.5 per cent. The spatial distribution of the cluster stars is depicted in Fig. 3, where they were on purpose coloured according to their individual values, aiming at rebuilding the 3D reddening map.
As for the space velocity components, they were transformed to the , , and spherical components, and from them we computed the 3D dispersion velocity and anisotropy , following the prescription described in Piatti (2019). We obtained eight 3D dispersion velocity and anisotropy profiles, respectively, using distance intervals of 1.0, 1.5, 2.0, 2.5, 3.0, 3.5, 4.0 and 4.5 pc, where we calculated the values of these parameters. Then, we obtained the mean values and standard dispersions (error bars) as a function of the distance to the cluster centre () depicted in Fig. 3.
3 Results and Discussion
3.1 Cluster’s fundamental parameters
Thanks to the stringent Gaia DR3 data sets selection criteria applied (see a comprehensive overview in Hunt & Reffert, 2021), we identified by visual inspection in the vector point diagram cluster stars tightly gathered around pmra and pmdec values that resulted to be fair first guesses of the derived mean cluster proper motion, in excellent agreement with recent accurate estimates (Cantat-Gaudin et al., 2018; Soubiran et al., 2018; Cantat-Gaudin et al., 2020). Because of the highly variable reddening across the cluster field the combination of proper motions and parallaxes resulted to be a key strategic search procedure, that allowed us to recover the spatial distribution of cluster’s stars. Whenever sky positions were used as HDBSCAN searching variables, we did not recover any clustering signature in the phase-space used. This means that genuine clustering detection is not always guaranteed by enlarging the number of searching variables (e.g. position, motion, photometry).
Previous works on ASCC 92 did not report the existence of variable interstellar absorption along the cluster line of sight, which we found it spans the range from 0.45 mag to 0.92 mag. We speculate with the possibility that previous age cluster estimates based on theoretical isochrone fit to the cluster CMD obtained much younger ages because of this effect. We superimposed, for comparison purposes, an isochrone of log( /yr) = 8.45 (the average age estimate from Liu & Pang (2019) and Cantat-Gaudin et al. (2020)), which confirms that ASCC 92 is not such a younger cluster. That younger isochrone seems to better reproduce the observed cluster CMD of Fig. 1. Likewise, cluster ages larger than 1 Gyr (see Table 1) could be affected by field star contamination.
3.2 Cluster’s motion
The mean cluster space velocity turned out to be (, , ) = (16.8, 232.9, 9.4) km/s, which shows that ASCC 92 is mainly moving following the rotation of the Milky Way. If we drew the star velocity vectors in Fig. 3, we would see that the respective arrows are nearly pointing parallel to the Y axis. According to the space distribution of values, it would seem that ASCC 92 is moving toward a direction of increasing interstellar absorption. From Fig. 2, we estimated that varies 0.2 mag in 5 pc. By using = /(5.81021 atoms/cm2 per mag) (Bohlin et al., 1978), we got an HI column density of 1.161021 atoms/cm2, which along the 5 pc gives a space density of 75 atoms/cm3. This is a diffuse cloud density, or a density for the edge of a molecular cloud. The juxtaposition of the cluster next to a moderate density gas cloud might be expected if the cluster were young (age 100 Myr), since the gas could be from the GMC where it formed. Chen et al. (2020, and references therein) compiled a large catalogue of molecular clouds with accurate distances within 4 kpc of the Milky Way disc. We did not find any molecular cloud that matches the ASCC 92 locus, and did not find any expected motion signatures in the distribution of the space velocity vectors that accounts for a collision of the cluster with a molecular cloud. Therefore, a plausible interpretation could be that ASCC 92 is entering a more obscure region of the Milky Way disc.
3.3 Cluster’s internal kinematic
We analysed the cluster internal kinematics and found that there is no signature of expansion along its major axis, which is contained mainly in the () plane, nor any expected pattern driven by Milky Way tidal forces (Meingast et al., 2021). As can be seen in Fig. 3 (right panel), the cluster’s stars motion is isotropic from 6 pc outwards from the cluster centre, which means that there is no privileged direction of motion. Cluster stars placed in the inner 5 pc show the expected decreasing velocity dispersion profile of bound stars, while the velocity dispersion increases outwards. Such a peculiar behaviour was predicted by Küpper et al. (2010) and, as far as we are aware, it has not been observed until now.
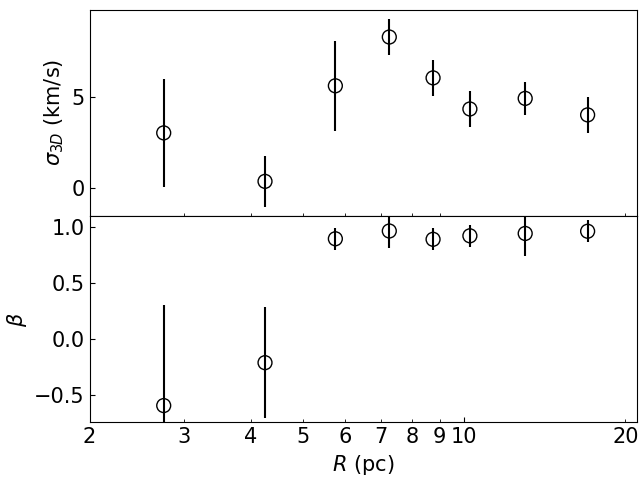
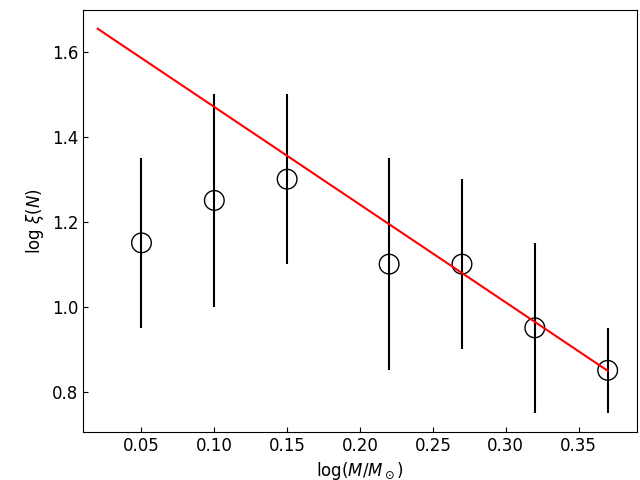
With the aim of verifying such a theoretical result, we computed the critical energy a star needs to escape the cluster and its total energy. For the calculation we used equations 13 and 14 of Küpper et al. (2010), adopting a Milky Way mass enclosed inside the cluster Galactocentric distance (7.66 kpc) of (1.00.2)1011M⊙ (Bird et al., 2022). An upper cluster mass was calculated from the cluster mass function built from stars with membership probabilities 70 per cent. We obtained the individual masses by interpolation in the adopted PARSEC v1.2S isochrone. We then fitted the resulting mass function with a Kroupa (2002)’s profile. Fig. 4 shows the resulting mass function, with points and error bars representing the average and corresponding standard deviations of five mass functions built using mass intervals of log(/M⊙) = 0.05 up to 0.30, in steps of 0.05. We finally integrated the fitted Kroupa (2002)’s mass function from the maximum observed mass down to 0.5M⊙. The upper cluster mass turned out to be 580 M⊙. We used alternatively ASteCA (see Sect. 2) for the construction of a large number of synthetic CMDs from which it finds the one which best resembles the observed CMD. Thus, the star cluster present mass and the binary fraction associated to that best representative generated synthetic CMD are adopted as the best-fitted star cluster properties. ASteCA generates synthetic CMDs by adopting the initial mass function given by Kroupa (2002) and a minimum mass ratio for the generation of binaries of 0.5. The total observed star cluster mass and its binary fraction were set in the ranges 100-5000 M⊙ and 0.0-0.5, respectively. We derived a cluster mass of 566110M⊙ with a binary fraction of 0.400.06, in excellent agreement with the above mass estimate.
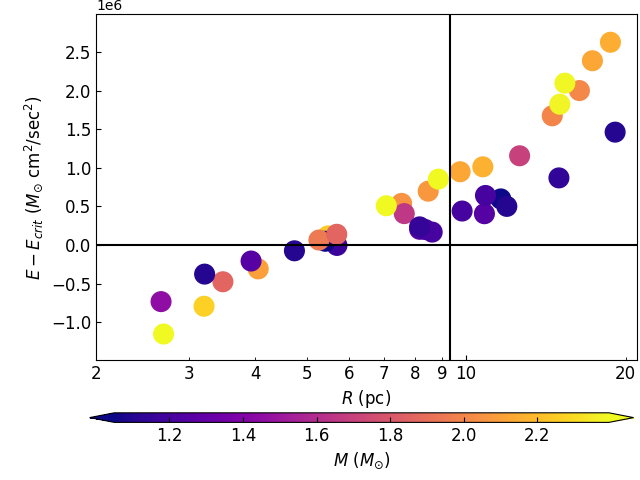
Fig. 5 shows the difference between the total and the critical star energy as a function of the distance to the cluster centre. The vertical line represents the derived value (9.3 pc). As can be seen, stars located at 5 pc are bound stars, in excellent agreement with the 3D velocity dispersion profile and calculated cluster anisotropy. Stars beyond are unbound stars, which show a hot kinematics, while those located at 5 (pc) 9.3 are the stars that will next escape the cluster. We added the masses of stars enclosed within , which resulted to be 56M⊙, nearly 10 percent of the upper cluster mass limit. This outcome suggests that ASCC 92 is facing its last breath.
4 Conclusions
We used Gaia DR3 data to thoroughly analyse ASCC 92, a Milky Way open cluster with somewhat discrepant parameters in the literature. The analysis of the Gaia data resulted challenging while trying to employ the recommended Hierarchical Density-Based Spatial Clustering of Applications with Noise, because the cluster is projected toward a region affected by noticeable differential reddening. Such a variable obscure appearance of ASCC 92 caused that clustering in the stellar distribution in the sky is not evident. Therefore, by using positions as clustering searching variables, we arrived to an unsatisfactory number of identification of cluster members. By imposing some constraints, namely, a limited region of the searchable area, mean proper motions and dispersion in very good agreement with reliable estimates, we identified 171 stars with similar parallaxes that clearly stand out in the sky as an stellar aggregate. Differential reddening has not been used in previous analyses of the cluster’s CMD. This made the evolved region of the cluster Main Sequence, and particularly, the Main Sequence turnoff, appear blurred. With the appropriate correction for differential reddening, we obtained a cluster age 710 Myr older than recent estimates using Gaia data 240 Myr. The isochrone corresponding to the cluster age matches satisfactorily well the cluster Main Sequence along 7 mag.
We also studied the cluster internal dynamical evolution and found that ASCC 92, while moving nearly in the Milky Way disc following Galactic rotation, does not show any signature of internal expansion, rotation, or both combined. Its 3D velocity dispersion profile and anisotropy reveal that innermost cluster members move following the expected kinematics of bound stars, while those in the cluster outskirts show an isotropic kinematic behaviour, like unbound stars. ASCC 92 shows a kinematic transition region of increasing velocity dispersion and anisotropy of bound stars. These stars have the necessary energy to leave the cluster, but they are still within its boundaries. This peculiarity was predicted from N-body simulations by Küpper et al. (2010). As fas as we are aware, ASCC 92 is the first studied clusters showing evidence of being populated by these kinematically peculiar stars.
Acknowledgements
I thank Enrico Vesperini, Bruce Elmegreen and Pavel Kroupa for insightful comments and suggestions. I thank the referee for the thorough reading of the manuscript and timely suggestions to improve it.
This work has made use of data from the European Space Agency (ESA) mission Gaia (https://www.cosmos.esa.int/gaia), processed by the Gaia Data Processing and Analysis Consortium (DPAC, https://www.cosmos.esa.int/web/gaia/dpac/consortium). Funding for the DPAC has been provided by national institutions, in particular the institutions participating in the Gaia Multilateral Agreement.
This research made use of Astropy, a community-developed core Python package for Astronomy.
5 Data availability
Data used in this work are available upon request to the author.
References
- Alessi et al. (2003) Alessi B. S., Moitinho A., Dias W. S., 2003, A&A, 410, 565
- Amôres & Lépine (2005) Amôres E. B., Lépine J. R. D., 2005, AJ, 130, 659
- Amôres et al. (2021) Amôres E. B., et al., 2021, MNRAS, 508, 1788
- Astropy Collaboration et al. (2013) Astropy Collaboration et al., 2013, A&A, 558, A33
- Astropy Collaboration et al. (2018) Astropy Collaboration et al., 2018, AJ, 156, 123
- Babusiaux et al. (2022) Babusiaux C., et al., 2022, arXiv e-prints, p. arXiv:2206.05989
- Bird et al. (2022) Bird S. A., et al., 2022, MNRAS,
- Bohlin et al. (1978) Bohlin R. C., Savage B. D., Drake J. F., 1978, ApJ, 224, 132
- Bovy (2015) Bovy J., 2015, ApJS, 216, 29
- Bressan et al. (2012) Bressan A., Marigo P., Girardi L., Salasnich B., Dal Cero C., Rubele S., Nanni A., 2012, MNRAS, 427, 127
- Campello et al. (2013) Campello R. J. G. B., Moulavi D., Sander J., 2013, In: Pei, J., Tseng, V.S., Cao, L., Motoda, H., Xu, G. (eds) Advances in Knowledge Discovery and Data Mining. Lecture Notes in Computer Science(), vol 7819. Springer, Berlin, Heidelberg.
- Cantat-Gaudin et al. (2018) Cantat-Gaudin T., et al., 2018, A&A, 618, A93
- Cantat-Gaudin et al. (2020) Cantat-Gaudin T., et al., 2020, A&A, 640, A1
- Castro-Ginard et al. (2022) Castro-Ginard A., et al., 2022, A&A, 661, A118
- Chen et al. (2019) Chen B. Q., et al., 2019, MNRAS, 483, 4277
- Chen et al. (2020) Chen B. Q., et al., 2020, MNRAS, 493, 351
- Dias et al. (2014) Dias W. S., Monteiro H., Caetano T. C., Lépine J. R. D., Assafin M., Oliveira A. F., 2014, A&A, 564, A79
- Drimmel et al. (2003) Drimmel R., Cabrera-Lavers A., López-Corredoira M., 2003, A&A, 409, 205
- Efron (1982) Efron B., 1982, The Jackknife, the Bootstrap and other resampling plans
- Gaia Collaboration et al. (2016) Gaia Collaboration et al., 2016, A&A, 595, A1
- Gaia Collaboration et al. (2022) Gaia Collaboration et al., 2022, arXiv e-prints, p. arXiv:2206.06207
- Hao et al. (2022) Hao C. J., Xu Y., Wu Z. Y., Lin Z. H., Liu D. J., Li Y. J., 2022, A&A, 660, A4
- Høg (2000) Høg E., 2000, in Murdin P., ed., , Encyclopedia of Astronomy and Astrophysics. p. 2862, doi:10.1888/0333750888/2862
- Hunt & Reffert (2021) Hunt E. L., Reffert S., 2021, A&A, 646, A104
- Jaehnig et al. (2021) Jaehnig K., Bird J., Holley-Bockelmann K., 2021, ApJ, 923, 129
- Jerabkova et al. (2021) Jerabkova T., Boffin H. M. J., Beccari G., de Marchi G., de Bruijne J. H. J., Prusti T., 2021, A&A, 647, A137
- Kharchenko (2001) Kharchenko N. V., 2001, Kinematika i Fizika Nebesnykh Tel, 17, 409
- Kharchenko et al. (2005) Kharchenko N. V., Piskunov A. E., Röser S., Schilbach E., Scholz R. D., 2005, A&A, 440, 403
- Kharchenko et al. (2009) Kharchenko N. V., Berczik P., Petrov M. I., Piskunov A. E., Röser S., Schilbach E., Scholz R. D., 2009, A&A, 495, 807
- Kharchenko et al. (2012) Kharchenko N. V., Piskunov A. E., Schilbach E., Röser S., Scholz R. D., 2012, A&A, 543, A156
- Kharchenko et al. (2013) Kharchenko N. V., Piskunov A. E., Schilbach E., Röser S., Scholz R. D., 2013, A&A, 558, A53
- Knuth (2018) Knuth K. H., 2018, optBINS: Optimal Binning for histograms (ascl:1803.013)
- Kronberger et al. (2006) Kronberger M., et al., 2006, A&A, 447, 921
- Krone-Martins & Moitinho (2014) Krone-Martins A., Moitinho A., 2014, A&A, 561, A57
- Kroupa (2002) Kroupa P., 2002, Science, 295, 82
- Küpper et al. (2010) Küpper A. H. W., Kroupa P., Baumgardt H., Heggie D. C., 2010, MNRAS, 407, 2241
- Liu & Pang (2019) Liu L., Pang X., 2019, ApJS, 245, 32
- Marshall et al. (2006) Marshall D. J., Robin A. C., Reylé C., Schultheis M., Picaud S., 2006, A&A, 453, 635
- Meingast et al. (2021) Meingast S., Alves J., Rottensteiner A., 2021, A&A, 645, A84
- Perren et al. (2015) Perren G. I., Vázquez R. A., Piatti A. E., 2015, A&A, 576, A6
- Piatti (2019) Piatti A. E., 2019, ApJ, 882, 98
- Planck Collaboration et al. (2014) Planck Collaboration et al., 2014, A&A, 571, A11
- Portegies Zwart & McMillan (2018) Portegies Zwart S., McMillan S., 2018, Astrophysical Recipes; The art of AMUSE, doi:10.1088/978-0-7503-1320-9.
- Röser & Schilbach (2019a) Röser S., Schilbach E., 2019a, A&A, 627, A4
- Röser & Schilbach (2019b) Röser S., Schilbach E., 2019b, A&A, 627, A4
- Sampedro et al. (2017) Sampedro L., Dias W. S., Alfaro E. J., Monteiro H., Molino A., 2017, MNRAS, 470, 3937
- Schlafly et al. (2014) Schlafly E. F., et al., 2014, ApJ, 789, 15
- Schlegel et al. (1998) Schlegel D. J., Finkbeiner D. P., Davis M., 1998, ApJ, 500, 525
- Soubiran et al. (2018) Soubiran C., et al., 2018, A&A, 619, A155
- Tremmel et al. (2013) Tremmel M., et al., 2013, ApJ, 766, 19
- Wang & Jerabkova (2021) Wang L., Jerabkova T., 2021, A&A, 655, A71
- Wang et al. (2020) Wang L., Iwasawa M., Nitadori K., Makino J., 2020, MNRAS, 497, 536
Appendix A Membership criteria
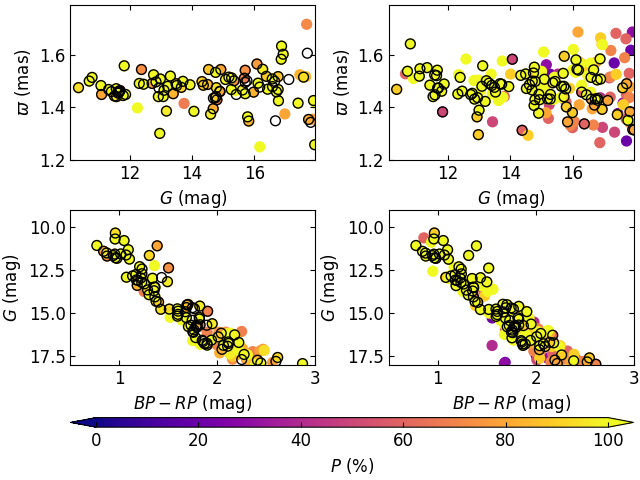
For completeness purposes, we compared our membership probabilities with those obtained by Cantat-Gaudin et al. (2018). In order to cross-match both samples, we employed the names used by Gaia to identify stellar sources and the Astropy package. Left and right panels of Fig. 6 correspond to the star selection made in this work and those from Cantat-Gaudin et al. (2018), respectively. The symbols are coloured according to the membership probability () assigned by each study, while those encircled with a black open circle are the stars in common in both works. As can be seen, the number of stars with relatively high membership probabilities is larger in the present sample. The proper motions and mean parallaxes span wider ranges in Cantat-Gaudin et al. (2018)’s sample. We are confident in the more stringent membership selection criteria applied here and the use of stars with 70 per cent in the performed analyses. Note that the differential reddening is present in both CMDs. Finally, Table 2 lists the Gaia names of the stars identified in this work that are absent in the Cantat-Gaudin et al. (2018)’s sample.
| 4151598199606998528 | 4151598440125176192 | 4151599677077307136 | 4151581638213227264 |
| 4151573872910627584 | 4151703855796778752 | 4151706535856460544 | 4163590534247506560 |
| 4151550675772022528 | 4150045173804666368 | 4151707704087604352 | 4151559373100984704 |
| 4151569917226328448 | 4151572051844491904 | 4150048884656569472 | 4151584249552588416 |
| 4151693715358252288 | 4151599230392430848 | 4151574285227815040 | 4151561056728596480 |
| 4151598818083966464 | 4163589851366486144 | 4151558342294713216 | 4151584932425464832 |
| 4151607408016493568 | 4151546075881760640 | 4163613628306249088 | 4151548545465664000 |
| 4151594591833995776 | 4151611874782646656 | 4151596614737584256 |