Monolithically Integrated Wavelength-meter in InP with measurement bandwidth of 100nm centered on the C band.
Abstract
In this paper we will explore the creation of a monolithically integrated wavelength meter in InP. This type of devices are a key requirement for many applications and it is especially important to have them integrated with active components like lasers and gain sections.
We present a wavelength meter based on multiple ring resonators that has been realized in a commercial MPW run and tested using a tunable laser.
The designed circuit is theoretically capable of resolution down to 1.6pm and a measurement speed down to 500ps within a wavelength range of 100nm.
1 Introduction
The determination of light wavelength is not limited to telecommunication application, but it has also various applications in Wavelength Division Multiplexing, spectroscopy, tunable lasers control and metrology [1, 2, 3].
Among all integrated photonics platforms, Indium Phosphide (InP) is the only platform that allows monolithic integration of lasers and optical gain sections[4].
It is important to have wavelength meters that can be co-integrated with lasers, since this allows better control of integrated tunable laser with all the benefits of integration: lower footprint, better performance and easier fabrication.
InP platforms have a second advantage over the others as they enable higher operation speeds, thanks to high speed modulators, and give future prospects of integration into a more advanced compact photonic system.
A variety of different designs for integrated wavelength meters has been reported in the literature [2, 5, 6]. All these works are focused on Silicon or Silicon Nitride platform employing different techniques between ring resonators or differential transmission thought multimode interferometers. The most remarkable result so far have has been able to achieve good performance both in range () and accuracy () [7].
Respect to Silicon and Silicon Nitride platform, InP suffers lower performances since passive components have higher losses and higher bend radius are used in the platforms. This makes particularly hard to design ring resonators with high Free Spectral Range, that are at the hearth of wavelength meters design.
So far the wider bandwidth reported in an InP platform is of 3nm [8].
The design that we present in this paper is specifically thought to mitigate the limitation of the InP platform by use of different ring resonators.
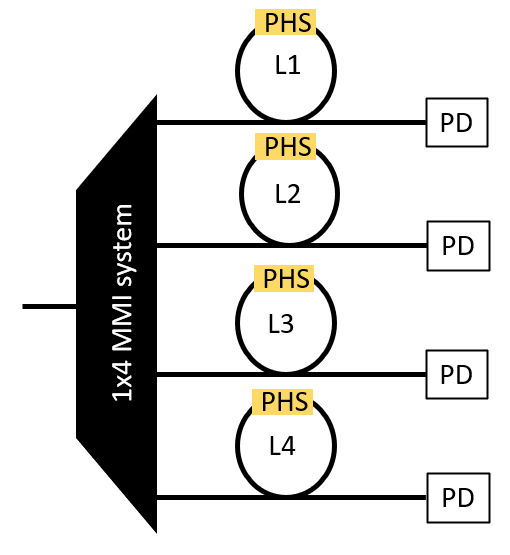
In our design, in order to achieve a high operation bandwidth we employ four microring resonators, each of them contains a phase modulator that can achieve phase shift and the through port of the ring is connected to an independent photodiode (PD).
The different length of the rings leads to different Free Spectral Range (FSR) that can be used to increase the operational bandwidth of the system.
The setup work with the modulation of spectral position of ring resonances while monitoring the PDs output.
The subsequent wavelength measurement is obtained by checking at what modulator bias we observe a minimum in ring transmission. This information creates a set of 4 values that will then be compared with a lookup table, obtained during calibration, to estimate the light wavelength.
The presented design has been fabricated on the generic Indium Phosphide (InP) platform of the Franhofer Heinrich Hertz Institute(HHI), the experimental results in this letter have been obtained with a custom photonic setup in the University of Vigo.
2 Methods
In Figure 1 the schematic of the circuit is shown. The device works by routing a monochromatic source to four micro-ring resonators. Each ring contains a phase shifter (PHS) that allows to change the ring resonance when electrically controlled.
Please notice that no "drop" port is present along the rings. In such way unnecessary losses are avoided allowing for higher cavity Q factor.
Calling the phase added by the PHS, the subset of wavelength on resonance with the ring are defined by the expression:
| (1) |
where , is the ring length, the effective refractive index and the voltage applied to the phase shifter.
As mentioned before, the phase can be changed by controlling the value of the applied voltage . If the phase shifter is long enough, can be made greater than and the ring can be tuned on resonance with any input wavelength. The resonance condition can be easily identified since, when reached, minimum power is detected at the photo detector.
Equation 1 does not define a bijective relation between the voltage and a wavelength . In other words, any ring taken individually can operate as a wavelength meter only if its free spectral range () is wider than the band of the unknown source. This problem can be overcome by using carefully designed rings of different length. This is because rings of different lengths have different possible sets of resonances associated with phase shifter voltage . The intersection of such sets determines the input wavelength. To obtain such sets of wavelengths the system is operated as following.
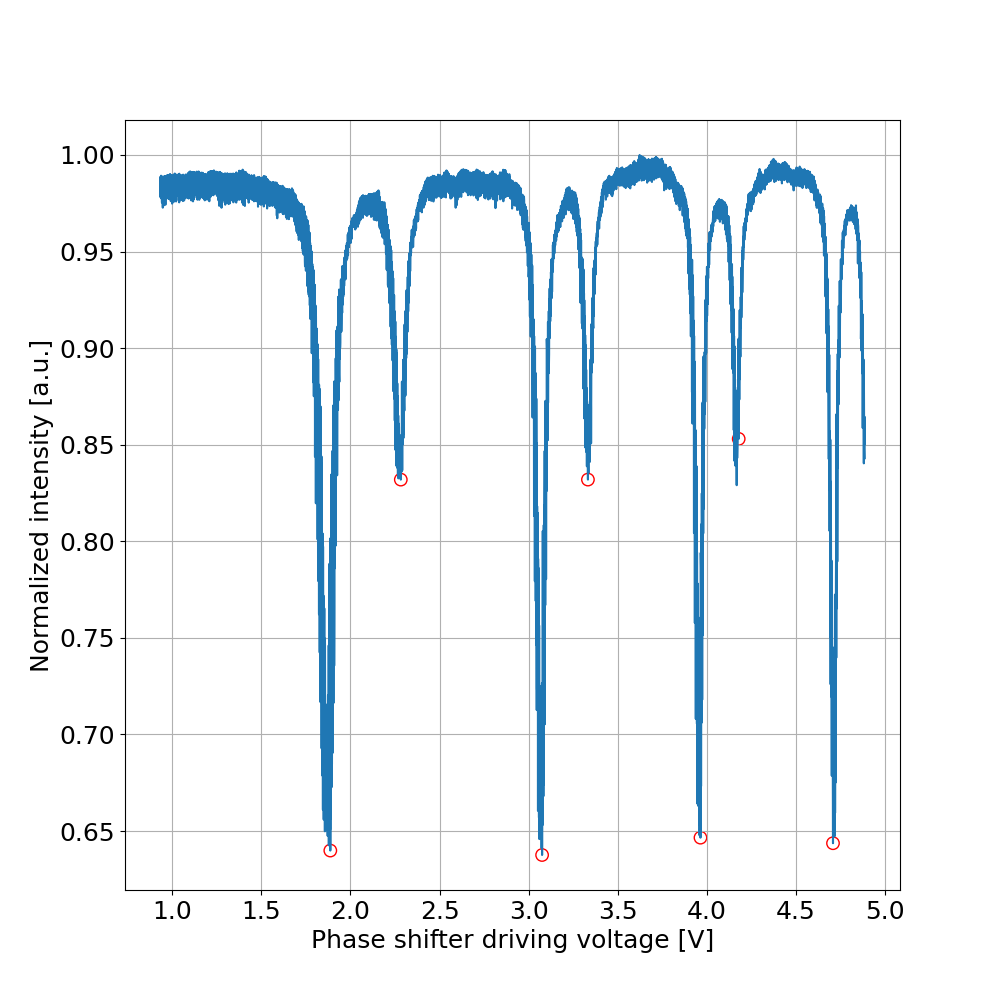
The source to be measured is coupled in the device, and transmitted intensity is measured at the detectors. PHSs are driven to sweep the phase in the interval , in this way all PDs will have at least a minimum in transmission (Figure 3) that can be associated to a driving voltage characteristic of each ring. From each individual resonant voltage the subset of possible resonance wavelengths is deduced.
It is worth to point out that to predict exactly such sets of wavelength a detailed model of: group index dispersion, phase control, temperature dependence and fabrication defects would be necessary. Given the challenge of the task, is much easier to proceed with an external calibration of the system in order to create a look up table where wavelengths are associated to specific voltages .
3 Ring design
Rings must be designed of different length in order to allow for bandwidth expansion. It is advantageous to start with the design of ring , that has to be short as possible. Infact, the shorter the ring, the smaller the propagation loss, thus leading to an high factor and consequently a small full width half maximum (FWHM) of the resonance. This is of critical importance since FWHM poses a lower limit on the resolution achievable with the device. Shorter rings also have a wider FSR, that makes the task of expanding the detectable bandwidth easier.
In general, the minimum achievable length for a ring is fixed by a number of design constrains. Every ring must have: a directional coupler, with a proper length to guarantee coupling, a PHS, long enough to guarantee at least a phase shift, and two 180 degrees bends with the smallest radius of curvature available on the platform.
The shortest ring we have designed in the HHI platform has a length of . We call this ring . When designing the ring, we were afraid of not being able to reach phase shifts up to . We therefore used a PHS of length. As it can be seen from figure 3, we could have been less conservative. A PHS of would have worked as well and would have required a voltage of about to get a phase shift.
| (2) |
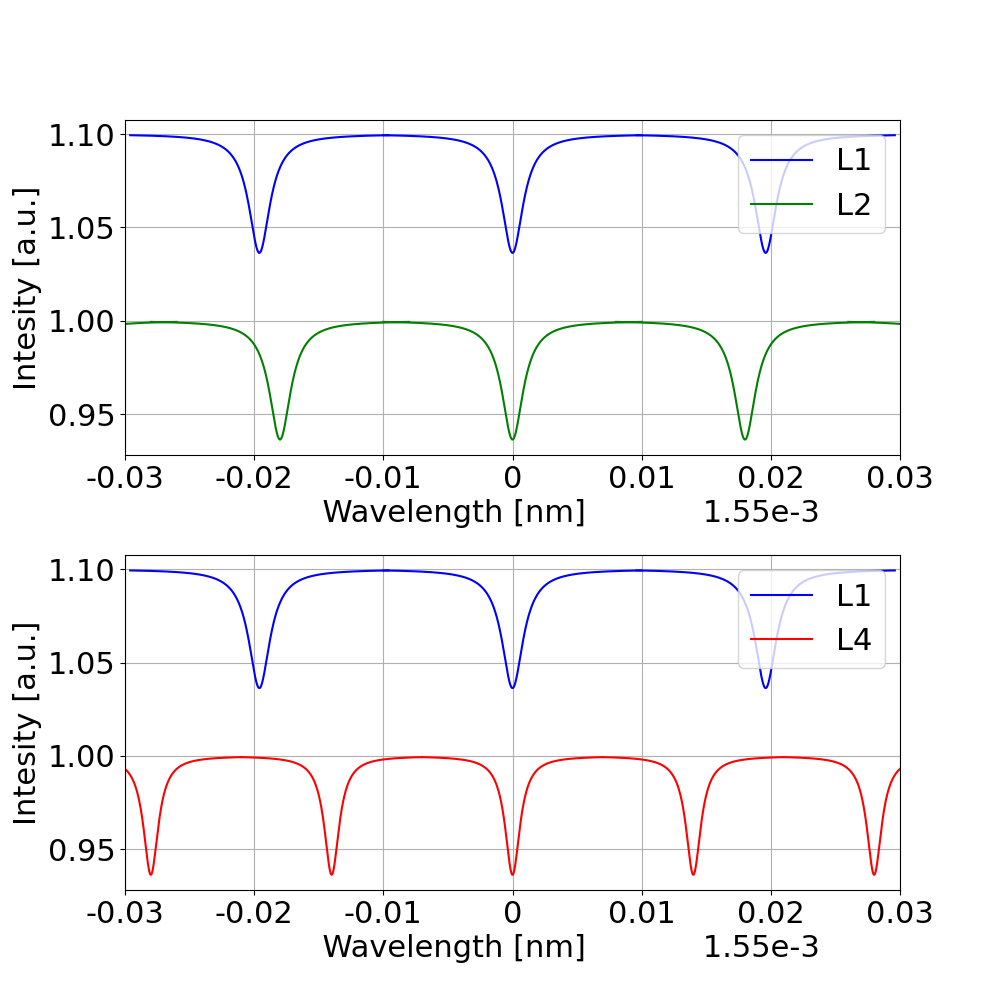
Bottom figure:Ring L1 and Ring L3 have different spectral range resulting in the possibility of determine the wavelength without ambiguity in the selected interval.
For ring , assuming an effective index of , using equation 2 we expect FSR close to GHz () at a central frequency of . With a process that resembles the vernier effect is possible to expand the operational bandwidth of the device.
Equation 3 [9] predicts the combined FSR of two rings of length , . We can verify that a length corresponds to ().
| (3) |
However, this is not sufficient to determine the unknown wavelength over such broad spectrum. With the help of figure 2, we can understand better the problem. In the upper plot the the spectra of ring and are simulated.
Because of the finite of the resonances we cannot determine if the resonance is at , or . In the lower plot instead we see what happens when we compare compare the spectra of and . as a length of such that . The degeneracy has been removed and we can state the resonance common to both rings is at . But why don’t we use only the rings and then? Because in such case the new combined would be of only . According to our simulations, using only three rings is not sufficient to cover accurately a wide band since there are regions in the spectra where a single wavelength cannot be identified. To finally solve the problem we have added ring with .
4 Calibration procedure
At the moment, we have tested the concept of bandwidth expansion over the span of at . For such limited bandwidth rings and are sufficient to determine the wavelength without ambiguity. For that we have used a laser source of known wavelength, and acquired the PD response in steps of . In Figure 3 we see an acquisition of the shortest ring at . We see numerous peaks, that implies that we overestimated the necessary PHS minimum length and we could have used a shorter PHS. The peaks are clearly of two types: in particular we notice the odd peaks are much deeper than the even one. This is likely caused by the propagation of two different optical modes, likely fundamental and . For our calibration, we have decided to consider only the first three odd peaks, that are clearly distinguishable in all our acquisitions. For any wavelength step we have stored the voltages corresponding to such peaks. We did this both for peaks of ring and .
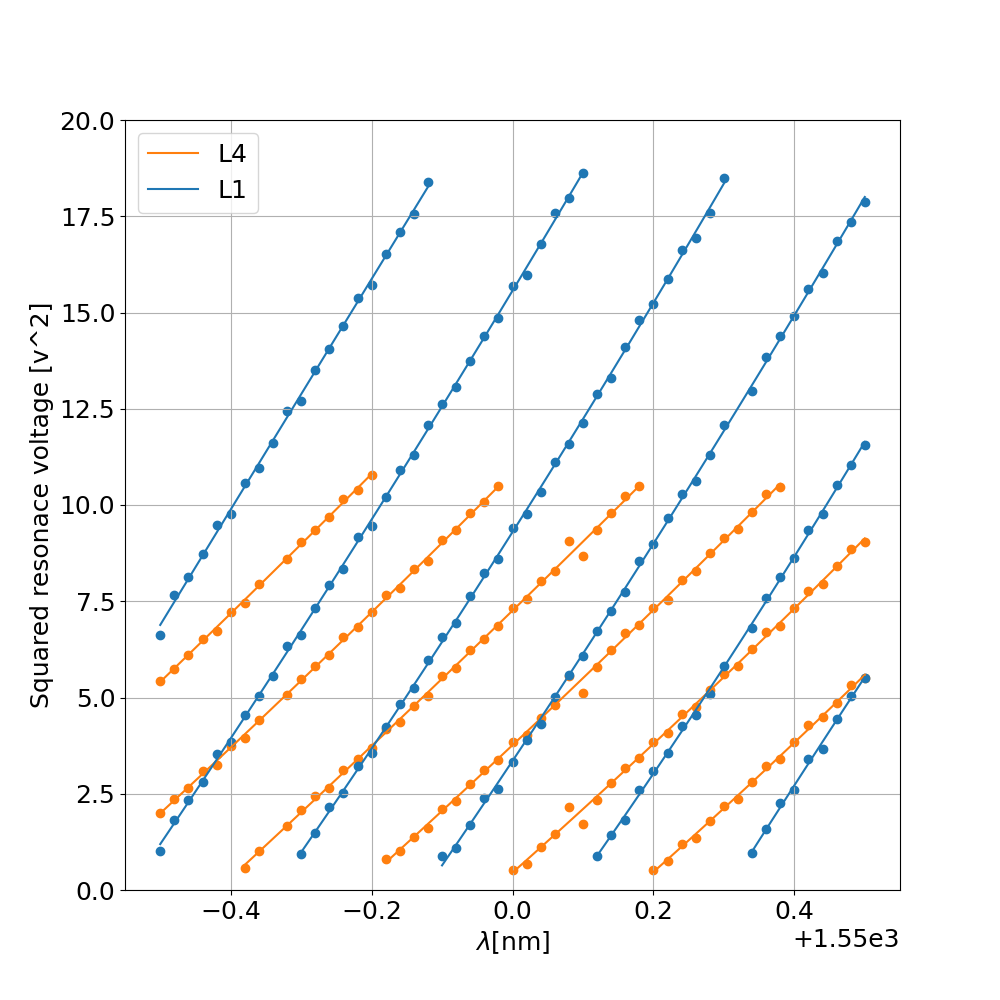
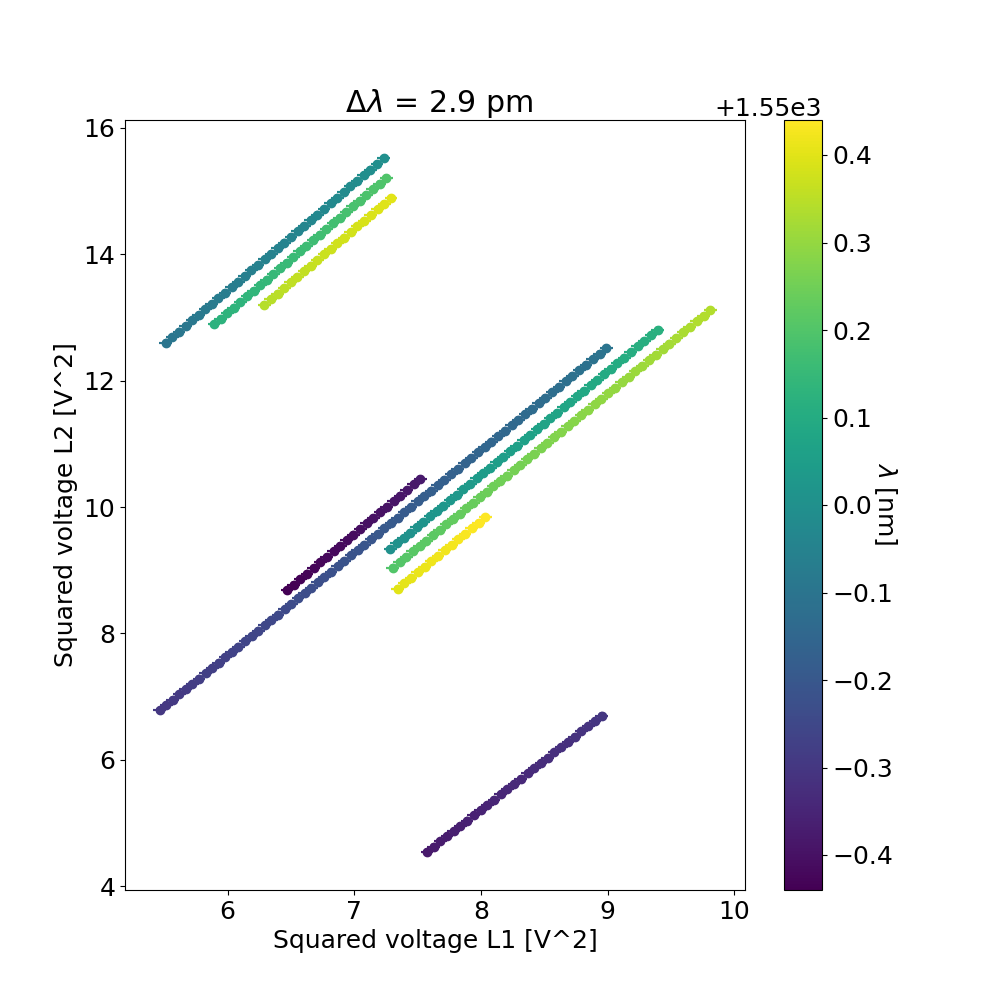
In Fig. 4 we have plotted the square of this voltage versus the corresponding wavelength. We plot the square because PHs are thermally controlled, and the electric power dissipated is proportional to the voltage squared. Every single group of resonances is fitted with a linear function. Using this fit is possible to create the look up table that associates the two voltages (,) to the corresponding wavelength. In the phase diagram of Fig. 5 we have all the data displayed in the look up table. The horizontal axis shows the squared voltage applicable to the ring , the vertical ones refers to the squared voltage applicable to . Points in the phase space are identified by couples of values (,). The color of the point codifies the wavelength according to the color bar on the right. Error bars are also displayed. They have been obtained by computing the standard variation of experimental points from the predicting fitting model. We see that such error-bars correspond to an uncertainty of on the estimated wavelength. To operate the wavelength meter, a script where experimental () are associated to the corresponding wavelength is necessary. Despite the extension of the error bars, the identification of an unique wavelength as been always possible in the tested range of .
5 Reading speed limit
We have realized that there is a minimum speed limit necessary to estimate the wavelength. Such limit is linked to light propagation into ta ring. Indeed,a ring resonator has a typical cavity lifetime that is determined by the factor: . A time is necessary before considering the ring to be stabilized[10]. To cover the full FSR of any of the rings we need a number of steps in the voltage applied to the PHS. We chose this number of steps (), in order not to lose resolution but also not to oversample the PD response. Given that the limit resolution is equal to the of the ring:
| (4) |
We can express this equation in therms of to estimate the time necessary for a complete measurement as:
| (5) |
We can notice from this equation that the measurement speed scales with the square of the factor. In the following table we estimate the speed of our device for different Q factors at constant single ring GHz and THz.
| Q factor | T | Resolution |
|---|---|---|
An important remark is necessary, the measurement speed does not depend on the number of rings since all the rings are measured simultaneously.
6 Conclusions
A photonic-integrated wavelength-meter based on multiple ring resonators has been realized in InP. The correct operation of the device has been verified for a limited bandwidth of . New measures are expected to be carried out with a much broader band in order to verify the stability and reliability over a span of . Moreover, upon realization of wire bonding connections, it will be possible to test the maximum readout speed of the device.
7 Acknowledgements
Project developed in the framework of the European Doctorate in Indium Phosphide PIC Fabrication Technology (EDIFY) project. This work has received financial support from MSCA H2020-ITN-2018-EDIFY (Contract number 813467)
8 Disclosures
The authors declare no conflicts of interest.
References
- [1] C. Xiang, M. A. Tran, T. Komljenovic, J. Hulme, M. Davenport, D. Baney, B. Szafraniec, and J. E. Bowers, \JournalTitleOpt. Lett. 41, 3309 (2016).
- [2] R. M. Oldenbeuving, H. Song, G. Schitter, M. Verhaegen, E. J. Klein, C. J. Lee, H. L. Offerhaus, and K.-J. Boller, \JournalTitleOpt. Express 21, 17042 (2013).
- [3] T. Komljenovic, L. Liang, R.-L. Chao, J. Hulme, S. Srinivasan, M. Davenport, and J. E. Bowers, \JournalTitleApplied Sciences 7 (2017).
- [4] M. Smit, X. Leijtens, E. Bente, J. van der Tol, H. Ambrosius, D. Robbins, M. Wale, N. Grote, and M. Schell, “A generic foundry model for inp-based photonic ics,” in Optical Fiber Communication Conference, (Optical Society of America, 2012), pp. OM3E–3.
- [5] R. Dey, J. Doylend, J. Ackert, A. Evans, P. Jessop, and A. Knights, \JournalTitleOpt. Express 21, 23450 (2013).
- [6] C. Taballione, T. Agbana, G. Vdovin, M. Hoekman, L. Wevers, J. Kalkman, M. Verhaegen, P. J. van der Slot, and K.-J. Boller, “Temperature-drift-immune wavelength meter based on an integrated micro-ring resonator,” in Integrated Optics: Physics and Simulations III, , vol. 10242 P. Cheben, J. Čtyroký, and I. Molina-Fernández, eds., International Society for Optics and Photonics (SPIE, 2017), pp. 39 – 48.
- [7] P. Wang, A. M. Hatta, H. Zhao, W. Yang, J. Ren, Y. Fan, G. Farrell, and G. Brambilla, \JournalTitleOpt. Express 25, 2939 (2017).
- [8] R. Broeke, D. Melati, F. Morichetti et al., “Design and performance of a packaged inp wavelength meter,” in 18th Annual Symposium of the IEEE Photonics Benelux Chapter, (2013), pp. 287–290.
- [9] T. Komljenovic, L. Liang, R.-L. Chao, J. Hulme, S. Srinivasan, M. Davenport, and J. E. Bowers, \JournalTitleApplied Sciences 7 (2017).
- [10] S. Biasi, P. Guilleme, A. Volpini, G. Fontana, and L. Pavesi, \JournalTitleJournal of Lightwave Technology 37, 5091 (2019).
30_references/references_new