Instance Segmentation Based Graph Extraction
for Handwritten Circuit Diagram Images
1Deutsches Forschungszentrum für künstliche Intelligenz,
Trippstadter Str. 122, Kaiserslautern, Germany
{johannes.bayer, amit.roy, andreas.dengel}@dfki.de
Abstract
Handwritten circuit diagrams from educational scenarios or historic sources usually exist on analogue media. For deriving their functional principles or flaws automatically, they need to be digitized, extracting their electrical graph. Recently, the base technologies for automated pipelines facilitating this process shifted from computer vision to machine learning. This paper describes an approach for extracting both the electrical components (including their terminals and describing texts) as well their interconnections (including junctions and wire hops) by the means of instance segmentation and keypoint extraction. Consequently, the resulting graph extraction process consists of a simple two-step process of model inference and trivial geometric keypoint matching. The dataset itself, its preparation, model training and post-processing are described and publicly available.
1 INTRODUCTION
Handwritten circuit diagrams still occur nowadays, for example in educational contexts, when communicating swiftly sketched ideas or viewing historic schematics. In most scenarios, automatic means for digitization are desired, i.e. the extraction of electrical graphs from scanned or photographed images for further analysis in computer-aided engineering software.
While the pipelines for graph extraction from engineering diagrams adopted more machine learning over time, they still tend to involve computationally expensive computer vision. At the same time, the provision of datasets for training these models is costly.
The approach described in this paper aims to move more functionality to the machine learning model, allowing for a simplified graph extraction during test time. For both electrical symbols and their interconnections being detected as objects along with their connector points, detailed knowledge on their layout is required during training. The costs for providing the complex training data necessary are mitigated by a modular method.
2 RELATED WORK
2.1 Existing Approaches
While early approaches to digitize electric circuit diagrams were based on computer vision [Bailey et al., 1995] and limited to printed diagrams, later works incorporate machine learning like support vector machines [Lakshman Naika et al., 2019], allowing to also process handwritten diagrams. Recently, the trend shifted to deep artificial neural networks [Reddy and Panicker, 2021] [Dai and Braytont, 2017]. However, all these approaches rely on rather complex and computationally expensive pipelines in which symbols and their connections are processed in individual steps. For example, a dedicated neural network is used for electrical symbol classification [Rabbani et al., 2016].
Similar trends can also be observed in the closely related domain of piping and instrumentation diagrams for the chemical industry [Mani et al., 2020] [Nurminen et al., 2019] [Rahul et al., 2019] [Sierla et al., 2020].
Unfortunately, most literature rely on small datasets, simple circuits, is restricted to special cases like digital logic circuits [MAJEED et al., 2020] or does not use publicly available datasets at all, preventing reproducibility and comparability.

2.2 Mask RCNN
Mask R-CNN [Dollár and Girshick, 2017] is an artificial neural network architecture, allowing for the prediction of bounding boxes, instances masks and keypoints. For the paper at hand, the Detectron 2 [Wu et al., 2019] implementation is used.
2.3 CGHD
CGHD [Thoma et al., 2021] is a publicly available dataset of handwritten circuit diagrams with bounding box annotations for the contained electrical symbol, texts (for e.g. component names, electrical properties and circuit headings) and structural elements like junctions and crossovers (wire hops). Since its first description, it has been extended in sample count, the set of classes has also been extended and hierarchically structured. Every circuit is drawn twice, photographed four times and hence occurs as eight samples of pairs of images and annotations in the dataset. This allows for automatically verifying inter-annotator agreement. The individual images are taken under varying conditions of lighting and physical degradation to maximize sample variation. In its current form, it contains raw images with bounding box annotations of object classes.
3 METHODOLOGY
The CGHD dataset is extended by instance segmentation ground truth in a set of separated and semi-automated processing steps, which significantly lowers the manual annotation overhead, allows for future reuse and adaptation and avoids annotation ambiguities (see fig. 1). The extended dataset along with the processing scripts are publicly available 111https://zenodo.org/record/7355865 222https://gitlab.com/circuitgraph.
A Mask-RCNN model is trained on these extensions to demonstrate the viability of the proposed approach.
The tool set developed in conjunction with this paper allows for graph import and hence links instance segmentation and graph processing.
3.1 Dataset Preparation
Since the original CGHD dataset (see fig. 2) provides bounding box annotations only for object detection of electrical symbols (and basic structural elements), a graph extraction pipeline built on a respective object detection model requires additional processing for connection extraction. This is computationally expensive and challenged by structured background paper as well as overlaps between bounding box Annotations (see fig. 3).

3.1.1 Binary Segmentation Maps
Through semi-automatic means [Peter Mattis, 2022] like noise filters, color enhancement, thresholding and manual correction, binary segmentation maps are created from the raw images in which intended drafter’s pencil strokes related to the circuit are separated from the (e.g. lined or ruled) paper background and surrounding objects. As these maps are stored independently, they can be used for additional segmentation purposes in future.
3.1.2 Coarse Polygon Masks

After the bounding box annotations have been converted into polygons, they are manually reworked with respect to avoiding overlaps between individual polygons in stoke areas as well as excluding longer parts of connecting wires (see fig. 5). LabelME [Russell et al., 2008] is used for this purpose.
As a mean for simplified visual inspection and to prepare for future semantic segmentation scenarios, a function overlaying coarse polygons with binary segmentation maps is used (see fig. 6).
3.1.3 Mask Refinement

Refined polygons are created automatically by applying contour detection to maps obtained by bit-wise and operation between a binary segmentation map and individual coarse polygons. For discontinuous binary map content inside the polygon area, convex hulls are used instead (see fig. 7). As the refined polygons are created algorithmically, they can conveniently be adapted by e.g. altering the polygon sample width. Apart from that, annotation ambiguities are avoided by this step.
3.1.4 Addition Mask Generation
All stroke areas not covered by any existing polygon annotation so far is considered an electrical interconnection between components. Hence, wire polygons annotations are created automatically by blacking the polygon annotation areas before applying contour detection, labeling the resulting polygons as wire.
3.1.5 Keypoint Generation
Based on the assumption that drafter’s strokes touching an electrical symbol’s shape are representing the symbol’s electrical connections, the keypoints for describing the ports of electrical symbols are derived by calculating intersections between stroke areas in the binary segmentation maps with borders of the symbol’s shape polygons. In order to avoid false positives, the morphological operation erosion is used before. Additionally, as there many direct stroke connections between electrical symbols and texts (due to inaccurate drawing styles) and texts are assumend not to have electrical connections, areas of text strokes are also removed before the actual keypoint generation.
3.1.6 Keypoint Port Assignment
In order to form a viable electrical graph, the extracted keypoints need to be assigned respective electrical terminals. For this purpose, rotation annotations are utilized which represent the angle between a symbol instance and its corresponding prototype in the symbol port library. More precisely, a prototype’s ports are geometrically transformed to the bounding box of the polygon and before being matched. Since number of ports and their position within the (idealized) prototype is known for the majority of symbol types, an automated verification is performed in this processing step.
3.2 Post-Processing
Constructing electrical graphs from target values or predictions is done by treating all polygons but the wire polygons as nodes, the wire polygons themselves as edges and geometrically matching the keypoints of the wire polygons against all other polygons (see fig. 8).
4 EXPERIMENT
Binary segmentation maps with polygon annotations have been created as addition to the existing CGHD dataset.
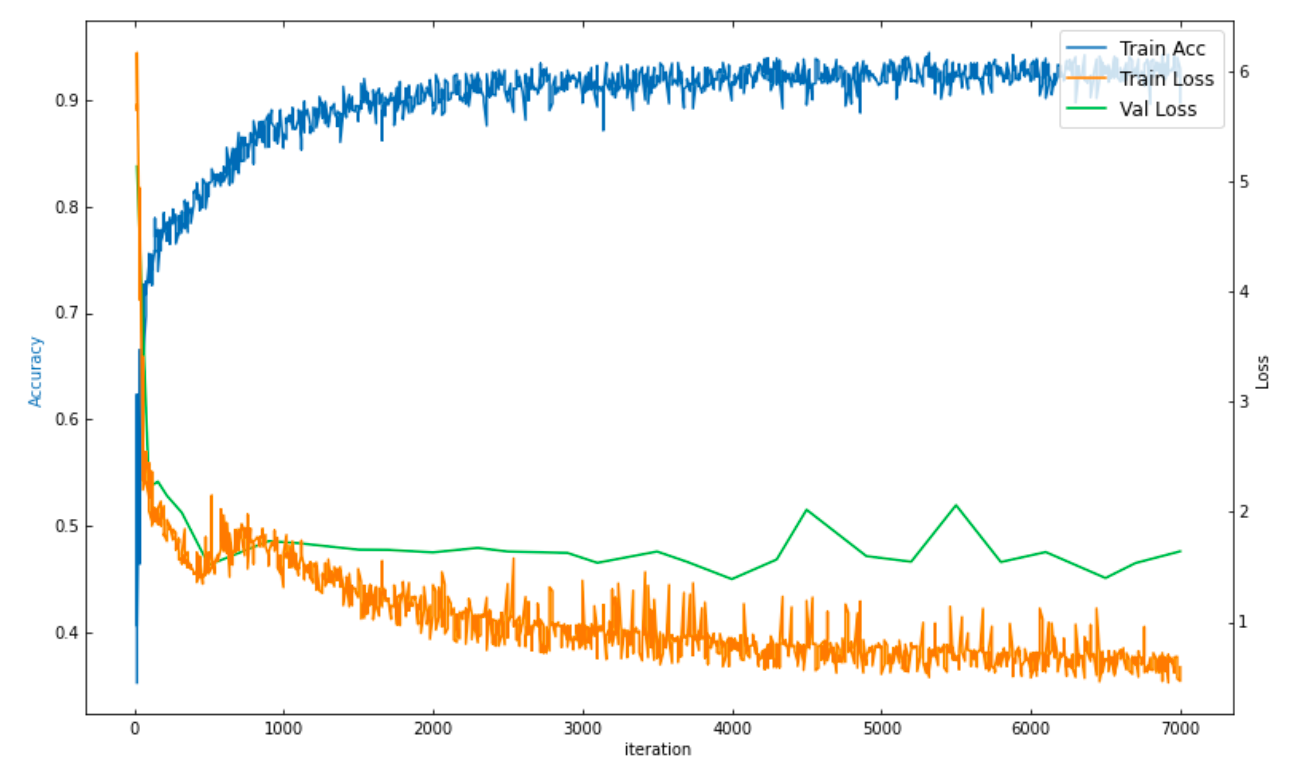
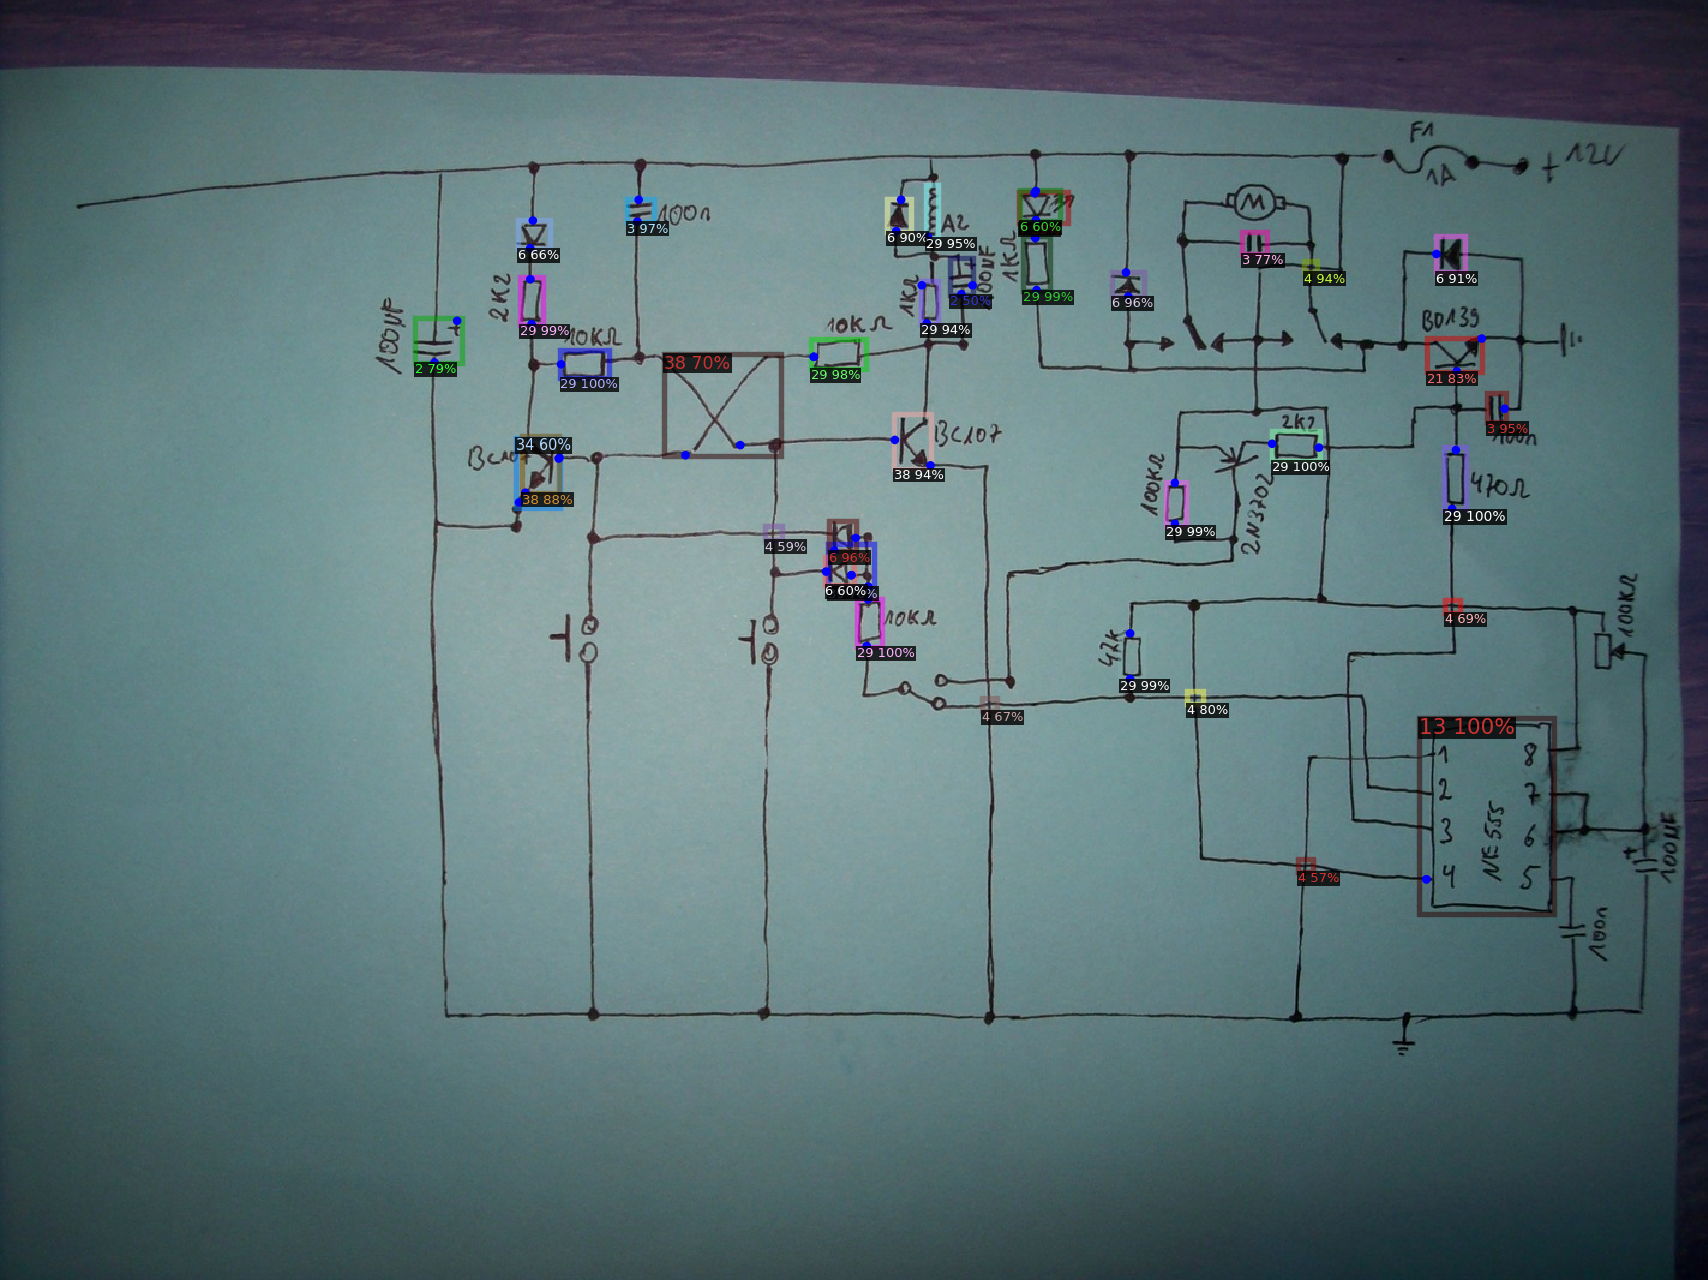
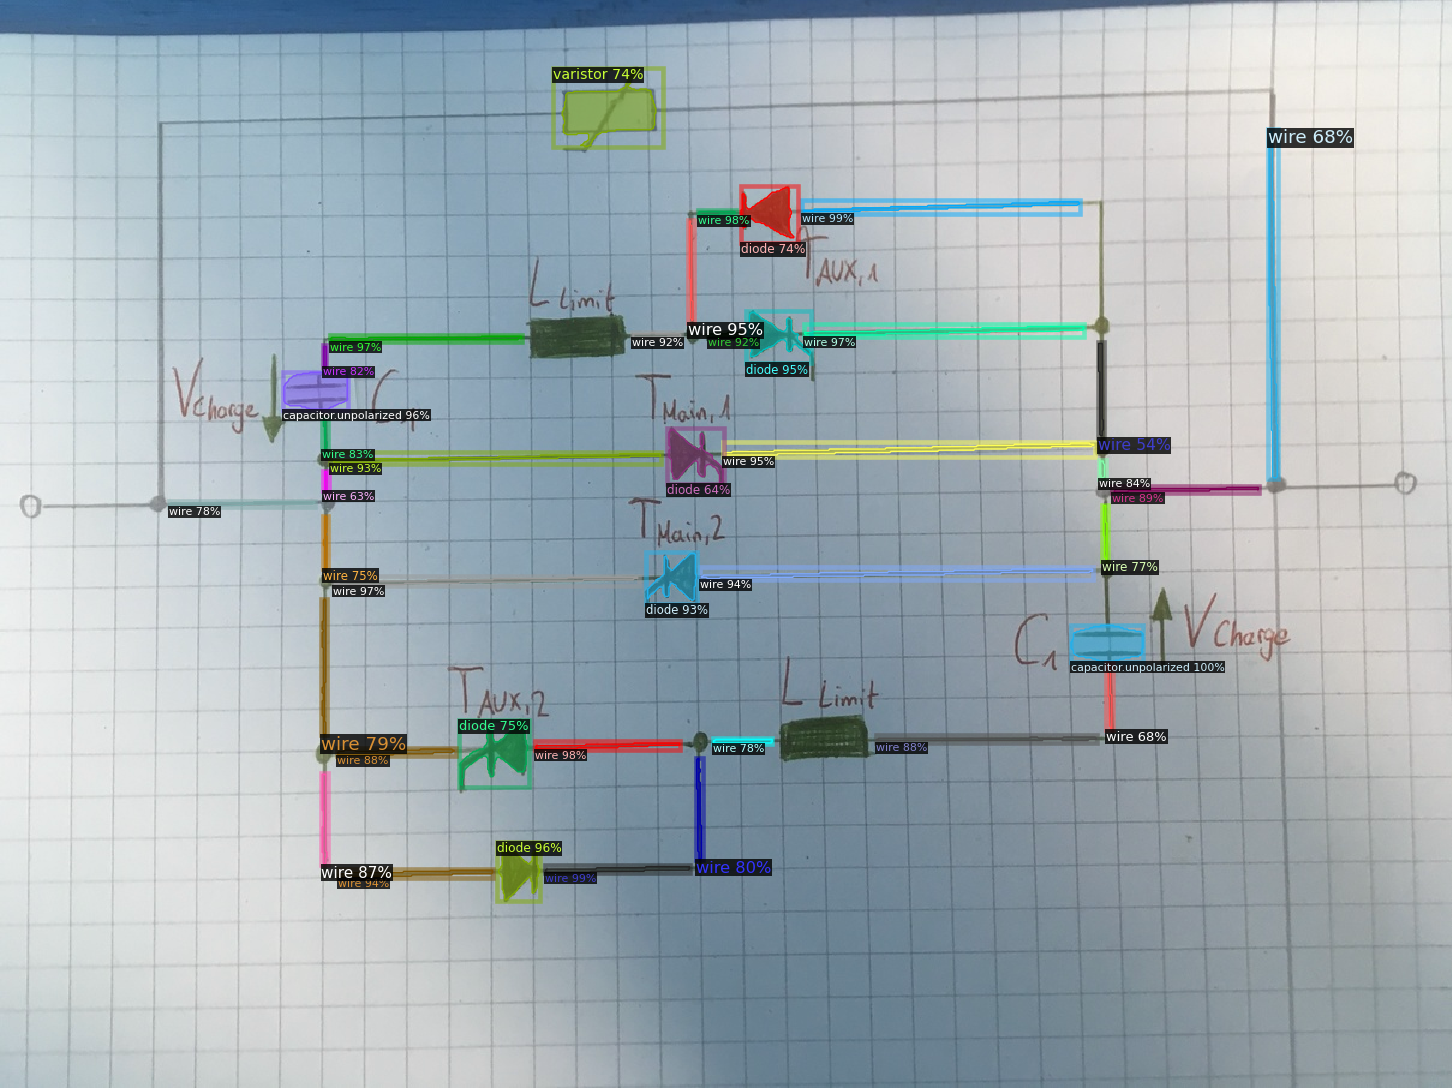
A Mask RCNN trained with learning rate of and a batch size of for iterations resulted in a minimum training loss of , a maximum training mask accuracy of and a minimum validation loss of (see fig. 9). A visual inspection on validation set mask (see fig.11) and keypoint (see fig. 10) predictions shows reasonable, yet incomplete recognition.
5 CONCLUSIONS
The semantic and instance segmentation additons to the CGHD dataset establish a new, flexible standard for further research on graph extraction from hand-drawn schematics, allowing for arbitrary new methods to be evaluated.
While the experiment demonstrated the general viability of the approach, further model optimizations are required to achieve error-free graph reconstruction.
6 FUTURE WORK
So far, the described approach is limited in various ways: Most importantly, the types of individual component connectors are not differentiated, which is critical for an accurate simulation of non-linear electrical circuits. Adding a rotation prediction head to the Mask RCNN as well as providing these information in the dataset (which can in turn be semi-automated by a classic template matching) can be used in conjunction with a component library to identify these connector types. Furthermore, drawing errors like discontinuous wires need to be mitigated, which could be done by post-processing with graph neural networks. Apart from that, OCR information need to be incorporated to predict not only the position but also the content of the text labels. Additionally, edge types different from electrical connections need to be identified like mechanical coupling of switches or inductive coil coupling in complex transformers. Finally, as mask information could only be provided for a subset of the original dataset, a join training with full dataset on both masks and bounding boxes only need to be considered.
ACKNOWLEDGEMENTS
The authors cordially tank all drafters and annotators for contributing to the dataset. The reseach for this paper was partly funded by the BMWE (Bundesministerium für Wirtschaft und Klimaschutz), project ecoKI, funding number: 03EN2047B.
REFERENCES
- Bailey et al., 1995 Bailey, D., Norman, A., Moretti, G., and North, P. (1995). Electronic schematic recognition. Massey University, Wellington, New Zealand.
- Dai and Braytont, 2017 Dai, Y.-Y. and Braytont, R. K. (2017). Circuit recognition with deep learning. In 2017 IEEE International Symposium on Hardware Oriented Security and Trust (HOST), pages 162–162. IEEE.
- Dollár and Girshick, 2017 Dollár, K. H. G. G. P. and Girshick, R. (2017). Mask r-cnn. In Proceedings of the IEEE international conference on computer vision, pages 2961–2969.
- Lakshman Naika et al., 2019 Lakshman Naika, R., Dinesh, R., and Prabhanjan, S. (2019). Handwritten electric circuit diagram recognition: an approach based on finite state machine. Int J Mach Learn Comput, 9:374–380.
- MAJEED et al., 2020 MAJEED, M. A., Almousa, T., Alsalman, M., and YOSEF, A. (2020). Sketic: a machine learning-based digital circuit recognition platform. Turkish Journal of Electrical Engineering and Computer Sciences, 28(4):2030–2045.
- Mani et al., 2020 Mani, S., Haddad, M. A., Constantini, D., Douhard, W., Li, Q., and Poirier, L. (2020). Automatic digitization of engineering diagrams using deep learning and graph search. In Proceedings of the IEEE/CVF Conference on Computer Vision and Pattern Recognition Workshops, pages 176–177.
- Nurminen et al., 2019 Nurminen, J. K., Rainio, K., Numminen, J.-P., Syrjänen, T., Paganus, N., and Honkoila, K. (2019). Object detection in design diagrams with machine learning. In International Conference on Computer Recognition Systems, pages 27–36. Springer.
- Peter Mattis, 2022 Peter Mattis, S. K. (1998-2022). GNU IMAGE MANIPULATION PROGRAM. https://www.gimp.org/. [Online; accessed 16-November-2022].
- Rabbani et al., 2016 Rabbani, M., Khoshkangini, R., Nagendraswamy, H., and Conti, M. (2016). Hand drawn optical circuit recognition. Procedia Computer Science, 84:41–48.
- Rahul et al., 2019 Rahul, R., Paliwal, S., Sharma, M., and Vig, L. (2019). Automatic information extraction from piping and instrumentation diagrams. arXiv preprint arXiv:1901.11383.
- Reddy and Panicker, 2021 Reddy, R. R. and Panicker, M. R. (2021). Hand-drawn electrical circuit recognition using object detection and node recognition. arXiv preprint arXiv:2106.11559.
- Russell et al., 2008 Russell, B. C., Torralba, A., Murphy, K. P., and Freeman, W. T. (2008). Labelme: a database and web-based tool for image annotation. International journal of computer vision, 77(1):157–173.
- Sierla et al., 2020 Sierla, S., Sorsamäki, L., Azangoo, M., Villberg, A., Hytönen, E., and Vyatkin, V. (2020). Towards semi-automatic generation of a steady state digital twin of a brownfield process plant. Applied Sciences, 10(19):6959.
- Thoma et al., 2021 Thoma, F., Bayer, J., Li, Y., and Dengel, A. (2021). A public ground-truth dataset for handwritten circuit diagram images. In International Conference on Document Analysis and Recognition, pages 20–27. Springer.
- Wu et al., 2019 Wu, Y., Kirillov, A., Massa, F., Lo, W.-Y., and Girshick, R. (2019). Detectron2. https://github.com/facebookresearch/detectron2.