Detection of He++ ion in the star-forming ring of the Cartwheel using MUSE data and ionizing mechanisms
Abstract
We here report the detection of the nebular He ii line in 32 H ii regions in the metal-poor collisional ring galaxy Cartwheel using the Multi-Unit Spectroscopic Explorer (MUSE) dataset. The measured I(He ii )/I(H) ratio varies from 0.004 to 0.07, with a mean value of 0.0100.003. Ten of these 32 H ii regions are coincident with the location of an Ultra Luminous X-ray (ULX) source. We used the flux ratios of important diagnostic lines and results of photoionization by Simple Stellar Populations (SSPs) to investigate the likely physical mechanisms responsible for the ionization of He+. We find that the majority of the regions (27) are consistent with photoionization by star clusters in their Wolf-Rayet (WR) phase with initial ionization parameter . Blue Bump (BB), the characteristic feature of the WR stars, however, is not detected in any of the spectra. We demonstrate that this non-detection is due to the relatively low equivalent width (EW) of the BB in metal-poor SSPs, in spite of containing sufficient number of WR stars to reproduce the observed I(He ii )/I(H) ratio of 1.5% at the Cartwheel metallicity of Z=0.004. The H ii regions in the WR phase that are coincident with a ULX source do not show line ratios characteristic of ionization by X-ray sources. However, the ULX sources may have a role to play in the ionization of He+ in two (#99, 144) of the five regions that are not in the WR phase. Ionization by radiative shocks along with the presence of channels for the selective leakage of ionizing photons are the likely scenarios in #17 and #148, the two regions with the highest observed I(He ii )/I(H) ratio.
keywords:
galaxies: star clusters – galaxies: individual (ESO 350-G040 or Cartwheel)1 Introduction
Ionization of He+ requires environments that generate energies in excess of 54.4 eV. Detection of the He ii nebular line in star-forming galaxies suggests that processes related to star formation are able to create such environments. Photoionization by hard ultraviolet photons emanating from Wolf–Rayet (WR) stars is the front-runner among these processes (Schaerer, 1996). Simple stellar population (SSP) models incorporating the state-of-the-art developments in massive star evolution and modeling of the wind-dominated atmospheres of O-type and WR stars are able to explain the observed I(He ii )/I(H) intensity ratios (He ii /H for short) in at least some star-forming galaxies (Plat et al., 2019). These models predict a maximum value of He ii /H=0.01 during the WR phase (3–5 Myr) for metallicities 0.004, with a decrease of this ratio at lower metallicities (see Mayya et al., 2020, and references therein). The observed values of the He ii /H ratio in metal-poor galaxies often are found to be above 0.01 (Shirazi & Brinchmann, 2012; Kehrig et al., 2015, 2018; Schaerer, Fragos & Izotov, 2019). The SSP models of Eldridge et al. (2017) involving binary stars help to alleviate the problem to some extent, but explaining the presence of He++ ion in high H equivalent width (EW) systems (burst ages 3 Myr) remains a challenge. This has forced exploration of alternative mechanisms of ionization. Plat et al. (2019) carried out an exhaustive analysis of the physical mechanisms that can produce the observed ratio of He ii /H. They find the need for one or more of the following processes at work in order to produce the observed high values: (1) the presence of stars significantly more massive than 100 M⊙; (2) extremely high ionization parameter, ; (3) hard radiation from binary stars (in particular, X-ray binaries); (4) ionization of He+ by radiative shocks; and/or (5) ionization of He+ by an active galactic nucleus (AGN), if and when present.
Over the last decade or so, it has been possible to obtain reliable fluxes of the relatively weak He ii line for a large sample of objects, thanks to dedicated spectroscopic surveys such as Sloan Digital Sky Survey (SDSS). Given that the often-used nebular diagnostic lines (see e.g. Pérez-Montero, 2017) are much brighter than the He ii line, the available dataset has also allowed accurate determination of nebular metallic abundances. Dataset obtained from these large surveys are the ones often used to confront with the predictions of SSP models (e.g. Plat et al., 2019; Schaerer, Fragos & Izotov, 2019). These data typically sample zones that span several kiloparsecs in size, centered on the nucleus of the galaxy. Though the diagnostic lines (Baldwin, Phillips, & Terlevich, 1981) allow the rejection of spectra dominated by an AGN at least at high enough metallicities (0.008; see Feltre, Charlot, & Gutkin, 2016), the presence of a weak AGN in a spectrum dominated by a starburst component cannot be ruled out. Over the large spatial scales sampled in these studies, several of the above mentioned five physical mechanisms are likely to be at work, thus inhibiting discerning the relative importance of each mechanism. Data on smaller scales, ideally of selected regions in nearby galaxies, are required so as to explore the role of each of the above-listed mechanisms in increasing the He ii /H ratio above the canonical values predicted by the SSP models.
Availability of spectrographs incorporating integral field units (IFUs) on large telescopes such as Multi Unit Spectroscopic Explorer (MUSE) on the Very Large Telescope (VLT) (Bacon et al., 2010) and MEGARA on the Gran Telescopio Canarias (GTC) (Gil de Paz et al., 2018) is allowing such studies possible in recent years. Kehrig et al. (2015) and Kehrig et al. (2018) used MUSE data to spatially map the He ii line in two of the most metal-poor galaxies: I Zw 18 and SBS 0335 052E, finding that the observed He+ ionization cannot be explained by the WR stars present in these galaxies. Recently, Mayya et al. (2020) used MEGARA to map the central starburst cluster of NGC 1569, a galaxy with the oxygen abundance similar to that of the Large Magellanic Cloud (LMC), finding that the WR stars in the starburst cluster are able to completely explain the observed ionization. Data on regions where hydrogen ionization is dominated by photons from massive stars of metallicity below that of the LMC are needed to address the sources of He+ ionization in distant metal-poor galaxies. The collisional-ring galaxy Cartwheel provides such a laboratory, as explained below.
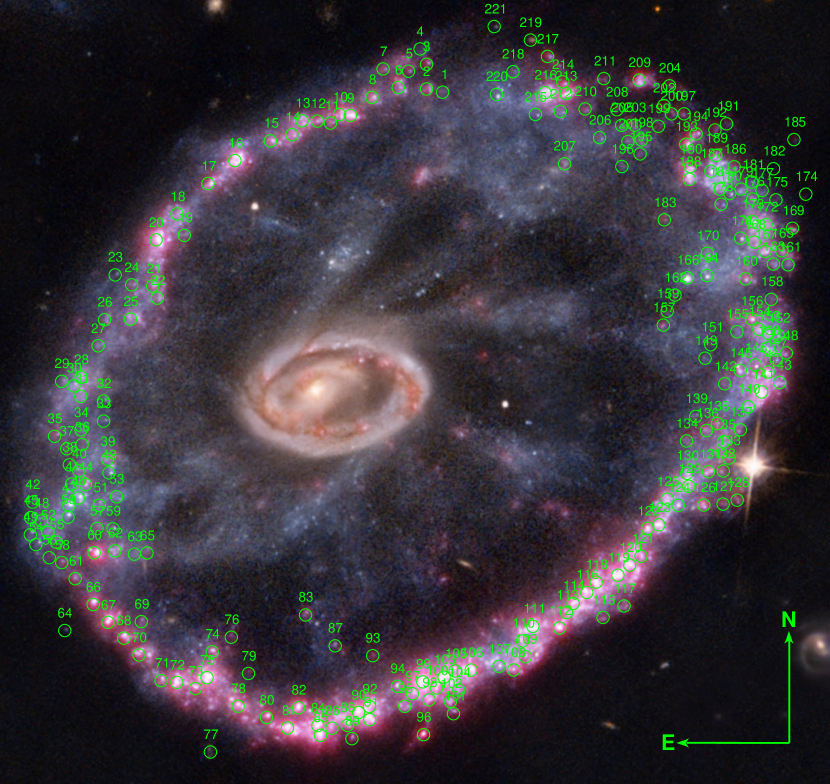
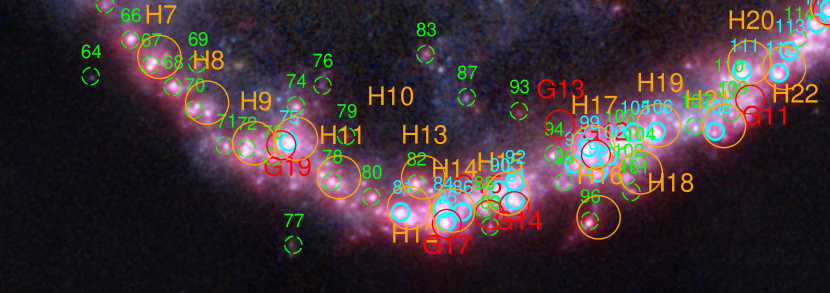
The Cartwheel is considered as the archetype of the class of collisional ring galaxies (Appleton & Struck-Marcel, 1996; Struck, 2010). Ring galaxies are characterized by a ring that harbours a chain of star forming knots. The star formation in the ring is believed to be triggered by a radially expanding density wave that was formed as a result of a compact galaxy plunging through a massive gas-rich disk galaxy close to its center and almost perpendicular to it (Lynds & Toomre, 1976). Higdon (1995) found that the H emission in the Cartwheel, a tracer of current star formation, is distributed along a ring as predicted by the collisional scenario of the formation of ring galaxies. MUSE dataset is available on this galaxy at the seeing-limited spatial resolution of 0.6 arcsec. This dataset provides optical spectra covering a rest wavelength range of 4600 to 9100 Å over the entire galaxy. On the H image constructed using this dataset, we have identified more than 200 individual H ii regions in and around the ring. A colour-composite image formed using this H image is shown in Figure 1. At the distance of the Cartwheel (128 Mpc using the Hubble constant of 71 km s-1 Mpc-1), MUSE spectra are available at physical scales of 370 pc, which is an order of magnitude better as compared to the typical size scale where He ii is detected in metal-poor galaxies. At the spatial resolution of the Wide Field and Planetary Camera 2 (WFPC2) images of the Hubble Space Telescope (HST), which are the highest resolution images (0.2 arcsec=125 pc) available for this galaxy, we can associate each MUSE-identified H ii region with a population of super star clusters (SSCs), which provide the ionization of the H ii regions. Fosbury & Hawarden (1977) have measured an oxygen abundance of 12+log(O/H)8.0, corresponding roughly to (see Table 2 of Gutkin et al., 2016), a value at which the observed He ii /H ratio in galaxy samples is higher than that predicted by most of the SSPs. The wide spectral coverage of MUSE data allowed the flux measurement of nebular lines useful to study the ionization state of the H ii regions using the standard line ratio diagrams (Baldwin, Phillips, & Terlevich, 1981, hereafter BPT). We used this new dataset to measure an average oxygen abundance for the ring regions of 12+log(O/H)8.190.15 (Zaragoza-Cardiel et al., 2022), which is marginally higher than the value reported by Fosbury & Hawarden (1977) for three of the brightest H ii regions.
An additional aspect that makes the Cartwheel a good candidate for understanding the He ii ionization problem is the presence of more than 15 ultra-luminous X-ray sources (ULXs) in its star-forming ring (Gao et al., 2003; Wolter & Trinchieri, 2004). In fact the Cartwheel is the record holder for the maximum number of ULX sources in a single galaxy (Wolter, Fruscione & Mapelli, 2018). The ULX emission is believed to be originating in high-mass X-ray binaries (HMXBs), with the compact object most likely an intermediate-mass black hole (IMBH) (Mapelli et al., 2010; Wolter, Fruscione & Mapelli, 2018). The presence of these sources allows us to explore the role of HMXBs in the He+ ionization in regions where massive stars contribute to the ionization of hydrogen and other ions of ionization potential much lower than 54.4 eV.
In Section 2, we describe the dataset, extraction of individual spectrum, and details of measurement of line fluxes. The analysis of nebular line ratios is described in Section 3. A detailed discussion of results on the He+ ionization in each star-forming complex is carried out in Section 4. Our conclusions are given in Section 5.
| ID | H | He ii | O and WR stars | Cont | ||||||||||||
| H ii | Higdon | ULX | log f(H) | SNR | EW | log M∗ | log Q(He+) | I(He ii)/I(H) | EWBB | SNR | ||||||
| [erg cm-2 s-1] | [Å] | M⊙ | ph s-1 | 100 | 3 | C&B | C&B | |||||||||
| (1) | (2) | (3) | (4) | (5) | (6) | (7) | (8) | (9) | (10) | (11) | (12) | (13) | (14) | |||
| 10 | H1 | — | 109.9 | 57.2 | 4.84 | 49.29 | 341 | 6.07 | 2 | 7 | 17.9 | |||||
| 16 | H3 | G18 | 183.5 | 71.7 | 5.25 | 49.56 | 876 | 3.28 | 7 | 19 | 34.1 | |||||
| 17 | H4 | — | 70.7 | 29.6 | 4.39 | 49.19 | 120 | 5.07 | 1 | 2 | 21.9 | |||||
| 20 | H5 | — | 204.6 | 63.7 | 5.08 | 49.55 | 594 | 2.77 | 4 | 13 | 38.3 | |||||
| 60 | H6 | — | 165.3 | 154.4 | 5.11 | 49.43 | 640 | 7.22 | 5 | 14 | 14.7 | |||||
| 75 | H10 | G19/W23 | 287.3 | 90.5 | 5.41 | 49.68 | 1267 | 3.48 | 10 | 28 | 34.0 | |||||
| 81 | H12 | — | 363.8 | 159.6 | 5.55 | 50.03 | 1773 | 3.43 | 14 | 39 | 30.2 | |||||
| 84 | H14 | — | 408.3 | 120.7 | 5.56 | 49.91 | 1781 | 2.93 | 14 | 39 | 35.4 | |||||
| 85 | H14 | G17/W7 | 303.4 | 79.8 | 5.40 | 49.87 | 1252 | 2.66 | 10 | 27 | 38.3 | |||||
| 86 | H14 | — | 195.7 | 77.8 | 4.93 | 49.12 | 417 | 4.91 | 3 | 9 | 21.7 | |||||
| 90 | H15 | — | 338.4 | 126.8 | 5.58 | 49.80 | 1887 | 3.04 | 15 | 41 | 33.2 | |||||
| 91 | H15 | G14 | 170.9 | 49.4 | 5.16 | 49.55 | 722 | 2.14 | 6 | 15 | 46.0 | |||||
| 92 | H15 | — | 194.1 | 66.4 | 5.11 | 49.42 | 640 | 3.15 | 5 | 14 | 31.0 | |||||
| 97 | H17 | — | 136.5 | 68.8 | 4.94 | 49.18 | 427 | 3.13 | 3 | 9 | 35.6 | |||||
| 98 | H17 | — | 163.3 | 72.9 | 5.03 | 49.17 | 534 | 3.70 | 4 | 11 | 27.6 | |||||
| 99 | H17 | G12/W24 | 1055.0 | 282.6 | 6.35 | 50.55 | 10960 | 2.78 | 92 | 242 | 35.2 | |||||
| 100 | H17 | — | 221.9 | 69.9 | 5.20 | 49.42 | 783 | 2.68 | 6 | 17 | 39.2 | |||||
| 105 | H19 | — | 171.0 | 61.4 | 5.10 | 49.31 | 617 | 2.63 | 5 | 13 | 42.0 | |||||
| 106 | H19 | — | 241.5 | 81.3 | 5.36 | 49.57 | 1126 | 2.99 | 9 | 24 | 34.2 | |||||
| 108 | H21 | — | 116.2 | 52.5 | 4.77 | 49.32 | 292 | 4.66 | 2 | 6 | 21.8 | |||||
| 111 | H20 | G11/W10 | 152.5 | 34.9 | 5.03 | 49.43 | 525 | 2.38 | 4 | 11 | 47.5 | |||||
| 112 | H22 | — | 271.0 | 219.4 | 5.43 | 49.37 | 1323 | 5.50 | 11 | 29 | 22.5 | |||||
| 113 | H22 | — | 109.4 | 46.1 | 4.72 | 49.02 | 259 | 4.07 | 2 | 5 | 26.4 | |||||
| 116 | H23 | — | 259.1 | 93.4 | 5.31 | 49.81 | 1001 | 3.14 | 8 | 22 | 34.1 | |||||
| 118 | H23 | G8 | 360.0 | 123.3 | 5.49 | 49.71 | 1523 | 3.24 | 12 | 33 | 35.1 | |||||
| 119 | H24 | G6/W14 | 170.1 | 60.6 | 5.42 | 49.83 | 1308 | 2.61 | 11 | 28 | 39.1 | |||||
| 120 | H24 | — | 152.4 | 51.0 | 5.24 | 49.60 | 862 | 2.98 | 7 | 19 | 36.5 | |||||
| 121 | H24 | — | 91.3 | 69.8 | 4.94 | 49.28 | 428 | 5.69 | 3 | 9 | 18.4 | |||||
| 141 | H26 | — | 188.6 | 37.4 | 5.22 | 49.56 | 821 | 2.11 | 6 | 18 | 54.6 | |||||
| 144 | H26 | G2/W17 | 134.8 | 38.0 | 4.88 | 49.61 | 379 | 3.01 | 3 | 8 | 34.8 | |||||
| 148 | — | — | 46.8 | 21.8 | 4.14 | 49.31 | 67 | 7.90 | 0 | 1 | 13.8 | |||||
| 213 | H29 | G9/W12 | 164.5 | 88.9 | 5.01 | 49.20 | 510 | 4.53 | 4 | 11 | 24.4 | |||||
(1) H ii region identification number used in this work, (2) H ii complex number from Higdon (1995), (3) ULX sources associated to the H ii region, (4-7) Measured and derived quantities using H nebular line, where stellar mass in column 7 is derived assuming a Lyman continuum photons rate of 4.94 using C&B model corresponding to an age of 3.4 Myr for the ionizing cluster, (8) He+ ionizing photon rate determined from the observed He ii flux for a Case B H ii region, (9) 100 the intensity of He ii line with respect to that of H, (10) Equivalent number of O7V stars derived assuming a typical H luminosity of 4.76 erg s-1 for an O7V star from López-Sánchez & Esteban (2010), (11) Upper limit for the equivalent width of the BB from WNL type inferred as the 3 flux of a broad (FWHM=20 Å) BB divided by the underlying continuum flux, (12-13) The number of WNL and total WR stars expected in C&B models during the WR phase for the cluster mass in column 7, (14) SNR of the continuum adjacent to the BB bump.
2 The sample of He++ nebulae and the control sample of bright H ii regions
2.1 The H ii region parent sample
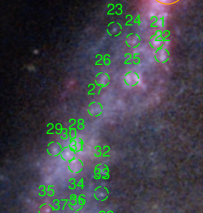
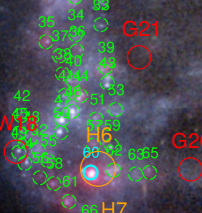
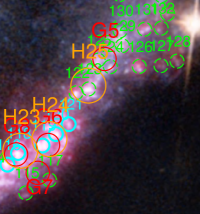
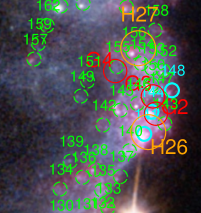
Given that the ionization potential of hydrogen is four times lower as compared to the second ionization potential of helium, the He++ nebulae are expected to be a subset of the ionized nebulae. The outer ring of the Cartwheel is currently experiencing an intense burst of star formation. Higdon (1995) found that the H emission, a tracer of current star formation, is predominantly confined to 29 ionized complexes in the outer ring. As a first step, we used the MUSE datacube to obtain a narrow-band image at the red-shifted wavelength of the H line to locate ionized regions at the resolution of MUSE (FWHM=0.6 arcsec370 pc), which is 3 times better as compared to the image used by Higdon (1995). In Figure 1, we show an RGB image formed by combining the HST/WFPC2 filters in F814W, pseudo-green and F450W as red, green and blue components, respectively; the H image constructed from MUSE data is used as a fourth reddish component. We identified visually 221 prominent H-emitting knots in the ring or near to it on the MUSE image, which are shown by numbers in this image. At the resolution of the HST/WFPC2 images, most of the H-emitting knots are associated with one or more compact clusters, which are the most likely ionizing sources of the nebulae. Thus, the selected regions are star-forming complexes spread over the entire extracted area. However, at the spatial resolution offered by MUSE, each complex is basically a compact unresolved knot. We hence used a uniform aperture of 0.6 arcsec radius to extract spectrum of each region. We note that the H surface brightness in the outer ring is 10 to 100 times brighter than the typical cut-off surface brightness of 2 erg cm-2 s-1 arcsec-2 for the Diffuse Ionized Gas (DIG) (see e.g. Belfiore et al., 2022), and hence the DIG contribution to the flux ratios of lines in the extracted spectra can be ignored.
We did not attempt to subtract the disk spectrum from the extracted spectra as it is non-trivial to locate a region for extraction of the local disk spectrum in a galaxy such as the Cartwheel because of its peculiar morphology and star formation history. Thus the extracted spectra contain contributions from any pre-collisional, as well as from all post-collisional, populations in the extracted area. From an analysis of stellar populations in the extracted spectra, Zaragoza-Cardiel et al. (2022) concluded that the spectra lack absorption features characteristics of disk stellar populations. This is understandable because the pre-collsional disk is around a factor of five fainter than the ring (Marcum, Appleton & Higdon, 1992; Higdon, 1995), and hence the extracted spectra are dominated by contribution from all populations formed after the collision around 100 Myr ago (Renaud et al., 2018). The extracted spectra, however, could contain contribution from non-ionizing populations formed over the last 100 Myr. Such a population will not contribute to the measured emission line fluxes, but will make the observed values of emission-line EWs lower that that expected for a single burst young population. We will take this into account while we carry out a detailed comparison of the observed EWs with that predicted from population synthesis models in Sec.4.
2.2 The He++ nebular sample
We measured fluxes of all major nebular lines in all the extracted spectra. We used the Gaussian profile fitting routine of the splot task in iraf111 IRAF is distributed by the National Optical Astronomy Observatories, which are operated by the Association of Universities for Research in Astronomy, Inc., under cooperative agreement with the National Science Foundation. for this purpose. The measured line fluxes are free from the underlying continuum. We fitted each extracted spectrum with a Gaussian profile at the redshifted wavelengths of a list of nebular lines commonly reported in extragalactic H ii regions, including the He ii line. The output quantities of the Gaussian fitting task that we used here are: line flux, FWHM and EW. We measured the root mean square (rms) noise at feature-less parts of the continuum adjacent to the measured line, which we used to determine the signal-to-noise ratio (SNR) of the measured line. An emission line is deemed detected if the fitted FWHM is comparable to that of the H line (2.5 Å) and that the integrated line flux has a SNR3. Using these line fluxes, we constructed two sub-samples: (1) a sub-sample of 87 bright H ii regions defined as those with SNR40 in the H line, and (2) a sub-sample of 32 He ii nebulae defined as those where the He ii nebular line is detected. As expected, the latter sample is a subset of the former. The bright H ii region sample is used as a control sample to understand the physical conditions that favour the detection of the He ii line in ionized regions.
The criterion that the FWHM of a line should be comparable to that of the H emission line ensures that the detected line is of nebular origin. Nevertheless, the spectra of the He ii nebulae were visually inspected for the possible presence of an underlying broad He ii emission feature, commonly referred to as the ’blue bump’ (BB), from WR stars. None of the spectra showed this feature, and hence any contribution of the WR bump to the measured nebular He ii fluxes can be ignored.
The He ii nebular sample222Fluxes of all measured lines for the entire sample of H ii regions are presented in companion paper by Zaragoza-Cardiel et al. (2022), which deals with the nebular elemental abundances. The ratios of fluxes of lines used in this work are given in a Supplementary Electronic Table. is listed in Table 1. In column 2, we list the cross identification of our sources with the H ii complexes of Higdon (1995). In other columns, we give the basic measured quantities of these regions such as the flux, SNR and EW of the H line (columns 4, 5 and 6, respectively), and the He ii intensity normalized to I(H) and multiplied by 100, along with error (column 9). The error in measured flux () of each line is calculated using the expression (Tresse et al., 1999):,
| (1) |
where is the spectral dispersion in Å per pixel (1.25 for MUSE), is the mean standard deviation per pixel of the continuum, which is measured in a line-free part of the continuum adjacent to each line, is the number of pixels covered by the line, which is equated to the FWHM of the fitted Gaussian profile. In all these 32 regions, the H flux has SNR50, with a median SNR of 176. The He ii line is detected at SNR=3–15.
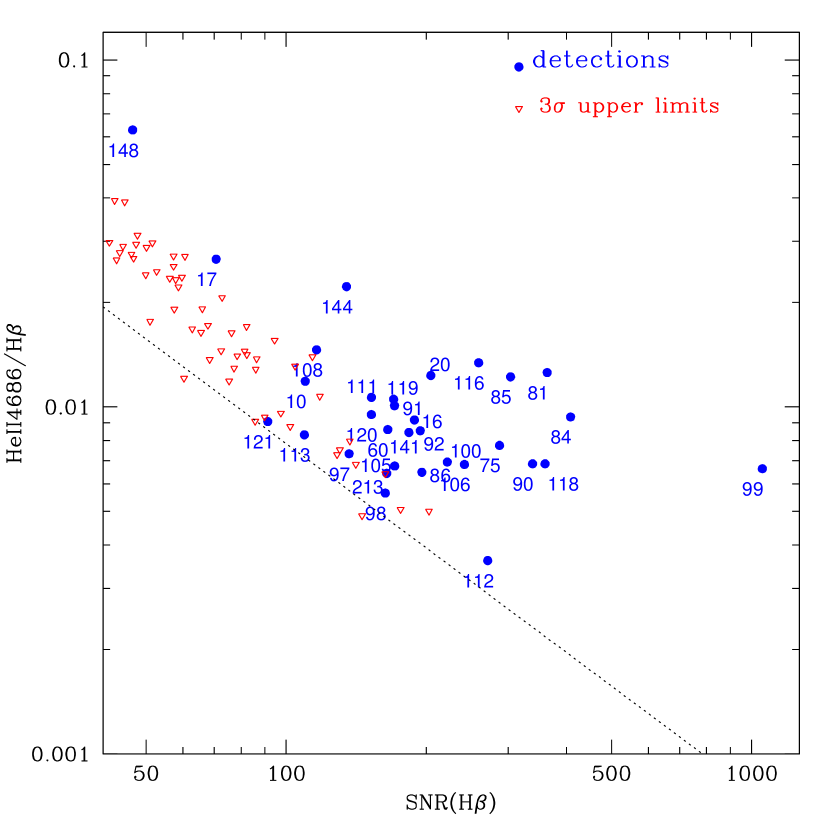
Detection of a line depends on the SNR of the spectrum. In Figure 2, we show the He ii /H ratio for all the H ii regions with SNR(H)40. Detections are shown in blue solid circles, whereas the upper limits, defined as 3- fluxes where is calculated using the error equation 1 with =FWHM(H), are shown by red inverted triangles. As a reference, we show by the dotted line the minimum value of He ii /H ratio that a region should have so that the He ii line is detected, given the SNR of H in its spectra. The intercept of this line depends slightly on EW(H), with the plotted line corresponding to EW(H)=125 Å. The line would shift upwards (downwards) by 0.005 for regions with EWs a factor of two lower (higher). Our sample of He ii nebulae has a mean value of I(He ii )/I(H)=0.0100.003, with the lowest and highest ratios being 0.004 (#112) and 0.07 (#148). We can expect He ii line detection only in H ii regions with SNR(H)100, if their He ii /H ratio is close or higher than the mean value of the sample. Conversely, the detection of He ii line would require abnormally high ratio of He ii /H in regions with SNR(H)100, such as the case in #148 and #17. As expected, the He ii line is detected in all MUSE spectra with SNR(H)200 (12 regions). For regions having 100SNR(H)200, the He ii line is detected in 59 per cent (17 of 29) of the H ii regions.
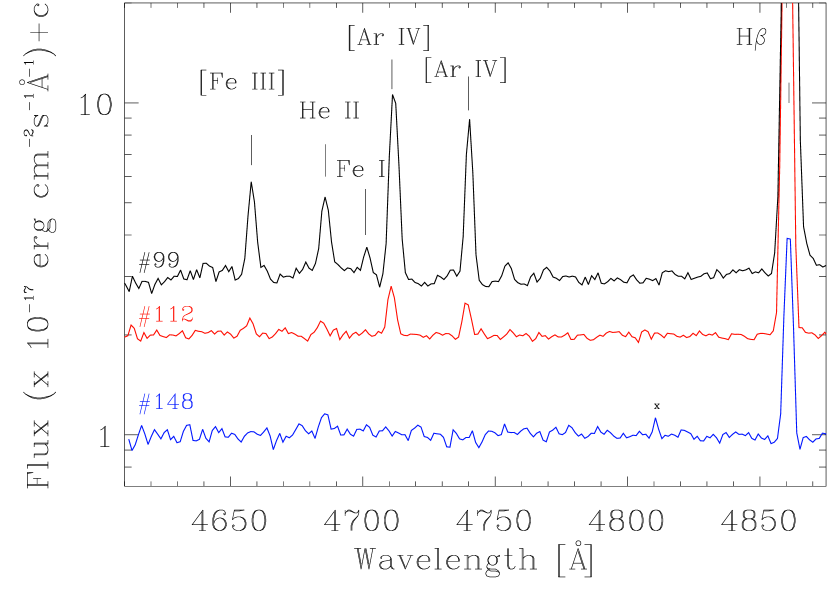
In Figure 3 we show the blue part of the MUSE spectrum for three representative H ii regions where the He ii line is detected. The regions selected for illustrations are: #99, the brightest H ii region in the Cartwheel, #112 and #148, the H ii regions with the lowest and the highest He ii /H values, respectively. The He ii and other nebular lines in the plotted range are indicated.
2.3 Association of He++ nebulae to Star Clusters
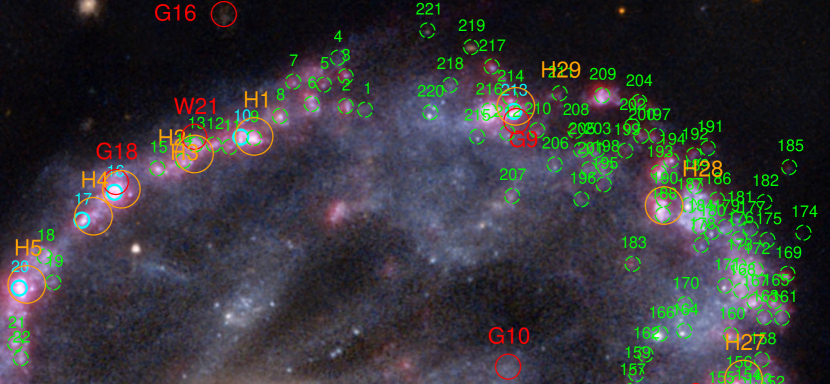
We use the astrometrized HST images in the F450W and F814W filters to look for a spatial association between the He++ nebulae and star clusters. In Figure 4, we present a close-up view of the entire ring with the intention of showing the cluster(s) associated to He++ nebulae. The HST images reveal the presence of at least one ionizing cluster inside the aperture used to extract the MUSE spectrum in all the 32 He++ nebulae. This association suggests that photoionization from stars in young clusters, or alternatively any process related to young clusters, is mainly responsible for the ionization of He+.
The star forming complexes defined by Higdon (1995), after correcting for offsets in their coordinates with respect to our MUSE H image, are also marked in Figure 4. The radius of the circles used to identify the H ii regions and H ii complexes indicates the FWHM of the point spread function (PSF) of the corresponding observations. With the exception of one source (#148), all are associated with these complexes. In general, these complexes contain multiple H ii regions and stellar clusters. However, only 18 of the complexes are associated with a He++ nebula, with a few of the complexes containing multiple knots of He++ emission. H17 in the southern quadrant of the ring, the brightest complex, contains as much as four knots of He++ emission.
2.4 The He ii nebular line in the SSP models
Photoionization from massive stars is the dominant source of ionization in H ii regions. Massive stars with zero-age main-sequence mass M⊙ go through the WR phase during their post-main sequence evolution (see Crowther, 2007, and references therein). WR stars are the hottest stars in coeval young clusters whose surface temperature reaches in excess of 105 K, hot enough to doubly ionize helium. The exact age and duration at which WR stars appear in a coeval population depends on the metallicity, the upper cut-off mass () of the Initial Mass Function (IMF), and also the inclusion or not of binary star populations in the SSP models used. In this work, we used the latest version of Bruzual & Charlot (2003) SSP models (Charlot & Bruzual in-preparation, hereafter C&B; see also Plat et al. (2019) for details) for single stars corresponding to Z=0.004, the metallicity in the SSP models closest to that of the Cartwheel. These updated models have incorporated the theoretical spectra from Potsdam Wolf-Rayet (PoWR) model library (see references in Todt et al., 2015) and the stellar evolutionary tracks from Chen et al. (2015) that were computed with the parsec code of Bressan et al. (2012). Tracks for Very Massive Stars up to initial masses of 600 M⊙ are available in this code. We here use the SSP models adopting a Chabrier (2003) IMF with lower cut-off mass of =0.1 M⊙. We present the model results for two values of upper cut-off mass: =100 M⊙ and =300 M⊙. We investigate the effect of including binary star processes (such as envelope stripping and chemical homogenisation) using the BPASS v2.2.1 stellar population models (Stanway & Eldridge, 2018). The models are computed for a zero-age volume-average ionization parameter = (see Section 4 for details).
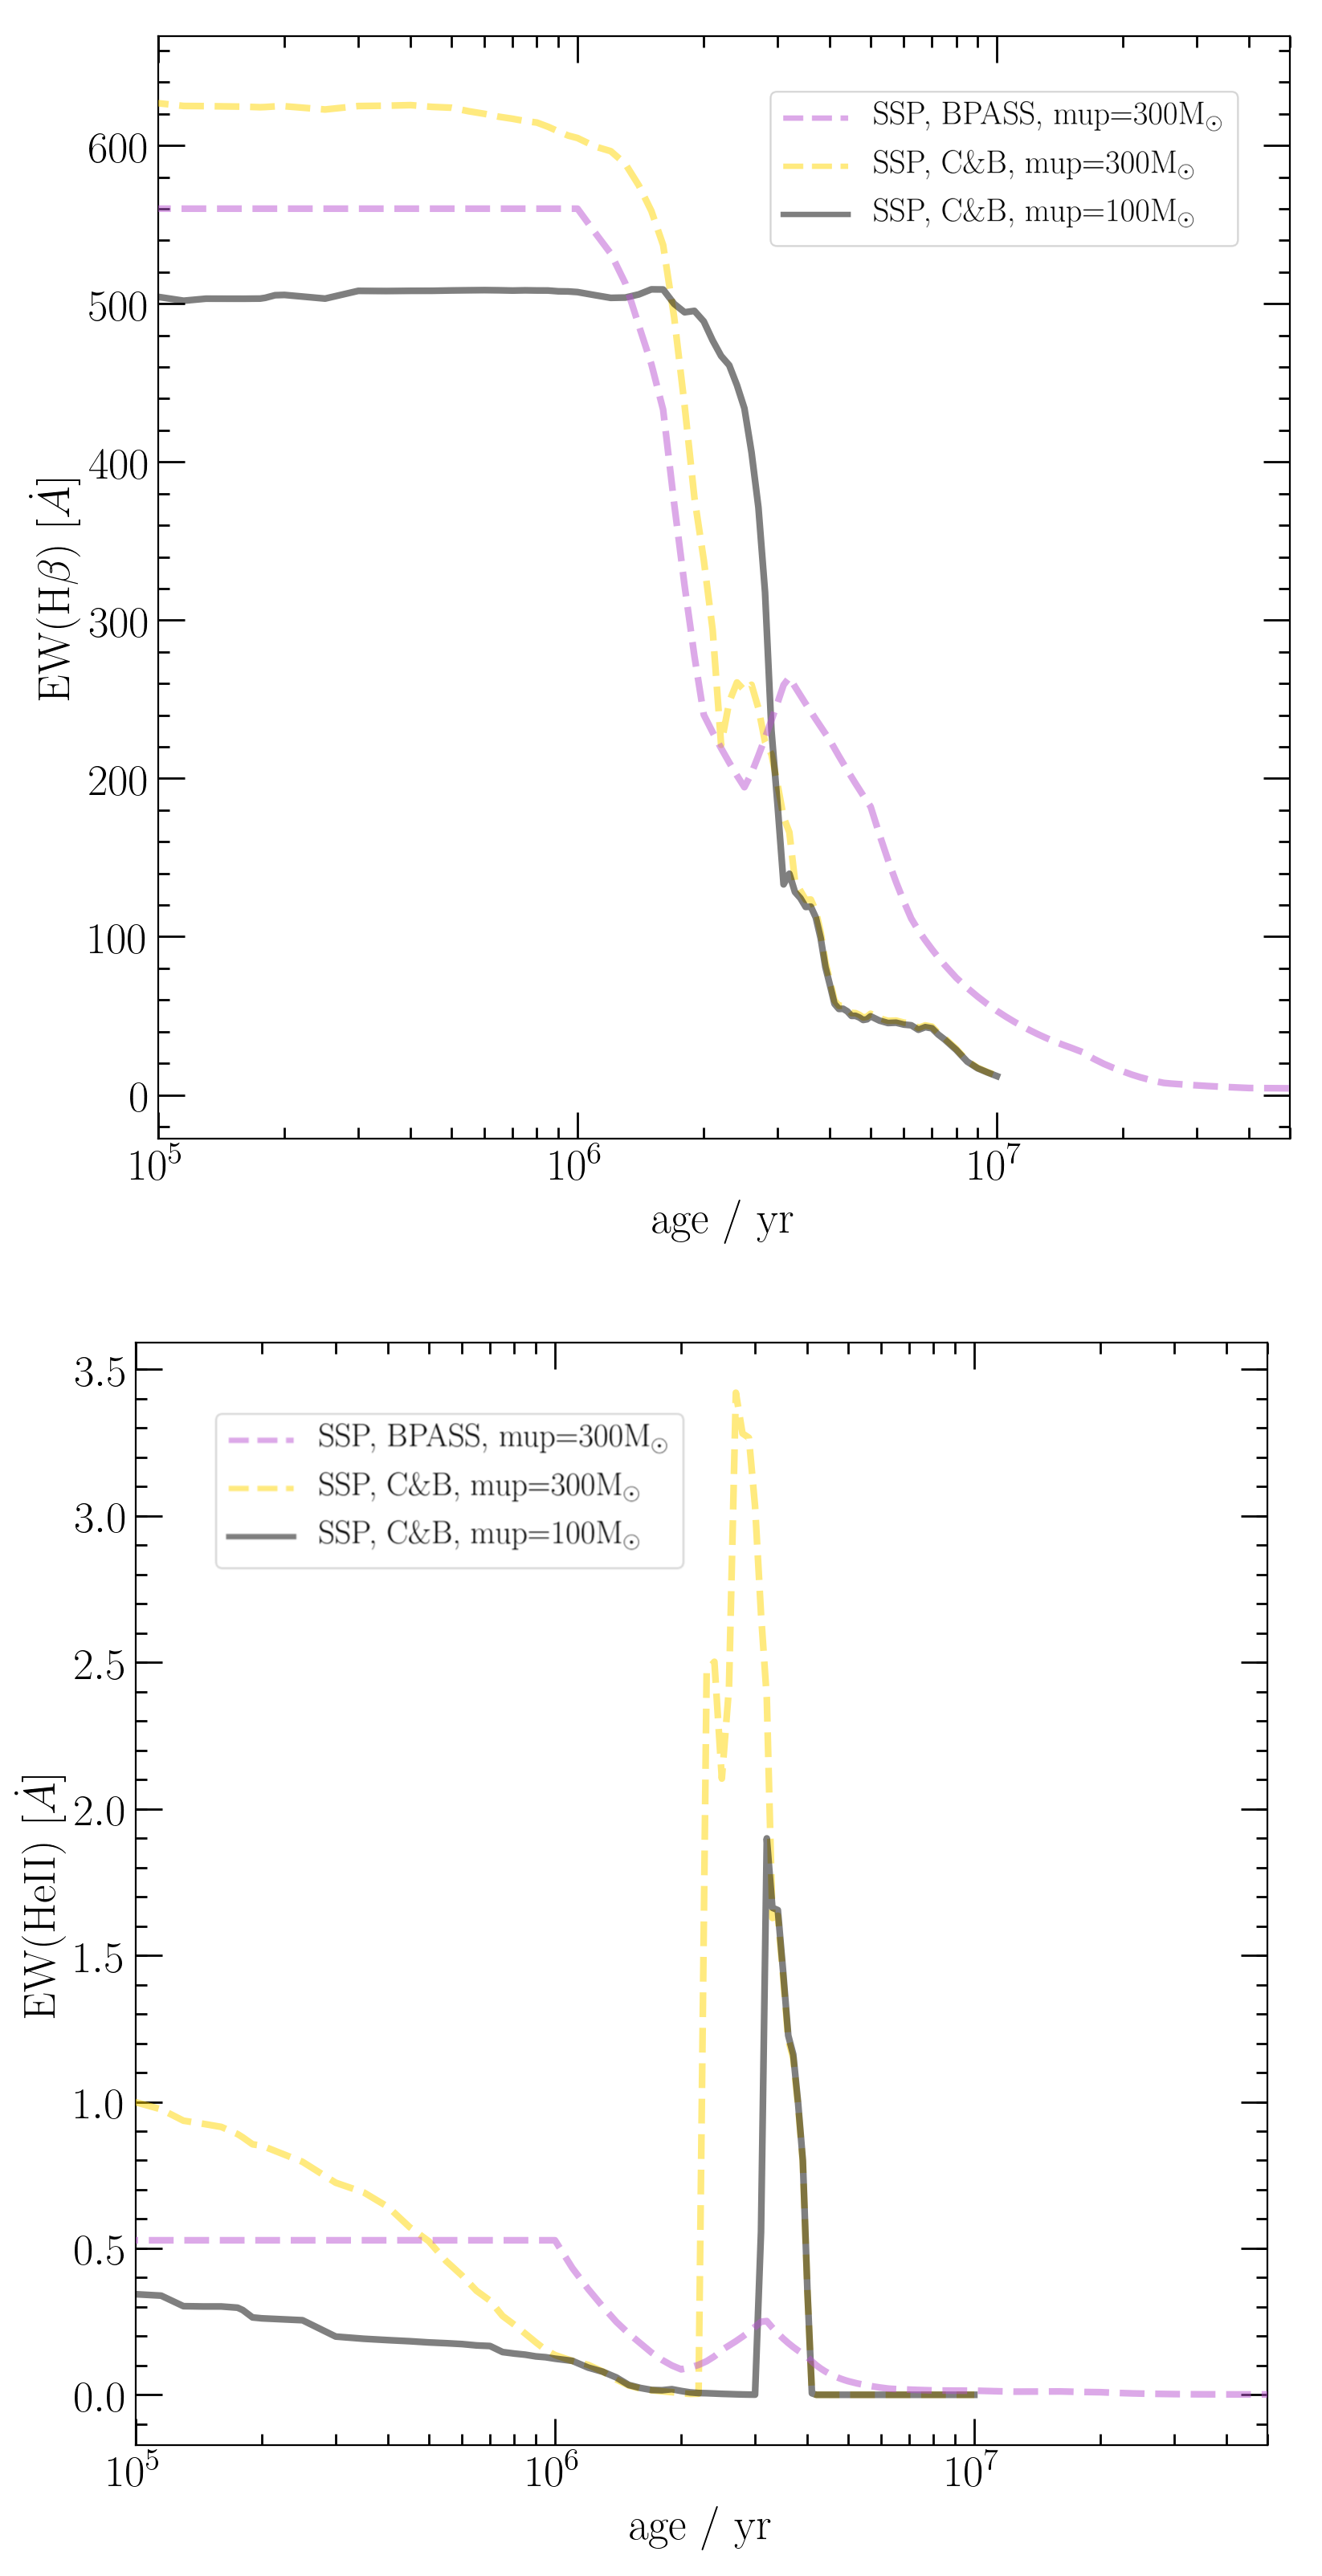
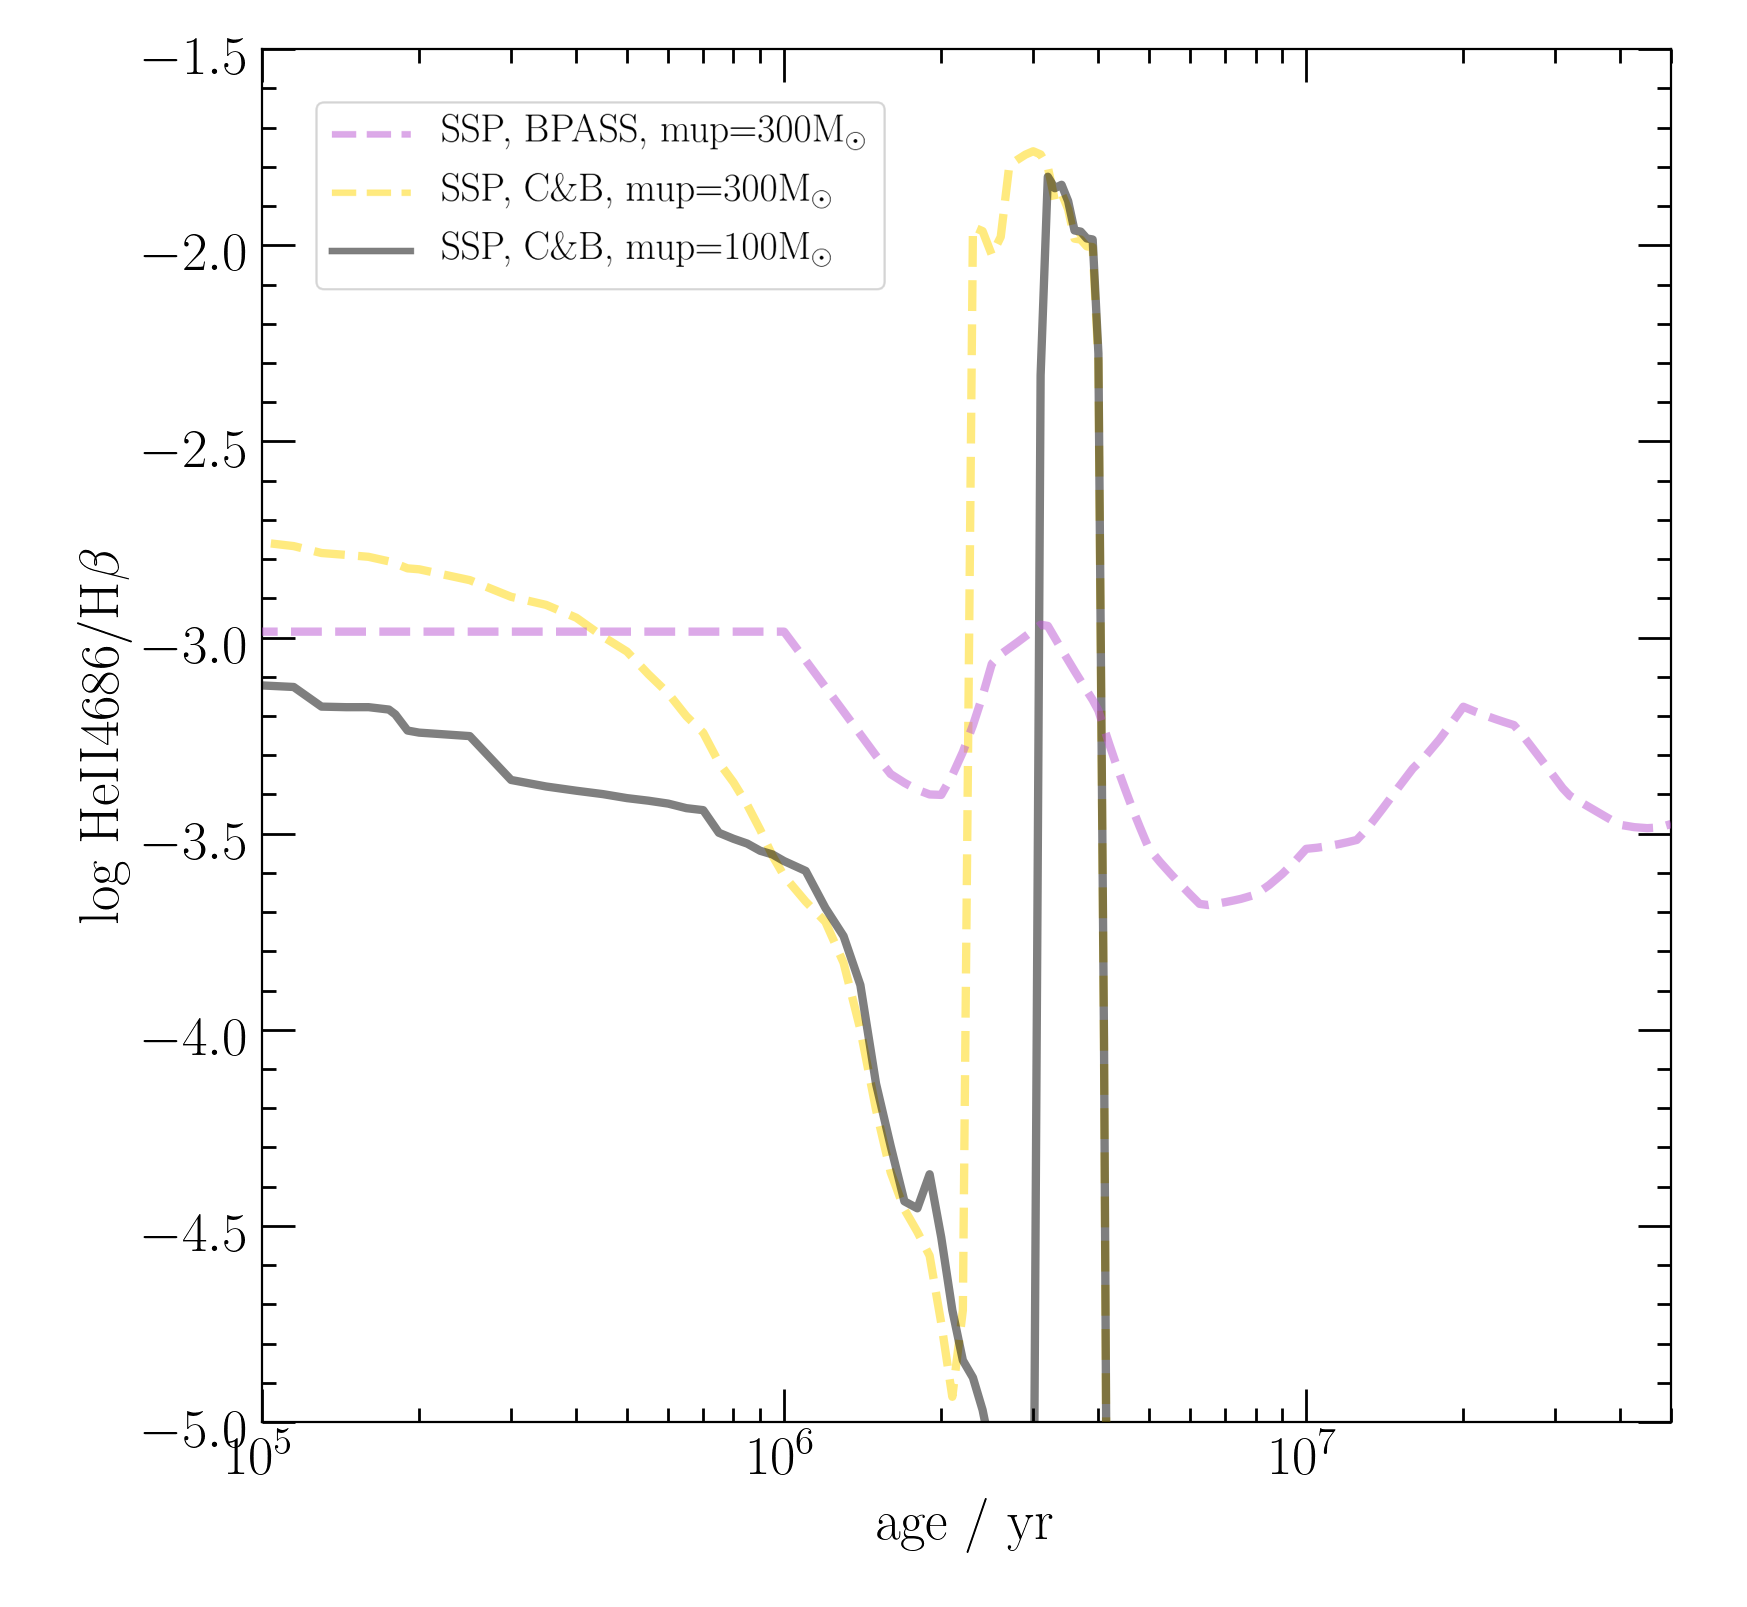
In Figures 5 and 6, we show the evolutionary behaviour of the EWs for the H and He ii nebular lines, and the intensity ratio, I(He ii )/I(H). For C&B models, we show the results for two values of , 100 and 300 M⊙, whereas the binary models are shown only for =300 M⊙. The nebular EW(H) steadily decreases with age as massive stars die in a coeval population. On the other hand, the nebular EW(He ii ) shows a second peak after the initial steady decrease, with the value of this second peak, which corresponds to the WR phase, higher than the values at the pre-WR phase for the C&B models. The log(I(He ii )/I(H)) has values between 3.5 to 2.7 when all stars are in the main sequence. However, the highest value is reached during the WR phase of single star evolutionary models, which happens between 2.3 to 4.0 Myr with =300 M⊙, and between 3.2 to 4.0 Myr with =100 M⊙. In C&B models, the highest value is close to for both the values of , dropping steeply to values below at 4 Myr. The evolutionary trend is notably different in BPASS binary models: the highest values are reached during the main sequence phase, thereafter the value remaining between 3.5 and 3 to ages even beyond 30 Myr. Unfortunately, the highest value of I(He ii )/I(H) ratio differs in different publicly available SSP models, with the value depending on the details of the stellar evolutionary and atmospheric models used as illustrated in Mayya et al. (2020). The mean value of I(He ii )/I(H)=0.00940.0025 for our sample regions is in good agreement with the expected value for ionization from WR stars in C&B models, whereas it is higher than the peak value reached in BPASS models. The systematically low value of this ratio during the WR phase in BPASS single star and binary star models limits the use of BPASS models, as of now, for a robust discussion of WR stars as ionizing source in our He ii nebula. We hence draw conclusions regarding the source of ionization of He+ using the C&B SSP models, and make use of the BPASS models only to discuss qualitative changes in our C&B-based results, if the Cartwheel clusters contain binaries in significant numbers.
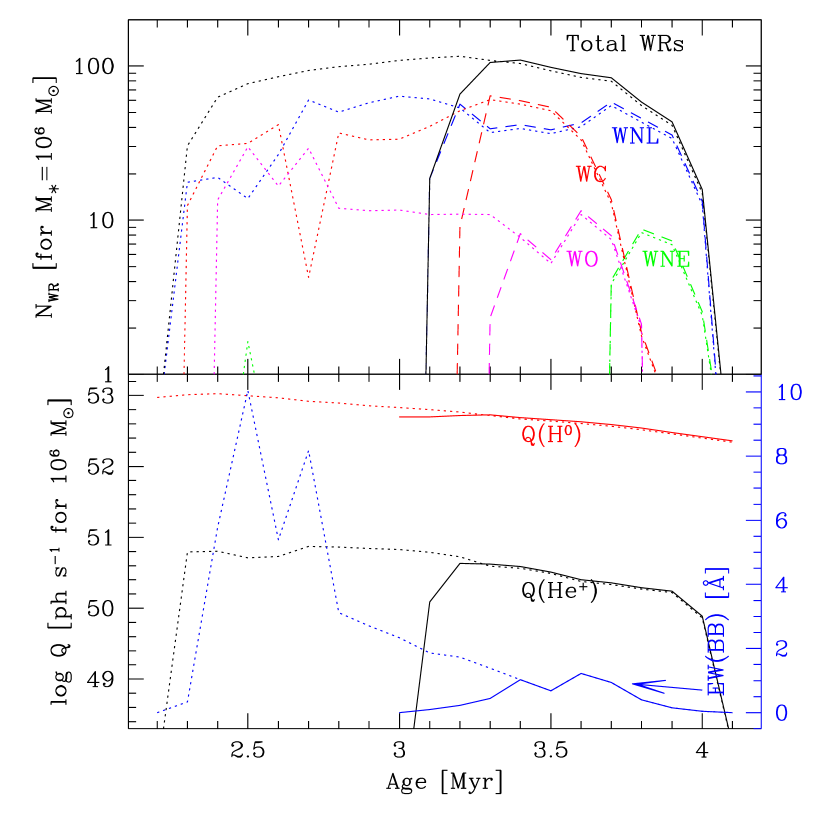
In Figure 7, we show the expected number of WR stars of different sub-types during the WR phase (top panel), the ionizing photons rates Q(H0) and Q(He+), as well as the expected EW of the BB (bottom panel) for the Z=0.004 C&B SSP. Note that these numbers do not take into account the presence of WR-like stripped (or spun-up) binary stars, which are capable of ionizing He+, but do not show strong blue bumps (see e.g. Götberg et al., 2018). In this figure, all quantities except EW(BB) depend on the cluster mass. We scaled all calculated values to a cluster mass of M⊙. In order to calculate the model EW(BB), we obtained the flux in the BB, and the underlying continuum. The bump flux is obtained by integrating the model spectra of pure WR stars between 4570 Å and 4740 Å. The underlying continuum flux is obtained as a mean of continuum fluxes at the blue and red part of the BB. The blue and red continua are obtained over 50 Å width filters centered at 4525 Å and 4905 Å, respectively.
Both the =100 M⊙ and 300 M⊙ models have a total number of 100 WR stars/ M⊙ of stellar mass at any time during the WR phase. The WC and WNL stars are the two main types expected up to around 3.6 Myr, after which WNL type is the dominant type with some contribution from WNE type. However, as illustrated earlier, the WR phase begins earlier for higher , which leads to earlier availability of the He+ ionizing photons for =300 M⊙ models. It can be noticed from the figure that the Q(He+) increases by more than two orders of magnitudes when the WR stars start appearing in the cluster, whereas the Q(H0) continues its steady decrease that started at the end of the pre-WR phase into the WR phase. Unlike Q(He+) and Q(H0), whose maximum values do not depend on the chosen of the IMF, the maximum value of the EW(BB) is very sensitive to the choice of . The maximum value reached for =100 M⊙ is 1.2 Å at 3.6 Myr, whereas it is as high as 10 Å for the =300 M⊙ models. The evolutionary behaviours for =300 M⊙ and 100 M⊙ are indistinguishable for ages greater than 3.4 Myr.
2.5 Ionizing photon rates and cluster masses
We used the observed luminosity in the H recombination line, L(H), to estimate the equivalent number of O7V stars using a typical luminosity of an O7V star of 4.76 erg s-1 from López-Sánchez & Esteban (2010).
We also calculated the H0 and He+ ionizing photon rates, Q(H0) and Q(He+), respectively, for a Case B photoionized nebula using the basic equations for photoionized nebulae (Osterbrock & Ferland, 2006; Mayya et al., 2020).
We then calculated the stellar mass in the cluster that is ionizing each region, using:
| (2) |
where M⊙-1 is the H0 ionizing photon rate for the Z=0.004 SSP in the C&B models for the characteristic age in the WR phase of 3.4 Myr. The masses would be around a factor of two lower, or higher, for the clusters that are in the pre- or post-WR phases, respectively. The derived values of N(O7V), M∗, and Q(He+) are given in columns 10, 7 and 8, respectively, of Table 1.
2.6 Potential ionizing sources of He++ nebulae
2.6.1 Wolf-Rayet stars
From Figure 6, it is apparent that the WR stars are the most likely sources of ionization of He+ in majority of our H ii regions. However, as commented earlier in this section, none of the spectra showed the BB (neither other WR features; see e.g. Gómez-González et al. 2021). In order to understand this apparent contradiction, we estimated an upper limit on the EW of the BB, using the noise measurement in the continuum adjacent to the expected BB and assuming a Gaussian profile of FWHM=20 Å for the BB (see e.g. Gómez-González et al., 2020). The resulting EWs are given in column 11 of Table 1. In the table, we also give the theoretically expected number of WNL-type and all WR stars in each region, assuming a uniform age of 3.4 Myr. The expected number of WR stars is as high as 242 for region#99, and in the 30–40 range for four other regions (#90, 81, 84, 118). In rest of the regions the expected numbers are less than 30.
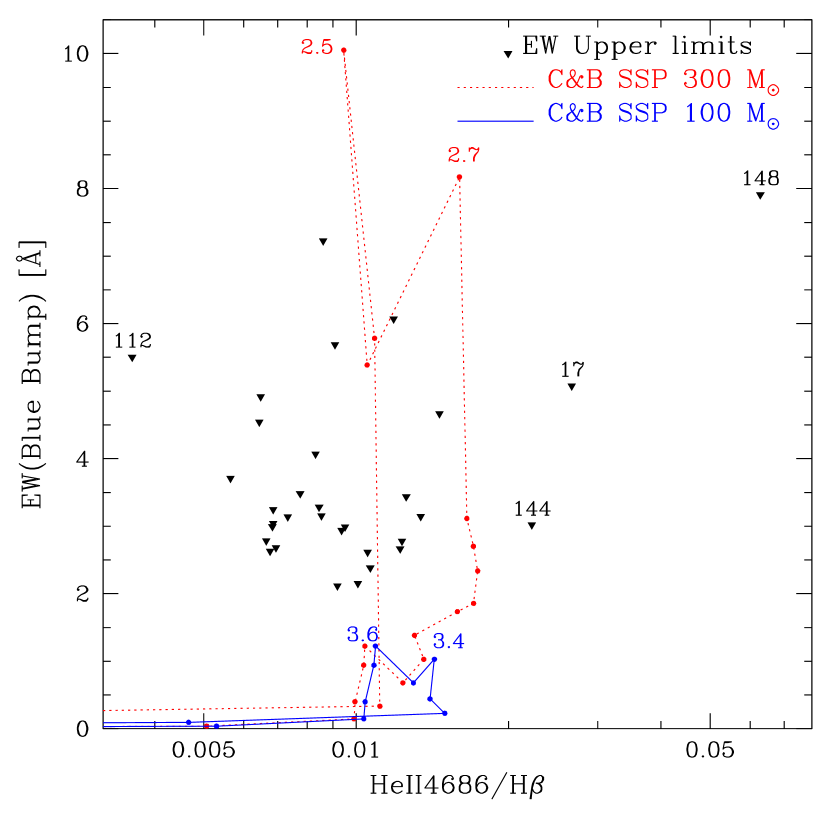
The observed upper limits on the EW(BB) are compared with those expected in the C&B models in the EW(BB) vs He ii /H plane in Figure 8. As discussed earlier, the theoretically expected EW(BB) reaches a maximum value of only 1.2 Å for M⊙, whereas it could be as high as 10 Å for M⊙. The observational detection upper limits on the EW(BB) are higher by factors of 2 to 6 as compared to the theoretical values in the absence of Very Massive (mass100 M⊙) Stars. This illustrates that the absence of the blue bump does not necessarily imply the absence of WR stars. At the metallicity of the Cartwheel H ii regions, WR stars in numbers sufficient to doubly ionize helium could be present even when the characteristic broad BB is not detected. This could be the case not only in the Cartwheel regions, but in general in all metal-poor systems that show He ii nebular line (e.g. Shirazi & Brinchmann, 2012).
It is interesting to note that we would have been able to detect the BB when Very Massive Stars in clusters, if present, go through the WR phase. It can be inferred from Figure 7, that the =300 M⊙ models provide He+ ionizing photons for double the duration as compared to the =100 M⊙ models. This implies that if all the He ii -detected H ii regions had an IMF with =300 M⊙, the BB would have been at the detectable level in 50% of the cases. The non-detection of the BB in all regions points to the absence of 100 M⊙ stars in H ii regions of the Cartwheel.
Given that our He ii -line detection criteria are tuned to detect nebular (narrow) lines, there exists a possibility that we inadvertently excluded possible WR sources in spectra where we did not detect the He ii narrow line. In order to verify this possibility, we analyzed the output results of the Gaussian-fitting for all the regions to look for a broad He ii component with SNR3. None of the spectra showed evidence for it. If stars more massive than 100 M⊙ were common, the BB should have been present at detectable levels in at least a few of the 80 H-bright regions. In fact, none of the spectra of our original sample of 221 H ii regions showed the BB. Such a non-detection reinforces the inference drawn from the He ii -detected regions that the upper mass cut-off of the IMF rarely exceeds 100 M⊙ in H ii regions.
In summary, WR stars are viable sources of He+ ionization in He ii -detected regions of the Cartwheel, in spite of the non-detection of the BB. In rest of this paper, we use photoionization models to investigate whether the intensity ratios of bright nebular lines support the scenario of WR stars as the only source of ionization in majority of the regions. Four regions with extreme He ii /H ratio (identified in Figure 8), possibly require alternative sources of ionization, which are also investigated in the paper.
2.6.2 Main sequence stars
The bulk of the ionization of hydrogen in H ii regions is provided by star clusters in their early phase when massive O stars are in the main sequence (MS). Some of these stars are hot enough to doubly ionize helium. The emission EW(H) is maximum during this early phase having values larger than 500 Å. The highest values of He ii /H during this phase are 0.002 and 0.001, respectively in C&B and BPASS models, both with =300 M⊙. It can be inferred from Figure 2 that we require SNR above 400 to detect He ii line ionized by the MS stars. There are 5 regions with SNR330, all of which have He ii /H0.006, i.e. at least a factor of three higher than the MS values. On the other hand, the region with the lowest value of He ii /H is #112, which is around twice the MS value. Stripped binary stars, which are not taken into account in the C&B and BPASS models, may have a role in increasing the He ii /H above the calculated values. The MS phase is characterized by high EW(H). We analyse all regions in He ii /H vs EW(H) plane to address this issue in Sec. 3.
| H ii ID | Higdon | Gao | Wolter | He++ | ||||
|---|---|---|---|---|---|---|---|---|
| ID | offset | ID | offset | log LX | ||||
| [arcsec] | [arcsec] | erg s-1 | ||||||
| (1) | (2) | (3) | (4) | (5) | (6) | (7) | (8) | |
| 13 | H2 | — | — | W21 | 0.61 | 38.70 | no | |
| 16 | H3 | G18 | 0.84 | — | — | — | yes | |
| 49 | — | — | — | W18 | 0.29 | no | ||
| 75 | H10 | G19 | 0.65 | W23 | 0.33 | 38.78 | yes | |
| 85 | H14 | G17 | 0.16 | W7 | 0.42 | 39.70 | yes | |
| 88 | — | G15 | 0.12 | W8 | 0.52 | 39.18 | no | |
| 91 | H15 | G14 | 0.44 | — | — | — | yes | |
| 99 | H17 | G12 | 0.77 | W24 | 2.39 | 38.57 | yes | |
| 111 | H20 | G11 | 2.17 | W10 | 1.75 | 40.44 | yes | |
| 117 | — | G7 | 1.33 | W13 | 1.21 | no | ||
| 118 | H23 | G8 | 0.24 | — | — | — | yes | |
| 119 | H24 | G6 | 0.56 | W14 | 1.28 | 39.88 | yes | |
| 125 | — | G5 | 0.65 | W15 | 1.42 | 39.06 | no | |
| 144 | H26 | G2 | 0.50 | W17 | 0.70 | 39.92 | yes | |
| 146 | — | G3 | 1.74 | W16 | 2.32 | 39.83 | no | |
| 155 | — | G4 | 0.41 | — | — | — | no | |
| 213 | H29 | G9 | 0.81 | W12 | 0.72 | 39.49 | yes | |
2.6.3 Ultra-luminous X-ray sources
Pointlike non-nuclear X-ray sources with isotropic bolometric luminosity in the the 0.5–10 keV band () exceeding 3 erg s-1are referred to as ULX sources. Gao et al. (2003) and Wolter & Trinchieri (2004) analyzed the Chandra/Acis data of Cartwheel finding 31 and 24 ULX sources, respectively, in the FoV of the Cartwheel, the majority of them coinciding with the star-forming ring of the Cartwheel. The most luminous of these sources (#11 in Gao et al. 2003 and #10 in Wolter & Trinchieri 2004) has erg s-1, thus satisfying the criterion to be called as a hyperluminous X-ray source (HLX). However, a one-to-one correspondence with an optical knot in the ring was poor in both the studies, with offsets between the H ii complexes defined by Higdon (1995) and the ULX coordinates, generally exceeding the 1 arcsec beam of the Chandra/Acis observations, even after correcting for zeropoint offsets in the respective coordinate systems. The reason for these large offsets is that there is more than one star cluster within the seeing-limited resolution of 1.7 arcsec (1 kpc) of the H image of Higdon (1995), with the coordinates referring to that of the brightest H ii region in the complex, which is not necessarily the ULX source. The astrometrically calibrated MUSE and HST dataset that we use in this study offers 3 and 8 times better spatial resolutions, respectively, as compared to the H image of Higdon (1995), which allows us to improve upon the identification of the optical counterpart of the ULX sources.
In Figure 4, we mark the positions of ULX/HLX sources by red circles overlaid on the HST image. Fourteen of the 17 X-ray sources coincide with the position of an H ii region to better than an arcsec, the beam of the X-ray observations. The H ii region closest to a ULX/HLX source is identified in Table 2, where we also give the offsets for each source from the coordinates reported by Gao et al. (2003) and Wolter & Trinchieri (2004). It is worth noting that given the high density of H ii regions in the ring, more than one H ii region can be associated for sources with offsets exceeding an arcsec. The offsets are systematically smaller for Gao et al. (2003) coordinates. Source #111, the identified counterpart of the HLX source (G11) is outside the Chandra/Acis beam, suggesting that the identification is likely to be wrong, and that the source may be associated to a non-H-emitting object. In order to identify such a candidate, we looked for any stellar knot in the HST images. We find a faint red knot at the edge of the Chandra/Acis beam, which could be a likely counterpart of the HLX source (see the region G11 in the figure). A He++ nebula is present within the beam of the X-ray observations for ten and seven ULX sources identified by Gao et al. (2003) and Wolter & Trinchieri (2004), respectively (see the last column of the table). We analyse below the possible role of X-rays from the ULX sources in the ionization of He+.
Schaerer, Fragos & Izotov (2019) found that the observed He ii /H ratio in metal-poor galaxies can be explained if the bulk of the He+ ionizing photons is emitted by HMXBs, whose numbers are found to increase with decreasing metallicity. They obtained an empirical relation between Q(He+) and the X-ray luminosity, , suggesting an almost constant ratio photon erg-1, with extreme values of being 1–3 photon erg-1. Plat et al. (2019) warned that this process is not efficient at EW(H)200 Å, as these systems are too young to form compact objects (neutron stars and stellar mass black holes) necessary for the existence of HMXBs. Only two Cartwheel He ii-emitting regions have EW(H)200 Å, and hence ionization of He+ by ULX sources is a possibility in majority of the He ii-emitting regions with an associated ULX source.
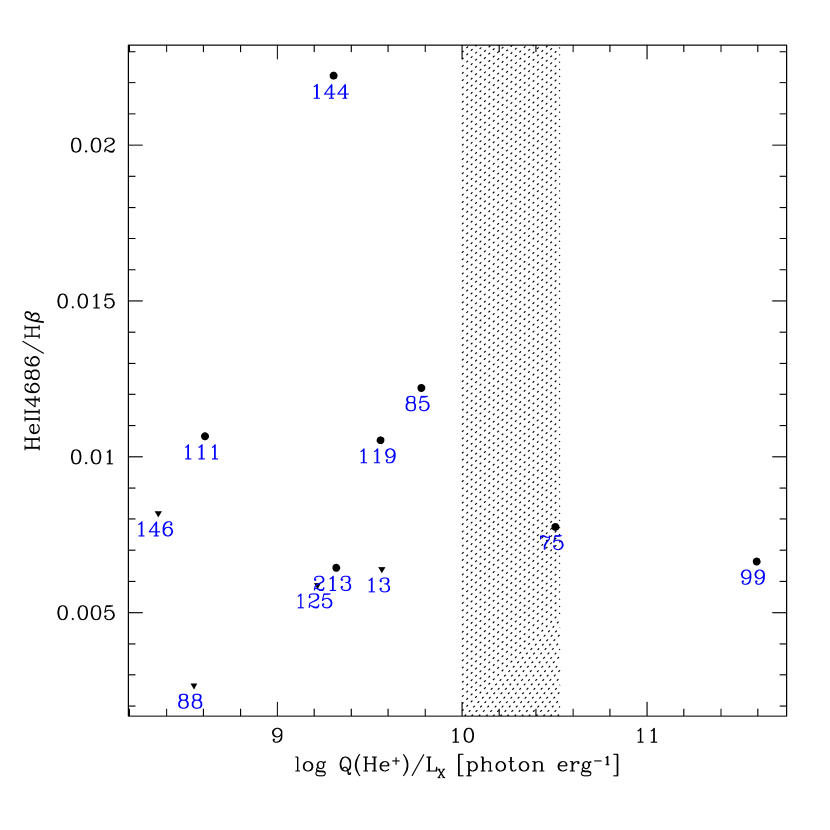
The presence of an ULX source in 17 of the Cartwheel H ii regions allows us to calculate the value of directly for these regions. For this purpose, we use the Q(He+) for each region in column 8 of Table 1 and the of column 7 of Table 2, which was taken from Wolter & Trinchieri (2004). In Figure 9, we plot the He ii /H ratio against the values for the 11 sources for which we have well-determined values of . The He ii line is detected in seven of these sources, with the remaining four only having an upper limit for the detection of the He ii line. We find a dispersion of more than 2 orders of magnitudes in the value of for the individual H ii regions in the Cartwheel, with only one of these regions having in the range found by Schaerer, Fragos & Izotov (2019). This large variation in the value suggests that the X-rays cannot be the unique source of ionization in these sources. It is likely that not all ULX sources in the Cartwheel are HMXBs, and instead the X-ray luminosity may be originating in supernova (SN) remnants. Wolter, Fruscione & Mapelli (2018) discuss them as HMXBs, whereas in the original detection papers (Gao et al., 2003; Wolter & Trinchieri, 2004), such a possibility was firmly established for the only HLX source (#111) in the Cartwheel. The -value obtained for this source is more than an order of magnitude lower than the value proposed by Schaerer, Fragos & Izotov (2019). We analyse the fluxes of lines from high ionization levels such as [Ar iv] to address the role of X-ray ionization in each of the H ii regions associated with an ULX source.
3 Analysis of nebular line ratios
The wealth of spatial and spectroscopic information contained in the MUSE data of the Cartwheel offers us a great opportunity to comprehensively address the nature of ionizing sources based on the ionization state of the nebulae. Specifically, the data allow us to study whether the H ii regions containing the He ii line show any difference with respect to our control sample of 87 H ii regions in the same galaxy, in any of the diagnostic line ratios commonly used in ionized nebulae (Baldwin, Phillips, & Terlevich, 1981).
In this section, we discuss the general trends seen in different line ratio diagrams. We also discuss the possible role of ULX sources in the ionization of He+. In Sec.4, we compare the observed trends with that expected from different theoretical scenarios of ionization of He+.
3.1 He ii /H, [O iii] /H and EW(H)

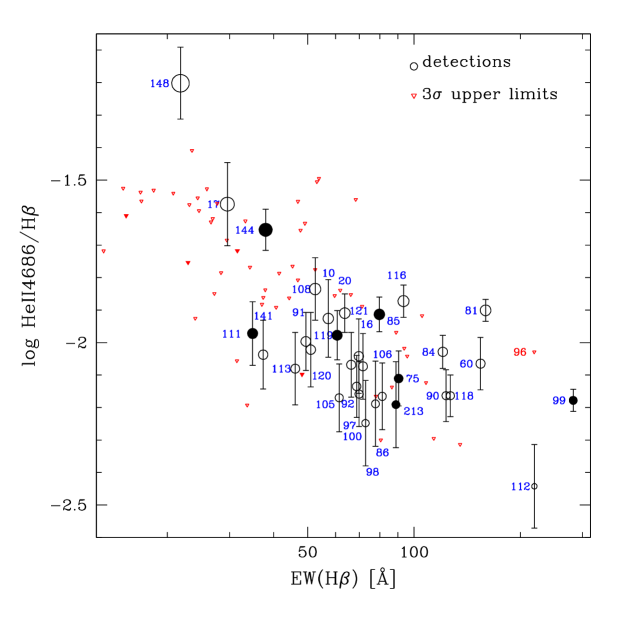
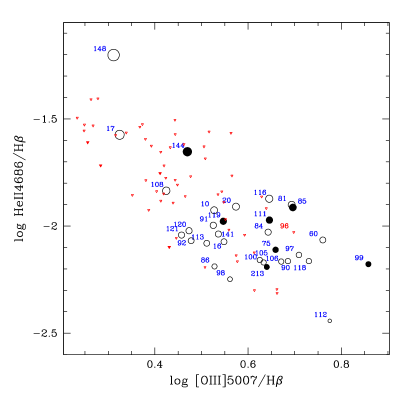
We start our analysis of the diagnostic line ratios by plotting in Figure 10 the He ii /H ratio versus EW(H), which is a standard indicator of age of stellar populations during their early nebular phase, as illustrated in Figure 5. In this and all the upcoming figures, we distinguish H ii regions with and without the detection of the He ii nebular line by circles and inverted triangles, respectively. Filled symbols show the H ii regions that have an associated ULX. Error bars are shown only when the errors are significantly larger than the symbol size. H ii regions with detected He ii line are annotated with their number designation from Table 1. Care is taken to avoid superposition of the annotations, but it was not always possible due to the crowding of points in some of the plots.
Figure 10 shows that the He ii line is detected in seven of the 12 H ii regions with EW(H)100 Å. Among the high EW(H) regions without He ii detection, region#96 is identified in the plot. This region lies slightly outside the ring in the bright southern arc (see Figure 4). The H ii regions with lower emission EW(H) have, in general, fainter nebular lines making the detection of the faint He ii line dependent of the SNR of each spectra (see Figure 2). Three regions (#144, #17 and #148) standout in the diagram, as they are among the regions with the lowest EW(H), but having the highest values of He ii /H ratio. In fact, these three regions exemplify a tendency for the upper boundary of the He ii /H ratio to increase with decreasing EW(H).
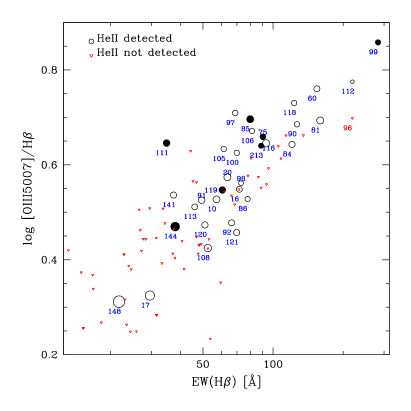
We show the [O iii] /H ratio against EW(H) on the left panel of the Figure 11. The [O iii] /H ratio is a well-known indicator of the ionization state of an H ii region, with high ionization regions having a higher value of the ratio. We clarify that the error bars on the ratio are negligibly small, including for those regions without the He ii detection (inverted triangles). Note that the higher EW(H) regions have higher [O iii] /H ratio, independent of whether the He ii line is detected or not, with region #99 (the brightest H ii region) and #148 (H ii region with the highest He ii /H ratio) lying at the extreme ends of the relation shown by the rest of the regions. The region #111 stands out from the relation for having a too high ionization for its observed low EW(H). We recall that this source is the H ii region nearest to the HLX source. However, its association with the HLX source is doubtful as discussed in Sec. 2.6.3. Dilution of EW(H) from a non-ionizing cluster inside the aperture used for extracting the spectrum is the most likely reason for this region to displace from the observed correlation. This is supported by a visual examination of the HST images of this region, which reveals two sources, with the source brighter in the F814W image the likely non-ionizing cluster.
In the right panel, we show the He ii /H ratio against the [O iii] /H ratio. As expected, He ii -line detection is more frequent in high ionization H ii regions as compared to relatively low ionization regions — it is detected in as much as 75 per cent (15 out of 21) of the high ionization regions (log([O iii] /H)0.60). Surprisingly, low ionization H ii regions (log([O iii] /H)0.40) have a non-zero detection frequency (10 per cent; two out of 20). The increasing tendency for the upper boundary of He ii /H value with decreasing EW(H) is also manifested in the He ii /H vs [O iii] /H plot, with #99 and #148 marking the endpoints of this tendency.
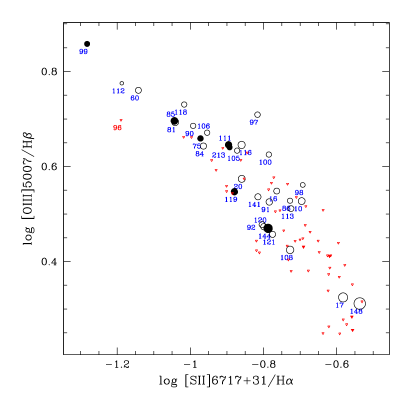
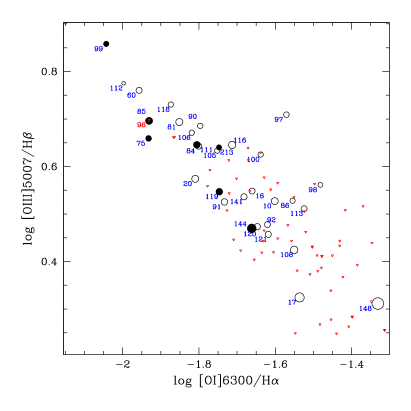
3.2 Location of He ii-emitting H ii regions in diagnostic diagrams
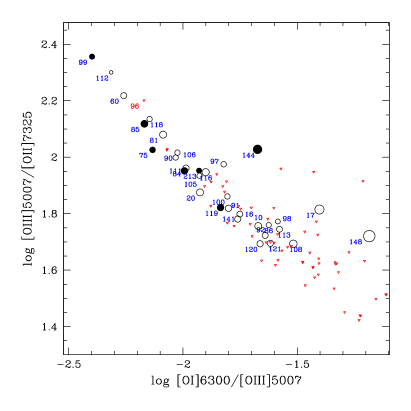
In order to understand the sources of ionization of He+ in H ii regions of Cartwheel, we show in Figure 12 all our regions in the most commonly used BPT diagrams (Baldwin, Phillips, & Terlevich, 1981). In the first three plots (top two and the bottom left), we use lines of low ionization potential in the x-axis, whereas the y-axis contains [O iii] line, which as discussed before originates in the high ionization zone. The H ii regions lie along a sequence wherein the ratios of [N ii] /H, [S ii] /H and [O i] /H, systematically increase as the [O iii] /H ratio decreases. The fraction of He ii-emitting regions decreases along the sequence from top-left to bottom-right. In the bottom right panel, we show line ratios that maximize the values for high ionization regions on the y-axis and low ionization regions on the x-axis. In this plot, the relation is much tighter than in other plots with the He ii-emitting regions having the lowest value of [O i] /[O iii] ratio for any fixed [O iii] /[O ii] value.
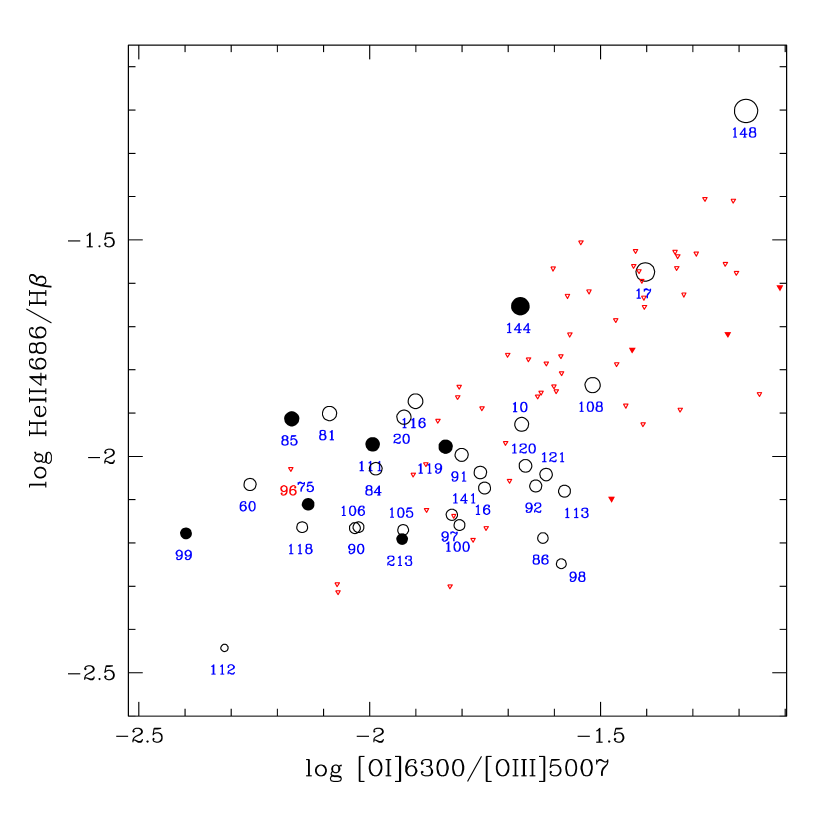
In order to investigate the possible presence of shock ionization/excitation in H ii regions having He ii lines, in Figure 13 we plot the He ii /H against [O i] /[O iii] ratio, which is sensitive to the presence of shocks (see e.g. Figure 15 in Plat et al., 2019). The four regions with the highest values of He ii /H (#148, 17, 144 and 108) are indeed among the H ii regions with the highest values of the shock-sensitive ratios.
The regions ionized by the ULX sources are expected to have [O iii] /H and [O i] /H0.1, occupying the transition region between the Active Galactic Nuclei (AGNs) and Low-Ionization narrow-emission line regions (LINERs) in the BPT diagrams (Gúrpide et al., 2022). None of the ULX sources in the Cartwheel occupy these zones, suggesting that the ULX sources have very limited role, if any, in the ionization of the nebula with which the ULX source is positionally coincident.
4 Discussion
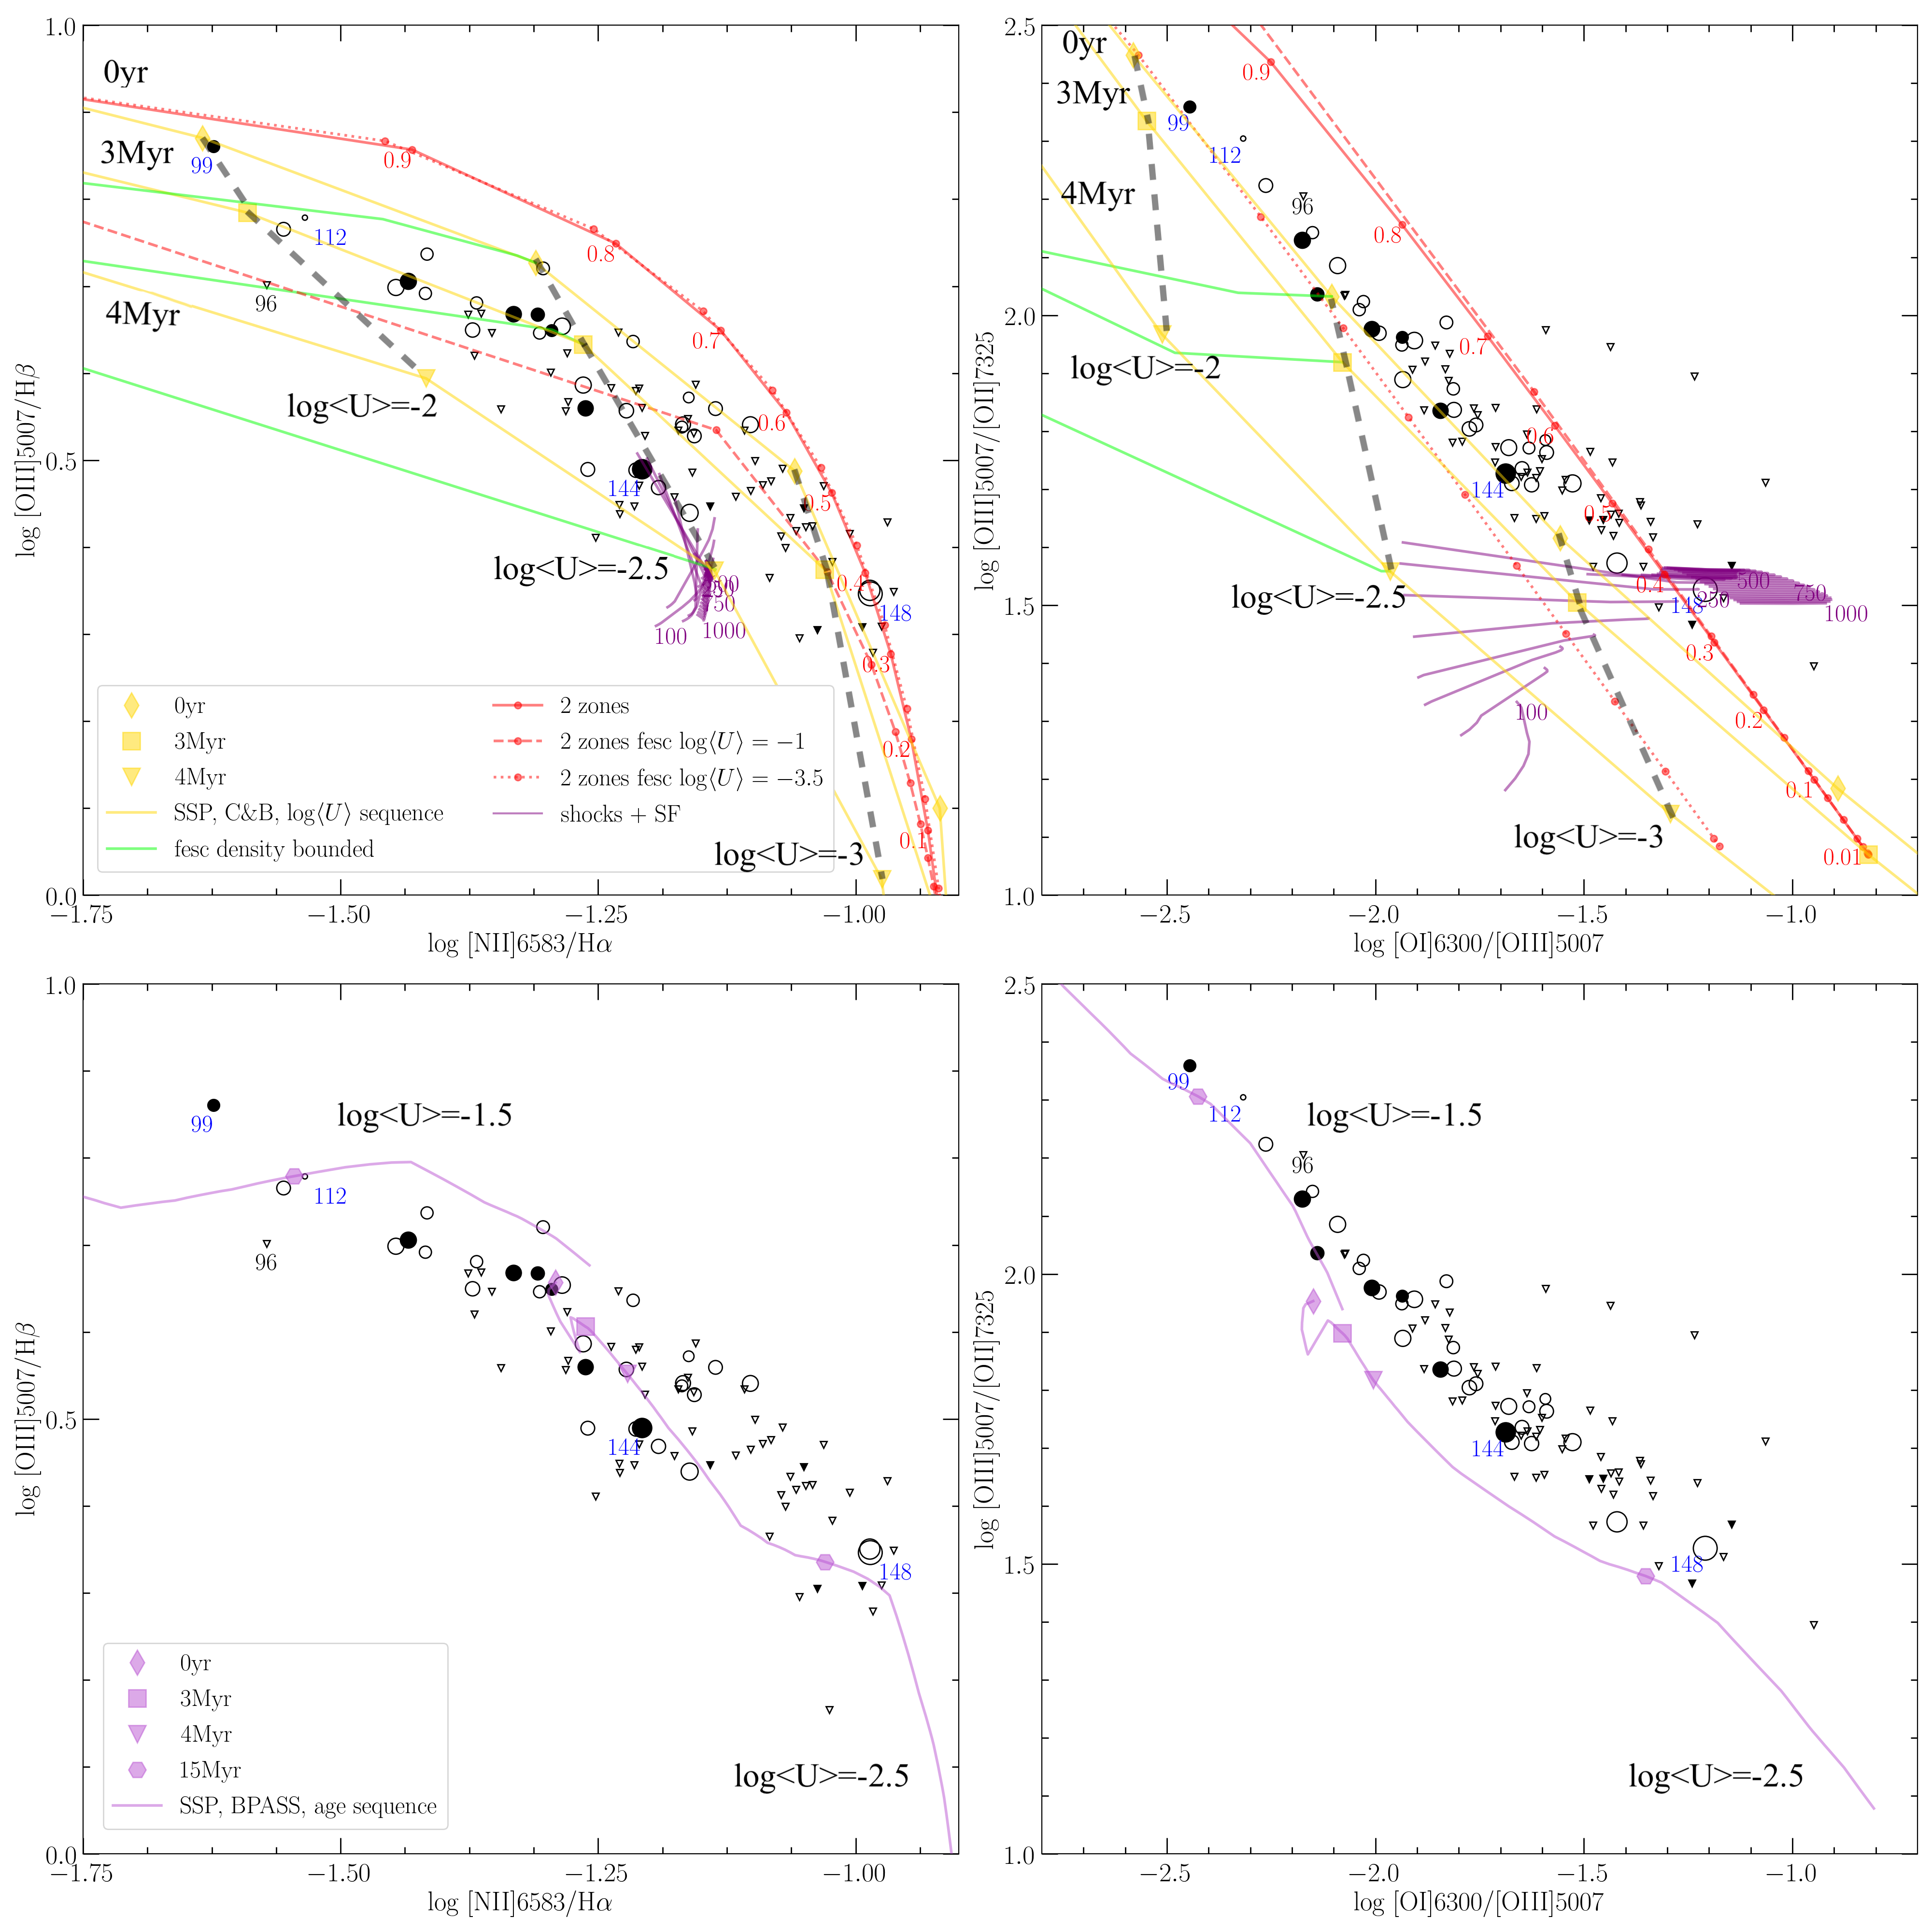
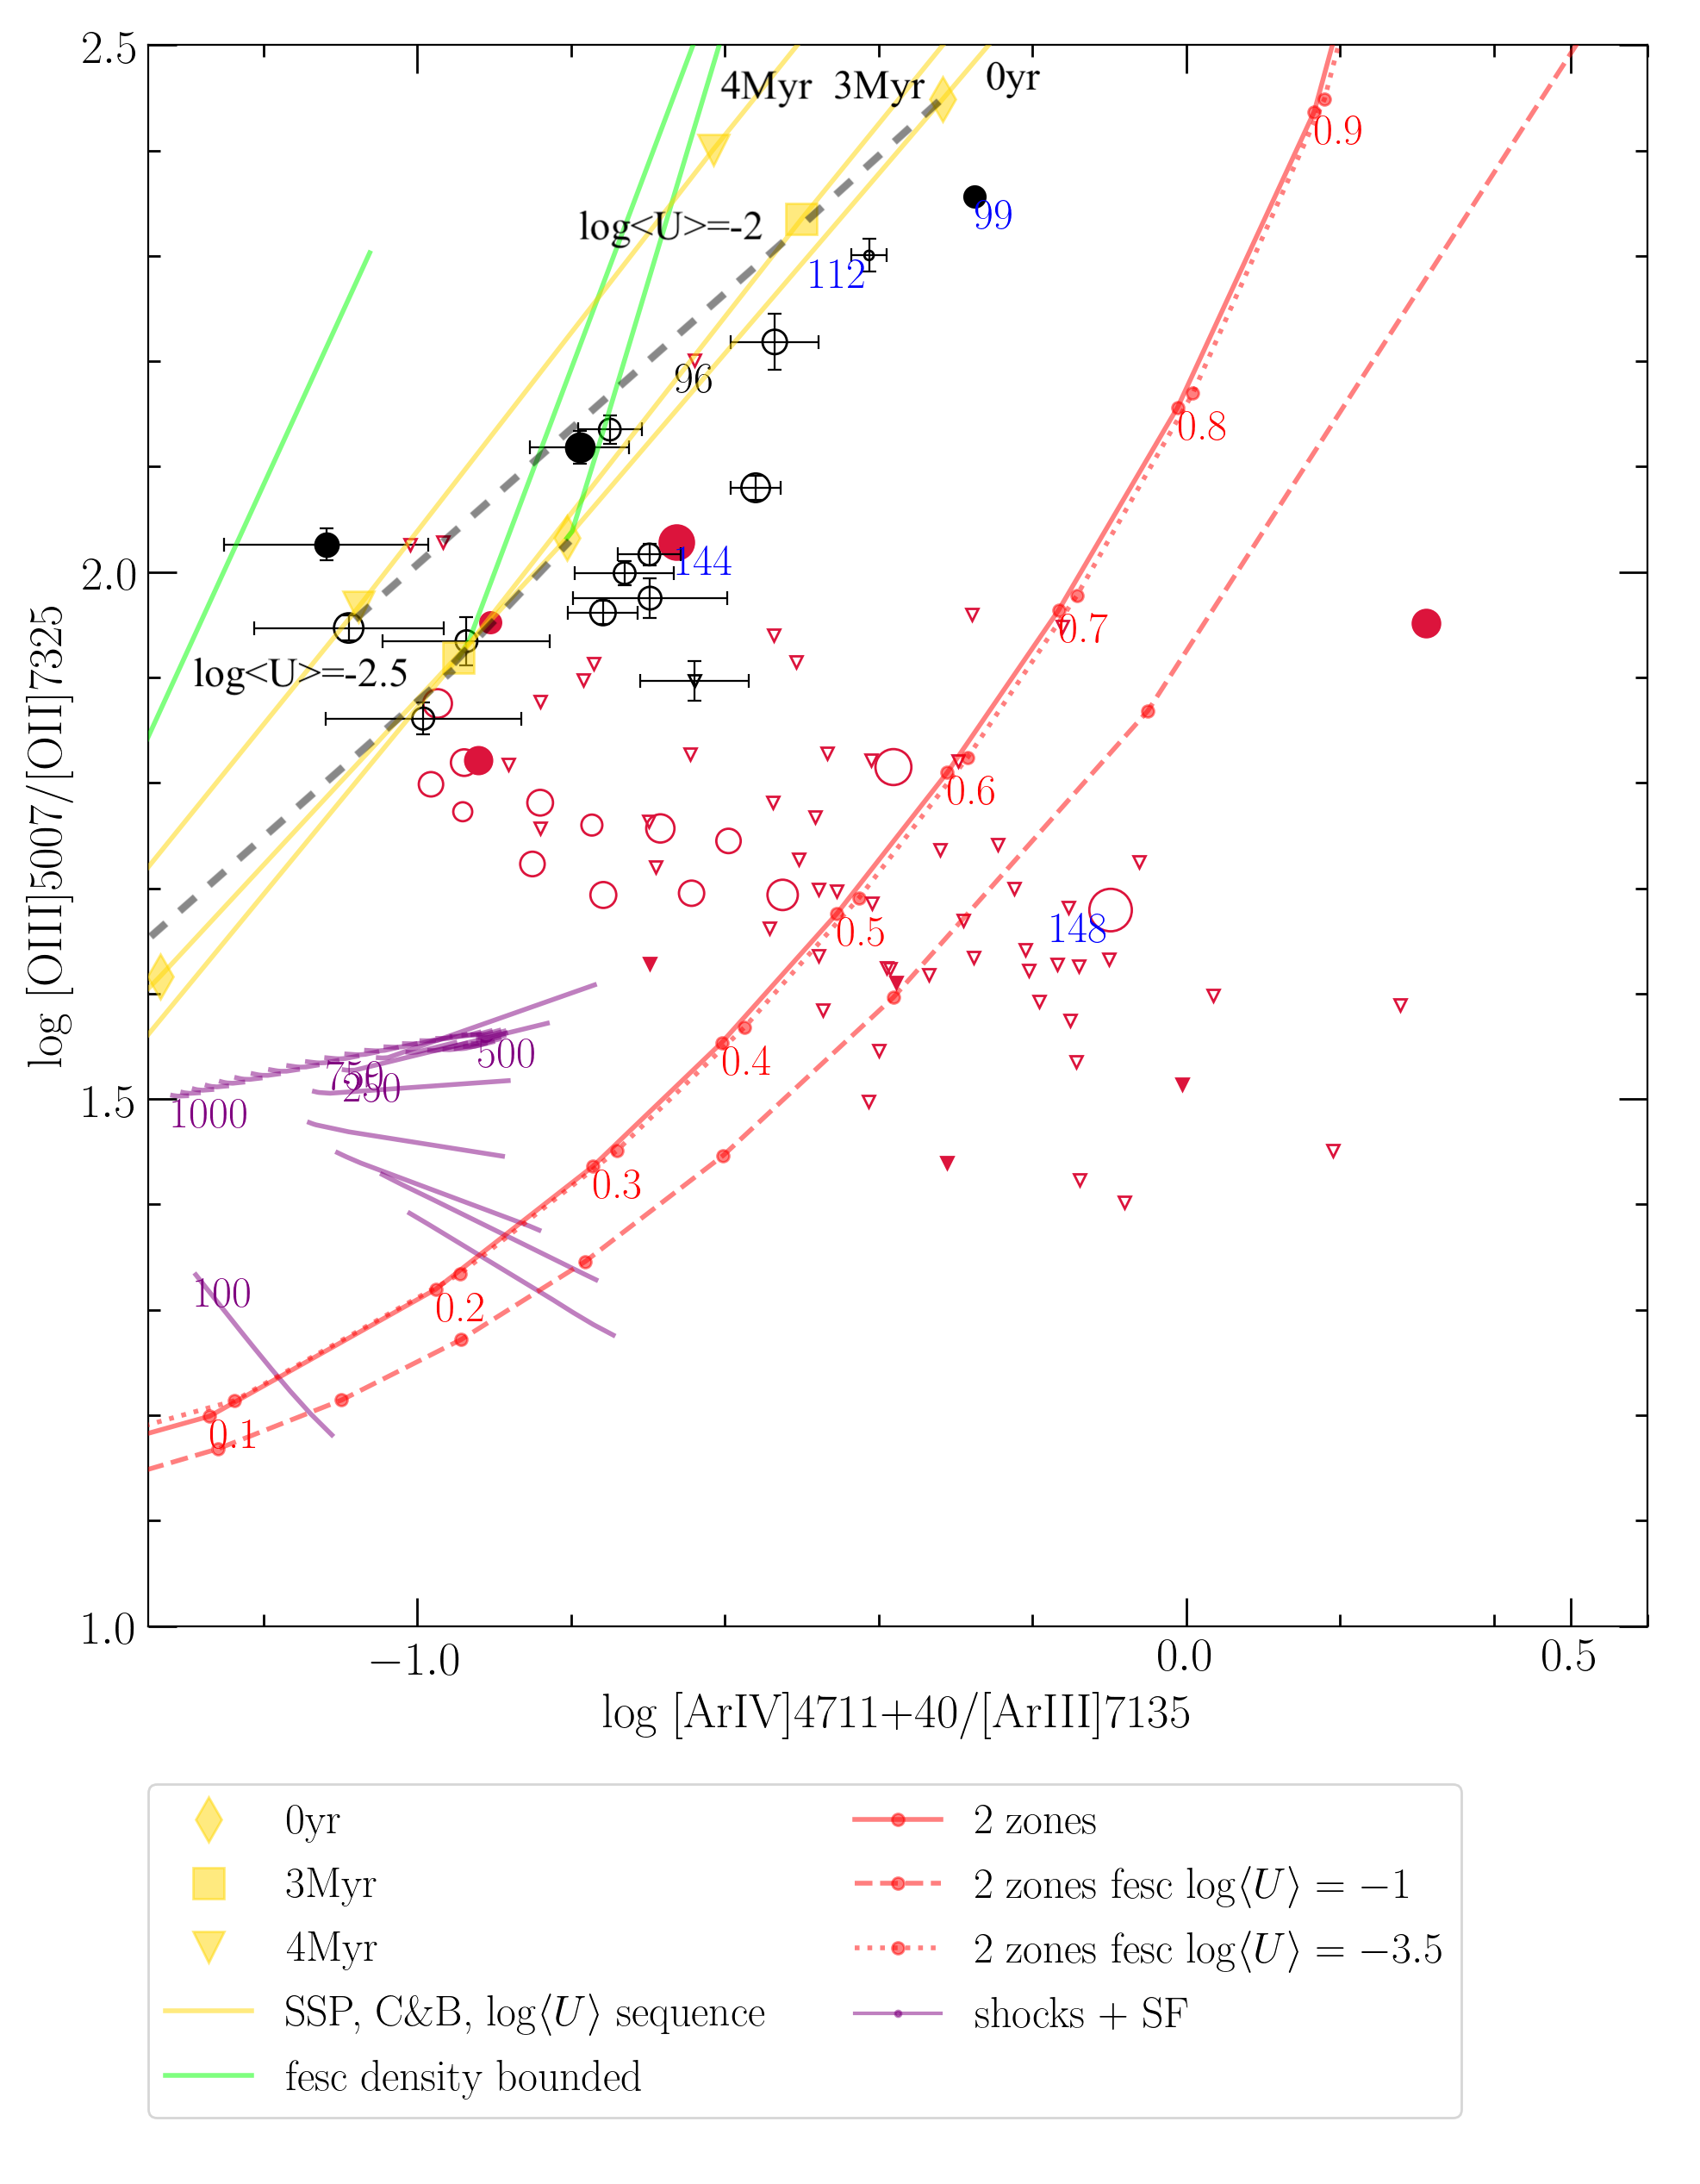
We now investigate the source of He+ ionization in the Cartwheel using the trajectory of theoretical models of ionization in various diagnostic diagrams using the theoretical line ratios calculated by Plat et al. (2019). In particular, we use the diagnostic diagrams involving [O iii] /H ratio plotted against [N ii] /H and the EW(H), [O iii] /[O ii] vs. [O i] /[O iii] , He ii /H vs. EW(H), He ii /H vs [O i] /[O iii] and [O iii] /[O ii] vs [Ar iv] /[Ar iii] . These diagrams are chosen because they are sensitive to the different mechanisms of ionization explored in this work.
4.1 Calculation of theoretical nebular line ratios
We consider two sources of ionization: photoionization, which is the most dominant source of ionization in H ii regions, and ionization by radiative shocks. Photoionization by stellar clusters with and without binaries is considered. Since the objects under study are H ii regions, the ionizing source is better modelled as a single age cluster (SSP), rather than a population of stars formed over a long period of time. We hence consider only SSP models. However, the dilution of EW(H) caused by the presence of any non-ionizing source (e.g. an underlying old stellar population) inside the aperture used for extraction is taken into account.
The emission line fluxes from an H ii region are computed with CLOUDY v17.02 (Ferland et al., 2017) following the approach of Gutkin et al. (2016). We use C&B for single star models and BPASS v2.2.1 for binary population models. The stellar and interstellar medium (ISM) metallicity is set to , which corresponds to the gas phase oxygen abundance of for the dust-to-metal mass ratio, =0.3 (the solar value is 0.36) following Gutkin et al. (2016). The ISM is considered to be of uniform hydrogen density of cm-3, which along with the rate of ionizing photons and filling factor sets the ionization parameter . Models are parametrized in terms of the zero-age volume-averaged ionization parameter , which is varied by varying the filling factor, see Gutkin et al. (2016) for details. We note that the values of , and used here are based on the mean values derived using the same MUSE dataset for the Cartwheel ring H ii regions in a companion paper (Zaragoza-Cardiel et al., 2022).
The H ii regions are assumed to be ionization-bounded, but contain dust grains that compete with gas in the absorption of ionizing photons. We also discuss the effect on the line ratios if the H ii regions are density bounded, i.e. when the size of the H ii region is limited by the gas density, rather than the ionizing photon rate. We account for the possible presence of holes or cavities in the H ii regions by means of an escape fraction of ionization photons. In addition to these two escape geometries, we follow the approach of Ramambason et al. (2020) and compute two-zone models, combining a low and high ionization parameter component. These two zones are either both ionization bounded, or one of them is density bounded.
The emission from fast radiative shocks is added using the models of Alarie & Morisset (2019)333The ISM metallicity in the shock models corresponds to the SMC metallicity, which is slightly lower than that used for our H ii regions. The nitrogen to oxygen abundance ratio is also lower in these models as compared to that used in our H ii region models. for the full set of shock velocities (100 to 1000 km s-1) available in these models. A pre-shock density of cm-3 and transverse magnetic field strength , which are typical values for the diffuse ISM in galaxies, are used. The calculated line ratios depend weakly on these fixed values, as compared to the variation in shock velocities. The effects of shocks are added at representative ages, which allows us to illustrate the effect of shocks on line ratios as the cluster evolves.
4.2 The line ratio sequence from photoionization models
In Figures 14 and 15, we overplot tracks for photoionization models for different initial values using C&B SSP models without binary stars, and BPASS models with binary stars. The ratios for leaky H ii regions, as well as for H ii regions experiencing radiative shocks are also explored. Additionally, the effect of an underlying old population is illustrated. We also explored the effect of binaries using BPASS models. We refer the reader to Plat et al. (2019) for a detailed illustration of the sensitivities of the explored parameters on the commonly observed optical and ultraviolet line ratios. In different plots, we plot sequences of age, or or shock velocities, depending on the sensitivity of the plotted quantities on the models. These are explained in annotations and legends of the corresponding figures.
The cluster evolution is followed up to 50 Myr with three epochs (0, 3, and 4 Myr) marked with differently shaped symbols (in some of the plots, the plotted range covers only the trajectory around 3–4 Myr). The initial between and are explored. In shock models, shocks are assumed to provide 25 per cent of the observed H flux. The sequences are formed for shock velocities between 100 to 1000 km s-1. High velocity shocks are expected in H ii regions following the explosion of SN, which start occurring at an SSP age of 4 Myr. Hence, the shock component is added to the 4 Myr H ii region emission with . These are shown in Figures 14, 16 and 17 by purple lines. In models involving escape of ionizing photons, the sequence is formed by varying the fraction of Lyman continuum (LyC) photons escaping the H ii regions. In two-zone models, the sequence is formed by varying the fractional contribution to the H flux from the high zone. These are shown in Figures 14, 16 (right) and 17 with red lines marked with dots for increase of the escape fraction between 0.1 and 0.9.
We now discuss the results on the ionization mechanisms suggested by the models based on the comparison of the locus of model parameters with observations, in selected line-ratio diagrams. We first discuss the results based on C&B models without binary stars, and at the end, comment on the effect of having binary stars in the SSPs.
Effect of : The density of the ISM surrounding the cluster, the rate of ionizing photons, and the volume filling factor of the ionized gas fix the initial of the models. In the top-left panel of Figure 14, it can be seen that the observed sequence of [O iii] /H values can be understood as due to a dispersion in the initial values, with the ionizing clusters in almost all of the H ii regions having ages between 3 and 4 Myr in C&B models. The observed range of line ratios is covered by the models with = to , with the small variations in the age being responsible for the observed spread in the direction perpendicular to the sequence. The observed sequence in the [O iii] /[O ii] vs [O i] /[O iii] plane (top-right) is also consistent as a sequence of initial . However, the inferred age from this diagram is 0 Myr, rather than 3–4 Myr inferred from the [O iii] /H vs [N ii] /H diagram. The latter diagram is sensitive to the selective escape of photons from either the low or the high ionization zones as will be discussed in the two-zone models below.
Effect of dust in H ii regions: All our models include dust inside the H ii regions. The quantity of dust is parametrized by the dust-to-metal mass ratio . The dust competes with gas in the absorption of ionization photons following the scheme proposed by Bottorff et al. (1998). Hence the number of ionizing photons absorbed by hydrogen, and all properties that depend on the ionizing photon flux, predicted by our models is lower than those predicted for dust-free ionization-bounded models. The optical depth of ionizing photons arising from dust is proportional to the total hydrogen column density, which is proportional to the ionization parameter. So as the ionization parameter increases, so does the absorption of ionizing photons by dust rather than hydrogen. This effect can be noticed in Figures 15 and 16, where the EW(H) decreases with at a fixed age (see also Erb et al., 2010; Plat et al., 2019).
Effect of upper cut-off mass of the IMF: The SSPs we used for the calculation of nebular quantities correspond to =300 M⊙. The non-detection of BB (see Sec. 2.6.1) in our spectra suggests the absence of stars more massive than 100 M⊙ in Cartwheel H ii regions. However, the results for =100 M⊙ are identical to that for =300 M⊙ after 3.2 Myr, as can be inferred from Figures 7 and 8. The expected values of He ii /H before and during the WR phase with =300 M⊙ is only marginally higher than that for =100 M⊙. Thus, the results presented here are not sensitive to the choice of upper cut-off mass as long as the SSP contains hot massive-stars that go through the WR phase (25 M⊙).
Effect of cluster evolution: The rate of ionizing photons emanating from a cluster starts decreasing when the most massive stars, also the hottest and the most luminous, end their main sequence life time. For clusters with the highest mass 100 M⊙, this starts happening at 3 Myr at Z=0.003, the metallicity corresponding to the Cartwheel. This decreases by 0.6 dex over the first 10 Myr, which leads to a gradual decrease of the high ionization line intensity ratios such as [O iii] /H. The EW(H) decreases slowly in the first 3 Myr reaching values 200 Å at 3 Myr, beyond which it drastically drops by more than an order of magnitude in 10 Myr. The decrease of and the EW(H) with age leads to a decrease of [O iii] /H ratio as the EW(H) decreases.
The evolutionary track in C&B models for a given initial in Figure 15 follows the observed relation for clusters younger than 4 Myr beyond which the model-predicted [O iii] /H ratio is much smaller than that expected from the observed relation. Consequently, H ii regions with EW(H)50 Å are not expected to have detectable levels of the [O iii] line emission. The continuity of the observed sequence in this diagram for the whole range of EW(H) suggests that the Cartwheel H ii regions are indeed ionized by clusters younger than 4 Myr, and some physical effect is responsible for lowering the observed values of EW(H) compared to that predicted in the SSP models we used. The ionization sequence in Figure 14 also implies that all our H ii regions are younger than 4 Myr. Escape of ionizing photons, presence of density-bounded H ii regions, presence of an older underlying population, are some of the physical processes that we have explored in this work to explain the decrease of EW(H) without the corresponding decrease in [O iii] /H ratio.
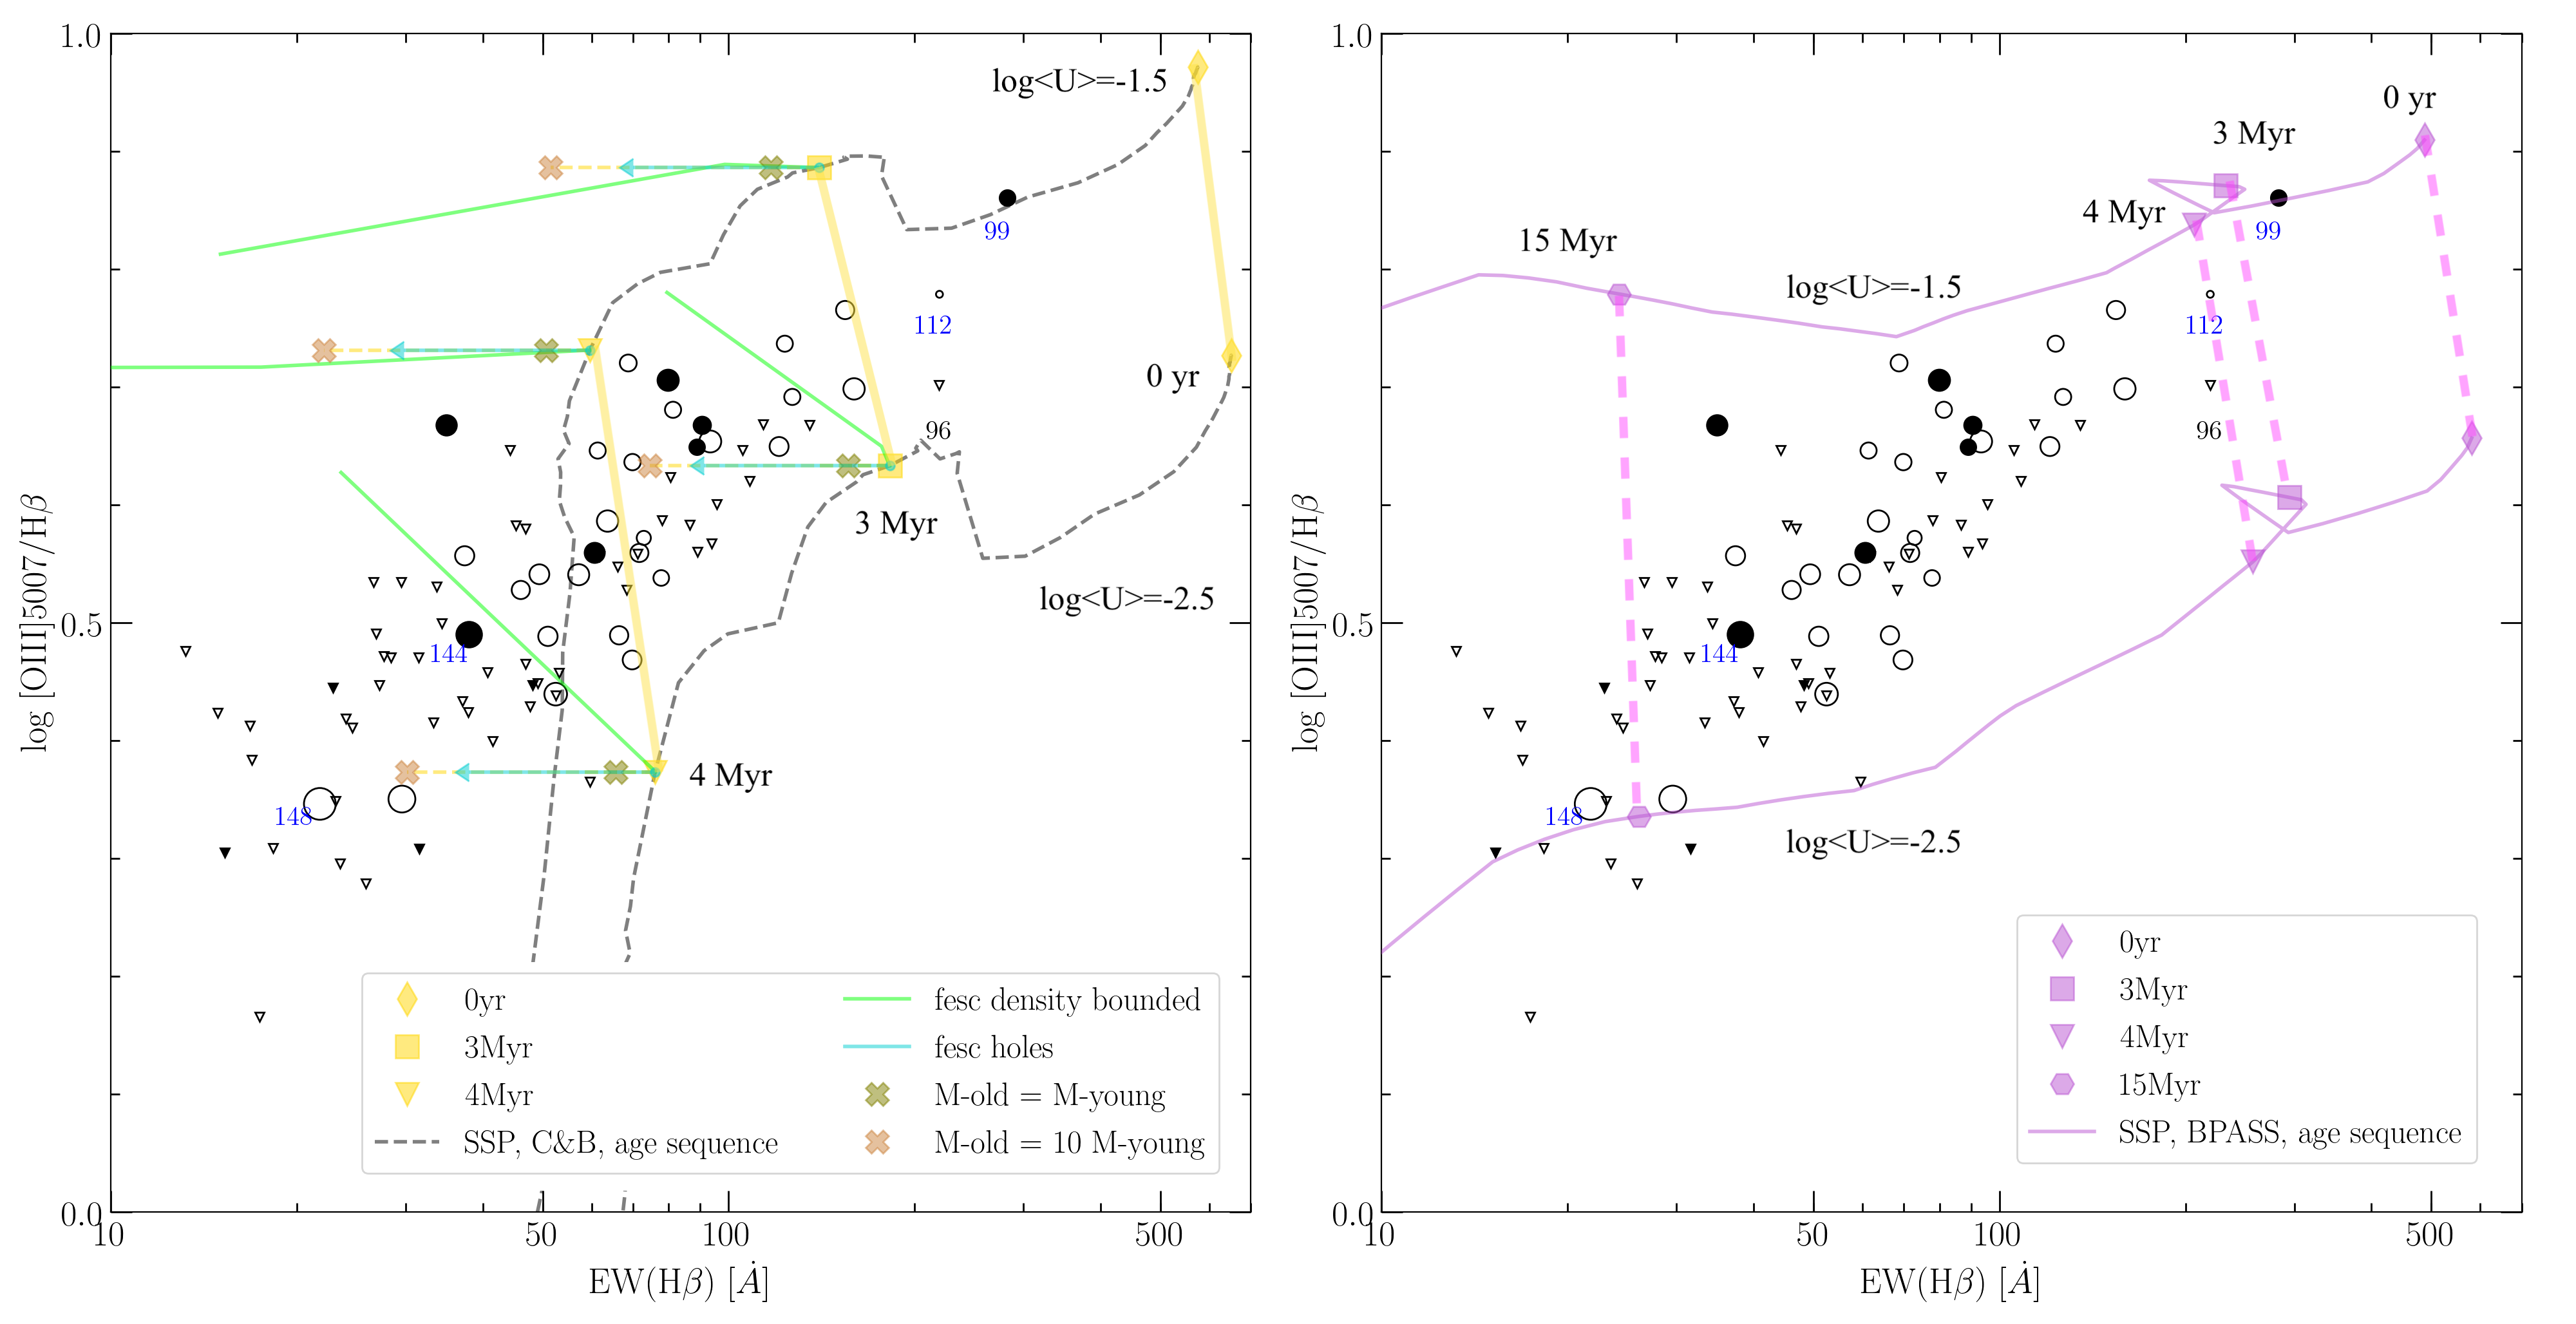
Effect of an older population: H ii regions often contain a population other than that is ionizing the surrounding gas inside the aperture used for spectral extraction(e.g. Charlot & Fall, 1993; Mayya & Prabhu, 1996). The non-ionizing population could be a cluster older than the ionizing cluster, or it could be the underlying disk population. Given the recent star formation history of the Cartwheel, it is likely that the apertures used for spectral extraction (740 pc diameter) contain non-ionizing clusters of 10 Myr or slightly older. Results from the recent numerical simulation of the wave propagation in the Cartwheel by Renaud et al. (2018) support the existence of a spread of this order in the ages of clusters in the outer ring. Multiple clusters within the extracted apertures can be directly seen in Figure 4 at the spatial resolution of the HST images. The presence of such a cluster would decrease the EW(H) without affecting the line ratios, and hence would move the points horizontally in Figure 15. The EW(H) would be affected by a larger amount for larger mass of the non-ionizing cluster. In the left panel, we show the effect of a non-ionizing cluster of 10 Myr age for two values of relative masses: (1) equal masses, and (2) the non-ionizing cluster 10 times more massive than the ionizing cluster. This effect is shown by crosses placed at 3 and 4 Myr of age for the ionizing cluster. A part of the observed horizontal spread could be due to the presence of different amounts of mass in old stellar clusters inside the apertures used for extraction.
Effect of escape of ionizing photons: We have assumed that all the ionizing photons that are emitted by the clusters are either used in the ionization, or absorbed by internal dust. However, there are 2 geometries by which ionizing photons can escape the nebula without getting absorbed by gas and dust: (1) escape through holes, and (2) escape through density-bounded zones. The former case results in the decrease of the intensity of all lines, hence a decrease in the EW(H), without changing the line ratios. Thus, the escape of ionizing photons through holes would move the points horizontally in Figure 15, producing an effect indistinguishable from the presence of a non-ionizing population discussed above. The second case is discussed below.
Density bounded models: H ii regions have an ionization structure with the lines of high ionization (e.g. [O iii] ) originating in zones closer to the ionizing cluster as compared to the lines of low ionization (e.g. [N ii]6583). In density-bounded H ii regions, the ionizing photons are lost due to insufficient amount of gas to trap all the ionizing photons. Such regions would have a reduced intensity of low-ionization lines and EW(H) as compared to the values for ionization-bounded regions. This would lead to an increase of [O iii] /H as EW(H) decreases, which is just the opposite of what is observed in Figure 15. Hence, density-bounded models cannot explain the continuation of the sequence to low EW(H). Furthermore, the observed sequence in [O iii] /[O ii] vs [O i] /[O iii] ratio is not consistent with density-bounded models.
Two-zone escape models: In order to reproduce the observed large range of [O i] /[O iii] ratios in LyC galaxies, Ramambason et al. (2020) proposed a model wherein the nebulae loose ionizing photons selectively from the high- or low- zones. Such a configuration is naturally expected if the ISM around the clusters is non-uniform, and contains dense clumps and filaments. Results for two-zone models are calculated by combining the spectrum of a high initial nebula with a second spectrum of a low initial nebula, with the relative luminosity of the H lines in the two spectra used as a free parameter. This free parameter, , varies between 0 and 1, which is defined as the fractional contribution of the high spectrum to the total H luminosity. Thus, =1 corresponds to a nebula containing only high ionization zone and =0 corresponds to a nebula containing only low ionization zone. The ionization-bounded or density-bounded status of the two zones are independent of each other. In Figure 14 (right), we show the locus of these models by red lines for three cases, all corresponding to 3 Myr age clusters with initial = and = for the high and low ionization zones, respectively. The 3 cases are: (1) both the zones are ionization-bounded (solid line), (2) combination of an ionization-bounded low zone, with a density bounded high zone with an escape fraction, percent (dashed line), and (3) combination of an ionization-bounded high zone, with a density bounded low zone with percent (dotted line). Values for the free parameters are chosen that best illustrate the observed trends in Figure 14 (right). C&B ionization-bounded models (yellow lines) even for the youngest age lie slightly to the left of the observed points in this figure. The tracks for ages of 3 and 4 Myr are further away from the observed points. On the other hand, the two zone escape models are able to explain the dataset for cluster ages of 3 Myr — most of the observed points lie between the dashed red lines (3 Myr track with selective escape of ionization photons from high zone) and the yellow line for the 3 Myr track (ionization bounded regions without any escape). Thus, with two-zone models, it is possible to obtain consistent ages of 3–4 Myr for the majority of the H ii regions in the Cartwheel, from both the diagnostic diagrams in Figure 14.
Shocks: Some of the H ii regions, though principally photoionized by the stars, can also experience shocks, especially during the post-main sequence evolution and the death of massive stars. In order to illustrate the effect of shocks in the line ratio diagrams, shock models of Alarie & Morisset (2019) are added to the evolutionary track of SSP models at one particular epoch (4 Myr) with . The shocks are parametrized by 3 parameters: the percentage of energy in shocks compared to photoionization energy to ionize hydrogen, the velocity of the shock and the shock age. We used their grid of truncated shock models. We here plot models where 25 percent of the total H flux is provided through shocks for various values of shock velocities. At each velocity, we plot the ratios as the shock propagates into the ISM. Increasing the shock velocity increases the line ratios involving high ionization, whereas the low ionization lines become stronger as the shock propagates. The effect of shocks on the line ratios can be best seen in the [O iii] /[O ii] vs. [O i] /[O iii] diagram of Figure 14 (top right panel). High velocity shocks tend to move the points to the right, mostly occupied by H ii regions not showing He ii line. Among the regions with He ii emission, shocks could be important in low-ionization H ii regions such as #148. On the other hand, shocks have very little effect in the [O iii] /H vs [N ii] /H plot (top left panel), and no effect on the EW(H).
Cluster evolution with binaries: We now discuss the effect of binary population on the results obtained from C&B models. For this purpose, we use the BPASS binary models plotted in the bottom panels of Figures 14, and right panel of Figure 15. The result that the observed sequence of points is a sequence in holds even after including binary stars in the SSPs. Star clusters containing binary stars produce the ionizing photons over an extended period of time (15 Myr) as compared to the evolution without binaries. This causes both the [O iii] /H and the EW(H) to decrease more slowly with evolution as compared to the evolution of clusters without binary stars. The evolutionary locus and sequences in binary models are almost parallel in Figure 15, both following the ionization sequences seen in these diagrams. Thus, under the binary models, Cartwheel H ii regions could have an age range between 0 and 15 Myr and range between to . However, at ages as late as 15 Myr, the EW(He ii ) decreases by more than an order of magnitude (see Figure 5). Hence, it is highly unlikely that the He ii detections correspond to the faint late phase, rather than the luminous early phase.
Thus, the inclusion of binary models does not qualitatively change the conclusions arrived from using C&B models, which do not take into account the possible presence of binary stars.
4.3 On the ionization state of Cartwheel H ii regions
The observed range of line ratios in the H ii regions of the Cartwheel corresponds to photoionization by young clusters (age3–4 Myr in C&B models or 3–15 Myr in BPASS binary models) with initial H ii-averaged ionization parameter lying between to . The [O iii] /H ratio, which is a direct measure of the degree of ionization of an H ii region, is correlated with EW(H) over the entire observed range of both the quantities. This correlation suggests a systematic decrease of the [O iii] /H ratio, or equivalently , with age. For the ionization-bounded models that we have used, decreases only by 0.6 dex or alternatively [O iii] /H by 0.2 dex in 4 Myr in C&B SSP models and 0.1 dex in 15 Myr in BPASS binary SSP models. The amount of change of this ratio in SSP models depends on the metallicity, with the values in our models being consistent with the values obtained by Stasinska & Leitherer (1996) for the Cartwheel metallicity. Thus, an age-dependent process of softening of is required in order to interpret the observed correlation between [O iii] /H and EW(H) primarily as an age sequence.
Kim, Kim & Ostriker (2019) found that the fraction of the escape of the ionizing photons systematically increases with age of the cluster due to the increased amount of feedback with age. The escape of ionizing photons has been long suspected to be one of the reasons for the low EW(H) of H ii regions (e.g. Mayya & Prabhu, 1996). Castellanos, Diáz & Tenorio-Tagle (2002) determined escape fraction between 0.1–0.7 for three H ii regions they analysed. The mechanical energy feedback to the ambient ISM can also decrease due to the decrease in the density following the feedback-driven expansion of the H ii regions. Martín-Manjón et al. (2010) found that this effect can decrease by as much as 3 dex at the Cartwheel metallicity. All these suggest that the evolution-dependent feedback is driving the observed correlation through the escape of ionizing photons and the decrease in the ISM density. Thus, statistically, the high excitation regions are systematically younger than the low excitation regions.
We also investigated the effect of radiative shocks in H ii regions primarily photoionized by clusters as described in Sec. 4.2 above. High velocity shocks tend to increase the line ratios involving low ionization ions such as the [O i] line (e.g. Stasinska et al., 2015), which would move the points to the right of the ionization sequence in the right panels of Figure 14. A tendency of broadening of the sequence in this diagram for low-ionization H ii regions is seen, suggesting a possible presence of shocks in some low , which are relatively older, H ii regions.
4.4 The ionizing source of He+ in the Cartwheel H ii regions
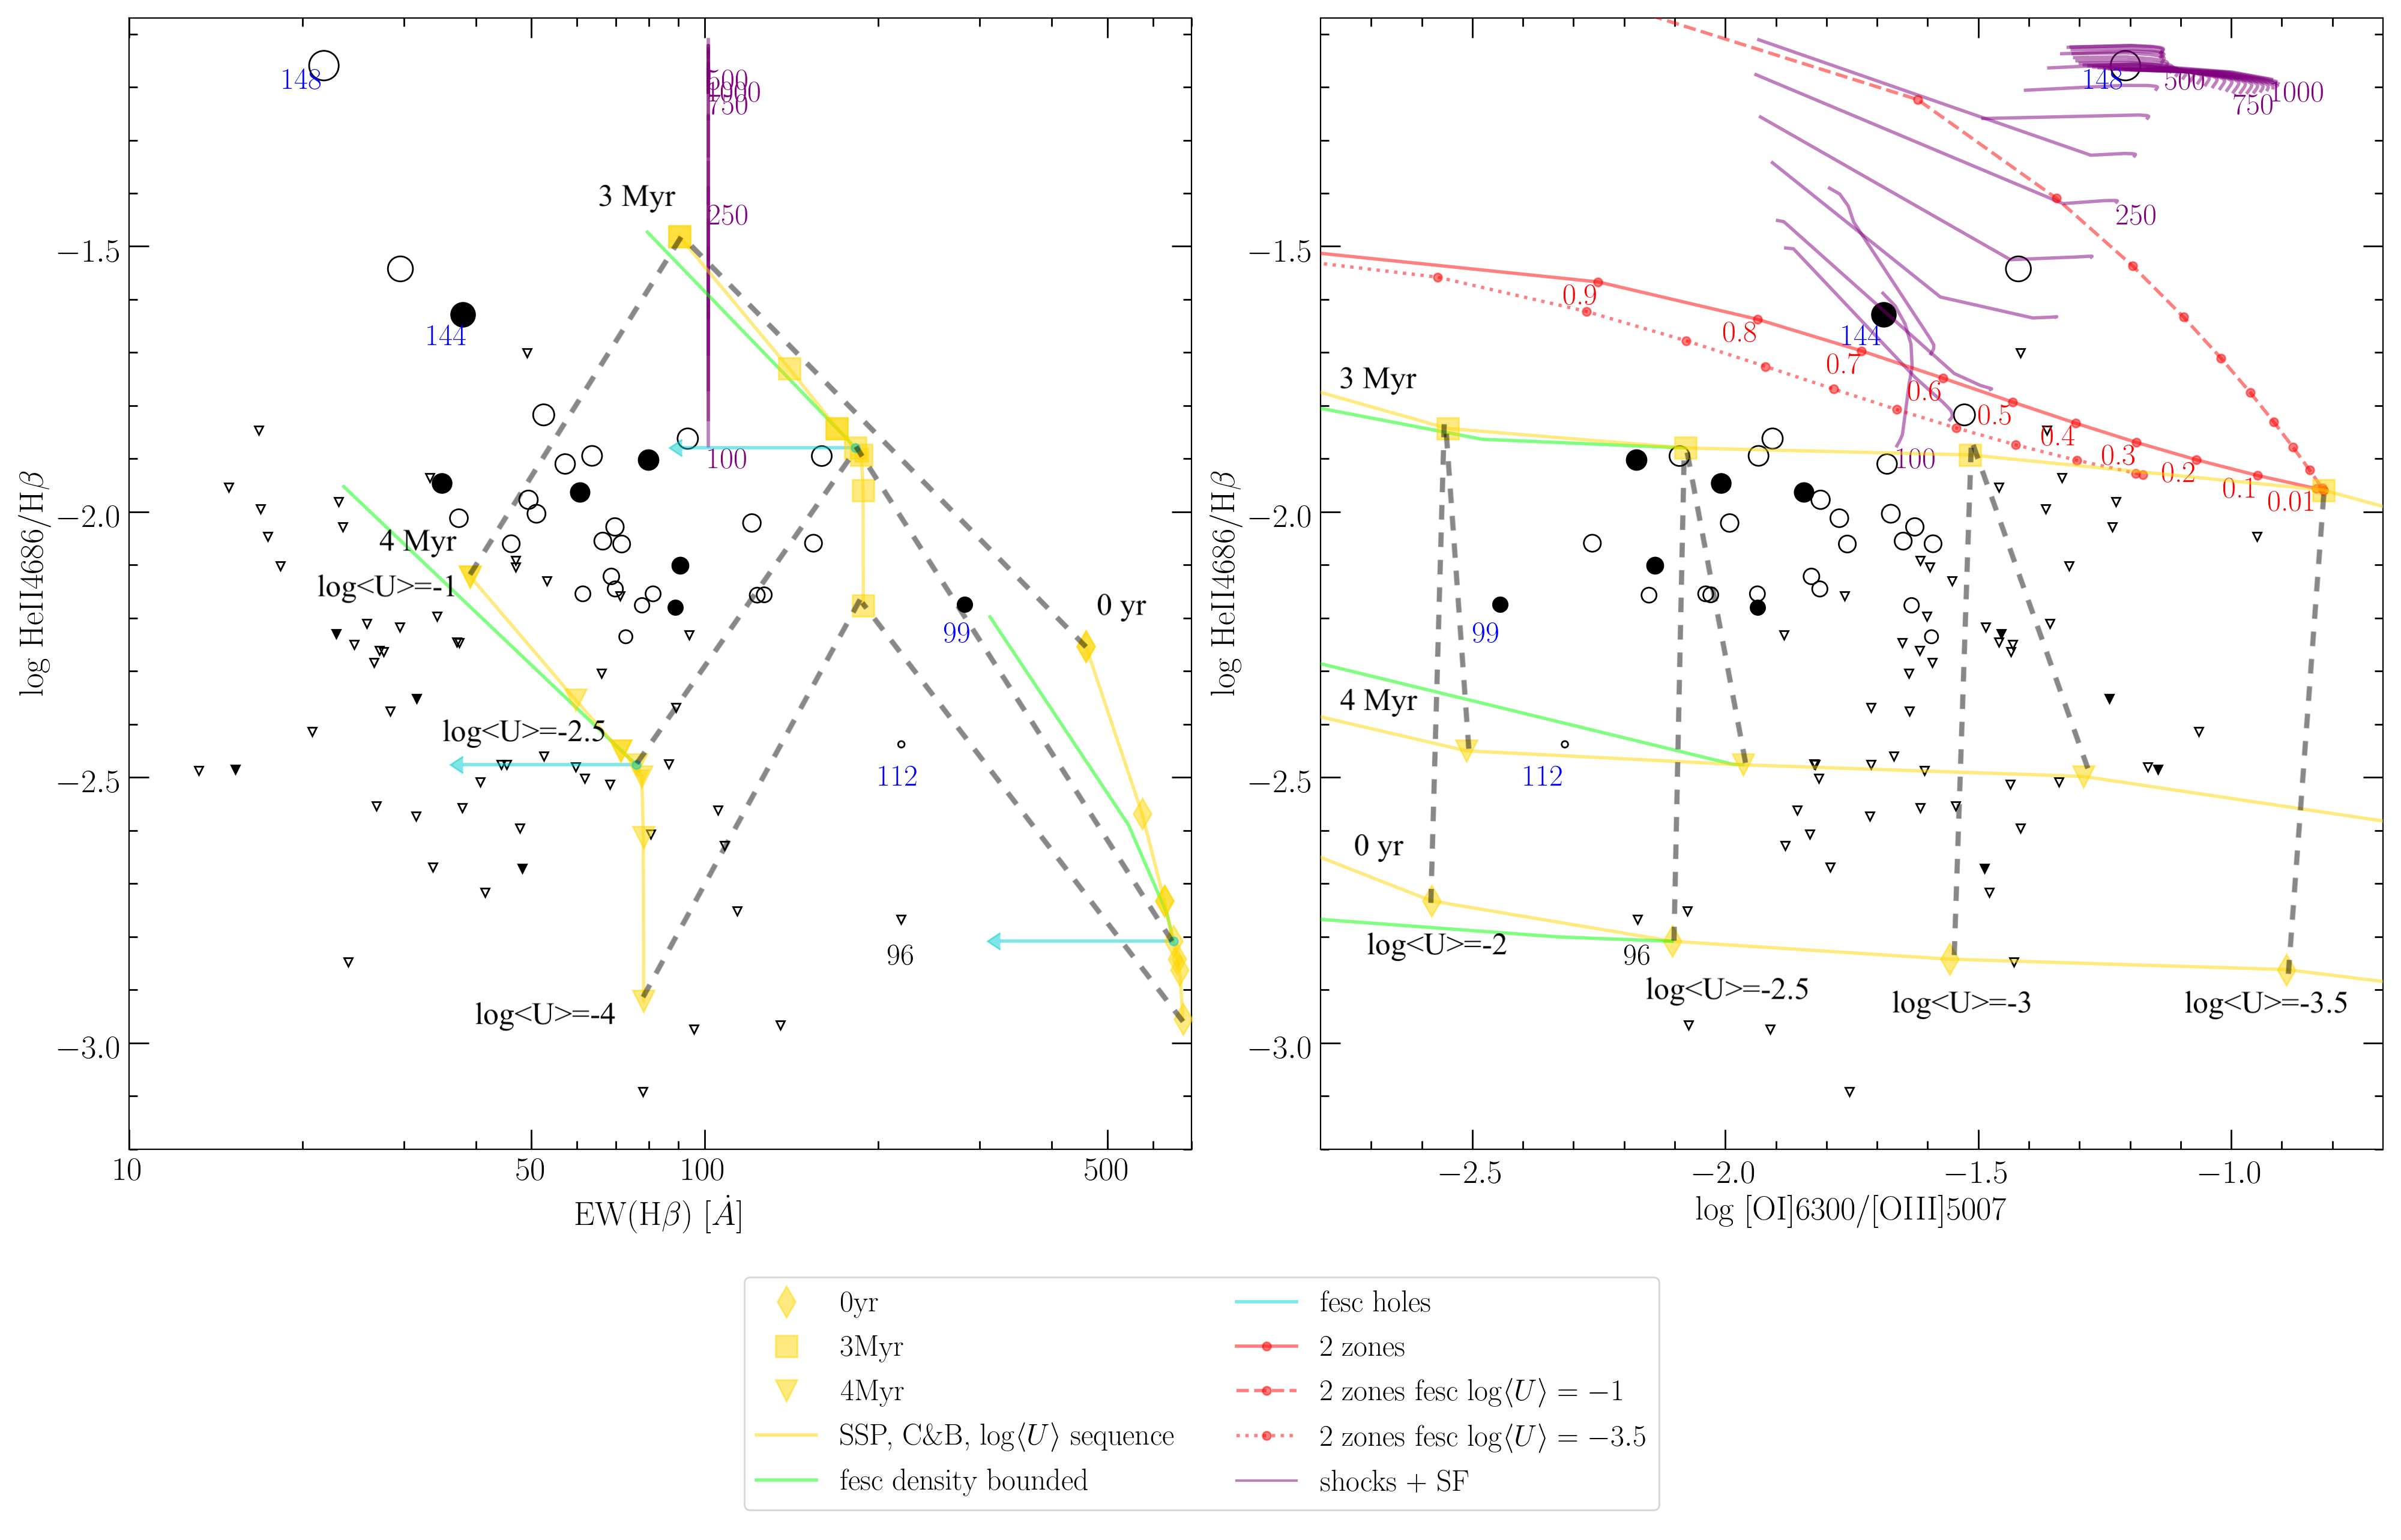
Having addressed the ionization mechanism and physical processes prevalent in the Cartwheel H ii regions, we now investigate whether the same physical mechanisms account for the observed He ii /H ratio. We have chosen two plots to verify this: He ii /H vs EW(H) and He ii /H vs [O i] /[O iii] . These are shown in Figure 16 for the chosen theoretical tracks from C&B models, along with special scenarios discussed in the paragraphs above. We do not show the plots with BPASS binary models, as the He ii /H ratios produced by these models are systematically lower than the observed values as illustrated in Figure 6.
4.4.1 He++ nebulae photoionized by WR stars
The majority of He ii -emitting regions fall between the tracks corresponding to ionization-bounded H ii regions photoionized by clusters of age between 3 and 4 Myr. This age range corresponds to the WR-phase in C&B models, as can be inferred from Figure 6.
Escape of ionizing photons through holes, and/or the presence of non-ionizing population: The values inferred for each region using the He ii /H vs EW(H) are systematically higher by around 1 dex as compared to that inferred from the He ii /H vs [O i] /[O iii] plot. This can be explained as due to the escape of ionizing photons through holes, and/or the presence of a spatially close older cluster in majority of the Cartwheel H ii regions, both of which displace the tracks horizontally without changing the flux ratios of the nebular lines. This inference is consistent with the observed correlation between [O iii] /H ratio and EW(H).
Is the ionization by WR stars the only way to explain all the observed line ratios. Is the source of ionization of He+ the same as that of other ions? In order to address these questions, we here summarize the results from other scenarios that we have explored.
Density-bounded models: The loci of density-bounded H ii regions in the line ratio diagrams are shown by green solid lines in the two panels of Figure 16 for C&B models of initial =. The length of the plotted lines correspond to 50 percent of the ionizing photons escaping the nebula from the density bounded zones. The locations of the observed points, with the exception of regions #144, #17 and #148, can be reconciled with this scenario, but for a lower initial value, as compared to the ionization-bounded case. However, the observed ionization sequences (see Figure 15) are not consistent with a low value of . Thus, we rule out the possibility that the majority of the Cartwheel H ii regions are density-bounded with a low initial .
Role of radiative shocks and two-zone escape models: In Figure 16, the radiative shocks and two-zone escape models are plotted for a 3 Myr old ionizing cluster in the right panel, with the aim of covering the observed ratios of regions #144, #17 and #148. It can be inferred from the plot that these scenarios, especially with escape from high zone (dashed red line) would cover the observed range of values for the majority of the regions if the ionizing cluster is 4 Myr old. In fact, we have considered such a possibility to explain the behaviour of points in the right panel of Figure 16. However, these scenarios produce higher than the observed values of [Ar iv] /[Ar iii] line ratio, as will be discussed later in this section. Thus, we do not find it necessary to look beyond the WR stars to explain the observed He++ nebulae. In summary, the majority of the He++ nebulae in the Cartwheel are photoionized by WR stars, with the H ii regions enclosing the He++ nebulae. Different observed quantities can be consistently explained with 50 percent of the hydrogen ionizing photons escaping through holes, and/or the presence of older non-ionizing populations inside the aperture used for extraction.
4.4.2 He++ nebulae requiring alternative sources of ionization
Exceptions to the above scenario are five H ii regions that standout from the main group. Two (#99 & #112) are at the high-EW(H) end, and the other three (#144, #17 & #148) are among the lowest EW(H) H ii regions.
Ionization by ULX source and stripped binary stars: The two high-EW(H) regions also have the highest [O iii] /H ratio and the lowest [O i] /[O iii] ratio, all indicating that these regions have the highest ionization parameter, and the youngest of the sample regions. We infer 2.0 and an age corresponding to the pre-WR phase, suggesting that the hot main-sequence stars are the most likely sources of He+ ionization in these two sources.
Region #99 is the brightest, and the most massive H ii region in the Cartwheel with an estimated number of more than 11,000 O stars, assuming O stars are the sole sources of ionization of hydrogen. This region is associated with an ULX source, and hence we discuss here the possible role of this ULX source in the ionization of He+. The observed [O iii] /H is high enough as expected for the ionization by the hard radiation from a ULX source. However, the observed [O i] /H ratio for this regions is significantly lower than that expected for the ionization by a ULX source (Gúrpide et al., 2022), and hence ULX cannot be the sole or principal source of ionization of this region. The line ratio diagrams presented suggest that the photoionization by the main-sequence stars is a viable source of ionization. The ULX may provide additional photons for the ionization of He+. The observed EW(H), which in spite of being the highest among the sample regions, is still more than a factor of two lower than that expected for single burst of age3 Myr, suggests the presence of underlying non-ionizing populations. It is likely that the star formation in the region is proceeding for more than 3 Myr or that it had a star formation event in the recent past. These slightly evolved stars had enough time to form HMXBs that are generating the X-rays emitted by the ULX source (Plat et al., 2019).
Region #112 has the lowest value of He ii /H among the regions studied here, with a value intermediate between that of main-sequence and WR phases. Like in the case of #99, all line ratio diagrams presented here suggest ionization of He+ by main sequence stars.
Regions affected by radiative shocks and/or two-zone escape models: We now discuss the ionization mechanism of He+ in regions #148, #17 and #144, the three low-EW(H) regions with the highest ratio of He ii /H. These three regions are at the low end of the ionization sequence. The He ii /H ratios predicted by the traditional ionization-bounded case and photoionized by stellar radiation are much lower at these low values as compared to the observed values for these three regions. Two of the various processes we have explored produce the observed high He ii /H ratios at low values. These are (1) radiative shock contribution, and (2) two-zone escape models with 50 percent escape from the high zone. Regions #144, #17 and #148, in that order, lie on a sequence of increasing shock velocities with shock velocities in the 100–1000 km s-1 range, with the He ii /H value of #148 only produced by shock models. The two-zone escape models can also explain their location in the plots. Their low EW(H) and low suggest that these three regions are more evolved than the rest of the regions, and are likely to be in the post-WR phase. We hence favour shock ionization associated with SN explosions as the most likely causes of the observed high values of He ii /H ratio. SN explosions can also create escape routes for ionizing photons from the high zone, and hence shocks and two-zone escape scenarios could be co-existing. Region #144 is associated with a ULX source whose X-ray luminosity is high enough to contribute to He+ ionization. Thus, X-ray ionization could also be prevalent in #144.
Stasinska et al. (2015) has advocated the use of the [Ar iv] /[Ar iii] ratios to test the hardness of the ionizing spectrum, especially for the He ii -emitting regions. Ar++ has an ionization potential of 40.7 ev and hence the collisionally excited [Ar iv] lines are expected to be present in He ii -emitting regions. The [Ar iv]4711,4740 doublet is relatively faint. Nevertheless, the doublet is detected at more than 3 levels in 14 of the 32 He ii -emitting regions. In Figure 17, we plot the [O iii] /[O ii] ratios against the [Ar iv] /[Ar iii] line ratio. For photoionized nebulae, the locus of points in this diagram is mainly governed by , with the observed points lying between . Spectral evolution in the age range 0–4 Myr introduces small spread in the direction perpendicular to the sequence formed by ranges of initial . On the other hand, the presence of radiative shocks and/or selective escape of photons from low or high zones moves the points to the right (i.e. higher [Ar iv] /[Ar iii] ratios). Thus, this figure is useful to discriminate the purely photoionized models from the photoionized+shock models, or the models involving selective escape of photons. Unfortunately the last two cases follow similar trajectories in the diagram, and hence cannot be distinguished.
The main-group of the He ii -emitting regions in which [Ar iv] lines have been detected lie along the photoionization sequence by the SSP models, and more importantly, are not consistent with the presence of shocks and/or two-zone escape scenarios, independent of the age of the ionizing clusters. Thus, this diagram helps us to break the degeneracy seen in Figure 16. Region #99 lies clearly to the right of the photoionization sequence, reiterating that the hard radiation from the ULX source plays a role in the ionization of ions that have higher than 40 eV of ionization potential. The second region in which we cannot rule out ionization by the ULX source is #144. The [Ar iv] lines are not detected in this region, but the upper limit on the [Ar iv] /[Ar iii] ratio is slightly to the right of the photoionization sequence by the SSP models. Unfortunately, we have only upper limits on the detection of the [Ar iv] lines in the remaining two interesting regions #148 and #17. The observed upper limits in #148 and #17 are consistent with the presence of shocks and/or two-zone escape scenarios.
4.5 Regions with non-detection of He ii 4686 line
We here carry out an analysis on the nature of the H ii regions where the He ii line could not be detected at the 3- confidence level. Given that the WR stars are the principal sources of He+ ionizing photons in our sample regions, and that the WR stars appear only for a short duration in an SSP, this fraction is expected to be a function of age. The EW(H) is an excellent proxy for age in young stellar systems (see Figures 5), and hence we analyse the detection fraction as a function of EW(H). From the analysis of Figures 15 and 16, we arrived at the conclusion that quantitatively the observed values of EW(H) are systematically smaller as compared to the values expected for ionization-bounded H ii regions using C&B models. Continuum contribution from a non-ionizing population and the escape of ionizing photons from the nebula are two principal mechanisms that lead to a decrease in EW(H) from those expected for ionization-bounded H ii regions ionized by a single-age population. The factor by which the EW(H) is reduced may vary from region to region. For the sake of using EW(H) as a proxy for age, we assume a reduction factor anywhere between 0 and 50% for the sample regions.
In Figure 18, we show the fraction of H ii regions detected as a function of the observed EW(H). The theoretically expected range of EW(H) during the WR phase is shown by the shaded area, which takes into account the reduction of EW(H) by 0 to 50% during the WR phase. The distribution of observed EW(H) for the whole sample (dotted histogram), and the sample of regions where we have achieved a 3- sensitivity to detect the He ii line if they had He ii /H0.01 (dashed histogram), are shown. For the whole sample (black line), the detection fraction decreases with decreasing EW(H). For the subset of H ii regions (red line) that have SNRs sufficient to detect the He ii line for typical values during WR phase (He ii /H0.01), the detection fraction peaks at EW(H)60 Å. The peak value reaches as high as 90%. The EW(H) at the peak value corresponds to that during the WR phase. This suggests that our dataset is sensitive enough to detect almost all (90%) He++ nebulae ionized by the WR stars. Before the onset of the WR phase (at the high EW(H)-end), the detection fraction is nonzero. The He ii line is detected in two of the three H ii regions, indicating that the He ii /H ratio might be higher than the values predicted in the current SSPs during the main sequence phase of stars. The ULX is the likely source of additional ionization in one of these (#99), whereas stripped binary stars, which are not included in the C&B models, could be the possible source of the weak ionization in the other (#112).
The rest of the non-detections (26) corresponds to low-EW(H) regions. In the C&B models, these regions correspond to the post-WR phase. However, the inclusion of the binary channel for the formation of WR stars in the BPASS models extends the duration of WR phase to these low EW(H) values, with the expected ratio of He ii /H lower than that during the WR phase in C&B models. Unfortunately, we do not reach the sensitivity to detect the He ii line with He ii /H0.01 for regions with EW(H) Å regions, and hence the non-detection of the He ii line could be due to the absence of He++ ions in these regions, or that we do not reach the sensitivity level required to detect weak ionization from the WR stars formed through the binary channel.
In general, the H ii regions with He ii -line detection have higher ionization parameter as compared to the H ii regions without the He ii -line detection, at each EW(H) bin.
The location of H ii regions with non-detection of He ii line in Figure 17 suggests shock and/or two-zone escape scenarios are more prevalent in these regions as compared to the He ii -emitting main-group H ii regions. These processes are strong enough to increase the He ii lines above the detectable limits in only three cases (#144, #17 and #148).
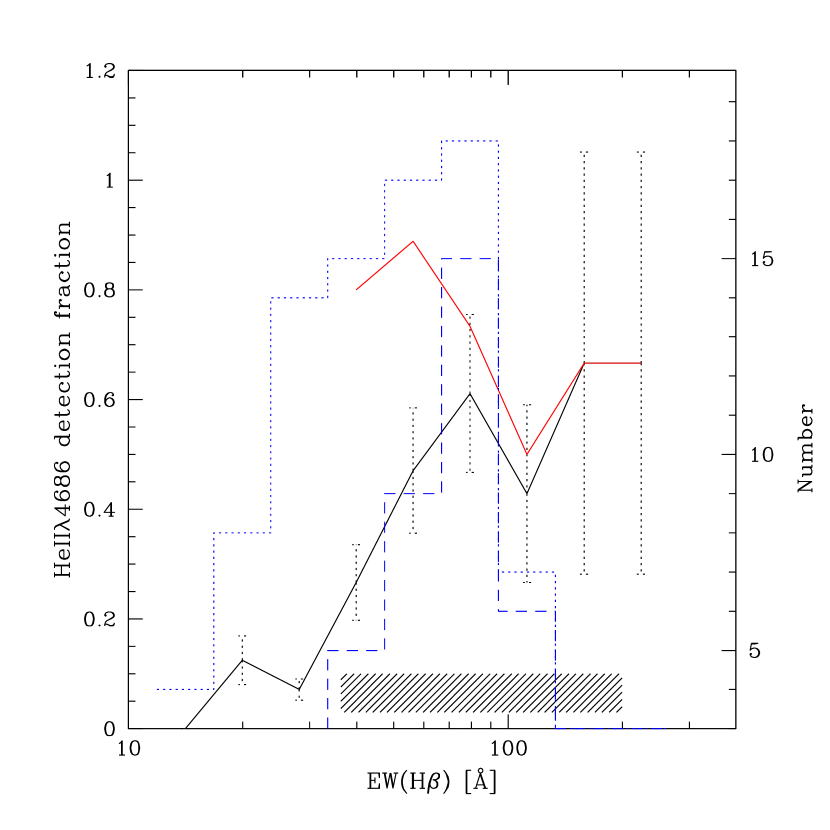
5 Conclusions
We have carried out a search for He ii nebular line in the Cartwheel H ii regions using the VLT/MUSE datacube. We detect the He ii line in 32 H ii regions, with a mean value of He ii /H=0.0100.003. All the detections are situated in the star-forming ring of the Cartwheel, with ten of these sources coinciding with the location of a ULX source. We use commonly used diagnostic line ratios to compare the ionization properties of H ii regions with and without the detection of the He ii line. The He ii line-emitting regions with and without the ULX sources, in general, show similar ionization properties in the diagnostic diagrams. Hence, the ULX sources are not the principal suppliers of ionizing photons in all the H ii regions containing ULX sources. Analysis of the diagnostic diagrams using C&B SSPs suggests that the majority (27) of the detections correspond to H ii regions in their WR phase, with two and three detections corresponding to H ii regions in their pre-WR and post-WR phases, respectively. However, the characteristic BB indicating the presence of WR stars is not detected in our sample regions. We illustrate that this non-detection is due to the relatively low EWs of the BB in SSPs for IMFs with 100 M⊙ at the metallicity of the Cartwheel, even when the SSPs have sufficient number of WR stars to provide the ionization of He+. We suggest that main sequence stars are the major contributors to ionization in the two pre-WR H ii regions, with an additional contribution from other hard sources. In region#99, this additional contribution most likely comes from the ULX source. On the other hand, the three H ii regions in the post-WR phase may be either ionized by radiative shocks or their H ii regions are leaky. We find a correlation between [O iii] /H and EW(H), which requires a more rapid softening of the ionization parameter than that considered in C&B SSP models. This rapid softening can be naturally explained if the H ii regions expand as the cluster evolves due to the feedback from massive stars. The detection frequency of the He ii line reaches values as high as 90% for H ii regions that have EW(H)=40–70 Å. These values of EW(H) correspond to late stages of the WR phase in the C&B models. Our dataset lacks sensitivity to detect the He ii line from H ii regions with EW(H)40 Å, when WR stars formed from the binary channel are expected to dominate the ionization of He+.
Acknowledgements
We thank an anonymous referee for many thoughtful comments that improved the paper. We also thank Gerardo Ramos-Larios who helped us in preparing the images appearing in Figures 1 and 4, and CONACyT for the research grant CB-A1-S-25070 (YDM). This work is based on data obtained from the ESO Science Archive Facility, program ID: 60.A-9333. Observations made with the NASA/ESA Hubble Space Telescope were obtained from the data archive at the Space Telescope Science Institute. STScI is operated by the Association of Universities for Research in Astronomy, Inc. under NASA contract NAS 5-26555.
Data availability
The fluxes of principal emission lines used in this work are available in the article and in its online supplementary material. The reduced fits files on which these data are based will be shared on reasonable request to the first author. The ESO datacubes are in the public domain. The link and observation ID are available in the article.
References
- Alarie & Morisset (2019) Alarie A., Morisset C. 2019, RMxAA, 55, 377
- Appleton & Struck-Marcel (1996) Appleton, P. N. & Struck-Marcel, C. 2010, Fundamentals Cosmic Phys., 16, 111
- Baldwin, Phillips, & Terlevich (1981) Baldwin J. A., Phillips M. M., Terlevich R. 1981, PASP, 93, 5
- Bacon et al. (2010) Bacon, R. et al. 2010, Proc. SPIE, 7735, 773508
- Belfiore et al. (2022) Belfiore, F., Sontoro, F., Groves, B. et al. 2022, A&A, 659, 26
- Bottorff et al. (1998) Bottorff M., Lamothe J., Momjian E., Verner E., Vinković D., Ferland G., 1998, PASP, 110, 1040
- Bressan et al. (2012) Bressan, A., Marigo, P., Girardi, L. et al. 2012, MNRAS, 427, 127
- Bruzual & Charlot (2003) Bruzual, A. G., Charlot, S. 2003, MNRAS, 344, 1000
- Castellanos, Diáz & Tenorio-Tagle (2002) Castellanos, M., Diáz, A. I., Tenorio-Tagle, G. 2002, ApJ, 579, L79
- Chabrier (2003) Chabrier, G. 2003, PASP, 115, 763
- Charlot & Fall (1993) Charlot S., Fall S. M. 1993, ApJ, 415, 580
- Chen et al. (2015) Chen, Y., Bressan, A., Girardi, L., et al. 2015, MNRAS 452, 1068
- Crowther (2007) Crowther, P. A. 2007, ARA&A, 45, 177
- Eldridge et al. (2017) Eldridge, J. J., Stanway, E. R., Xiao, L. et al. 2017, PASA, 34, e058
- Erb et al. (2010) Erb, D. K., Pettini M., Shapley A. E., Steidel C. C.. Law D. R., Reddy N. A., 2010, ApJ, 719, 2
- Feltre, Charlot, & Gutkin (2016) Feltre A., Charlot S., Gutkin J. 2016, MNRAS, 456, 3354
- Ferland et al. (2017) Ferland G. J., Chatzikos M., Guzmán F., et al. 2017, RMxAA, 53, 385
- Fosbury & Hawarden (1977) Fosbury, R. A. E. & Hawarden, T. G. 1977, MNRAS, 178, 473
- Gao et al. (2003) Gao, Yu, Wang, Q. Daniel, Appleton, P. N. & Lucas, Ray A. 2003, ApJ, 596, L171
- Gil de Paz et al. (2018) Gil de Paz, A., Carrasco, E., Gallego, J. et al. 2018, SPIE, 1070217, SPIE10702
- Götberg et al. (2018) Götberg Y., de Mink S. E., Groh J. H., Kupfer T., Crowther P. A., Zapartas E., Renzo M. 2018, A&A, 615, A78.
- Gómez-González et al. (2020) Gómez-González, V.M.A., et al. 2020, MNRAS, 493, 3879
- Gómez-González et al. (2021) Gómez-González, V.M.A., et al. 2021, MNRAS, 500, 2076
- Gúrpide et al. (2022) Gúrpide A., Parra M., Godet O., Contini T., Olive J.-F., 2022, A&A, 666, A100
- Gutkin et al. (2016) Gutkin J., Charlot S. & Bruzual, G. 2016, MNRAS, 462, 1757
- Higdon (1995) Higdon, J. L. 1995, ApJ, 455, 524
- Kehrig et al. (2015) Kehrig, C., Vílchez, J. M., Pérez-Montero, E. et al. 2015, ApJ, 80, L28
- Kehrig et al. (2018) Kehrig, C., Vílchez, J. M., Guerrero, M. A. et al. 2018, MNRAS, 480, 1081
- Kim, Kim & Ostriker (2019) Kim, Jeong-Gyu, Kim, Woong-Tae, Ostriker, Eve C. 2019, ApJ, 883, 102
- López-Sánchez & Esteban (2010) López-Sánchez Á. R., Esteban C. 2010, A&A, 516, A104
- Lynds & Toomre (1976) Lynds, R. & Toomre, A. 1976, ApJ, 209, 382
- Marcum, Appleton & Higdon (1992) Marcum, P.M, Appleton, P.N, & Higdon, J. L. 1992, ApJ, 399, 57
- Martín-Manjón et al. (2010) Martín-Manjón, M. L., García-Vargas, M. L., Mollá, M., Díaz, A. I. 2010, MNRAS, 403, 2012
- Mapelli et al. (2010) Mapelli, M., Ripamonti, E., Zampieri, L., Colpi, M. & Bressan, A. 2010, MNRAS, 408, 234
- Mayya & Prabhu (1996) Mayya Y. D., Prabhu T. P. 1996, AJ, 111, 1252
- Mayya et al. (2020) Mayya, Y. D., Carrasco, E., Gómez-González, V. M. A. et al. 2020, MNRAS, 498, 1496
- Osterbrock & Ferland (2006) Osterbrock, D. E. & Ferland, G. J. 2006, in Astrophysics of Gaseous Nebulae and Active Galactic Nuclei (CA: University Science Books)
- Pérez-Montero (2017) Pérez-Montero, E. 2017, PASP, 129, 043001
- Plat et al. (2019) Plat, A., Charlot, S., Bruzual, G., et al. 2019, MNRAS, 490, 978
- Ramambason et al. (2020) Ramambason L., Schaerer D., Stasińska G., et al., 2020, A&A, 644, A21
- Renaud et al. (2018) Renaud F., Athanassoula E., Amram P., et al. 2018, MNRAS, 473, 585
- Schaerer (1996) Schaerer, D., 1996, ApJ, 467, L17
- Schaerer, Fragos & Izotov (2019) Schaerer D., Fragos T., Izotov Y. I., 2019 A&A, 622, L10
- Shirazi & Brinchmann (2012) Shirazi, M. & Brinchmann, J. 2012, MNRAS, 421, 1043
- Stasinska & Leitherer (1996) Stasińska G., Leitherer, C. 1996, ApJSS, 107, 661
- Stasinska et al. (2015) Stasińska G., Izotov Yu., Morisset, C., Guseva, N. 2015, A&A, 576, A83
- Stanway & Eldridge (2018) Stanway E. R., Eldridge J. J. 2018, MNRAS, 479, 75
- Struck (2010) Struck, C. 2010 MNRAS, 403, 1516
- Todt et al. (2015) Todt, H., Sander, A., Hainich, R. et al. 2015, A&A, 579, A75
- Tresse et al. (1999) Tresse, L., Maddox, S., Loveday, J. & Singleton, C. 1999, MNRAS, 310, 262
- Wolter & Trinchieri (2004) Wolter, A. & Trinchieri, G. 2004, A&A, 426, 787
- Wolter, Fruscione & Mapelli (2018) Wolter, A., Fruscione, A. & Mapelli, M. 2018, ApJ, 863, 43
- Zaragoza-Cardiel et al. (2022) Zaragoza-Cardiel J., Gómez-González V. M. A., Mayya D., Ramos-Larios G., 2022, MNRAS, 514, 1689