Seamless Multimodal Biometrics for Continuous Personalised Wellbeing Monitoring
Doctoral Programme in Electrical and Computer Engineering
Supervisor: Professor Jaime dos Santos Cardoso
Co-Supervisor: Professor Miguel Velhote Correia
Approved in public examination by the Jury:
President: Professor Luís Miguel Pinho de Almeida
Referee: Professor Hugo Filipe Silveira Gamboa
Referee: Professor Armando José Formoso de Pinho
Referee: Professor Jaime dos Santos Cardoso
Referee: Professor Ana Maria Rodrigues de Sousa Faria de Mendonça
Referee: Professor Luís Filipe Pinto de Almeida Teixeira
December 21, 2022
Resumo
A perceção através da inteligência artificial está cada vez mais presente nas nossas vidas. Os veículos não são exceção, uma vez que sistemas avançados de assistência ao condutor auxiliam no cumprimento de limites de velocidade, na manutenção dentro das faixas e na prevenção de acidentes. Num futuro próximo, o reconhecimento de padrões terá um paper ainda mais preponderante nos veículos, uma vez que o automóvel autónomo necessitará de meios automáticos para compreender o que acontece ao seu redor (e no seu interior) para agir de forma adequada.
Em reconhecimento de padrões, a biometria oferece aplicações promissoras para veículos, do acesso keyless à personalização automática de opções de condução com base no condutor reconhecido. De igual modo, as tecnologias de reconhecimento de bem-estar têm atraído atenção pela possibilidade de reconhecer atividade, emoções, sonolência ou stress em condutores e passageiros. No entanto, estes dois tópicos são diametralmente opostos, uma vez que o reconhecimento de bem-estar usa a variabilidade intra-sujeito, enquanto a biometria se baseia na variabilidade inter-sujeito.
Apesar das diferenças, a biometria e o reconhecimento de bem-estar poderiam (e deveriam) co-existir. O reconhecimento contínuo de identidade em dados adquiridos de forma impercetível poderiam ser usados para personalizar modelos de reconhecimento de bem-estar e obter melhor desempenho. Estes modelos personalizados poderiam ser a chave para meios mais robustos de monitorizar sonolência e atenção em condutores e evitar acidentes. Num sentido mais amplo, estes poderiam ser aplicados a todos os ocupantes, abrindo o caminho em direção ao reconhecimento eficaz de atividade, emoções, conforto e até episódios de violência em veículos autónomos partilhados.
Este doutoramento focou-se em avançar o tópico de perceção em veículos através do estudo de novas metodologias de visão computacional e reconhecimento de padrões para biometria e reconhecimento de bem-estar. O foco principal foi na biometria com electrocardiograma (ECG), um traço reconhecido pelo seu potencial em monitorização impercetível de condutores. Esforços foram dedicados à obtenção de desempenho melhorado em identificação e verificação de identidade em cenários off-the-person, reconhecidos pelo elevado teor de ruído e variabilidade. Aqui, foram propostas soluções deep learning end-to-end e analisados tópicos importantes como o desempenho cross-database e a longo prazo, a importância relativa das ondas através da interpretabilidade, e a conversão entre canais.
A biometria com face, um complemento natural ao ECG em cenários impercetíveis, foi também estudada nesta tese. Os desafios em reconhecimento de faces com máscaras e na interpretabilidade em biometria foram abordados com o intuito de avançar para algoritmos mais transparentes, confiáveis e robustos a oclusões significativas. Dentro do tópico de reconhecimento de bem-estar, foram propostas soluções melhoradas para o reconhecimento multimodal de emoções em grupos de pessoas e de atividade/violência dentro de veículos partilhados. Por fim, foram propostos ainda uma forma inovadora de aprender segurança de templates em modelos end-to-end, evitando processos adicionais de encriptação, e um método auto-supervisionado adaptado a dados sequenciais, para garantir segurança de dados e desempenho otimizado.
Segundo os resultados deste trabalho, é possível concluir que o ideal de reconhecimento personalizado de bem-estar está ainda por atingir. No entanto, este trabalho construiu uma base sólida para suportar trabalho futuro em direção à integração da biometria com o reconhecimento de bem-estar de forma multimodal, impercetível, contínua e realista. Em geral, este doutoramento levou a múltiplas contribuições para os tópicos de biometria e reconhecimento de bem-estar, resultando diretamente em vinte e quatro publicações científicas em fóruns de renome em biometria e reconhecimento de padrões. A sua qualidade e impacto foram reconhecidas pela comunidade científica com mais de trezentas citações e múltiplos prémios, incluindo o prémio EAB Max Snijder 2022.
Palavras-chave: Aprendizagem Computacional; Atividade; Áudio; Biometria; Electrocardiograma; Emoção; Face; Monitorização de Bem-Estar; Reconhecimento de Padrões; Processamento de Sinal; Veículos Autónomos; Vídeo; Visão Computacional.
Abstract
Artificially intelligent perception is increasingly present in the lives of every one of us. Vehicles are no exception, as advanced driver assistance systems (ADAS) help us comply with speed limits, keep within the lanes, and avoid accidents. In the near future, pattern recognition will have an even stronger role in vehicles, as self-driving cars will require automated ways to understand what is happening around (and within) them and act accordingly.
Within pattern recognition, biometrics offer promising applications in vehicles, from keyless access control to the automatic personalisation of driving and environmental conditions based on the recognised driver. Similarly, wellbeing monitoring technologies have long attracted attention to the possibility of recognising activity, emotions, sleepiness, or stress from drivers and passengers. However, these two topics are starkly opposed, since wellbeing recognition relies on intrasubject variability while biometrics thrives on intersubject variability.
Despite their differences, biometric recognition and wellbeing monitoring could (and should) coexist. Continuous identity recognition from seamlessly acquired data could be used to personalise wellbeing monitoring models and attain improved performance. These personalised models could be the key to more robust ways of monitoring drivers’ drowsiness and attention and avoiding accidents. In a broader sense, they could be applied to all vehicle occupants, paving the way towards the accurate recognition of activity, emotions, comfort, and even violence episodes in shared autonomous vehicles.
This doctoral work focused on advancing in-vehicle sensing through the research of novel computer vision and pattern recognition methodologies for both biometrics and wellbeing monitoring. The main focus has been on electrocardiogram (ECG) biometrics, a trait well-known for its potential for seamless driver monitoring. Major efforts were devoted to achieving improved performance in identification and identity verification in off-the-person scenarios, well-known for increased noise and variability. Here, end-to-end deep learning ECG biometric solutions were proposed and important topics were addressed such as cross-database and long-term performance, waveform relevance through explainability, and interlead conversion.
Face biometrics, a natural complement to the ECG in seamless unconstrained scenarios, was also studied in this work. The open challenges of masked face recognition and interpretability in biometrics were tackled in an effort to evolve towards algorithms that are more transparent, trustworthy, and robust to significant occlusions. Within the topic of wellbeing monitoring, improved solutions to multimodal emotion recognition in groups of people and activity/violence recognition in in-vehicle scenarios were proposed. At last, we also proposed a novel way to learn template security within end-to-end models, dismissing additional separate encryption processes, and a self-supervised learning approach tailored to sequential data, in order to ensure data security and optimal performance.
Following the results of this work, one can conclude that truly personalised wellbeing is yet to be achieved. However, this work has built a strong framework to support future work towards the goal of integrating biometric recognition and wellbeing monitoring in a multimodal, seamless, continuous, and realistic way. Overall, this doctoral work led to numerous contributions to biometrics and wellbeing monitoring in general, resulting directly in twenty-four scientific publications in major biometrics and pattern recognition venues. Its quality and impact have been recognised by the scientific community with over three hundred citations and multiple awards, including the EAB Max Snijder Award 2022.
Keywords: Activity; Audio; Autonomous Vehicles; Biometrics; Computer Vision; Electrocardiogram; Emotion; Face; Machine Learning; Pattern Recognition; Signal Processing; Video; Wellbeing Monitoring.
Acknowledgements
Doutor. Finalmente. Volvidos cinco anos desde o início do meu percurso em investigação, a escrita deste documento dá-me a oportunidade de reviver os sucessos, fracassos, ideias, desafios, pessoas e momentos que marcaram este meu doutoramento. Foi uma excelente aventura, mas não foi fácil. As vozes do impostor syndrome fizeram-me duvidar se realmente teria a inteligência e a capacidade suficientes para completar um doutoramento. Foi inevitável, por vezes, tentar comparar com os doutoramentos de outros, o que frequentemente resultou em desilusão. Mas fui aprendendo a evitar os obstáculos no caminho e a compreender os avisos de quem já passara por eles. Diziam que um doutoramento não é um sprint, mas sim uma maratona. Que não requer capacidades extraordinárias, mas sim resiliência, motivação e determinação. Duvidei, mas depois deste longo percurso reconheço a veracidade dessa afirmação. Podemos duvidar da nossa inteligência e capacidades, mas o importante é continuar, e insistir, e procurar até encontrar a meta.
Com tempo percebi que cada doutoramento é único, e cada um tem o seu caminho a traçar, com desafios e dificuldades específicos. A comparação com os doutoramentos dos outros, apesar de inevitável, será sempre incompleta e injusta. Aprendi ainda que um doutoramento completo deverá ir bem para além da investigação científica. Não devemos ser apenas “máquinas de fazer artigos”, mas sim procurar explorar todas as outras vertentes de um investigador completo, como o ensino, a mentoria, as colaborações, e a organização de eventos científicos. É natural que rapidamente esgotemos as horas do dia (e a nossa energia) quando nos dividimos entre tantas atividades. Foram frequentes as longas noites de trabalho e os fins-de-semana que não o foram. Mas considero que encontrei o verdadeiro caminho para um bom doutoramento, e fico feliz por ter decidido segui-lo.
Foi perfeito? Não. Em retrospetiva, reconheço escolhas menos certas, certamente frutos da minha inexperiência, e imensos caminhos alternativos que teriam sido mais proveitosos. Relembro com pesar as ideias que faziam sentido mas não funcionaram. E imagino o potencial de tantas outras que não foram além de um rabisco esquecido numa folha qualquer. Mas não estou só. Ainda não conheci um único aluno de doutoramento que tenha chegado ao fim do seu trajeto plenamente contente e verdadeiramente confiante no resultado. Resta a ténue calma na ideia de que esta tese de doutoramento não é a minha “obra-prima” nem aquilo que irá definir toda a minha carreira. Mas sim, apenas, um livro de esboços, uma coleção de rascunhos de alguém que tropeçou, escorregou e errou inúmeras vezes durante quase cinco anos na tentativa de mapear um caminho inexplorado e, com sorte, tornar-se um investigador completo e autónomo.
Mudaria alguma coisa? Também não. Suponho que teria conseguido publicar mais artigos se não tivesse dividido a minha atenção entre tantas atividades paralelas. Talvez tivesse um trabalho com mais impacto se não tivesse orientado tantas teses de mestrado e estágios. Deveria talvez ter dado prioridade à importante experiência de dar aulas. Mas tudo isto é incerto. Certos são alguns momentos marcantes que deram um brilho especial a estes cinco anos de esforço e dedicação. Relembro o convívio e a partilha de conhecimento no BTAS, no IbPRIA, no BIOSIG, nos vários RECPADs e em tantas outras conferências. O prazer de poder contribuir para a organização do IWBF 2020 e dos workshops xAI4Biometrics. O orgulho em ver o meu esforço reconhecido pela comunidade europeia de biometria através do prémio Max Snijder. O entusiasmo ao ver (e poder demostrar a tantas pessoas) o meu trabalho a funcionar, ao vivo, no fim do projeto Easy Ride. A felicidade ao assistir a cada uma das provas públicas dos meus alunos de mestrado, concluindo com sucesso as suas teses, depois do privilégio de os acompanhar ao longo de um ano de aprendizagem, dedicação, esforço e evolução. A honra enorme de ser o escolhido da Inês, da Sofia e do Duarte para os cartolar na Imposição das Insígnias, um momento tão solene e significante a marcar o fim dos seus caminhos pela academia. A satisfação dos últimos dias de cada VISUM, onde depois de tanto trabalho nos damos conta do imenso valor da nossa escola de verão (e ainda a minha estranha proficiência na apresentação de quizzes). E ainda, a amizade e entreajuda que encontrei todos os dias no grupo VCMI. Ao relembrar as pessoas encontradas e estes momentos vividos, chego à conclusão que não mudaria absolutamente nada, no receio de que perdesse sequer um deles. E afinal, talvez o meu doutoramento não esteja assim tão longe da perfeição.
Por tudo isto tenho a agradecer, em primeiro lugar, ao Professor Jaime Cardoso. O melhor professor que tive a sorte de conhecer durante o meu percurso académico. Ao aproximar-se o fim do meu mestrado, muitas foram as dúvidas relativamente à possibilidade de um doutoramento. Há muito que era algo que almejava fazer, mas a magnitude da tarefa impunha respeito. Recebi muitas e variadas opiniões sobre o doutoramento e como fazer um com qualidade. No meio de expectável discórdia, um ponto de consenso: “o orientador é, de longe, o mais importante”. Mais vale o orientador certo numa universidade qualquer que o orientador errado na Ivy League, diziam em uníssono. Estavam certos, todos eles, e sem dúvida estava certo eu também quando escolhi fazer o doutoramento consigo, Professor. Um verdadeiro exemplo de integridade, profunda dedicação, impressionante inteligência e contagiante amor pelo que faz. Apesar das diferenças em experiência e currículo, tão comumente enfatizadas na academia, sempre me deixou à vontade para expressar livremente todas as ideias, dúvidas e problemas como se fosse um simples colega. E tudo isto vale o mundo para um aluno de doutoramento a percorrer a sua maratona. Recordo-me de certos momentos, como quando chegou a Professor Catedrático, em que me senti tão alegre como se tivesse sido eu próprio a conseguir essa conquista. E sei que não fui o único. Deixar tal marca nos alunos é prova definitiva da sua capacidade, dedicação e entrega como Professor e orientador. Desejo apenas que todos os seus objetivos se continuem a cumprir, com sucesso e felicidade, e que eu possa continuar a colaborar consigo e a tê-lo como meu mentor.
Ao Professor Miguel Velhote Correia, por ter aceitado o desafio de fazer parte deste projeto. Apesar dos nossos planos ambiciosos para este doutoramento, acabei por não ter muitas oportunidades para colaborar consigo. No entanto, fico feliz por ter conseguido que deixasse a sua marca naquele que considero ser o meu melhor trabalho durante este doutoramento. Continuo a acreditar no valor da investigação em instrumentação para o futuro da biometria com electrocardiograma, e espero um dia voltar a poder contar com o seu conhecimento e a sua experiência neste e em outros tópicos.
Ao grupo VCMI e aos que dele fizeram parte e contribuíram para a sua história, plena de inúmeros sucessos. Tal como ninguém vive numa bolha, também ninguém faz um doutoramento sozinho (apesar de ser uma aventura bastante solitária). Recordo a afirmação atribuída a Isaac Newton - “if I have seen further, it is by standing on the shoulders of giants”. Os que por aqui passaram antes de mim abriram-me e mostraram-me o caminho com os seus sucessos, e aqueles com os quais tive o prazer de percorrer esta jornada ajudaram-me a encontrar novas oportunidades e a aprender com diversos desafios em biometria e tantos outros tópicos. Não teria certamente conseguido metade do que consegui neste doutoramento se não tivesse como alicerce este grupo de verdadeiros gigantes, repleto de genialidade, capacidade e dedicação. Entre eles, um agradecimento especial ao Professor Jaime pela criação e constante dedicação ao grupo e à Filipa Sequeira pelos excelentes esforços recentes para aumentar a colaboração do subgrupo de biometria com a comunidade internacional. Obrigado por fazerem do grupo VCMI um símbolo de qualidade e excelência em biometria além-fronteiras, e por encherem o meu doutoramento de desafios, oportunidades, sucessos e ainda muitos momentos de felicidade. Sem dúvida, não podia ter escolhido um melhor grupo para o meu doutoramento.
À VISUM, indubitavelmente a melhor escola de verão por esse mundo fora. Obrigado pela oportunidade de organizar estes momentos de confluência entre culturas e aprendizagem, com tal magnitude e visibilidade internacional. Agradeço a todos os que deram um pouco de si para tornar a VISUM possível (e excelente), em especial à Ana, à Sara, e ao Wilson, que sacrificaram bem mais que todos os restantes e puxaram a nossa escola de verão para uma 10ª edição que ficará para a história. Cada edição foi única, mas foram todas fantásticas, e fico feliz de ter tido a oportunidade de fazer parte de quatro delas.
A todos os que confiaram em mim para co-orientar as suas tese de mestrado. Ao Gabriel, à Carolina, ao Leonardo, ao Arthur, ao João, à Inês, à Sofia, à Telma, à Mariana, ao Duarte, ao Guilherme, ao Vítor e ao Erfan. Cada um aceitou um tema único, com objetivos e dificuldades diferentes, e cada um o abordou com perspetivas e ideias diversas. Mas todos estiveram em sintonia na vontade de aprender, na dedicação à procura do caminho certo, e no ânimo firme mesmo em momentos de maior dificuldade. Sei que fui excecionalmente sortudo em ter tantos e tão excelentes alunos durante estes anos de doutoramento, e adorei trabalhar com cada um de vocês. Espero que tenham também gostado de trabalhar comigo (ou que pelo menos não se arrependam da vossa escolha) e que eu tenha estado à altura das vossas expectativas. Espero ainda que tenham aprendido algo comigo, tal como eu aprendi com cada um de vocês. Obrigado pelas vossas excelentes contribuições para este projeto, que na verdade também é um pouco vosso, e lembrem-se que continuarei aqui para vos ajudar, sempre que precisarem.
A todos aqueles que colaboraram comigo durante este doutoramento, tanto em temas relacionados com biometria como naqueles que me permitiram alargar os meus horizontes e adquirir conhecimentos em tópicos diferentes, incluindo os projetos AUTOMOTIVE, Easy Ride e Aurora. A todos na CardioID Technologies, em especial ao André, ao Carlos, ao Roberto, ao Pedro e ao Lourenço, pela ajuda em biometria com ECG e no projeto AUTOMOTIVE. À Bosch Car Multimedia, em especial ao Joaquim, ao Filipe, à Carolina, ao Ricardo, à Margarida, ao Niklas e ao Jochen pela excelente colaboração em in-vehicle monitoring no projeto Easy Ride. Aos da Fraunhofer IGD, em especial ao Fadi, ao Naser, ao Florian, ao Marco, ao Juan e à Meiling pela colaboração em masked face recognition e ainda pela calorosa receção em Darmstadt. Entre todos, um agradecimento especial ao André Lourenço pela colaboração, apoio e amizade já desde a minha tese de mestrado. Espero um dia poder voltar a colaborar com todos vós.
E por fim, mas certamente não em último lugar, à minha família e aos meus amigos, por tudo o resto que fez de mim o que sou hoje e que me ajudou a chegar aqui.
Obrigado a todos,
João Tiago
Funding
This work was financed by the Portuguese science and technology foundation, Fundação para a Ciência e a Tecnologia – FCT – and co-financed by the European Social Fund through the North Regional Operational Programme (NORTE 2020), under the grant “SFRH/BD/137720/2018”.
Data
The author wishes to thank the creators, contributors, and administrators of all databases and data collections used in the research work presented in this thesis.
ECG signal databases and collections: the author acknowledges the creators of the PTB [49] and PTB-XL [444, 443] databases at the Physikalisch-Technische Bundesanstalt, Germany, the creators of the University of Toronto ECG Database (UofTDB) [445] at the University of Toronto, Canada, the creators of the Check Your Biosignals Here initiative [394] at Instituto de Telecomunicações, Portugal, the creators of the INCART database at the St. Petersburg Institute of Cardiological Technics, Russia, as well as the creators and administrators of the Physionet online data repository [146]. E-HOL-03-0202-003 (E-HOL) Data used for this research was provided by the Telemetric and Holter ECG Warehouse of the University of Rochester (THEW), NY.
Face biometric databases and collections: the author wishes to acknowledge the creators of the YouTube Faces [460] database at Tel Aviv University, Israel, the creators of the ROSE Youtu [249] database at the Nanyang Technological University, Singapore, the creators of the MFRC-21 [50] database at Fraunhofer IGD, Germany, the creators of the VGGFace2 [58] at the University of Oxford, UK, the creators of the MS1MV2 [98] dataset at Imperial College London, UK, and the creators of the Labelled Faces in the Wild (LFW) [178] dataset at the University of Massachusetts, USA.
Credits
All previously published copyrighted content reused, reprinted, or adapted in this thesis is appropriately referenced and acknowledged and has been licensed as detailed below:
Content in Chapter 2: Adapted from João Ribeiro Pinto, “Continuous Biometric Identification on the Steering Wheel”, M.Sc. Thesis, University of Porto, Portugal, 2017. Figure 2.12 was reprinted from Cognition, vol. 121, Rob Jenkins, David White, Xandra Van Montfort, A. Mike Burton, “Variability in photos of the same face”, pp. 313–323, Copyright 2011, with permission from Elsevier.
Content in Chapter 3 and Appendix A: © 2018 IEEE. Reprinted, with permission, from João Ribeiro Pinto, Jaime S. Cardoso, André Lourenço, “Evolution, Current Challenges, and Future Possibilities in ECG Biometrics”, IEEE Access, June 2018.
Content in Chapter 4 and Figure 3.2: Reproduced with permission of Taylor and Francis Group LLC (Books) US through PLSclear.
Content in Chapter 5: © 2019 IEEE. Reprinted, with permission, from João Ribeiro Pinto, Jaime S. Cardoso, “An End-to-End Convolutional Neural Network for ECG-Based Biometric Authentication”, 2019 IEEE 10th International Conference on Biometrics Theory, Applications and Systems (BTAS), September 2019.
Content in Chapter 6: Reprinted/adapted by permission from Springer Nature: Springer Nature “Don’t You Forget About Me: A Study on Long-Term Performance in ECG Biometrics” by Gabriel Lopes, João Ribeiro Pinto, Jaime S. Cardoso © 2019.
Content in Chapter 9: Figures LABEL:fig:face_recog_history and LABEL:fig:face_recog_history_2 were reprinted from Neurocomputing, vol. 429, Mei Wang, Weihong Deng, “Deep face recognition: A survey”, pp. 30, Copyright 2021, with permission from Elsevier.
Content in Chapter 10: © 2021 IEEE. Reprinted, with permission, from Pedro C. Neto, Fadi Boutros, João Ribeiro Pinto, Mohsen Saffari, Naser Damer, Ana F. Sequeira, Jaime S. Cardoso, “My Eyes Are Up Here: Promoting Focus on Uncovered Regions in Masked Face Recognition”, 2021 International Conference of the Biometrics Special Interest Group (BIOSIG), September 2021.
Content in Chapter 12: © 2020 IEEE. Reprinted, with permission, from João Ribeiro Pinto, Tiago Gonçalves, Carolina Pinto, Luís Sanhudo, Joaquim Fonseca, Filipe Gonçalves, Pedro Carvalho, Jaime S. Cardoso, “Audiovisual Classification of Group Emotion Valence Using Activity Recognition Networks”, 2020 IEEE 4th International Conference on Image Processing, Applications and Systems (IPAS), December 2020.
Content in Chapter 14: © 2021 IEEE. Reprinted, with permission, from João Ribeiro Pinto, Miguel V. Correia, Jaime S. Cardoso, “Secure Triplet Loss: Achieving Cancelability and Non-Linkability in End-to-End Deep Biometrics”, IEEE Transactions on Biometrics, Behavior, and Identity Science, April 2021.
Content in Chapter 15: © 2020 IEEE. Reprinted, with permission, from João Ribeiro Pinto, Jaime S. Cardoso, “Self-Learning with Stochastic Triplet Loss”, 2020 International Joint Conference on Neural Networks (IJCNN), July 2020.
“In theory, there is no difference between theory and practice,
while in practice, there is.”
Benjamin Brewster
Abbreviations
- 1D
- Unidimensional
- 2D
- Bidimensional
- 2.5D
- Bidimensional with Depth Information
- 3D
- Tridimensional
- AC
- Autocorrelation
- ADAS
- Advanced Driver Assistance Systems
- AE
- Autoencoder
- AHA
- American Heart Association (dataset)
- AMAE
- Average Mean Absolute Error
- ANN
- Artificial Neural Network
- APCER
- Attack Presentation Classification Error Rate
- AR
- Autoregressive (coefficients)
- AUC
- Area Under the Curve
- BF
- Bona Fide
- BPCER
- Bona fide Presentation Classification Error Rate
- BPF
- Bandpass Filter
- BIOSIG
- Biometrics Special Interest Group
- Bi-LSTM
- Bidirectional Long Short-Term Memory (network)
- CAM
- Class Activation Mapping
- CASIA
- Chinese Academy of Sciences
- CC
- (Pearson’s) Correlation Coefficient
- CC0
- Creative Commons “No Rights Reserved” License
- CCC
- Concordance Correlation Coefficient
- CE
- Cross-Entropy
- CGFSI
- Cross-GAN Filter Similarity Index
- CIBB
- International Conference on Computational Intelligence Methods for Bioinformatics and Biostatistics
- CinC
- Computers in Cardiology (conference)
- CMC
- Cumulative Match Characteristic
- CNN
- Convolutional Neural Network
- CSIST
- Chung-Shan Institute of Science and Technology (datasets)
- CTM
- Centre for Telecommunications and Multimedia
- CYBHi
- Check Your Biosignals Here initiative
- CWT
- Continuous Wavelet Transform
- DBNN
- Decision-based Neural Network
- DCT
- Discrete Cosine Transform
- DET
- Detection Error Trade-off (curve)
- DNA
- Deoxyribonucleic Acid
- DT
- Direct Training (experimental scenario)
- DTW
- Dynamic Time Warping
- DWT
- Discrete Wavelet Transform
- EAB
- European Association for Biometrics
- ECCV
- European Conference on Computer Vision
- ECG
- Electrocardiogram
- EEG
- Electroencephalogram
- EEMD
- Ensemble Empirical Mode Decomposition
- EER
- Equal Error Rate
- EMD
- Empirical Mode Decomposition
- EMG
- Electromyogram
- ERDF
- European Regional Development Fund
- ETs
- Extremely Randomised Trees
- FAR
- False Acceptance Rate
- FC
- Fully-Connected (network layer)
- FCT
- Fundação para a Ciência e a Tecnologia
- FDDB
- Face Detection Database & Benchmark
- FEC
- Forward Error Control
- FERET
- Facial Recognition Technology
- FG4COVID19
- Face and Gesture Analysis for COVID-19 (workshop)
- FLDA
- Fisher Linear Discriminant Analysis
- FLRP
- Focused Layer-wise Relevance Propagation
- FMR
- False Match Rate
- FNMR
- False Non-Match Rate
- FOGD
- First-Order Gaussian Derivative (filter)
- FPIR
- False Positive Identification Rate
- FRR
- False Rejection Rate
- FRVT
- Face Recognition Vendor Test
- FT
- Fine-Tuning
- FTDNN
- Focused Time-Delay Neural Network
- GAN
- Generative Adversarial Network
- GBFS
- Greedy Best-First Search
- GMM
- Gaussian Mixture Model
- GMean
- Genuine Mean (scores)
- GNMF
- Graph-regularised Non-negative Matrix Factorisation
- GPU
- Graphics Processing Unit
- GRU
- Gated Recurrent Unit
- Grad-CAM
- Gradient-weighted Class Activation Mapping
- HASLab
- High-Assurance Software Laboratory
- HE
- Homomorphic Encryption
- HLDA
- Heteroscedastic Linear Discriminant Analysis
- HPF
- Highpass Filter
- HRV
- Heart Rate Variability
- I3D
- Two-Stream Inflated Tridimensional Convolutional Network
- IARPA
- Intelligence Advanced Research Projects Activity
- ICA
- Independent Component Analysis
- IDR
- Identification Rate
- IJB-C
- IARPA Janus Benchmark-C
- IJCB
- International Joint Conference on Biometrics
- IJCNN
- International Joint Conference on Neural Networks
- IMDb
- Internet Movie Database
- IMean
- Impostor Mean (scores)
- IMF
- Intrinsic Mode Function
- IOMBA
- Interval Optimised Mapping Bit Allocation
- IoU
- Intersection over Union
- IPAS
- International Conference on Image Processing, Applications and Systems
- ISEL
- Instituto Superior de Engenharia de Lisboa
- ISM
- In-Vehicle Sensing Monitorisation (workshop)
- IT-CNN
- Identification Training Convolutional Neural Network
- IWBF
- International Workshop on Biometrics and Forensics
- KLD
- Kullback-Leibler Divergence
- kNN
- k-Nearest Neighbours
- KPCA
- Kernel Principal Component Analysis
- KSS
- Karolinska Sleepiness Scale
- LBP
- Local Binary Patterns
- LDA
- Linear Discriminant Analysis
- LDP
- Local Difference Patterns
- LFW
- Labeled Faces in the Wild (dataset)
- LLR
- Log-Likelihood Ratio
- LPF
- Lowpass Filter
- LRN
- Label Refinement Network
- LSTM
- Long Short-Term Memory (network)
- LWIR
- Long-Wave Infrared
- MB
- Megabyte
- MFCC
- Mel-Frequency Cepstral Coefficients
- MFR
- Masked Face Recognition
- MFRC-21
- 2021 Masked Face Recognition Competition Dataset
- MIDR
- Misidentification Rate
- MIT-BIH
- Massachusetts Institute of Technology - Beth Israel Hospital
- MLP
- Multi-Layer Perceptron
- MMAE
- Maximum Mean Absolute Error
- MMIT
- Multi-Moments in Time (dataset)
- MRLBP
- Multi-Resolution Local Binary Patterns
- MSDF-1DMRLBP
- Multi-Scale Differential Features fusion of Unidimensional Multi-Resolution Local Binary Patterns
- MSE
- Mean Squared Error
- MSFS
- Multisession Feature Selection
- MTCNN
- Multi-Task Convolutional Neural Network
- MWIR
- Mid-Wave Infrared
- NCC
- Normalised Cross-Correlation
- NCCC
- Normalised Cross-Correlation Clustering
- NF
- Notch Filter
- NIR
- Near-Infrared
- NIS
- Networked Intelligent Systems (cluster)
- NIST
- National Institute of Standards and Technology
- NN
- Neural Network
- NRC
- Normalised Relative Compression
- NSR
- Normal Sinus Rhythm
- OA
- One-Attack (evaluation scenario)
- OCFR
- Advanced Occluded Face Recognition (competition)
- PA
- Presentation Attack
- PAD
- Presentation Attack Detection
- PAI
- Presentation Attack Instrument
- PAISp
- Presentation Attack Instrument Species
- PaSC
- Point and Shoot Face Recognition Challenge
- PCA
- Principal Component Analysis
- PLI
- Powerline Interference
- PNN
- Probabilistic Neural Network
- PPG
- Photoplethysmogram
- PRD
- Percent Root-Mean-Square Difference
- PSD
- Power Spectral Density
- PTB
- Physicalisch-Technische Bundesanstalt (dataset)
- PTCD
- Probability of Time to Correct Decision (score)
- RBF
- Radial Basis Function
- RCNN
- Region-based Convolutional Neural Network
- ReLU
- Rectified Linear Unit
- RF
- Random Forest
- RGB
- Red-Green-Blue (colour model)
- RMFD
- Real Masked Face Data (evaluation scenario)
- RMSE
- Root Mean Squared Error
- ROC
- Receiver Operating Characteristic (curve)
- RR
- Reject Rate
- RSA
- Recurrent Scale Approximation
- S3FD
- Single Shot Scale-Invariant Face Detector
- SAGR
- Sign Agreement Metric
- SAX
- Symbolic Aggregate Approximation
- SCG
- Seismocardiogram
- SecureTL
- Secure Triplet Loss
- SFA
- Simplified Fuzzy ARTMAP
- SGD
- Stochastic Gradient Descent
- SHAP
- Shapley Addictive Explanation
- SIMCA
- Soft Independent Modelling by Class Analogy
- SL
- Self-Learning
- SMFD
- Synthetic Masked Face Data (evaluation scenario)
- SSIM
- Structural Similarity Index Measure
- SVM
- Support Vector Machine
- StD
- Standard Deviation
- STFT
- Short-Time Fourier Transform
- SWIR
- Short-Wave Infrared
- TCD
- Time to Correct Decision (score)
- TL-CNN
- Transfer-Learning Convolutional Neural Network
- TPIR
- True Positive Identification Rate
- TVCG
- Tridimensional Vectorcardiogram
- t-SNE
- t-Distributed Stochastic Neighbour Embedding
- UA
- Unseen-Attack (evaluation scenario)
- UBM
- Universal Background Model
- ULHT
- Universidade Lusófona de Humanidades e Tecnologias
- UMAP
- Face and Gesture Analysis for COVID-19
- UMD
- University of Maryland (dataset)
- USC
- Usability-Security Curve
- UofTDB
- University of Toronto ECG Database
- Var
- Variance
- VCMI
- Visual Computing and Machine Intelligence (research group)
- VGAF
- Video-level Group Affect (dataset)
- VGG
- Visual Geometry Group (dataset)
- VISAPP
- International Conference on Computer Vision Theory and Applications
- VGA
- Video Graphics Array
- WACV
- Winter Conference on Applications of Computer Vision
- WDIST
- Wavelet Distance
- WWPRD
- Wavelet-Weighted Percent Root-Mean-Square Difference
- xaFCM
- Extended-alphabet Finite-Context Model
- xAI4Biometrics
- Explainable Artificial Intelligence for Biometrics (workshop)
Part I Prologue
Chapter 1 Introduction
1.1 Context and Motivation
The interactions between humans and machines are increasingly mediated by intelligent sensing technologies. Nowadays, the default way to unlock a smartphone is using face or fingerprint biometrics. Highly-populated countries like India and China are building unprecedentedly massive national identity networks relying entirely on biometric characteristics (and dealing with the societal intricacies of such colossal endeavours) [198, 404, 257]. Sophisticated algorithms monitor our attention levels while we drive [176, 119]. Meanwhile, the gaming and entertainment industries are investing heavily in using affective computing to continuously personalise and enhance user experience [24, 259, 97].
Among all of these applications, few have been so revolutionised (and so quickly) as vehicles, and there are plenty of great reasons for that. Whether in personal cars or public transport, people can typically spend up to multiple hours of their day inside vehicles, especially those with long daily commutes or those living/working in large urban centres. Moreover, a considerable fraction of preventable deaths and serious injuries occur in accidents involving vehicles, caused mainly by driver fatigue or the influence of psychotropic substances [370, 399].
While we wait for fully autonomous vehicles, advanced driver assistance systems (ADAS) based on artificial intelligence help drivers comply with speed limits, stay in their lanes, beware of their blind spots, and avoid accidents [81, 82, 410]. One of the most interesting applications of this is drowsiness detection, where biometric data such as face video or physiological signals can be used to detect episodes of sleepiness and infer the fatigue levels of the driver [116, 399, 320]. When done continuously (or at least frequently) during vehicle usage, it can be used to warn the driver or even trigger the automatic safe interruption of the vehicle’s operation.
Drowsiness, just like most other wellbeing parameters, reveals itself on biometric data as intrasubject variability: the way a person’s data varies over time and across diverse conditions [116]. This stands in stark opposition to biometric recognition applications, which rely on intersubject variability (the way a person’s data differs from another’s) to distinguish identities [213, 343]. In biometric recognition, intrasubject variability is typically regarded as a nuisance, as it blurs the boundaries between individuals’ data and hampers accurate and robust identity recognition [199].
In spite of their differences, biometric recognition and wellbeing monitoring can coexist in a vehicle scenario. Applications of biometric recognition for vehicles are typically focused on access control or the automatic personalisation of driving and environmental conditions (such as seat position, mirror adjustments, or infotainment settings) based on the recognised driver and occupants [342, 91]. However, in this thesis, we defend that this coexistence could (and should) be intensified, and eventually evolve to a level of symbiotic integration.
Despite the efforts devoted to wellbeing monitoring technologies, one challenge remains unvanquished: the fact that wellbeing patterns are deeply personal. For example, no two individuals experience drowsiness in the exact same way, and similar levels of fatigue can have dramatically different effects on each person. This is also true for the way wellbeing parameters reflect on biometric data. A drowsiness monitoring system can present acceptable accuracy levels for a given set of subjects and, simultaneously, be inadequate at recognising the specific drowsiness patterns of other people [116, 399].
Biometric recognition could be the key to unlocking the next generation of wellbeing monitoring technologies. Instead of using generalist models, identity predictions obtained through biometric recognition would enable the selection of specific models for each of the users. These models could also benefit from the influx of new data, continuously learning the subject-specific patterns of wellbeing. Thus, combining biometrics with wellbeing could enable the creation of more accurate and robust solutions for wellbeing monitoring [116].
In the future, fully autonomous driving may put an end to the need for drivers, but not to the need for automatic intelligent sensing technologies inside vehicles [23, 302, 348]. The same biometric algorithms and wellbeing monitoring systems that once were focused on the driver may easily be adapted to target the occupants. In fact, self-driving vehicles unveil a new scenario for automatic passenger monitoring: since there is no driver, shared autonomous vehicles (such as autonomous taxis) lack an authority figure, responsible for the integrity of the vehicle and the comfort and security of the passengers. The driver could be replaced by pattern recognition solutions to monitor the shared vehicle interior and its passengers.
Overall, the advantages of introducing intelligent sensing technologies in vehicles are plenty. From a narrower subject-centric perspective, integrating the use of inter and intrasubject variability would enable the development of continuously personalisable models for more robust monitoring of wellbeing parameters. From a broader perspective, taking advantage of seamless multimodal data acquisitions for automatic monitoring of the interior and passengers is of utmost importance to ensure security and comfort inside autonomous shared vehicles.
1.2 Objectives
This doctoral work focused on advancing in-vehicle sensing technology through the conceptualisation and development of novel computer vision and pattern recognition methodologies. The goal has been to create automatic solutions for in-vehicle monitoring, robustly and efficiently. To achieve this, we targeted two specific scenarios, as follows:
-
•
Personalised wellbeing monitoring systems using biometrics: Here, the objective was to advance biometric recognition technologies to be integrated with wellbeing monitoring methodologies, especially for driver assistance systems. We build upon the ECG biometrics research conducted in [337], with additional work on face recognition and other important topics such as biometric security and learning from data streams. With this work, we aimed to pave the way towards a robust multimodal system to recognise the driver using ECG and face information. The automatic identity predictions enable the use of the drivers’ data to continuously learn their personal patterns of wellbeing for more accurate monitoring. Within wellbeing, this research work focused on driver drowsiness and emotions, as part of the AUTOMOTIVE project, but it stands to reason that biometrics could be used for personalised monitoring of any wellbeing parameter;
-
•
Occupant monitoring for autonomous shared vehicles: Forecasting the advent of fully autonomous vehicles, this work aimed towards the use of data streams for monitoring occupants. Integrated within the Easy Ride project, we targeted the monitoring of emotions among passenger groups, as well as the recognition of activities and violence inside shared autonomous vehicles. Just like the first scenario, this aims towards contributions to more intelligent and robust wellbeing monitoring systems using multimodal data sources, albeit in a less personal subject-centric way, focused instead on passenger groups as a whole. Although activity recognition is a relatively mature research topic, the in-vehicle environment offers very specific challenges, mainly regarding perspective, lighting, and occlusions, which enabled the study of innovative solutions for robust passenger monitoring. Ultimately, the developed occupant wellbeing monitoring solutions could also be personalised, using the biometric recognition of individual passengers as additional information for improved accuracy.
Despite these two scenarios, used to contextualise and motivate the work conducted during this work, we aimed to build solutions that are applicable outside the target applications and beyond the fields of biometrics and wellbeing monitoring. This work also aimed to result in significant advances to the target fields, which are ready for real-life applications and capable to withstand the test of time. As such, throughout the entirety of this doctoral project, there was a constant concern to ensure the proposed methodologies were:
-
•
Multimodal: The diversification of data sources is the key to truly robust models. On the topic of biometric recognition, considering the strengths and shortcomings of the ECG signal as a biometric trait, the face is the best complementary trait for better performance and robustness. Beyond biometric recognition, the fusion of ECG and face results in a larger availability of anatomical and physiological measurements, which enable the more comprehensive monitoring of wellbeing parameters;
-
•
Seamless: Regardless of the possible consequences to accuracy, user comfort should be of utmost importance. Hence, subjects should be as unaware of the acquisition process as possible, to avoid attention or behaviour changes that could impact their comfort or the realism of the collected data. As such, this work focused, as extensively as possible, on seamlessly acquired data, in nearly unconstrained settings. When drivers are the target, and thus the subject is in physical contact with the system nearly continuously (e. g., driving the car), ECG and other physiological signals can be acquired unobtrusively at the steering wheel. Face video can also be easily and inexpensively acquired with cameras. On the other hand, for shared vehicle occupant monitoring, physiological signals have been avoided in favour of less contact-intensive alternatives, namely video and audio;
-
•
Continuous: Continuous biometric methodologies offer unique advantages in usability and effectiveness, both for recognition and wellbeing monitoring. On the other hand, having a continuous stream of biometric data opens up new possibilities for improved accuracy, immersive systems, and error management. As such, beyond novelty and performance, the algorithms developed during this work aimed towards real-time operation, reflecting a constant preference for efficiency and simplicity whenever possible;
-
•
Realistic: Overall, performance results in ECG-based biometrics literature are unrealistic, mainly due to inadequate train-test splits and overly clean signal databases. The same happens in wellbeing monitoring when the problem of subject-independence is highlighted. This reveals the deeply flawed nature of typical evaluation frameworks, which should more realistically resemble actual application conditions and ensure reproducible results. To achieve this, this doctoral work included the reformulation of testing procedures, especially for ECG-based biometrics, through the definition of adequate test protocols, the benchmarking of literature methods, and the development of more robust recognition and monitoring algorithms.
1.3 Contributions
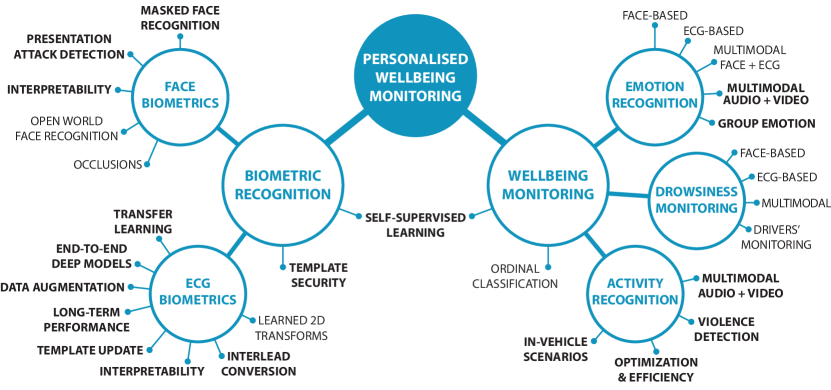
On the quest for personalised wellbeing monitoring, focused on the objectives detailed in the previous section, this doctoral project comprised several research topics related to both biometric recognition and wellbeing monitoring. Fig. 1.1 presents them and illustrates their interconnections. Most of these were the focus of research work during this doctoral project and resulted in innovative contributions towards the target of in-vehicle personalised wellbeing monitoring.
This thesis presents the innovative contributions of this work organised throughout four parts. The first two of these are focused on biometric recognition, aiming towards the development of personalised wellbeing monitoring solutions. The third part targets the scenario of passenger monitoring inside shared autonomous vehicles, specifically for emotion, activity, and violence recognition. The fourth presents broader contributions applicable to multiple scenarios in biometrics and pattern recognition. These contributions are concisely enumerated below.
In Part II, Electrocardiogram Biometrics:
-
•
a comprehensive survey of one hundred and twenty-five state-of-the-art methodologies for ECG-based biometric recognition, describing the evolution of the topic from 1999 to 2022 and open challenges and opportunities for future research (Chapter 3);
-
•
the first end-to-end methodology for ECG biometrics, alongside tailored data augmentation strategies for ECG signals and a study on the advantages of integrating typically separate processes inside a single deep architecture (Chapter 4);
-
•
an application of triplet loss and transfer learning for ECG-based identity verification, aiming towards higher robustness under realistic evaluation setups using off-the-person databases (Chapter 5);
-
•
a study on long-term performance with multiple state-of-the-art ECG biometric methodologies, including an assessment of the effect of diverse template and model update strategies (Chapter 6);
-
•
a study on the relative importance of ECG waveforms for identification under diverse scenarios, less to more challenging, using explainability tools on our deep learning identification methodology (Chapter 7);
-
•
a methodology for recovering missing ECG leads based on single-lead blindly-segmented input signals, paving the way towards more complete applications (even in clinical scenarios) with less obtrusive signal collection setups (Chapter 8).
In Part III, Face Biometrics:
-
•
a custom training methodology tailored for face recognition with masks, aiming to promote the use of unmasked parts of the face and close the performance gap relative to typical face recognition (Chapter 10);
-
•
a study using interpretability tools to understand the use of face image information in presentation attack detection (PAD), alongside a discussion on the need for explainability and transparency in biometric recognition (Chapter 11).
In Part IV, Wellbeing Monitoring:
-
•
an approach for classifying emotion valence in groups of people, based on the late fusion of parallel visual and audio data streams using deep neural networks (Chapter 12);
-
•
a cascade strategy for improved efficiency in continuous audiovisual activity recognition and violence detection inside vehicles (Chapter 13).
In Part V, Broader Topics on Biometrics and Pattern Recognition:
-
•
the Secure Triplet Loss, a training methodology that promotes template cancelability and unlinkability, alongside identity discrimination, on end-to-end biometric algorithms without the need for separate encryption or hashing processes (Chapter 14);
-
•
a methodology for self-supervised learning based on the triplet loss, taking advantage of the nature of balanced multiclass datasets, especially those composed of sequential data, for more adequate learning of the target tasks (Chapter 15).
These research works may be categorised according to the specific contributions by the author of this thesis. The presented work in ECG-based biometric identification (Chapter 4), authentication (Chapter 5), and explainability (Chapter 7), as well as emotion recognition (Chapter 12), activity recognition (Chapter 13), biometric template security (Chapter 14), and self-supervised learning (Chapter 15) comprise the main contributions, resulting completely or mostly from the work performed by the author. The research on long-term performance in ECG biometrics (Chapter 6), ECG interlead conversion (Chapter 8), masked face recognition (Chapter 10), and interpretability for face PAD (Chapter 11) are secondary contributions that resulted from collaborations within the scope of this thesis and benefitted partially from the work of the author. Further details on the specific contributions can be found at the start of each chapter. Other topics have been addressed which are not presented in this thesis, due to the relevance of the respective topics or the relative weight of the author’s contributions. They are, however, also mapped in Fig. 1.1 and listed in the sections below.
1.4 Dissemination
The contributions of the doctoral research to biometrics, wellbeing monitoring, and broader topics described in this thesis have been disseminated as part of twenty-four scientific publications. These are (clustered by type and in reverse chronological order):
-
•
Articles in journals: {etaremune}
-
•
S. Beco, J. R. Pinto, and J. S. Cardoso, “Electrocardiogram Lead Conversion from Single-Lead Blindly-Segmented Signals,” BMC Medical Informatics and Decision Making, 22: 314, 2022. [31]
-
•
T. Esteves, J. R. Pinto, P. M. Ferreira, P. Costa, L. A. Rodrigues, I. Antunes, G. Lopes, P. Gamito, A. Abrantes, P. M. Jorge, A. Lourenço, A. F. Sequeira, J. S. Cardoso, and A. Rebelo, “AUTOMOTIVE: A case study on AUTOmatic multiMOdal drowsiness detecTIon for smart VEhicles,” IEEE Access, 9: 153678–153700, 2021. [116]
-
•
A. F. Sequeira, T. Gonçalves, W. Silva, J. R. Pinto, and J. S. Cardoso, “An Exploratory Study of Interpretability for Face Presentation Attack Detection,” IET Biometrics, 10 (4): 441–455, 2021. [386]
-
•
J. R. Pinto, M. V. Correia, and J. S. Cardoso, “Secure Triplet Loss: Achieving Cancelability and Non-Linkability in End-to-End Deep Biometrics,” IEEE Transactions on Biometrics, Behavior, and Identity Science, 3 (2): 180–189, 2021. [347]
-
•
J. R. Pinto, J. S. Cardoso, and A. Lourenço, “Evolution, Current Challenges, and Future Possibilities in ECG Biometrics,” IEEE Access, 6: 34746–34776, 2018. [343]
-
•
Articles in international conference proceedings: {etaremune}
-
•
J. R. Pinto, P. Carvalho, C. Pinto, A. Sousa, L. G. Capozzi, and J. S. Cardoso, “Streamlining Action Recognition in Autonomous Shared Vehicles with an Audiovisual Cascade Strategy,” in 17th International Conference on Computer Vision Theory and Applications (VISAPP), Feb. 2022. [348]
-
•
P. C. Neto, F. Boutros, J. R. Pinto, N. Damer, A. F. Sequeira, J. S. Cardoso, “FocusFace: Multi-task Contrastive Learning for Masked Face Recognition,” in Workshop on Face and Gesture Analysis for COVID-19 (FG4COVID19), Dec. 2021. [308]
-
•
P. C. Neto, F. Boutros, J. R. Pinto, M. Saffari, N. Damer, A. F. Sequeira, and J. S. Cardoso, “My Eyes Are Up Here: Promoting Focus on Uncovered Regions in Masked Face Recognition,” in International Conference of the Biometrics Special Interest Group (BIOSIG 2021), Sep. 2021. [309]
-
•
F. Boutros, N. Damer, J. Kolf, K. Raja, F. Kirchbuchner, R. Ramachandra, A. Kuijper, P. Fang, C. Zhang, F. Wang, D. M. Martin, N. Aginako, B. Sierra, M. Nieto, M. E. Erakin, U. Demir, H. Ekenel, A. Kataoka, K. Ichikawa, S. Kubo, J. Zhang, M. He, D. Han, S. Shan, K. Grm, V. Struc, S. Seneviratne, N. Kasthuriarachchi, S. Rasnayaka, P. C. Neto, A. F. Sequeira, J. R. Pinto, M. Saffari, and J. S. Cardoso, “MFR 2021: Masked Face Recognition Competition,” in International Joint Conference on Biometrics (IJCB 2021), Aug. 2021. [50]
-
•
J. R. Pinto, T. Gonçalves, C. Pinto, L. Sanhudo, J. Fonseca, F. Gonçalves, P. Carvalho, and J. S. Cardoso, “Audiovisual Classification of Group Emotion Valence Using Activity Recognition Networks,” in Fourth IEEE International Conference on Image Processing, Applications and Systems (IPAS 2020), Dec. 2020. [346]
-
•
J. R. Pinto and J. S. Cardoso, “Explaining ECG Biometrics: Is It All In The QRS?,” in International Conference of the Biometrics Special Interest Group (BIOSIG 2020), Sep. 2020. [339]
-
•
J. R. Pinto and J. S. Cardoso, “Self-Learning with Stochastic Triplet Loss,” in International Joint Conference on Neural Networks (IJCNN 2020), Jul. 2020. [340]
-
•
J. R. Pinto, J. S. Cardoso, and M. V. Correia, “Secure Triplet Loss for End-to-End Deep Biometrics,” in 8th International Workshop on Biometrics and Forensics (IWBF 2020), Apr. 2020. [345]
-
•
A. F. Sequeira, W. Silva, J. R. Pinto, T. Gonçalves, and J. S. Cardoso, “Interpretable Biometrics: Should We Rethink How Presentation Attack Detection is Evaluated?,” in 8th International Workshop on Biometrics and Forensics (IWBF 2020), Apr. 2020. [385]
-
•
J. R. Pinto and J. S. Cardoso, “An End-to-End Convolutional Neural Network for ECG-Based Biometric Authentication,” in 10th IEEE International Conference on Biometrics: Theory, Applications and Systems (BTAS 2019), Sep. 2019. [338]
-
•
G. Lopes, J. R. Pinto, and J. S. Cardoso, “Don’t You Forget About Me: A Study on Long-Term Performance in ECG Biometrics,” in IbPRIA 2019: 9th Iberian Conference on Pattern Recognition and Image Analysis, Jul. 2019. [269]
-
•
Short papers presented in international conferences: {etaremune}
-
•
S. Beco, J. R. Pinto, and J. S. Cardoso, “Interlead Conversion of Single-Lead Blindly-Segmented Electrocardiogram Signals,” in 17th International Conference on Computational Intelligence Methods for Bioinformatics and Biostatistics (CIBB 2021), Nov. 2021. [30]
-
•
Chapters in books: {etaremune}
-
•
J. R. Pinto, J. S. Cardoso, and A. Lourenço, “Deep Neural Networks for Biometric Identification Based on Non-Intrusive ECG Acquisitions,” in K. V. Arya and R. S. Bhadoria, Eds., The Biometric Computing: Recognition and Registration, CRC Press, 2019. [344]
-
•
Encyclopaedia entries: {etaremune}
-
•
J. R. Pinto and J. S. Cardoso, “ECG Biometrics,” in S. Jajodia, P. Samarati, and M. Yung, Eds., Encyclopedia of Cryptography, Security and Privacy, Springer, 2021. [341]
-
•
Abstracts in national conference proceedings: {etaremune}
-
•
J. R. Pinto and J. S. Cardoso, “xECG: Using Interpretability to Understand Deep ECG Biometrics,” in 27th Portuguese Conference on Pattern Recognition (RECPAD 2021), Nov. 2021.
-
•
J. R. Pinto, M. V. Correia, and J. S. Cardoso, “Achieving Cancellability in End-to-End Deep Biometrics with the Secure Triplet Loss,” in 26th Portuguese Conference on Pattern Recognition (RECPAD 2020), Oct. 2020.
-
•
W. Silva, J. R. Pinto, T. Gonçalves, A. F. Sequeira, and Jaime S. Cardoso, “Explainable Artificial Intelligence for Face Presentation Attack Detection,” in 26th Portuguese Conference on Pattern Recognition (RECPAD 2020), Oct. 2020.
-
•
G. Lopes, J. R. Pinto, J. S. Cardoso, and A. Rebelo, “Long-Term Performance of a Convolutional Neural Network for ECG-Based Biometrics,” in 25th Portuguese Conference on Pattern Recognition (RECPAD 2019), Oct. 2019.
-
•
J. R. Pinto, J. S. Cardoso, and A. Lourenço, “Improving ECG-Based Biometric Identification Using End-to-End Convolutional Networks,” in 24th Portuguese Conference on Pattern Recognition (RECPAD 2018), Oct. 2018.
Beyond the aforementioned publications, the author has contributed to fourteen other scientific publications related to diverse pattern recognition and computer vision research topics not covered in this thesis. These are listed below:
-
•
Articles in journals: {etaremune}
-
•
P. C. Neto, T. Gonçalves, J. R. Pinto, W. Silva, A. F. Sequeira, A. Ross, and J. S. Cardoso, “Explainable Biometrics in the Age of Deep Learning,” ACM Computing Surveys, 2022. [311] (submitted)
-
•
L. G. Capozzi, V. Barbosa, C. Pinto, J. R. Pinto, A. Pereira, P. M. Carvalho, and J. S. Cardoso, “Toward Vehicle Occupant-Invariant Models for Activity Characterization,” IEEE Access, 10: 104215–104225, 2022. [64]
-
•
P. C. Neto, J. R. Pinto, F. Boutros, N. Damer, A. F. Sequeira, and J. S. Cardoso, “Beyond Masks: On the Generalization of Masked Face Recognition Models to Occluded Face Recognition,” IEEE Access, 10: 86222–86233, 2022. [312]
-
•
S. P. Oliveira, J. R. Pinto, T. Gonçalves, R. C. Marques, M. J. Cardoso, H. P. Oliveira, and J. S. Cardoso, “Weakly-Supervised Classification of HER2 Expression in Breast Cancer Haematoxylin and Eosin Stained Slides,” Applied Sciences, 10 (14): 4728, 2020. [321]
-
•
Articles in international conference proceedings: {etaremune}
-
•
P. C. Neto, F. Boutros, J. R. Pinto, N. Damer, A. F. Sequeira, J. S. Cardoso, M. Bengherabi, A. Bousnat, S. Boucheta, N. Hebbadj, B. Yahya-Zoubir, M. E. Erakın, U. Demir, H. K. Ekenel, P. B. Q. Vidal, and D. Menotti, “IJCB OCFR 2022: Competition on Occluded Face Recognition From Synthetically Generated Structure-Aware Occlusions,” in International Joint Conference on Biometrics (IJCB 2022), Oct. 2022. (in press) [310]
-
•
L. G. Capozzi, P. Carvalho, A. Sousa, C. Pinto, J. R. Pinto, and J. S. Cardoso, “Impact of visual noise in activity recognition using deep neural networks - an experimental approach,” in 2nd International Conference on Pattern Recognition and Machine Learning (PRML 2021), Jul. 2021. [63]
-
•
L. G. Capozzi, J. R. Pinto, J. S. Cardoso, and A. Rebelo, “End-to-End Deep Sketch-to-Photo Matching Enforcing Realistic Photo Generation,” in 25th Iberoamerican Congress on Pattern Recognition (CIARP’21), May 2021. [60]
-
•
L. G. Capozzi, J. R. Pinto, J. S. Cardoso, and A. Rebelo, “Optimizing Person Re-Identification using Generated Attention Masks,” in 25th Iberoamerican Congress on Pattern Recognition (CIARP’21), May 2021. [61]
-
•
A. Matta, J. R. Pinto, and J. S. Cardoso, “Mixture-Based Open World Face Recognition,” in 9th World Conference on Information Systems and Technologies (WorldCIST’21), Apr. 2021. [290]
-
•
W. Silva, J. R. Pinto, and J. S. Cardoso, “A Uniform Performance Index for Ordinal Classification with Imbalanced Classes,” in International Joint Conference on Neural Networks (IJCNN 2018), Jul. 2018. [396]
-
•
Abstracts in national conference proceedings: {etaremune}
-
•
L. Capozzi, J. R. Pinto, J. S. Cardoso, and A. Rebelo, “Sketch-to-Photo Matching Enforcing Realistic Rendering Generation,” in 27th Portuguese Conference on Pattern Recognition (RECPAD 2021), Nov. 2021.
-
•
S. P. Oliveira, J. R. Pinto, T. Gonçalves, H. P. Oliveira, and Jaime S. Cardoso, “IHC Classification in Breast Cancer H&E Slides with a Weakly-Supervised Approach,” in 26th Portuguese Conference on Pattern Recognition (RECPAD 2020), Oct. 2020.
-
•
P. Costa, P. Silva, J. R. Pinto, A. F. Sequeira, and A. Rebelo, “Face Anti Spoofing: Handcrafted and Learned Features for Face Liveness Detection,” in 25th Portuguese Conference on Pattern Recognition (RECPAD 2019), Oct. 2019.
-
•
J. R. Pinto and J. S. Cardoso, “Fine Segmentation of Head and Torso Using Label Refinement Networks,” in 25th Portuguese Conference on Pattern Recognition (RECPAD 2019), Oct. 2019.
The research conducted during these doctoral studies has also been partially presented to the scientific community at the Doctoral Consortium of the 2019 IEEE International Conference on Biometrics: Theory, Applications and Systems (Tampa, FL, USA) and at the 2020 International Summer School for Advanced Studies on Biometrics for Secure Authentication (Alghero, Italy).
1.5 Collaborations
The doctoral work presented in this thesis included close collaborations with researchers from several institutions within the AUTOMOTIVE, Easy Ride, and Aurora projects. The author also collaborated frequently with VCMI group colleagues within their research work and master dissertations related to diverse biometrics, pattern recognition, and computer vision topics, as described below.
1.5.1 Research projects
The AUTOMOTIVE project111AUTOMOTIVE (“POCI-01-0145-FEDER-030707”) was financed by the European Regional Development Fund (ERDF) through the Operational Programme for Competitiveness and Internationalisation (COMPETE 2020 Programme), and by national funds through the Portuguese funding agency, Fundação para a Ciência e a Tecnologia (FCT). was focused on ushering in the next generation of driver drowsiness monitoring technologies. Led by the VCMI research group at INESC TEC, this project featured the participation of CardioID Technologies, Instituto Superior de Engenharia de Lisboa (ISEL), and Universidade Lusófona de Humanidades e Tecnologias (ULHT). The author of this thesis has participated in the AUTOMOTIVE project from June 2019 to its conclusion in November 2021. He mainly contributed to the development of novel algorithms for ECG-based biometric recognition to enable personalised drowsiness models. The results of this project are nicely summed up in [116].
The Easy Ride project222Easy Ride (“POCI-01-0247-FEDER-039334”) was supported by European Structural and Investment Funds in the FEDER component, through the Operational Competitiveness and Internationalisation Programme (COMPETE 2020)., under the motto “Experience is Everything”, was a large effort led by Bosch Car Multimedia and Universidade do Minho aiming to improve passenger comfort and safety in autonomous shared vehicles. It featured INESC TEC’s participation in the SP5 sub-project, in close cooperation with Bosch Car Multimedia, which focused on occupant emotional monitoring. The author of this thesis has participated in writing this project’s proposal, and then in the research work from its start in February 2020 to its conclusion in December 2021. He has mainly contributed to the design, implementation, and evaluation of efficient multimodal deep learning algorithms using audio and RGB video for in-vehicle emotion, activity, and violence recognition. The work encompassed all stages of research and development from scratch to in-vehicle deployment and is presented in [346, 348].
The Aurora project inherited Easy Ride’s goals of bringing forth the future of shared autonomous vehicles. Specifically, it brought together Bosch Car Multimedia and INESC TEC’s Centre for Telecommunications and Multimedia (CTM) and the High-Assurance Software Laboratory (HASLab) to continue SP5’s mission of contributing towards accurate and efficient occupant emotional and activity monitoring. The author of this thesis participated in this project since its beginning in December 2021, having collaborated on the definition of the project’s objectives and task planning.
1.5.2 Synergies within the research group
Within the VCMI research group, the author collaborated, in 2018, with Wilson Silva to develop a metric for ordinal classification which takes into account both accuracy and label ranking while retaining robustness to class imbalance [396]. In 2020, the author collaborated with Sara P. Oliveira, Tiago Gonçalves, and Hélder Oliveira, alongside Rita C. Marques and Maria João Cardoso at Champalimaud Foundation (Lisboa, Portugal), on a weakly-supervised methodology based on multiple instance learning to classify HER2 expression in breast cancer histology slides [321].
Since 2020, the author has also been collaborating with Ana F. Sequeira, Wilson Silva, Tiago Gonçalves, and Pedro C. Neto, alongside Arun Ross from Michigan State University (East Lansing, MI, USA) to study biometrics from the perspective of interpretability, rethinking how model accuracy should be measured, and calling for more transparent biometric algorithms [385, 386, 311].
In 2021, the author collaborated with Leonardo G. Capozzi and Ana Rebelo in their work related to person re-identification and scene geolocation for automatic missing person searching [61, 60]. Also in 2021 and 2022, the author has collaborated with Pedro C. Neto, Mohsen Saffari, and Ana F. Sequeira, alongside Fadi Boutros and Naser Damer at Fraunhofer IGD (Darmstadt, Germany), on novel strategies for masked face recognition to uphold state-of-the-art biometric performance amidst a global pandemic [50, 309, 308].
1.5.3 Organisation of scientific events
This doctoral project and the aforementioned collaborations and synergies motivated the contribution to the organisation of multiple scientific events.
In regards to biometrics, the main example is that of the 2020 edition of the International Workshop on Biometrics and Forensics (IWBF), organised by INESC TEC and NTNU, where the author of this thesis collaborated as Demo Chair. He has also helped organise the Workshop on Explainable & Interpretable Artificial Intelligence for Biometrics (xAI4Biometrics), hosted yearly at the IEEE/CVF Winter Conference on Applications of Computer Vision (WACV), as Publicity Chair in 2021 and 2022 and Programme Committee member in 2023.
The collaboration with Pedro C. Neto and Ana F. Sequeira from INESC TEC and Fadi Boutros and Naser Damer from Fraunhofer IGD was enhanced by the co-organisation of the Advanced Occluded Face Recognition (OCFR) competition at the 2022 International Joint Conference on Biometrics (IJCB) [310].
Aligned with the topic of wellbeing monitoring, and as an extension to the Easy Ride and Aurora projects, the author has also co-organised the In-Vehicle Sensing and Monitorization Workshop (ISM). This first edition of the workshop was hosted at the European Conference on Computer Vision (ECCV) in October 2022.
In a broader scope, the author of this thesis has also co-organised the special session on Machine Learning in Healthcare Informatics and Medical Biology at the International Conference on Computational Intelligence Methods for Bioinformatics and Biostatistics (CIBB), in 2019 and 2021. He was also a member of the Technical and Programme committee of this conference for its 2021 edition.
Since 2019, the author has also helped organise the VISUM Summer School on computer vision and machine intelligence. In the 2019 and 2020 editions, he was a member of the project team, while in 2021 and 2022 he was part of the main organisation team.
1.5.4 Supervision of dissertations and internships
The author of this thesis has collaborated, as co-supervisor or external supervisor, on the following master dissertations related to his doctoral studies (in reverse chronological order): {etaremune}
Mariana Silva Xavier (2022), “Inside Out: Fusing ECG and Face Information to Recognise Emotions”, Master in Bioengineering, Universidade do Porto - as co-supervisor, alongside Jaime S. Cardoso (supervisor) [464];
Guilherme Augusto Tiritan Romano Barbosa (2022), “Going 2D: Exploring Learnable Bidimensional Approaches for ECG Biometrics”, Master in Bioengineering, Universidade do Porto - as co-supervisor, alongside Jaime S. Cardoso (supervisor) [26];
Pedro Duarte da Cunha Nunes Lopes (2022), “Deep Neural Networks for Face-based Emotion Recognition”, Master in Bioengineering, Universidade do Porto - as external institution supervisor, alongside Jaime S. Cardoso (supervisor) and Ana F. Sequeira (co-supervisor) [271];
Erfan Omidvar (2022), “Single-Wrist Electrocardiogram Acquisition Application in Biometrics”, Master in Biomedical Engineering, Universidade do Porto - as second co-supervisor, alongside Miguel V. Correia (supervisor) and Duarte Dias (first co-supervisor) [323];
Vítor Hugo Pereira Barbosa (2022), “Robust occupant action classification in shared autonomous vehicles”, Master in Informatics and Computing Engineering, Universidade do Porto - as external institution supervisor, alongside Jaime S. Cardoso (supervisor) and Pedro Carvalho (co-supervisor) [27];
Telma Sofia Caldeira Esteves (2021), “Sleepy Drivers: Drowsiness Monitoring Using ECG and Face Video”, Master in Biomedical Engineering, Universidade Nova de Lisboa - as external institution supervisor, alongside Ricardo Vigário (supervisor), André Lourenço (co-supervisor), and Ana Rebelo (external institution supervisor) [115];
Sofia Cardoso Beco (2021), “Make My Heartbeat: Generation and Interlead Conversion of ECG Signals”, Master in Bioengineering, Universidade do Porto - as co-supervisor, alongside Jaime S. Cardoso (supervisor) [29];
Inês Alexandra Teixeira Antunes de Magalhães (2021), “Feel My Heart: Emotion Recognition Using the Electrocardiogram”, Master in Bioengineering, Universidade do Porto - as co-supervisor, alongside Jaime S. Cardoso (supervisor) [285];
Arthur Johas Matta (2020), “Open-World Face Recognition”, Master in Informatics and Computing Engineering, Universidade do Porto - as co-supervisor, alongside Jaime S. Cardoso (supervisor) [291];
Leonardo Gomes Capozzi (2020), “Face Recognition For Forensic Applications: Methods for Matching Facial Sketches to Mugshot Pictures”, Master in Informatics and Computing Engineering, Universidade do Porto - as co-supervisor, alongside Ana Rebelo (supervisor) [62];
João Manuel Guedes Ferreira (2020), “Head Pose Estimation for Facial Biometric Recognition Systems”, Master in Informatics and Computing Engineering, Universidade do Porto - as co-supervisor, alongside Ana F. Sequeira (supervisor) and Jaime S. Cardoso (co-supervisor) [130];
Carolina Martins Barbosa Rodrigues Afonso (2020), “Changing Perspectives: Interlead Conversion in Electrocardiographic Signals”, Master in Network and Information Systems Engineering, Universidade do Porto - as co-supervisor, alongside Miguel Coimbra (supervisor) [5];
Gabriel Carneiro Lopes (2019), “Don’t You Forget About Me: Enhancing Long Term Performance in Electrocardiogram Biometrics”, Master in Bioengineering, Universidade do Porto - as co-supervisor, alongside Jaime S. Cardoso (supervisor) [270].
Beyond these aforementioned dissertations, the author of this thesis also collaborated in the supervision of more than twenty students on curricular, extra-curricular, and summer internships related to biometrics, pattern recognition, and computer vision topics.
1.6 Awards and Distinctions
Beyond the aforelisted peer-reviewed publications and presentations to the scientific community, the doctoral research work presented in this dissertation has also been the recipient of multiple awards and distinctions. These are listed below:
-
•
The author of this thesis was granted the EAB Max Snijder Award at the European Biometrics Awards 2022 organised by the European Association for Biometrics (EAB). This award recognised the wider perspective and applicability of his work on ECG biometrics, which contributed towards a complete deep learning solution encompassing end-to-end models, learnable template security, and explainability;
-
•
The initial work on the Secure Triplet Loss [345], focused on biometric template cancelability for end-to-end deep models, received the Computers Journal Best Paper Award at the 2020 International Workshop on Biometrics and Forensics (IWBF);
-
•
The work on audiovisual group emotion valence recognition [346] received the Best Session Paper Award at the 2020 IEEE International Conference on Image Processing, Applications and Systems (IPAS);
-
•
The extended work on the Secure Triplet Loss [347], presented at the 2021 NIS Workshop organised by INESC TEC’s Networked Intelligent Systems cluster, received the Best Presentation Award by the official jury.
1.7 Document Structure
This thesis is composed of six parts. Part I is the prologue, which includes this introduction, Chapter 1, and offers an overview of the fundamental concepts related to biometric systems, biometric traits, and wellbeing monitoring in Chapter 2.
Part II focuses on electrocardiogram biometrics, presenting the contributions to this topic produced during the doctoral work. It begins with an overview of the existing data, related literature methodologies, and a discussion of open challenges and opportunities, in Chapter 3. Chapter 4 presents our study on end-to-end deep learning for ECG-based identification, including tailored unidimensional data augmentation strategies. Chapter 5 showcases the work on triplet loss and transfer learning for ECG-based identity verification. A study on long-term performance and template update for identification is presented in Chapter 6. Chapter 7 delves into the topic of explainability for ECG biometrics, aiming to better understand which parts of the signal are best for identification. Finally, Chapter 8 proposes a methodology for recovering missing ECG leads based on blindly-segmented single-lead segments.
Part III deals with face biometrics. Chapter 9 offers an overview of the data, existing methodologies, and open challenges in this topic. Two methodologies to close the performance gap in masked face recognition are presented in Chapter 10. Chapter 11 describes a study on interpretability to understand the decisions of deep learning models in face presentation attack detection and motivate a more widespread usage of interpretability for more transparent biometrics.
Part IV is centred on wellbeing monitoring and covers the topics of emotion recognition, activity recognition, and violence detection. Chapter 12 describes an audiovisual approach developed to classify emotion valence in groups of people. Chapter 13 presents an adaptation of the aforementioned approach for activity recognition and violence detection, alongside a cascade strategy for increased efficiency in in-vehicle scenarios.
Part V covers broader topics related to biometrics and pattern recognition which have been addressed during the doctoral work. Specifically, Chapter 14 introduces the Secure Triplet Loss, a novel approach to ensure biometric template security on end-to-end deep learning models. Lastly, a methodology for self-supervised learning formulated for minimal performance gaps when using sequential data is presented in Chapter 15.
Chapter 2 Fundamental Concepts
Biometric systems are, in several ways, different from other pattern recognition applications. The need for storage of personal data from users and the different modes on which the systems can operate are only some of the special characteristics of biometric systems. When developing one, one should be aware of these specificities to ensure the best performance and robustness.
Hence, this chapter presents the fundamental concepts needed to build a biometric system, either for identity recognition or the monitoring of wellbeing parameters. It includes an overview of the general structure and operation of biometric systems, their security vulnerabilities, the different biometric traits (with a special focus on the electrocardiogram and face), and the metrics for thorough performance evaluations.
2.1 Biometric Systems
2.1.1 General structure
2.1.1.1 Biometric recognition systems
Biometric recognition systems are tools that use hardware and pattern recognition algorithms to compare the identity of a user with that of registered individuals based on their attributes (designated as biometric characteristics or traits). Like traditional identification systems based on keys, cards, or codes, biometric systems are mostly used for access control to restricted places, confidential information, or personal data and belongings [96].
A biometric system is typically composed of an acquisition module, a storage module, and a biometric algorithm. The algorithm can, in turn, be divided into three modules: quality assessment, feature extraction, and decision (see Fig. 2.1) [46, 201]. These modules are described below:
-
•
Acquisition: The acquisition module is the interface between the system and the subject and is responsible for the measurement of the biometric characteristic. The sensors used in this module should be carefully designed to fit the expected application settings and avoid, as much as possible, the noise and artefacts from environmental interference;
-
•
Quality Assessment: This module aims to evaluate the quality of the trait measurement and either accept it in its current form, enhance it to reduce noise and variability effects, or discard it if the quality is unacceptably low;
-
•
Feature Extraction: The feature extraction module is focused on the processing of the acquired measurements, using pattern recognition tools, to extract the most meaningful attributes of the biometric trait and thus enable a robust decision. The feature extraction process should be designed to provide attributes that present high intersubject discrimination power and low intrasubject variability;
-
•
Decision: This module uses the output from the feature extraction module and the stored information from registered users to identify the user, or validate or reject their identity claim. To achieve this, it compares the processed traits of the current user and the registered individuals;
-
•
Storage: The storage module is typically composed of a database that stores biometric templates (processed biometric trait measurements) from all individuals registered on the system. For security purposes, it can include template protection measures, such as hashing, to prevent leaks of sensitive personal information.
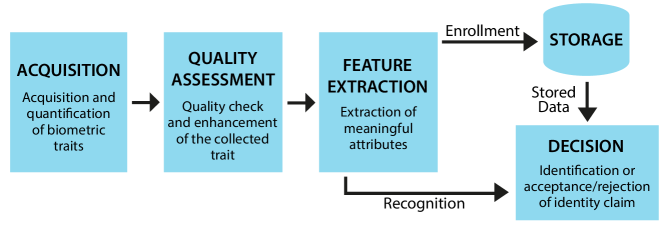
2.1.1.2 Wellbeing monitoring systems
Wellbeing monitoring systems are very diverse due to the variety of parameters these can monitor, which include emotions, stress, fatigue, and health conditions. However, most of these systems follow a general structure that is very similar to that of most biometric recognition systems.
Just like biometric recognition systems, an acquisition module performs the recording of data, which are checked and processed by the quality assessment module. After this, the feature extraction module extracts meaningful attributes from the trait measurements to enable accurate labelling by the decision module.
Most wellbeing monitoring systems do not require a storage module, as biometric templates from the specific set of enrolled subjects will not be required, unlike in recognition systems. This is an advantage in terms of data security and privacy, which will be discussed later.
2.1.2 Operation modes
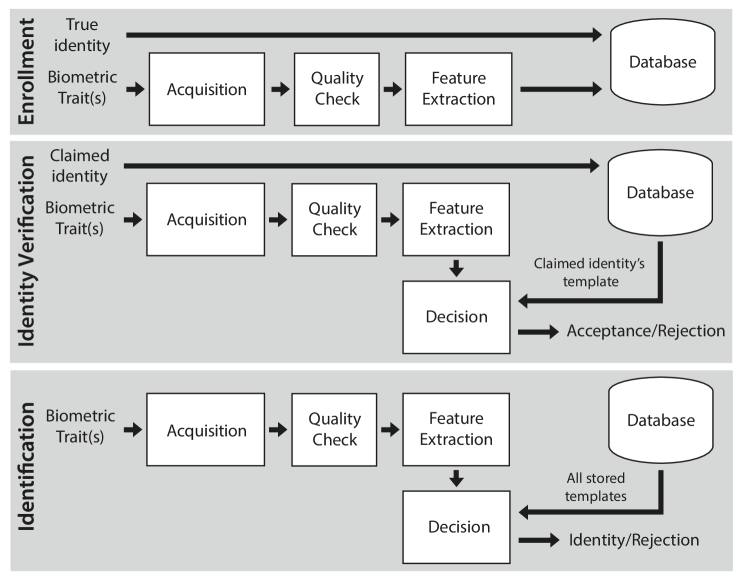
2.1.2.1 Biometric recognition systems
Depending on the application context and its requirements, a biometric system can either operate in identification mode or identity verification mode [351, 46, 7, 201, 2].
In identity verification mode, also commonly called authentication, the biometric system will receive an identity claim along with the biometric measurement (the current user will claim to be a specific enrolled individual). Hence, the decision module will only compare the current measurement with the stored data from the claimed identity, performing a one-vs-one comparison, and either accept or reject the claim.
In the identification mode, the biometric system will only receive the biometric measurement. Thus, the decision module performs a one-vs-all comparison between the current biometric measurement and the data stored for each enrolled individual. Ultimately, the system will either assign one of the enrolled identities (corresponding to the strongest comparison) to the current user or reject to identify (if no comparison was strong enough).
Additionally, biometric systems include the enrollment phase, which comprises the acquisition, processing, and storage of a biometric template of a subject for its registration on the system. After this, the system will be able to correctly perform identification or identity verification when used by the subject [351, 7].
2.1.2.2 Wellbeing monitoring systems
As aforementioned, wellbeing monitoring systems like emotion recognition devices rarely require the storage of personal information from the users. Hence, they dismiss enrollment phases and only operate in one mode: inference. In this mode, a trait acquisition is performed by the system, which will output a corresponding label. The output is composed of discrete categories (e. g., sad, happy, or angry, in emotion recognition) or continuous scores (e. g., from very awake to very drowsy, in drowsiness recognition).
2.1.3 Security and privacy concerns
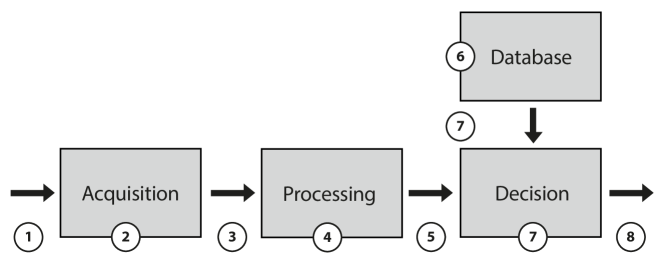
As key protectors of sensitive data, prized possessions, or restricted locations, biometric recognition systems are a prime target for attackers. The literature defines eight attack points (see Fig. 2.3) that sum up the different ways to unlawfully gain access to a biometric system [297, 202, 317]. Considering a general structure (that groups the quality assessment and feature extraction into a single processing module) are described below:
-
•
Type 1 – At the acquisition module: Such attacks are commonly called presentation attacks, as they consist of physically forcing the biometric system to grant access to the attacker, either through the use of fake biometric traits (such as fake fingers, voice recordings, or prerecorded face videos) or even through the physical destruction of the system;
-
•
Type 2 – Between the acquisition and the processing modules: In these attacks, called replay attacks, the attackers will target the communication link between the sensor and the processing module, to steal the trait acquisition. They can then bypass the sensor module by injecting the stolen trait measurements directly into the processing module;
-
•
Type 3 – At the processing module: The processing module can be attacked and overridden by another program, controlled by the attacker, that sends the desired features to the decision module upon request;
-
•
Type 4 – Between the processing and decision modules: These attacks are similar to replay attacks. The attacker will target the link between the processing module and the decision module and steal the features sent between them, to be later injected, bypassing the acquisition and processing modules;
-
•
Type 5 – At the decision module: Here, the attackers can replace the decision algorithms so they can generate high matching scores as requested, thus granting them access whenever desired, or to always output negative decisions, amounting to a denial-of-service attack;
-
•
Type 6 – At the storage module: This consists in exploiting database security flaws to add, modify, or delete templates, to ultimately grant access to unauthorised individuals or deny access to enrolled users;
-
•
Type 7 – Between the storage and decision modules: Here, the attackers intercept the communications between the database and the decision module, to steal biometric templates and replay them later;
-
•
Type 8 – Between the decision module and the application: These attacks consist in the manipulation of the data transmitted between the decision module and the application, e. g., to override a rejection decision.
In ECG-based biometrics, security vulnerabilities are still to be adequately addressed. Despite the pioneer studies of Eberz et al. [110] and Karimian et al. [211], no efforts have yet been devoted to better protect such systems. In general, biometric systems offer undeniable advantages when compared with traditional authentication systems, but this would be meaningless if the system introduced new vulnerabilities that paved the way to successful attacks. Hence, it is very important to remember the attack points presented above and their specificities throughout all stages of the development and deployment of a biometric system.
Of all modules, storage is one of the most sensitive, as it stores personal data that could be used to unlawfully access private information and belongings. These intimate data are not specific to a single application and can be used by their legitimate owner as a single credential on several biometric systems (e. g., a user could use fingerprint-based access on two different computers). This is an obvious vulnerability as, just like using the same password for several online services, a single security failure can risk the privacy of the user on several applications [200].
Regardless of how sophisticated the database is, it can still be accessed or hacked by intruders who exert enough effort. Besides working towards more secure databases, it is paramount to prepare for possible successful attacks and ensure biometric templates cannot be retrieved in those cases [200, 186]. Hence, regarding biometric template security, it is important to take into account the following factors:
-
•
Non-Invertibility: The processing module should be designed in a way that eases the creation of templates from biometric trait acquisitions. However, the retrieval of a close approximation of the original trait measurement or feature set, from a stored template, should be difficult and sufficiently time-consuming to render the process unfeasible or unattractive for attackers;
-
•
Revokability/Cancelability: Keys can be changed when moving to a new house, and users can easily change e-mail passwords after they have become compromised. However, biometric systems rely on intrinsic personal characteristics, such as facial features or fingerprint minutiæ, which are very difficult (or even impossible) to be changed. Hence, biometric systems should include measures that allow the easy invalidation of templates when these have become compromised. Thus, intruders will be denied access when using those credentials, but legitimate users will still be allowed to authenticate using their unchanged biometric trait;
-
•
Unlinkability: For improved performance, a single biometric system can store, separately, more than one template for each user. The data protection scheme should ensure that the comparison between stored templates does not enable an attacker to cluster them by identity. This should also be difficult with templates from the same user in different biometric systems so that attackers are not able to attack multiple systems with a single stolen template [186, 304].
Besides these factors, the biometric system should also be able to deal with the characteristic variability of biometric traits and their measurements. Methods like hashing are commonly used for passwords, but such traditional credentials do not present variability. With biometric systems, small variations of the input should be considered normal and acceptable (e. g., with the face, different haircuts or beard styles), and should not influence the final decision. When designing a secure biometric system, it is necessary (although hard) to find an equilibrium between non-invertibility, unlinkability, and the controlled acceptance of natural intrasubject variability.
2.2 Biometric Traits
2.2.1 General overview
| Trait | Benefits | Drawbacks |
| Electrocardiogram | ||
| (ECG) | Universality | |
| Hidden nature | ||
| Simple acquisition | Requires contact | |
| Variability over time | ||
| Electroencephalogram | ||
| (EEG) | Universality | |
| Hidden nature | Expensive equipment | |
| Vulnerability to noise | ||
| Variability over time | ||
| Face | Easily measurable | |
| Affordable equipment | Easy circumvention | |
| Depends on face visibility and lighting | ||
| Fingerprint | High performance | |
| Permanent over time | Requires contact | |
| Gait | Easy to measure | |
| Affordable equipment | Low performance | |
| Variability over time | ||
| Iris | High performance | Expensive equipment |
| Palmprint | High measurability | |
| Permanent over time | Requires contact | |
| Photoplethysmogram (PPG) | Easy to acquire | |
| Hidden nature | ||
| Affordable equipment | Low performance | |
| Variability over time | ||
| Voice | Affordable equipment | Low performance |
Biometric traits are human attributes that include enough personal information to reliably serve as the basis for the recognition and discrimination of individuals [9, 213]. According to the identity information they carry and the performance they can offer, biometric traits can either be considered hard traits, strong enough to be standalone traits in a reliable biometric system, or soft traits, which need further traits or information to offer acceptable recognition performance (see Table 2.1).
Traits can be categorised according to their nature, as anatomical, physiological, or behavioural traits. Anatomical traits result from measurements of parts of the human body and include the fingerprints, the face, and the iris. Physiological traits are those that originate from physiological events in the body and include the heart rate, facial or hand thermography, the electrocardiogram (ECG), and the electroencephalogram (EEG). Behavioural traits originate from a person’s actions or behaviours, such as their gait (walking cadence), their signature, or their voice [2, 9].
The quality of a biometric trait can be defined, as proposed by Jain et al. [199], through seven different aspects:
-
1.
Universality: the trait should be present in all subjects using the system;
-
2.
Uniqueness: the trait should include enough personal information to present differences between all subjects, and thus allow their identification;
-
3.
Permanence: despite the intersubject variability desired (uniqueness), the trait should be sufficiently stable over time (reduced intrasubject variability) to allow the identification through the comparison of measurements in different instances;
-
4.
Measurability: the trait should be easily and comfortably acquired and digitised, and its representation should allow easy processing and measurement;
-
5.
Performance: a system based on such a trait should meet or exceed the recognition accuracy requirements, set by the context in which it will be applied;
-
6.
Acceptability: there should be no foreseeable reservations that could make the subjects unwilling to allow the trait acquisition;
-
7.
Circumvention: the trait should be as hard as possible to mimic or counterfeit, in any way, to prevent spoofing of the biometric system.
Abo-Zahhad et al. [2] compared sixteen biometric traits according to their compliance with each of the seven defined qualities. In that comparison, it is possible to verify that the traits with the lowest overall quality are the behavioural ones (gait, keystroke, signature, and voice) and phonocardiogram (heart sounds), with low performance, permanence, and distinctiveness. Low circumvention and universality are also downsides of behavioural traits. The traits with reported highest overall quality are the DNA, facial thermogram, fingerprint, iris, palm print, and ECG. Overall, the electrocardiogram excels in most factors, with just two ‘average’ scores (for collectability and acceptability).
Traits like fingerprint, face, signature, iris, and voice have been the most studied. However, these have long seen a quick growth and evolution of spoofing methods (methods of counterfeiting a certain user’s trait to unlawfully gain access through the biometric system), which urges researchers to find more robust alternatives [213, 13].
Throughout this doctoral work, the focus will be on the electrocardiogram (ECG), an emerging biometric trait that offers unique advantages regarding inherent liveness, anti-spoofing abilities, and wellbeing insight. Its performance and robustness drawbacks shall be mitigated through its fusion with face, a well-established and robust biometric trait. Hence, the next subsections consist of a presentation of both biometric traits, the ways to measure them, and the variability factors that provide them with identity and wellbeing information.
2.2.2 Electrocardiogram
The electrocardiogram (ECG) is a physiological signal generated from the contraction and the recovery of the heart, that has been gaining traction as a biometric trait [343]. The heart has three main functions: generate blood pressure to keep blood circulating, route venous and arterial blood to the respective parts of the body, and regulate blood supply according to the metabolic demands [428]. To do this, the heart needs to contract and relax its muscle, the myocardium, through the controlled generation and flow of depolarisation and repolarisation currents [377, 428].
The measurement of such currents using electrodes placed on the body is designated as electrocardiography and results in the electrocardiographic (ECG) signal. In normal conditions, the ECG is a cyclic repetition of five easily recognisable deflections: the P, Q, R, S, and T waves (see Fig. 2.4). A group of these deflections comprises a single heartbeat and each deflection can be traced back to the phase that originated it [377, 428, 286].
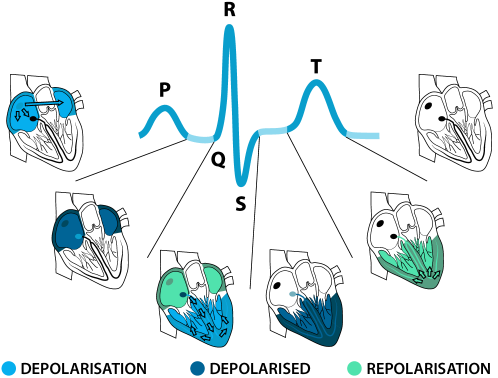
2.2.2.1 Acquisition
The configurations used for the acquisition of ECG signals for biometric purposes have greatly evolved. From the first ECG-based biometric research works, considerable efforts have been devoted to more usable and comfortable acquisition technologies. This aims to place the ECG as a more attractive alternative to established biometric traits, mitigating the main disadvantage of the ECG, the obtrusive measurement techniques [343].
In early ECG-based biometrics research, recordings from the standard 12-lead or Frank leads were commonly used for the development and evaluation of algorithms [349, 463, 144]. These are two defined and established configurations of electrodes for standardised and comparable ECG measurement (see Fig. 2.5), widely used for the diagnosis of cardiac disorders. Authors frequently selected certain leads for their biometric algorithms, especially Lead I [327, 490, 298] (because of its higher acceptability due to the electrode placement on the wrists), but also Lead II [233, 234, 303, 332], or chest leads [235, 122, 472].
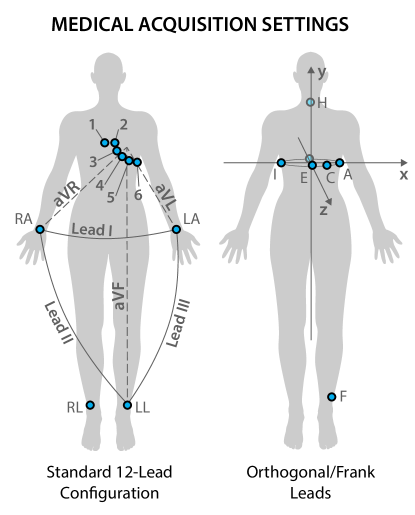
Some researchers opted for acquisitions without movement restrictions and with fewer electrodes. Prominent choices in the literature include Holter systems (see Fig. 2.6), which are prepared to acquire ECG signals for several hours while the subjects move and perform their daily activities. These were first used for ECG biometrics by Shen et al. [389], using ambulatory recordings from the MIT-BIH Normal Sinus Rhythm database, acquired for thirty minutes using Holter equipment. Labati et al. [236, 237] used 24-hour-long Holter acquisitions, from the E-HOL 24h signal collection, and seized the opportunity to study the effect of ECG variability over time on identification performance. Similarly, Zhou et al. [493] used a mini-Holter system to continuously record ECG signals.
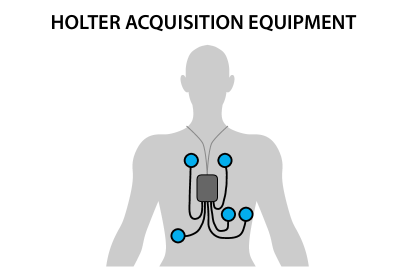
Medical and Holter systems are designated as on-the-person acquisition settings. These present considerable drawbacks for biometric purposes, mainly concerning user comfort during acquisition due to the high number of electrodes and their placement on the chest and legs of the users. Although allowing for longer acquisitions with movement and activity, Holter acquisitions still require the placement of electrodes on the torso. This significantly reduces acquisition acceptability and comfort and damages the ECG strength as a biometric trait.
To improve acceptability and acquisition comfort, and get closer to biometric systems deployable in real settings, wet electrodes are being replaced by dry metallic electrodes, their number has been reduced to two or three, and their placement has been confined to the upper limbs, especially the on wrists, hands, or fingers (see Fig. 2.7). These acquisition configurations were designated as off-the-person settings. The first research works in ECG biometrics to use such signals were, to the best of our knowledge, Molina et al. [298], who used commercial metallic electrodes strapped to the wrists of the subjects, and Chan et al. [69], who acquired ECG signals using dry button electrodes held by the subjects in contact with their thumbs.
Since then, ECG signals have been recorded using metallic rod electrodes [390, 32, 33, 261], and dry metallic electrodes mounted on plaques [275] or attached to the users’ fingers [289], which offer increased comfort over on-the-person techniques. Nevertheless, off-the-person systems still require the user to hold the electrodes or deliberately place the fingers or palms over them. This prevents us from designating them as unconstrained systems, which puts the ECG at a disadvantage over other biometric traits. Besides this, the use of dry electrodes in farther placements makes the acquisition more vulnerable to interference, thus affecting the quality of the signal [32, 394].
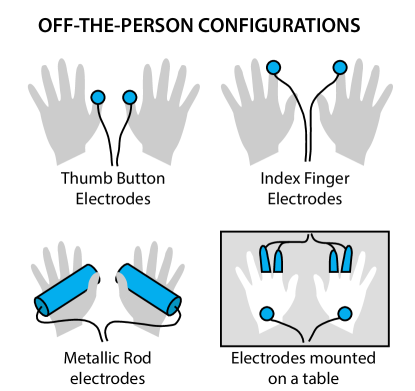
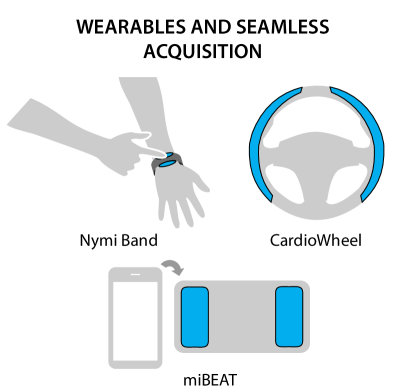
Recently, some researchers have tried to improve off-the-person configurations and approach unconstrained settings in ECG biometrics. They aimed to close the gap to real, commercial applications by developing wearable technologies for ECG acquisition or embedding the sensors into common objects (see Fig. 2.8). In research, the first example of this highly acceptable acquisition was a sensor pad to be used alongside a computer keyboard, to acquire ECG signals continuously during computer use [86, 87, 393]. More recently, Zhang et al. [484] have shown it is possible to acquire ECG signals from a single arm and successfully used them for biometric recognition.
As for commercial applications, the Nymi Band [11], a wearable wristband, acquires the ECG using two metallic electrodes on its inner and outer surfaces. Identity verification is performed when the band is put on and the session remains open until the band is taken off. While a session is open, the Nymi Band broadcasts an identity signal to authenticate the user in other nearby systems. The CardioWheel [279] is a steering wheel cover that uses conductive leather for seamless and continuous biometric recognition and health monitoring of drivers, focused on automatic personalisation of driving settings and remote fleet supervision.
The miBEAT [471] is a versatile platform for the simultaneous acquisition of ECG and photoplethysmography (PPG) signals, which can be used for seamlessly integrated signal acquisition in smartphones or tablets. AliveCor provides a set of commercial solutions for easy ECG acquisition in the Kardia 111Kardia by AliveCor. Available on: https://www.kardia.com/. lineup, including the KardiaMobile, to be used with typical smartphones, and the KardiaMobile Card, a credit card-sized slim single-lead acquisition device with integrated metallic electrodes.
These recent efforts have brought ECG biometrics closer to viable and unconstrained applicability. However, these newer technologies still require the users to wear certain products or perform specific actions and need contact with both limbs during acquisition. Besides this, the quality of the acquired signals is typically very low, because of the loose contact with the subject’s skin, suffering from wide impedance variations, sensor saturation, and contact loss artefacts.
Some researchers have already started to address these issues. The single-arm acquisition settings studied by Zhang et al. [484] and the contactless electrodes developed by Chi et al. [75] raise new and inspiring possibilities for wearable ECG devices. For applications based solely on heart rate, techniques have been proposed to measure it at a distance, using microwave Doppler sensors [376, 316, 48].
These efforts pave the way for better ECG acquisition technologies. Such systems could consist of seamlessly integrated biometric systems that can acquire ECG signals at short distances from one hand of the user, without requiring contact and thus suffering from signal loss. For wearables, the future could reside in products that can continuously monitor the users’ ECG while only contacting with one of their wrists, or when inside their pockets separated from the body by clothes. Despite all efforts devoted so far to ECG biometrics, much work is still needed to reach true applicability in the form of real, comfortable, and easy-to-use ECG-based biometric systems.
2.2.2.2 Variability
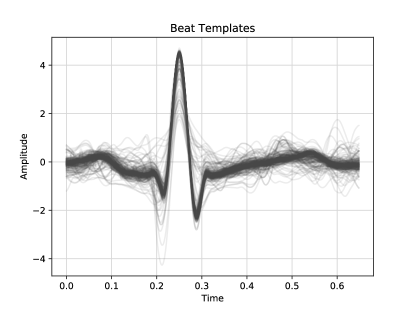
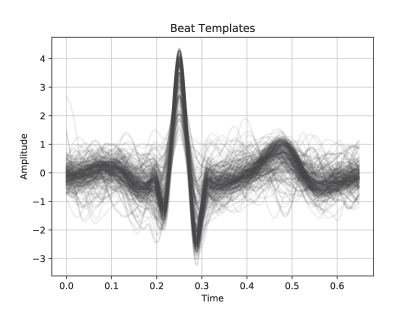
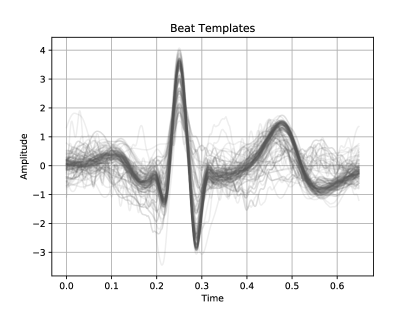
Although the ECG signals present, in normal conditions, the same deflections for all subjects at all times, these are characterised by a high degree of variability (see Fig. 2.9). Variability in the ECG can be designated as intrasubject, the variations between cycles (heartbeats) in the electrocardiogram of a single subject, or intersubject, the variations between heartbeats of different subjects. Intrasubject variations on the ECG signal are mainly explored for health monitoring and medical diagnosis [8, 370, 164], while intersubject variations are especially useful to discriminate between subjects in biometric recognition. Both intrasubject and intersubject variability can originate from several factors, such as:
-
•
Heart Geometry: Heart size, cardiac muscle thickness, and the overall shape of the heart influence the trajectories of electrical currents throughout the heart, the number of muscle cells that will conduct those currents, and the time to do it across the whole heart. Athletes, because of intensive physical training, commonly have thicker myocardia, which affects the ECG with higher voltages in the QRS complex, and lower basal heart rates [171, 441, 172];
-
•
Individual Attributes: Age, weight, and pregnancy are some individual attributes that can cause shifts in the heart position and orientation. These shifts will change the orientation of the electrical current conduction vectors across the heart, meaning the electrodes will detect the signal from a different perspective, thus altering the ECG waveforms [379];
-
•
Physical Exercise or Meditation: The duration of, and intervals between the different deflections of the heartbeats in an ECG signal, vary with the heart rate. These changes are especially visible on the interval between the QRS complex and the T wave in situations of tachycardia (higher heart rates) or bradycardia (lower heart rates). Changes in the heart rate caused by physical exercise or meditation are reflected on the electrocardiogram [10];
-
•
Cardiac Conditions: Medical conditions of the heart can also interfere with the dynamics of electrical pulse conduction and generate variability. In biometrics, one of the most studied conditions is Arrhythmia, which causes wide variations in the heart rate across time and, as reported by several researchers, can consistently shrink the performance of ECG-based biometric systems [472, 9, 369].
-
•
Posture: Postures such as standing or laying down change the position and shape of internal organs. The heart is also affected by this, changing its position in the thorax, and thus its position in reference to the electrode placement, which will cause variations in the collected ECG signal [379];
-
•
Emotions and Fatigue: The sympathetic and parasympathetic systems of the autonomous nervous system work to, respectively, increase or reduce the heart rate. These systems are under the direct influence of psychological states and thus, under stress, fear and other strong emotions, fatigue or drowsiness, the heart rate and the ECG signal can be affected [10, 370];
-
•
Electrode characteristics and placement: The type, the size, and the number of electrodes, whether they are wet or dry, and the positioning on the chest or limbs, can influence the dominance of noise on the signal. The mispositioning of electrodes and reversal of leads are also sources of variability, as they change the perspective of detection of the electrocardiographic signal [171, 379].
All the previously presented factors change the morphology of the electrocardiographic signals acquired from an individual. The first two factors contribute more to intersubject variability and the biometric potential of the ECG signals. The remaining factors are the main origins of intrasubject variability, which may undermine the process of biometric recognition, but offer the ECG information on several health and wellbeing parameters. When considering the acquisition of ECG for a specific application, whether for medical or biometric recognition, it is paramount to consider these factors, the way they can ease or difficult the task at hand, and how to mitigate their negative effects.
2.2.3 Face
The face may be considered the most intuitive of all biometric traits, since humans use facial features as the main clues for the identification of other people. Despite the challenges in its use for biometric recognition, the face offers the unique advantage of being the only trait that can be acquired using sensors at a considerable distance from the user, possibly without their knowledge [55, 166]. Below, the ways to measure the face trait and the factors that may affect the measurement are described and discussed.
2.2.3.1 Acquisition
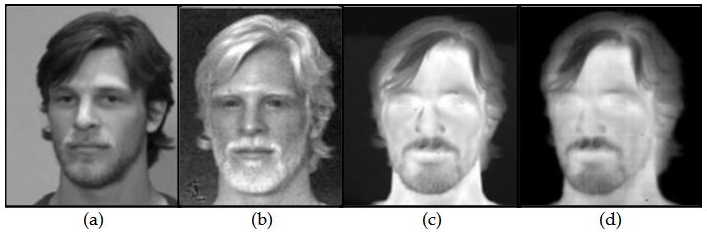
Among widespread and inexpensive cameras and sophisticated thermal sensors, the face trait can be acquired in the following settings [21, 123]:
-
•
Visible Spectrum: This is the most common setting in face biometrics. Visible light, with a wavelength in nm, generally from natural and unconstrained sources in the application environment, is reflected by the face of the user and captured by the sensor. Using the visible spectrum of light has some disadvantages, discussed in subsubsection 2.2.3.2, but it is commonly less expensive than the alternatives and, thus, the most fitting option for widespread applications.
-
•
Infrared Spectrum: To overcome some limitations of the use of visible light, some sensors acquire the face trait using the infrared spectrum. These use thermal cameras that can obtain reliable face images in a much wider range of lighting conditions, capturing the heat from blood vessels and tissues on the user’s face. Based on the wavelength range, these can be designated as Near-Infrared (NIR, nm wavelength), Short-Wave Infrared (SWIR, nm), Mid-Wave Infrared (MWIR, nm), or Long-Wave Infrared (LWIR, nm). These are compared with visible light images in Fig. 2.10.
Depending on the frequency spectra used, the face trait can be categorised as either anatomical (visible light), or physiological (infrared spectrum). This is because the former mostly captures anatomical features of the face, while the latter is much more dependent on physiological factors that affect blood flow and face heat patterns.
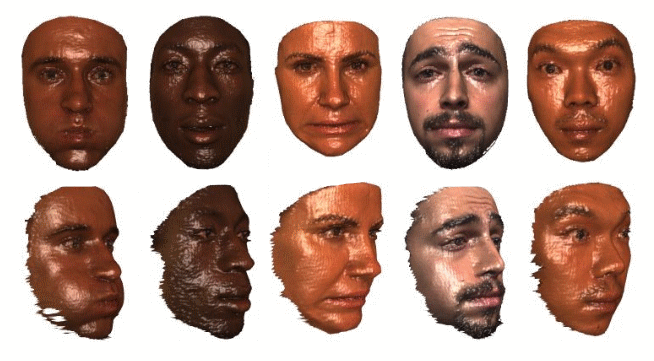
The face trait measurements can be acquired simultaneously with depth information, resulting in an upgrade of 2D images to 2.5D or 3D. While 2D data only includes colour or greyscale pixel information, 2.5D data combines that with depth information about the face of the subject, which is useful to increase recognition accuracy or avoid attack attempts. 3D data is a further step, where both sources of information are fused to build tridimensional models of the subject’s face (see Fig. 2.11) [77, 55].
2.2.3.2 Variability
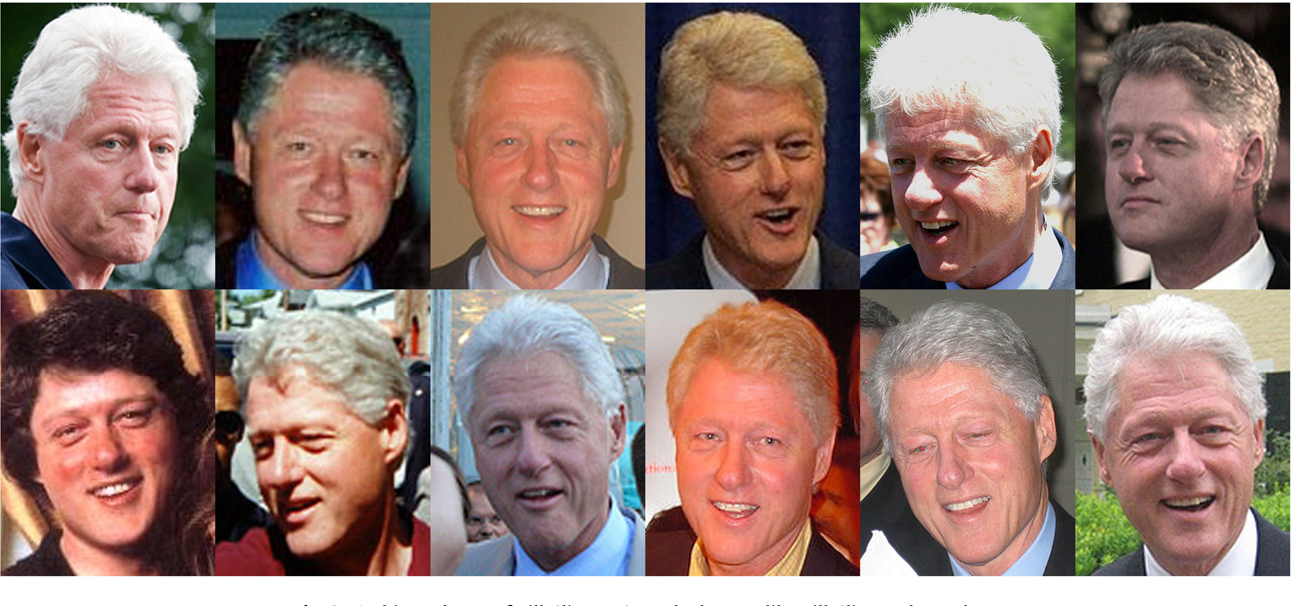
The measurement of the face trait is affected by several intrinsic, environmental, or operational factors (see Fig. 2.12). These can enhance intersubject or intrasubject variability, and thus make the recognition task easier or more difficult [4, 21, 55, 102, 103]. These factors are:
-
•
Illumination and Heat Sources: This factor is most relevant for visible spectrum acquisition settings, as the illumination with visible light will directly affect the light received by the sensor and change the face image. In infrared images, the influence of illumination can also be felt, due to the heat generated by light and heat sources, although generally in a lesser degree than in the visual spectrum;
-
•
Pose Variations: Variations in pitch, roll, and yaw of the subjects head, relative to the sensor, will result in the capture of facial features in different perspectives, which may encumber pattern recognition tasks. Moreover, the relative position of those facial features will also suffer from pose variations. Some authors argue infrared imaging is less susceptible to pose variations than visible spectrum sensors [135];
-
•
Facial Expressions: Like pose variations, facial expressions change the relative positions of the facial features, which may encumber the task at hand. Furthermore, it may create new features (e. g., wrinkles) or hide facial features that would be needed for the task. As with the previous factor, facial expressions were found to have less impact in infrared imaging [135];
-
•
Stress, Emotions, and Illnesses: Stress, emotions like happiness and fear, or illnesses like headaches or tooth infections can influence facial expressions. But more than that, they change the heat patterns on a subject’s head, which will influence the face images captured by infrared sensors;
-
•
Age: Growing old is generally accompanied by expression wrinkles, grey hair, among other changes that may affect someone’s appearance and make it more difficult for them to be recognised;
-
•
Cosmetics, Tattoos, Disguises, and Accessories: Makeup, face tattoos, disguises, and accessories like rings or piercings can change, hide, or create new facial features. Recognition algorithms may not be prepared to deal with this new information and be induced into errors;
-
•
Occlusions and Surrounding Objects: Like disguises and accessories, objects surrounding the person can sometimes occlude part of the face of the subject, and thus hide certain facial features that could be key for the recognition task at hand;
-
•
Sensor Quality and Stability: The sensor is another important variability source. Using different cameras, with different characteristics, will result in different face images. Furthermore, the movement of the cameras (just like the movement of the subject) can cause blurred images that will disable the retrieval of finer facial features.
Like with the electrocardiogram, it is important to appropriately weigh all these factors when designing a biometric system. Some will contribute more to intersubject variability, and will be desirable for biometric recognition, while others will enhance intrasubject variability, and empower wellbeing monitoring. Considering the task at hand, it is key to design the acquisition and processing stages to focus on the factors that fit the application needs.
2.3 Performance Evaluation
2.3.1 System design considerations
When designing, developing, and deploying a biometric system, it is important to be aware of how it will behave in realistic conditions. Hence, designers and developers should consider some central aspects, as described by Bolle et al. [46]:
-
•
System accuracy: This measures the frequency with which the biometric system makes correct or wrong decisions;
-
•
Computation time: This corresponds to the time required by the system to output a decision, starting from the moment the user initiates contact with the acquisition module. This time depends on the processes of trait acquisition, quality assurance, feature extraction, and decision, and should be as low as possible, to improve usability. This aspect is especially important for continuous recognition systems, where decisions should be quickly output and frequently renewed;
-
•
Exception handling: Because of universality issues and sensor flaws or unavailability, some users may find the system unable to acquire their biometric traits. Also, software errors may occur and render the system incapable of adequately performing its function. These possibilities should be addressed during system design and development, to ensure the application works even without the biometric system;
-
•
System cost: The system cost includes all expenses related to acquisition and processing equipment needed, algorithm development and implementation, routine maintenance, and operational costs. It should be as low as possible, to make the biometric system more affordable;
-
•
Security: Biometric systems decisions can serve as proof of the actions of a certain individual, and this, in some settings, can escalate to serious legal implications. Thus, it is important to minimise the possibility of decision flaws that allow impostors to act under the identity of an authorised person;
-
•
Privacy: Biometric systems require the storage of templates, consisting in discriminating information about each of the enrolled individuals. That information, in the interest of anonymity and security, should be kept as safe as possible, resorting to encryption techniques that allow matching but minimise the possibility of reconstructing the original acquired trait data.
Some conflicts may exist between these aspects. Using more sophisticated approaches (such as deep learning) often leads to higher system accuracy, but at the expense of higher computational complexity. Using passwords or credentials as a fallback in case of an exception weakens system security. Tighter security measures generally lead to more frequent rejection of legitimate users, which translates into reduced accuracy.
Ultimately, trying to fully cover all aspects will increase costs. Hence, all these aspects should be carefully analysed and weighted, considering the expected application to get an affordable, efficient, accurate, secure, and usable system. In the next subsection, the most relevant metrics are presented, regarding the specific aspect of system accuracy.
2.3.2 Recognition accuracy measurement
| Metric | Definition | |
| Identity verification | False Acceptance Rate | |
| False Rejection Rate | ||
| Equal Error Rate | , for that gives | |
| Area Under the Curve | ||
| Identification | True Positive Identification Rate | |
| Identification Rate | ||
| Misidentification Rate |
2.3.2.1 Identity verification
As described before, identity verification consists in accepting or rejecting an identity claim made by a user based on their biometric trait measurements. As such, there are four outcomes:
-
1.
The claim is true and the system correctly accepts it;
-
2.
The claim is false and the system correctly rejects it;
-
3.
The claim is true, but the system incorrectly rejects it;
-
4.
The claim is false, but the system incorrectly accepts it.
In identity verification, the main goal is to minimise the frequency of outcomes three and four. Outcome three corresponds to a False Reject or False Non-Match error, and outcome four corresponds to a False Accept or False Match error. These errors are the foundation for most identity verification accuracy metrics (see Table 2.2), among which the two most commonly used are [46, 155, 7]:
-
•
False Acceptance Rate ( or , False Match Rate): measures the fraction of trials where the system accepted the identity claims, even though they were false. It represents how frequently the system erroneously grants access to impostors. The complement of is called Convenience;
-
•
False Rejection Rate ( or , False Non-Match Rate): measures the fraction of trials where the system rejected true identity claims. As such, it measures how frequently the system denies access to legitimate users. The complement of is designated as Security.
For a given system, these two metrics commonly depend on the chosen operation point. For example, in similarity or dissimilarity-based matching algorithms, the criterion for accepting or rejecting a claim is generally a threshold. Different threshold values will correspond to different and results. Hence, for a more complete performance evaluation, it is common to use performance characteristic curves such as the Receiver Operating Characteristic (ROC), which plots versus for varying threshold values (see Fig. 2.13).
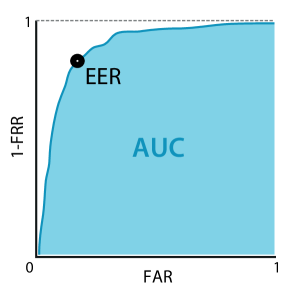
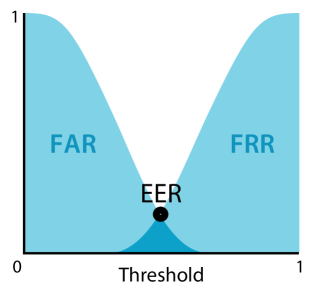
From the ROC curve, it is also common to extract two metrics that combine all results into a single performance value, easing performance comparison between algorithms. The Equal Error Rate () is the error that corresponds to the operation point where and represents an equilibrium between convenience and security (see Fig. 2.13). The Area Under the Curve () measures the area under the ROC curve and serves as a measure of overall quality of a biometric system.
2.3.2.2 Identification
In identification, the system does not receive an identity claim. Hence, it will compare the current biometric measurements with the stored templates to assign one of the enrolled identities to the subject. Additionally, it can reject to identify when the strongest match is, still, not strong enough, which is generally asserted based on a threshold (as in identity verification mode).
Thus, in the identification mode, there are five possible outcomes:
-
1.
The subject is enrolled and the system correctly identifies them, granting them access;
-
2.
The subject is enrolled, but the system mistakes their identity for another enrolled subject, granting them access under a wrong identity;
-
3.
The subject is enrolled, but the system fails to identify them with any enrolled subject, rejecting access;
-
4.
The subject is not enrolled and the system correctly rejects access;
-
5.
The subject is not enrolled, but the system erroneously identifies them as one of the enrolled subjects and grants them access.
A good biometric system would maximise the frequency of outcomes 1 and 4 and minimise the frequency of the remaining outcomes. Most metrics for identification mode (see Table 2.2) are based on these frequencies [46, 155, 7]. Regarding the situations where the subject is enrolled (designated as legitimate trials), the most common metrics are:
-
•
True-Positive Identification Rate ( or Hit Rate): For a total number of legitimate trials, corresponds to the fraction of those where one of the system’s strongest predictions corresponds to the true subject identity. As most other metrics, depends on the defined threshold, the selected number of top ranks , and the list of enrolled candidates (in identification, each enrolled subject is considered a candidate, and TPIR, as most metrics, varies not only with the size of but also with the variety and individual characteristics of each subject in );
-
•
Identification Rate ( or Accuracy): corresponds to when only the single highest ranking prediction is considered (). It corresponds to the fraction of the legitimate trials where the true identity was the method’s strongest prediction above the threshold. In the literature, this is one of the most used metrics;
-
•
Reliability: Reliability corresponds to with (where is the number of enrolled subjects), we get the reliability metric. This measures how frequently the true identity satisfies the minimum threshold constraint, regardless of its ranking;
-
•
False-Negative Identification Rate ( or Miss Rate): Represents the fraction of trials where the true identity does not correspond to one of the strongest predictions above the threshold ;
-
•
Reject Rate (): This metric pertains to the very specific situations where all identity predictions stand below the defined threshold , and the system has no choice but to reject to identify ();
-
•
Misidentification Rate ( or, commonly, Misclassification Error): is the complement of (), equivalent to with , and measures the fraction of legitimate trials where the true identity is not the system’s top ranking prediction above .
Regarding situations where the subject is not enrolled in the biometric system (designated as impostor trials), the most common metrics are:
-
•
False Positive Identification Rate (): It is the fraction of impostor trials where at least one of the system’s predictions meets the threshold criterion, and the system thus grants access to the unenrolled subject;
-
•
Selectivity: Similar to , selectivity counts the average number of predictions above the threshold across all impostor trials.
As in identity verification mode, some characteristic curves can be drawn based on these metrics and the defined thresholds, to help evaluate the algorithms more robustly. The first is the Cumulative Match Characteristic (CMC), which plots with threshold against , varying . The second is the Receiver Operating Characteristic (ROC) which, in the case of identification, plots Reliability against , for various threshold values (see Fig. 2.14). From these plots, we can also extract the and metrics.
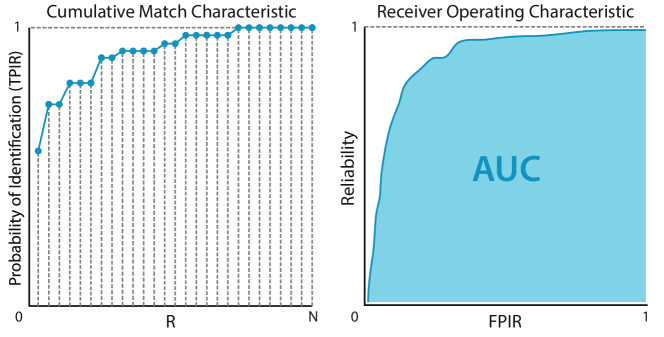
2.3.3 Time-based performance measurement
There are biometric systems that perform recognition upon request, for example in computers or smartphones, keeping the session open until the user ends it or it reaches an idle time limit. This creates security issues, specifically when the user leaves the device unattended and forgets to close the session.
To solve this issue, there are continuous (or online) biometric systems, that aim to perform biometric recognition in real-time, acquire traits continuously, and renew decisions as frequently as possible based on the most recent acquisition. With such systems, if the user leaves and is replaced by an attacker, the system would be able to detect this and close the session before any harm could have been done.
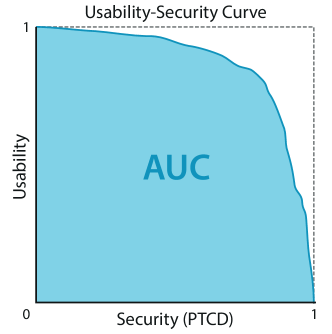
Besides accuracy, an important facet of performance evaluation for continuous biometric systems is timeliness. Sim et al. [400] have addressed this issue and proposed some time-based metrics for the evaluation of continuous identity verification systems. These can be adapted for both identification and identity verification, as described below:
-
•
Time to Correct Decision (): measures the time the system takes to detect an impostor, and take an appropriate decision, relative to the moment the impostor replaces a legitimate user. For an ideal system, this should be zero, but that is virtually impossible to achieve. Hence, Sim et al. [400] state that this window should at least be always lower than , called Window of Vulnerability (the minimum access time required for the impostor or wrong individual to cause any kind of damage);
-
•
Probability of Time to Correct Decision (): measures the probability, for a given system, of being lower than . The higher this value, the lesser the probability of an impostor having time to cause damage before the system acts;
-
•
Usability: In a normal continuous biometric system, we should expect some decisions to be incorrect. Over seconds of usage, Usability measures the fraction of where the legitimate user is deprived of access due to wrong decisions of the system. For any biometric system, this should be as close to zero as possible.
From these metrics, the authors also define the Usability-Security curve (USC), a new characteristic curve that plots Usability vs. for a varying threshold (see Fig. 2.15). USC is similar to a ROC curve and, thus, can also be computed, being considered a good metric to evaluate the timeliness of a biometric system.
2.3.4 Wellbeing monitoring performance measurement
For wellbeing monitoring systems, several metrics have been used to measure their performance [299]. The choices depend on the nature of the ground-truths and system outputs.
For example, emotion recognition or affective computing algorithms generally focus either on a limited set of discrete emotion categories or on continuous ranges of emotion qualifiers. In the former case, they typically cluster all emotions onto six categories designated as the six basic emotions by Ekman [112]: happiness, sadness, anger, fear, surprise, and disgust.
For systems based on categorical labels such as these, the most common metrics are:
-
•
Accuracy: The accuracy is the fraction of test samples that have been correctly classified by the algorithm. It is widely used in wellbeing monitoring applications;
-
•
F1-score: The F 1-score is the harmonic mean of precision (the fraction of positive predictions that are truly positive) and recall (the fraction of positive samples that are classified as such), through the expression . It is commonly used to evaluate performance in binary tasks;
-
•
AUC: The Area Under the ROC Curve, which plots sensitivity (the fraction of positive samples correctly classified) versus the complement of specificity (specificity, the fraction of negative samples incorrectly classified as positive) for several thresholds, is also commonly used for binary classification tasks.
In the case of continuous labels, emotion recognition systems typically consider a bidimensional space with two main emotion qualifier variables: valence and arousal [240]. Valence measures the pleasure of the emotion being felt, ranging from negative (unpleasant) to positive (pleasant). Arousal measures the level of activation or intensity of the emotion, ranging from low (passive) to high (active). Fig. 2.16 illustrates these concepts by offering examples of categorical emotions in the bidimensional valence-arousal space.
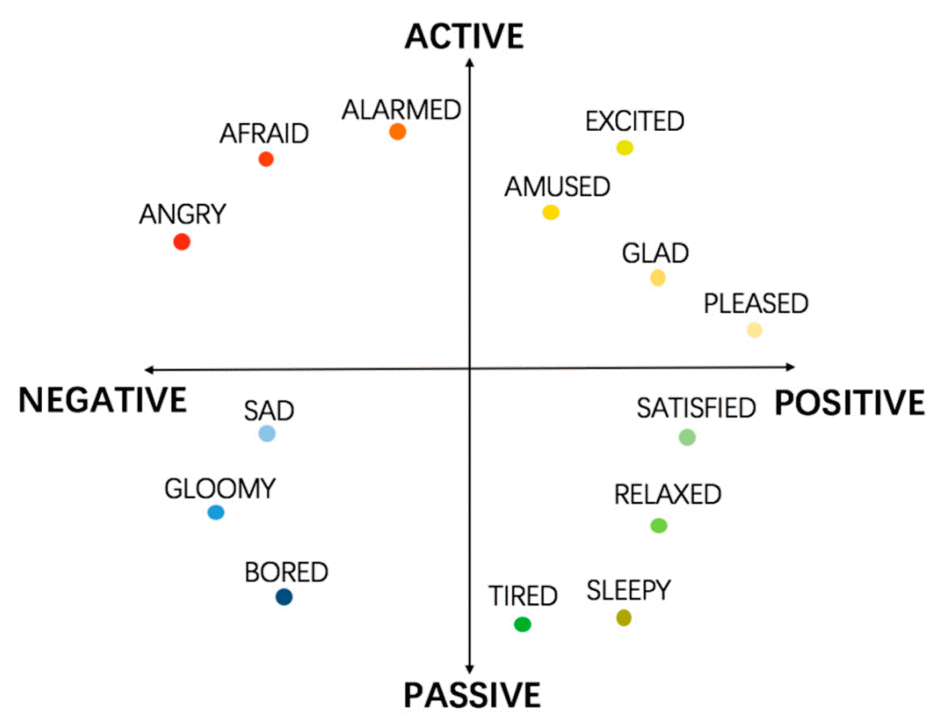
For systems focused on regression tasks such as these, outputting continuous scores, the most common metrics are:
-
•
Root Mean Squared Error (): is the root square of the mean of all squared differences between corresponding predictions and ground-truths;
-
•
Pearson’s Correlation Coefficient (): To correct the limitations of , the Pearson’s correlation coefficient uses the covariance between predictions and ground-truths . It follows the expression ;
-
•
Concordance Correlation Coefficient (): This metric is used for time-series predictions, based on the Pearson’s correlation coefficient and the mean value of each time series, following the expression . This is a very common metric for performance evaluation of emotion recognition over time;
-
•
Sign Agreement Metric (): The sign agreement metric combines the magnitude of the prediction error with a penalisation for sign errors. It can be computed with , where is the Kronecker delta function. This metric has been mainly used for valence and arousal prediction, where the concordance of signs between the predictions and the ground-truths can be more important than the magnitude of the scoring errors.
Among these alternatives, it is important to consider the task at hand when selecting metrics for an adequate performance evaluation that also enables a simple and thorough comparison with the state-of-the-art.
Part II Electrocardiogram Biometrics
Chapter 3 Prior Art in Electrocardiogram Biometrics
3.1 Data
Numerous researchers, when working with ECG signals, for biometric recognition purposes or automatic diagnosis of medical cardiac conditions, opt for private acquisitions of data. However, as the needs grow for more complete datasets, with more subjects, including medical conditions, on more sessions, spread across wider time frames, and under different posture and activity conditions, researchers became more aware of the importance of public signal collections [394].
Moreover, public ECG databases are needed to enable the comparison and benchmarking of algorithms in challenging conditions, across different publications, without requiring authors to implement algorithms and evaluate them again. Below, we delve into the important aspects behind a well-structured ECG signal collection, we present the most relevant publicly available collections, and we discuss the current needs and future possibilities regarding data in ECG biometrics.
3.1.1 Building a complete ECG data collection
A well-structured ECG signal collection is key to appropriately guiding the development towards the exploitation of the best possibilities for the system, and accurately predicting its performance upon real-life application. To achieve such a complete collection, a few aspects have to be considered:
- •
-
•
Electrode placement: As shown by [490], the use of chest leads is less challenging than limb leads, and the distance of the electrodes to the heart has a significant negative impact on the system’s performance;
-
•
Sampling frequency: Sampling causes the loss of fine details that influence the recognition process [350]. The lower the sampling frequency, the larger the amount of detail that can be lost, and the higher the risk of aliasing of high-frequency noise (such as electromyogram interference);
- •
-
•
Subject health: Some health issues, mainly arrhythmia, can generate intrasubject signal variability that encumbers the recognition process [369, 95, 96]. Thus, systems should be made robust against this, by including subjects with heart conditions in the datasets used during the development and validation of the methods;
-
•
Number of subjects: The diversity of individuals and their own characteristics may ease or difficult the job of the biometric systems [104, 468], and successful state-of-the-art algorithms have been shown to be significantly worse when evaluated on larger datasets [319]. The use of a collection with a large number of subjects ensures the presence of subject diversity, increasing the thoroughness of the performance assessment. As discussed in [343], the vast majority of literature in ECG biometrics reports the use of data from less than 100 subjects;
- •
All these factors can have an impact on the performance of an ECG-based biometric system. In order to correctly assess the capabilities of such systems, it is of the highest relevance to not only build a database that fits the system’s expected application context, but also one that reflects all possibilities mentioned above, in order to study the use of the same biometric system in a wider set of contexts.
3.1.2 Publicly available data
Currently, there are several collections, publicly available for ECG biometrics research111Some of these databases may require prospective users to contact the respective administrators to request access to the data and/or sign agreements beforehand. Nevertheless, all presented databases are made available by the creators for research purposes., which try to cover the aforementioned factors to create a challenging environment for the development of robust biometric systems. Many are stored by Physionet222Physionet ECG databases. Available on: https://www.physionet.org/physiobank/database/#ecg., while others are ceded by their owners upon request. Below, we present and characterise the most relevant of the currently available ECG collections (see Fig. 3.1 for the number of publications that have used them), and Table LABEL:tab:db_compar summarises the characteristics of each.
-
•
AHA: The AHA ECG database333American Heart Association ECG database. Available on: https://www.ecri.org/components/Pages/AHA_ECG_USB.aspx. was created by the American Heart Association to guide the training of health professionals on the diagnosis of arrhythmias. It includes 154 ECG recordings from real patients, donated by various institutions, each three hours long and composed of two lead signals. The last 30 minutes of each recording are annotated for seven types of arrhythmia;
-
•
CEBSDB: The Combined measurement of ECG, Breathing and Seismocardiograms (CEBSDB) database [139] is a multimodal database available on Physionet. It includes two channels of ECG (standard leads I and II), thoracic respiratory signals, and seismocardiograms (SCG) from twenty healthy subjects at rest and in the supine position. Recordings include 50 minutes of classical music listening preceded and followed by five minutes at rest. ECG signals are sampled at 5 kHz and were acquired with foam tape and gel electrodes;
-
•
CYBHi: The Check Your Biosignals Here initiative444CYBHi dataset for off-the-person ECG biometrics. Available on: https://zenodo.org/record/2381823#.YwDLmHbMKMp. [394] is a collection of off-the-person ECG signals acquired with two dry electrodes at the palms, and two electrolycras at the middle and index fingers. It consists of a short-term dataset, with single-session recordings of 65 volunteers; and a long-term dataset, where 63 subjects were recorded in two sessions, three months apart. In each session, for 5 minutes, the subjects were exposed to videos designed to cause emotional reactions;
-
•
DriveDB: Resulting from the Stress Recognition in Automobile Drivers initiative, this database was created with the purpose of monitoring stress in drivers [168]. Various physiological parameters (electrocardiogram, electromyogram, and skin conductivity) were recorded from 9 subjects over a total of 18 driving sessions, including periods of rest (lower stress levels), highway driving, and city driving (higher stress levels);
-
•
ECG-ID: The ECG-ID is a database entirely focused on biometrics [281, 307]. 20-second ECG recordings were collected from 90 subjects, and are currently available on Physionet. For each subject, the database has between 2 and 20 recordings (a total of 310) collected over six months. The signals were acquired from Lead I using limb-clamp electrodes at the wrists;
-
•
E-HOL 24h Holter: This is an ECG database, focused on biometrics, from the University of Rochester555University of Rochester Medical Center, Telemetric and Holter ECG Warehouse. Database E-HOL-03-0202-003. Available on: http://thew-project.org/Database/E-HOL-03-0202-003.html.. A total of 203 healthy subjects were recorded using a Holter monitor for 24 hours, with four electrodes placed on the chest, from 3 leads following a pseudo-orthogonal configuration;
-
•
European ST-T: The European ST-T database [421] was originally intended for the analysis of ST and T-wave changes. The database is composed of 90 two-hour excerpts of recordings from 79 subjects, from 2 leads, and includes abnormalities with origin in myocardial ischaemia, hypertension, ventricular dyskinesia, and effects of medication;
-
•
FANTASIA: The FANTASIA database [195], available on Physionet666FANTASIA database. Available on: https://physionet.org/content/fantasia/1.0.0/., is composed of 120 min. recordings of ECG, respiration, and blood pressure signals from forty people (twenty young and twenty old). All signals were acquired at 250 Hz as the subjects remained at rest, supine, watching Disney’s Fantasia movie;
-
•
Long-Term ST: The LTST database [196], available on Physionet, includes a variety of ST segment changes for the development of algorithms for the diagnosis of myocardial ischaemia. This database includes 86 records from 80 subjects, from ambulatory recordings between 21 and 24 hours, from two and three leads;
-
•
MIT-BIH Arrhythmia: The MIT-BIH Arrhythmia database [287, 301], one of the most used in ECG-based biometrics research, is available at the Physionet repository. The database is composed of a total of 48 signals, 30 minutes long excerpts from ambulatory two-lead recordings. The 47 subjects were selected to obtain a representation of a wide variety of arrhythmias;
- •
-
•
Physionet 2017 CinC Challenge: This ECG database is available on the Physionet repository, and was used for the 2017 Computers in Cardiology (CinC) Challenge, consisting of arrhythmia detection in short single-lead ECG signals. It includes individual 10-60s recordings from a total of 8528 subjects, acquired at 300 Hz sampling frequency using the AliveCor KardiaMobile off-the-person acquisition device;
-
•
PTB: The PTB Diagnostic ECG database [49, 230] includes 549 recordings from 290 healthy subjects and individuals with various cardiac conditions (such as myocardial infarction, dysrhythmia, hypertrophy, or heart failure). It has 1 to 5 recordings per subject, ranging between 38.4 and 104.2 seconds, from all 12 standard and 3 Frank leads;
-
•
PTB-XL: From the creators of the PTB Diagnostic ECG database, described above, the PTB-XL database [444, 443] gathers a very large number of ten-second ECG signals () from over eighteen thousand subjects in clinical scenarios. The signals are sampled at Hz (but also available at Hz) and include the twelve standard leads, annotated by up to two cardiologists considering diagnostic, form, and rhythm;
-
•
QT: The QT database aims to aid the development of automatic methods of measurement of QT waveforms [239]. This collection is a compilation of 105 15-minute relevant recording extracts from other public databases;
-
•
UofTDB: The University of Toronto ECG Database [445] was specifically created for biometrics and addresses several important criteria for a thorough evaluation of biometric performance. The off-the-person ECG signals were captured using dry electrodes at the thumbs of a total of 1019 subjects. For each subject, the database includes up to six recordings over a period of six months, in various postures: supine, tripod, exercise, sitting, and standing.
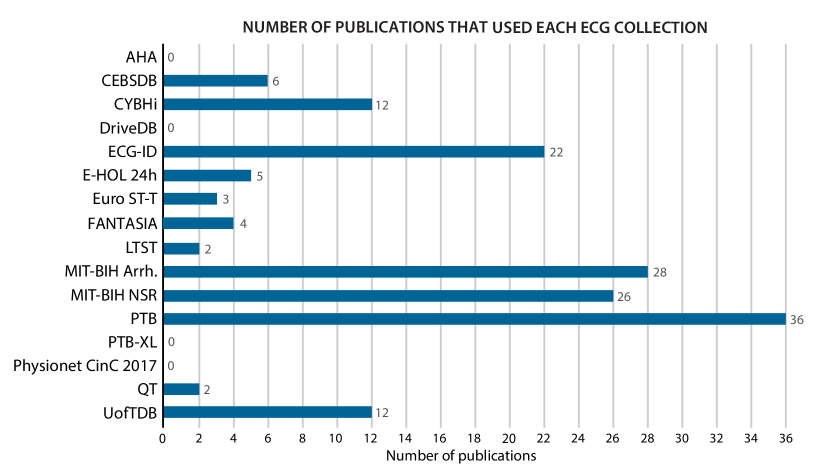
While many researchers opt to use private acquisitions of data for their studies on ECG biometrics, public datasets have been crucial in allowing the appropriate comparison of results across publications. Nevertheless, if our goal is to increase competitiveness between ECG-based biometrics and more developed traits, we should address some concerns regarding public collections.
Currently, countries like India, China, and the United States, are starting to invest in nationwide identification systems for their large populations [198], which awakens the need for biometric systems that can robustly discriminate between several million enrolled subjects. To keep up with this trend, we need to work towards the creation of public ECG collections with a larger number of subjects. PTB-XL is impressive in this regard, as it includes signals from over eighteen thousand subjects. However, it is still quite limited considering the extent and diversity of data per subject, which are very important aspects for biometrics.
Moreover, researchers can currently choose from small on-the-person datasets that include health conditions and longer acquisition times (such as the AHA, European ST-T, and the MIT-BIH Arrhythmia databases), or the off-the-person UofTDB collection with short recordings from several healthy subjects. This calls for the creation of a public database with a number of subjects similar or superior to UofTDB, with several longer off-the-person recordings (ideally over one hour), taken over long periods (months to years), during different activities and postures. ECG-BG, used by Ingale et al. [187], is composed of off-the-person data from 1119 healthy and unhealthy subjects, but it is still not publicly available.
Finally, it would also be very beneficial to have publicly available collections of signals acquired using recent wearable and seamless technologies, such as the CardioWheel and the Nymi Band. The highly acceptable acquisition settings offered by such products places, undoubtedly, new challenges on signal noise and variability, that would be very useful for the development of robust biometric algorithms.
3.2 Related Work
Despite being more recent and less developed than the face or fingerprint, the electrocardiogram (ECG) is quickly growing as a biometric trait, especially due to its inherent liveness and anti-spoofing capabilities.
A comprehensive review of prior art in ECG-based biometric recognition is available in [343], published in the scope of this doctoral work, and succinctly summarised in Table LABEL:tab:ecg_unimodal_works. In this section, we present a summary of the survey, organised in the four common stages of an ECG-based recognition algorithm: signal denoising, signal preparation, feature extraction, and decision (see Fig. 3.2). We also offer a discussion on the approaches based on deep learning and the current challenges and possibilities in the topic.
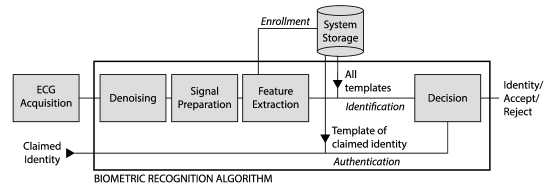
3.2.1 Signal denoising
ECG signals are highly susceptible to interference during the acquisition stage [366]. The amplitude of their waveforms may vary depending on the electrode characteristics and placement but, under ideal conditions (using chest leads in medical settings), the QRS complex only reaches mV, the largest amplitude of the whole cyclic beat [124].
This means that when the electrodes are placed far from the heart, the signal is weaker and the noise is more dominant. This can result in different interference types, such as powerline interference (PLI) from alternating current energy lines, baseline wander from breathing movements, electrode movement from motion, lead reversal due to electrode mispositioning, or pacemaker interference [403, 124]. The stage of signal denoising is, thus, of utmost importance for an ECG biometric system.
On the first initiatives in ECG biometrics, using on-the-person acquisitions, the signal-to-noise ratio was higher, and noise sources were mainly limited to powerline interference and baseline wander. Hence, filters, such as bandpass (BPF), lowpass (LPF), highpass (HPF), or notch (NF), were the first and have been the most frequent option, due to their simplicity and lower computational cost. Bandpass filters have been most common, with bands between Hz [8, 10, 32, 272], Hz [193, 369, 366], or Hz [86, 87, 88], aiming to keep most useful individual information of the ECG while attenuating low and high-frequency noise.
Recently, Choudhary and Manikandan [78] proposed the use of the Discrete Cosine Transform (DCT) for simultaneous removal of baseline wander and powerline interference, which proved more successful than bandpass filters, when compared on simulated scenarios. The Discrete Wavelet Transform (DWT) has also been proposed for denoising of on-the-person signals [124, 373, 80], as it allows to decompose the signal into several levels, which may be separately processed to eliminate noise in certain frequency ranges.
When considering off-the-person approaches, wearables, or seamlessly integrated acquisition settings, it is reasonable to expect a considerable increase in the noise influence, with a lower signal-to-noise ratio. The ability to capture the ECG signal weakens, so the amplitude of the ECG components is smaller when compared with chest leads, and movement artefacts are much more frequent and dominant [278, 289, 394].
For these, filters have also been widely applied [289, 272], as well as DWT [170]. However, the enhanced noise content motivated the proposal of new approaches based on line fitting algorithms, such as fitting of polynomial curves and the Savitzky-Golay algorithm [374]. Their use or combination with moving average or median filters has been shown more successful than filters or transform denoising [298, 342], likely because noise is widely present across the ECG frequency range, and such methods avoid restricting their operation to narrow frequency ranges.
Considering all this, it is possible to conclude that the trend in signal denoising has been the evolution towards methods that can adapt to increasingly unexpected and dominant noise. Considering the efforts devoted to more acceptable and comfortable acquisition settings, with an increasing focus on wearables and seamless settings, it is unreasonable to expect this trend would be reversed in the near future.
While filters appear to be a wise option if the noise is confined to known frequency ranges outside the ECG frequency range, for on-the-person signals, transforms (especially DCT) have shown to be good alternatives for denoising without causing distortions [78]. However, when the noise is widespread and/or its frequency range is unpredictable (such as with off-the-person signals), line fitting algorithms such as the Savitzky-Golay filter may be a better option, as they smooth the signal without making strong assumptions about its noise content.
Nevertheless, research must continue to work towards increasingly robust and adaptable denoising methods. Researchers have recently started to use deep learning methodologies (as discussed further on in subsection 3.2.5), that have shown remarkable robustness to noise and variability in several pattern recognition applications [163, 484]. These, along with a deep study of data augmentation, may result in better alternatives to current and future methods devoted to signal denoising, and should certainly be explored in depth.
3.2.2 Signal preparation
ECG biometric algorithms frequently resort to the application of several processing operations over the acquired ECG signal, between denoising and feature extraction. These have the main goal to prepare the signal for the feature extraction phase, maximise the performance of the system (by reducing persistent noise and variability), segmenting specific useful parts of the acquired signal, and/or discarding undesirable or prejudicial parts [278, 191, 342].
The noise and variability that may remain after the signal denoising stage, which this stage will aim to attenuate, are generally segment length and alignment inconsistencies, amplitude variations, heart rate variability, movement artefacts, and contact loss or impedance artefacts [189, 342, 191].
To fulfil its objective, this stage generally consists of reference point detection, signal segmentation, amplitude normalisation, time normalisation, and/or outlier detection processes. The most common in the literature methods are fiducial point detection, signal segmentation, and amplitude normalisation. Below, an overview of these processes is presented.
-
•
Fiducial Point Detection: To aid posterior processes, such as signal segmentation, the preparation of the signal for recognition can include a step of detection of heartbeat reference points, designated as fiducials. The majority of the surveyed research works have used this technique, varying in the methods used. On the other hand, some researchers have opted to make their algorithms completely non-fiducial, discarding the processes included in this stage [349, 8, 170].
The Pan-Tompkins algorithm [328], based on moving-window integration and adaptive thresholding, has been the most frequent choice for fiducial detection [327, 303, 390, 272, 446]. Alternatives include the Discrete Wavelet Transform (DWT) (used in [124, 125, 373, 326]), the Trahanias algorithm [436] (based on morphological operations and adaptive thresholding, used in [298, 342]), and the Engelse-Zeelenberg algorithm [113, 277] (based on differentiation, negative lobe detection, and adaptive thresholding, used in [276, 272, 342]). Pinto et al. [342] have applied these methods and found Pan-Tompkins and Engelse-Zeelenberg gave better results for on-the-person signals, while Trahanias performed better in off-the-person settings.
-
•
Signal Segmentation: Signal segmentation is used to limit the signal span for feature extraction, or to set a fixed size to ease template matching when the feature is the signal itself. In some cases, the segmentation uses the fiducial point locations and is used to crop QRS complexes and/or other waveforms [429, 414, 446]. It can also be used to crop the whole heartbeat (or a majority of it), thus being performed at fixed distances before and after detected R-peaks or QRS complexes [493, 66, 272]. Some research works included signal segmentation using sliding windows, with or without overlap, regardless of the completeness of the heartbeat cycles inside it [318, 292, 114].
The alignment and averaging of various signal segments are closely related to the signal segmentation process. The alignment is generally performed using the R-peaks as a reference after these are located, or it is performed using cross-correlation [32, 88, 278, 78]. It usually serves as a way to ensure the template and the collected signal are not affected by variability, which distorts the personal information the signal contains, and could threaten the recognition task.
-
•
Amplitude and Time Normalisation: As previously discussed, the electrocardiogram varies over time with several factors. These include differences in acquisition equipment or in the interaction of the subject that may cause differences in signal amplitude and DC offset [189], or heart rate variability that causes significant changes in the duration of the heartbeats and their waveforms. To mitigate this, some methods include amplitude and time normalisation techniques.
Amplitude normalisation techniques include the min-max technique [189] (used in[122, 250, 369]), which normalises the signal to the range , the method [318], which subtracts the signal and divides it by its standard deviation, or the max-div method [429, 274], which divides the signal by the maximum amplitude value (generally, the R-peak amplitude).
Time normalisation techniques aim to reduce the impact of heart rate variability on the electrocardiogram’s heartbeats. Some methods perform normalisation by simply shrinking the segmented signal to a predefined length through resampling [368, 250, 274]. As the heartbeat does not expand uniformly with lower heart rates, Tawfik et al. [429] normalised only the QT waveform, more prone to heart rate variations, using the Framingham study formula. This formula computes the linearly corrected QT duration (), based on the time between the nearest R-peaks () and the original duration of the waveform (), using . Fatemian and Hatzinakos [124] went further, segmenting each ECG heartbeat into its key waveforms (P, QRS, and T), and individually resampling them, before joining them back together, with regulated intervals between them. By reducing the effects of heart rate variability and avoiding the typical distortion of the individual waveforms, this is likely the best technique for time normalisation. However, it requires the detection of several waveforms’ onset and offset fiducial points, making it potentially unreliable for off-the-person or seamlessly acquired signals.
-
•
Outlier Detection: Outlier detection is generally applied to discard false or deflected heartbeats, segmented from unacceptably noisy signal portions affected by movement or impedance artefacts or contact loss [342]. Such methods should be able to discriminate between normal deflections, noise interference, and health-related deflections. DMEAN was proposed by Lourenço et al. [273] specifically to reject heartbeat outliers. It verifies the compliance of candidate heartbeats with four rules, regarding the distance to the average template, the minimum and maximum amplitudes, and the position of the maximum heartbeat amplitude (which must correspond to the R-peak location).
Louis et al. [272] opted to use Gaussian Mixture Models (GMM) as a supervised method for outlier detection, after being trained on a set of known clean and desirable heartbeats. Pinto et al. [342] proposed a clustering algorithm, NCCC, based on normalised cross-correlation between candidate heartbeats. While GMM, due to the supervised data, can easily be biased towards certain patterns or subjects seen during training, clustering-based approaches like NCCC are not susceptible to this issue but can become unreliable for small sets of candidate heartbeats. Nevertheless, with the rise of off-the-person, wearable, and seamlessly integrated acquisition settings, it is expected that robust outlier detection methods will be increasingly necessary.
3.2.3 Feature extraction
The stage of feature extraction aims to translate the acquired signal into a representation that reduces the effects of remaining noise and intrasubject variability and emphasises differences between subjects. Several feature extraction methods have been proposed for ECG biometrics, which are generally grouped into three types – fiducial, non-fiducial, or hybrid approaches [292, 288].
-
•
Fiducial Approaches: Fiducial approaches are those that exclusively use as features measurements of fiducial landmarks of the ECG signal in the time domain. These measurements vary widely throughout the state-of-the-art, including time intervals, amplitude, widths, and angles based on the heartbeat waveforms P, Q, R, S, and T, their onset and offset points [193, 490, 390, 366, 446].
Nevertheless, these approaches present the significant drawback of requiring the previous localisation of several fiducial points in the ECG heartbeats (see subsection 3.2.2), which proves difficult to satisfy when using off-the-person or seamless signals. Hence, fiducial feature extraction approaches were considerably more frequent in early research works.
-
•
Non-Fiducial Approaches: Non-fiducial approaches are those that use the entirety of the signal (or segments of it), holistically, to extract features related to the waveform morphology [292, 274, 288]. These approaches include the use of Fourier, Wavelet, or cosine transforms [368, 318, 429, 472, 32, 288, 289, 342], autocorrelation coefficients [349, 8, 10, 170], cardioid graphs [414, 188], generated tridimensional vectorcardiograms (TVCG) [105], multiresolution local binary patterns [272], and information-theoretical approaches based on Lloyd-Max quantisation [87, 88] and Kolmogorov complexity [54].
Some methods do not perform feature extraction, alternatively using segmented heartbeats, average ensemble heartbeats, or segments between consecutive R peaks as features [276, 237, 66, 298, 493]. While more applicable to noisier signals, non-fiducial have still to reach the near-perfect performance reported by earlier works using fiducial features.
-
•
Hybrid Approaches: Hybrid approaches are those that use features from both fiducial and non-fiducial origins. These are rare among the surveyed literature works and include the approach from Palaniappan and Krishnan [327], which combined common amplitude, interval and width fiducial features with a non-fiducial QRS complex form factor. Ergin et al. [114] proposed the fusion of QRS fiducials, with several time-domain, Wavelet transform, and Power Spectral Density (PSD) features. Also, Dar et al. [96] opted for the extraction of a total of 46 features from Haar transform and heart-rate-variable R-R intervals.
Through the analysis of the surveyed research works, it is possible to conclude that fiducial approaches generally contribute more towards a high-performance biometric system, as the use of specific measurements reduces useless information to a minimum, and allows for feature sets with fewer dimensions. However, as noise increases, the relevance of robustness overcomes that of accuracy, and the former can only be offered by non-fiducial methods. The ideal feature extraction method would be one that combines the conditions for high performance offered by fiducial approaches with the robustness to noise and variability offered by non-fiducial approaches, perhaps using deep learning networks and their characteristic robustness to noise and versatile feature extraction capabilities.
Extracted features may, additionally, suffer dimensionality reduction to improve performance [445]. Although frequently overlooked, dimensionality reduction has a very important goal in biometric systems, as the number of features extracted by biometric algorithms can easily become too high for a time-efficient and reliable recognition process [133]. Thus, dimensionality reduction aims to select or transform the extracted features, to reduce its number to a more computationally viable number, while keeping the maximum discriminant power to ensure the system’s recognition performance [445].
Dimensionality reduction methods in the surveyed literature range from common methods such as Linear Discriminant Analysis (LDA) [8, 47, 292, 10, 170] and its Fisher (FLDA) [332] and Heteroscedastic variants (HLDA) [250], Principal Component Analysis (PCA) [170] and Kernel PCA (KPCA) [170], or Greedy Best-First Search (GBFS) [95, 96], to rarer methods such as Discrete Cosine Transform (DCT) [349], Wilkes’ lambda stepwise correlation [193], correlation matrices [42, 43], or bin selection based on symmetric Kullback-Leibler divergence [288, 289].
The work performed by Plataniotis et al. [349], Agrafioti and Hatzinakos [8], and Hejazi et al. [170] provides an adequate platform for the comparison of dimensionality reduction algorithms. According to their findings, LDA offers better performance than unsupervised techniques such as PCA and DCT coefficients, despite its supervised nature that requires knowledge of the subjects prior to the deployment of the biometric system [292]. More recently, other supervised techniques such as the non-linear KPCA method [170, 326] rendered even better results. Hence, research should probably focus on more sophisticated dimensionality reduction methods and deep learning methodologies, which are tunable to provide optimised non-linear dimensionality reduction.
3.2.4 Decision
Based on the representation of the ECG acquisition, obtained through processes of feature extraction and dimensionality reduction, the decision stage aims to accurately attribute one of the enrolled identities to the user, in the case of identification tasks, or to accept or reject an identity claim, for authentication tasks [46, 155, 9]. In the case of identification, the decision stage usually consists of a classification process while, for authentication, the acceptance or rejection of the identity claim is generally based on a reference threshold that is applied to the prediction score. The decision stage can be based on:
-
•
Classifiers: A classifier can be trained on enrollment templates from a set of subjects, and then be used to discriminate them, to output an accurate decision when needed. Classifiers are more commonly used for identification tasks. The most common classifiers in ECG-based biometrics are Support Vector Machines (SVM) [250, 472, 276, 278, 393, 261, 170, 366], mostly using Radial Basis Function (RBF) and Polynomial functions as kernels, Nearest Neighbour (kNN) classifiers [463, 144, 10, 276, 449, 54, 66, 350], or Multilayer Perceptrons [327, 144, 188, 447].
-
•
Metric-based Matching: Some methods are based on the comparison between the currently acquired trait and the previously acquired templates, stored in the system database. The comparison is performed based on similarity or dissimilarity metrics. In ECG-Based biometrics, most metric-based matching methods have been based on distance metrics, among which the most popular was the Euclidean distance [349, 274, 292, 369, 405, 393, 332, 80]. However, since the Euclidean distance is regarded by some as unreliable in high dimensional spaces, some researchers have opted to use the cosine [393] or the Mahalanobis distances [235, 233, 234, 156]. Among similarity metrics, literature methods include the correlation coefficient [389, 8, 69, 124, 125, 373, 390], normalised cross-correlation (NCC) [78], Gaussian log-likelihood [318, 288, 289], and Dynamic Time Warping (DTW) [298, 303, 493].
In the literature, it is hard to perform a thorough and fair comparison between the algorithms based on the results reported by the respective authors, as the data used to evaluate such algorithms is commonly not the same, or is used differently. However, it is important to compare algorithms to find the advantages and disadvantages of each and find opportunities for improvement. Hence, to help the comparison of state-of-the-art methods in terms of reported performance, the results of the surveyed publications that have used the six most common data collections (see Fig. 3.1) – PTB, ECG-ID, MIT-BIH NSR, MIT-BIH Arrhythmia, UofTDB, and CYBHi – are presented in Tables 3.1, 3.2, 3.3, 3.4, 3.5, and 3.6, respectively.
SVM and kNN have shown superior performance among traditional classifiers, even in situations with increased noise and variability. Hence, it is safe to assume that these would be wise options for new ECG biometric algorithms. However, there is the need for an equally accurate alternative that would not require re-training with every subject enrollment or update (as SVM does) or the memory-heavy storage of all subjects’ templates (as kNN does). Recent studies indicate that Deep Learning models could solve these issues, but researchers will need to dedicate efforts to overcome the challenge of scarce supervised data.
| Author | Year | NS | Results | |
| Ingale et al. [187] | 2020 | 290 | IDR | |
| EER | 100% | |||
| 2% | ||||
| Ibtehaz et al. [185] | 2021 | 290 | IDR | |
| EER | 99.7% | |||
| 5.66% | ||||
| Srivastva et al. [412] | 2021 | 290 | IDR | 99.7% |
| Thentu et al. [431] | 2021 | 290 | IDR | 99.5% |
| Chu et al. [79] | 2019 | 290 | IDR | |
| EER | 99.3% | |||
| 0.59% | ||||
| Byeon et al. [56] | 2020 | 290 | IDR | 99.1% |
| Wang et al. [451] | 2021 | 290 | IDR | 98.9% |
| Hammad et al. [161] | 2019 | 290 | IDR | 98.9% |
| Pinto and Cardoso [339] | 2020 | 290 | IDR | 97.7% |
| Jyotishi and Dandapat [209] | 2020 | 290 | IDR | 97.3% |
| Karimian et al. [210] | 2017 | 290 | Reliability | 97.4% |
| Pinto and Cardoso [338] | 2019 | 290 | EER | 11.0% |
| Wang et al. [450] | 2020 | 248 | IDR | |
| EER | 98.2% | |||
| 2.55% | ||||
| Huang et al. [180] | 2022 | 248 | IDR | |
| EER | 86.3% | |||
| 2.26% | ||||
| Zhang et al. [487] | 2019 | 234 | IDR | 99.5% |
| Zhang et al. [489] | 2021 | 234 | IDR | 98.8% |
| Dong et al. [105] | 2018 | 113 | ||
| 99 | ||||
| 14 | IDR | |||
| IDR | ||||
| IDR | 92.8% | |||
| 93.3% | ||||
| 98.3% | ||||
| Safie et al. [369] | 2011 | 112 | EER | 19.2% |
| Alduwaile and Islam [16] | 2020 | 100 | IDR | 99.9% |
| Wang et al. [449] | 2013 | 100 | IDR | 99.5% |
| Pal and Singh [326] | 2018 | 100 | IDR | 97.1% |
| Wübbeler et al. [463] | 2007 | 74 | IDR | |
| EER | 98.1% | |||
| 2.8% | ||||
| Li et al. [251] | 2022 | 71 | IDR | 95.8% |
| Labati et al. [238] | 2019 | 52 | IDR | 100% |
| Brás and Pinho [54] | 2015 | 52 | IDR | 99.9% |
| Coutinho et al. [88] | 2013 | 51 | IDR | |
| EER | 99.9% | |||
| 0.01% | ||||
| Plataniotis et al. [349] | 2006 | 14 | IDR | |
| FAR | 100% | |||
| 0.02% | ||||
| Waili et al. [446] | 2016 | 14 | IDR | 96% |
| Zhao et al. [491] | 2013 | 12 | IDR | 96.0% |
| Ghofrani and Bostani [144] | 2010 | 12 | IDR | 98.6% |
| Paiva et al. [325] | 2017 | 10 | IDR | |
| FAR | ||||
| FRR | 97.5% | |||
| 5.71% | ||||
| 3.44% | ||||
| Author | Year | NS | Results | |
| Wang et al. [450] | 2020 | 90 | IDR | |
| EER | 100% | |||
| 3.3% | ||||
| Salloum and Kuo [371] | 2017 | 90 | IDR | 100% |
| Li et al. [252] | 2020 | 90 | IDR | 98.0% |
| Chu et al. [79] | 2019 | 90 | IDR | |
| EER | 97.8% | |||
| 2.00% | ||||
| Wu et al. [462] | 2018 | 90 | IDR | |
| EER | 97.5% | |||
| 0.52% | ||||
| Ranjan [359] | 2019 | 90 | EER | 2% |
| Bento et al. [38] | 2020 | 90 | IDR | 96.9% |
| Ingale et al. [187] | 2020 | 90 | IDR | |
| EER | 96.7% | |||
| 2.3% | ||||
| Zhang et al. [488] | 2019 | 90 | IDR | |
| EER | 96.3% | |||
| 5.82% | ||||
| Ibtehaz et al. [185] | 2021 | 90 | IDR | |
| EER | 96.2% | |||
| 1.29% | ||||
| Benouis et al. [37] | 2021 | 90 | IDR | |
| EER | 93.3% | |||
| 3.05% | ||||
| Jyotishi and Dandapat [209] | 2020 | 90 | IDR | 93.1% |
| Ivanciu et al. [194] | 2021 | 90 | IDR | |
| FAR | ||||
| FRR | ||||
| Sensitivity | 86.5% | |||
| 13.7% | ||||
| 12.7% | ||||
| 87.3% | ||||
| Zaghouani et al. [477] | 2017 | 90 | EER | 15% |
| Dar et al. [96] | 2015 | 90 | IDR | |
| FAR | ||||
| FRR | 83.88% | |||
| 16.1% | ||||
| 0.3% | ||||
| Dar et al. [95] | 2015 | 90 | IDR | 82.3% |
| Tan and Perkowski [426] | 2017 | 89 | IDR | 100% |
| Li et al. [251] | 2022 | 89 | IDR | 98.9% |
| Chun [80] | 2016 | 89 | EER | 5.2% |
| Kim et al. [216] | 2022 | 83 | IDR | 95.7% |
| Author | Year | NS | Results | |
| Shen et al. [389] | 2002 | 20 | IDR | 100% |
| Dar et al. [96] | 2015 | 18 | IDR | |
| EER | 100% | |||
| 0% | ||||
| Kim and Pyun [215] | 2020 | 18 | IDR | |
| F-score | 100% | |||
| 1.0 | ||||
| Ibtehaz et al. [185] | 2021 | 18 | IDR | |
| EER | 99.5% | |||
| 5.17% | ||||
| Dar et al. [95] | 2015 | 18 | IDR | 99.4% |
| Ye et al. [472] | 2010 | 18 | IDR | |
| FPIR | 99.3% | |||
| 26.9% | ||||
| Tan and Perkowski [426] | 2017 | 18 | IDR | 98.8% |
| Li and Narayanan [250] | 2010 | 18 | IDR | |
| EER | 98.3% | |||
| 0.5% | ||||
| Ergin et al. [114] | 2014 | 18 | F-score | 0.97% |
| Zhang et al. [487] | 2019 | 18 | IDR | 95.3% |
| Zhang et al. [483] | 2017 | 18 | IDR | 95.1% |
| Zhang et al. [489] | 2021 | 18 | IDR | 93.6% |
| Li et al. [255] | 2020 | 18 | IDR | 91.4% |
| N and Jayaraman [303] | 2010 | 15 | IDR | 96% |
| Palaniappan and Krishnan [327] | 2004 | 10 | IDR | 96.2% |
| Camara et al. [57] | 2017 | 10 | IDR | 94.8% |
| Author | Year | NS | Results | |
| Salloum and Kuo [371] | 2017 | 47 | IDR | |
| EER | 100% | |||
| 3.4% | ||||
| Ingale et al. [187] | 2020 | 47 | IDR | |
| EER | 100% | |||
| 4% | ||||
| Li et al. [252] | 2020 | 47 | IDR | 100% |
| Tan and Perkowski [426] | 2017 | 47 | IDR | 100% |
| Kim and Pyun [215] | 2020 | 47 | IDR | |
| F-score | 99.8% | |||
| 0.99 | ||||
| Wu et al. [462] | 2018 | 47 | IDR | |
| EER | 99.7% | |||
| 0.02% | ||||
| Ye et al. [472] | 2010 | 47 | IDR | |
| FPIR | 99.6% | |||
| 12.3% | ||||
| Ibtehaz et al. [185] | 2021 | 47 | IDR | |
| EER | 98.2% | |||
| 6.36% | ||||
| Wang et al. [451] | 2021 | 47 | IDR | 97.8% |
| Jyotishi and Dandapat [209] | 2020 | 47 | IDR | 96.8% |
| Lee and Kwak [245] | 2022 | 47 | IDR | 96.0% |
| Dar et al. [96] | 2015 | 47 | IDR | |
| FAR | ||||
| FRR | 95.9% | |||
| 4.1% | ||||
| 0.1% | ||||
| Huang et al. [180] | 2022 | 47 | IDR | |
| EER | 95.7% | |||
| 0.36% | ||||
| Chu et al. [79] | 2019 | 47 | IDR | |
| EER | 94.9% | |||
| 4.74% | ||||
| Wang et al. [450] | 2020 | 47 | IDR | |
| EER | 94.7% | |||
| 2.73% | ||||
| Dar et al. [95] | 2015 | 47 | IDR | 93.1% |
| Zhang et al. [483] | 2017 | 47 | IDR | 91.1% |
| Jahiruzzaman and Hossain [197] | 2015 | 11 | IDR | 96.9% |
| Sasikala and Wahidabanu [373] | 2010 | 10 | IDR | 62.7% |
| Sufi et al. [413] | 2010 | - | MIDR | |
| EER | 1% | |||
| 0.5% | ||||
| Author | Year | NS | Results | |
| Pinto et al. [344] | 2019 | 1019 | IDR | 96.1% |
| Luz et al. [284] | 2018 | 1019 | EER (raw) | |
| EER (spect.) | ||||
| EER (fusion) | 16.9% | |||
| 19.4% | ||||
| 14.3% | ||||
| Pinto and Cardoso [339] | 2020 | 1018 | IDR | 91.5% |
| Pinto and Cardoso [338] | 2019 | 1018 | EER | 7.86% |
| Pinto et al. [345] | 2020 | 1018 | EER | 12.6% |
| Pinto et al. [347] | 2021 | 1018 | EER | 12.6% |
| Louis et al. [272] | 2016 | 1012 | EER | 7.89% |
| Komeili et al. [225] | 2017 | 82 | EER (sess.) | |
| EER (post.) | 6.9% | |||
| 3.7% | ||||
| Ciocoiu and Cleju [83, 84] | 2019/20 | 52 | IDR | |
| EER | 95.6% | |||
| 5.48% | ||||
| Wang et al. [450] | 2020 | 46 | IDR | |
| EER | 100% | |||
| 2.17% | ||||
| Huang et al. [180] | 2022 | 46 | IDR | |
| EER | 87.4% | |||
| 2.36% | ||||
| Author | Year | NS | Results | |
| Pinto and Cardoso [338] | 2019 | 128 | EER | 16.3% |
| Ingale et al. [187] | 2020 | 125 | IDR | |
| EER | 100% | |||
| 0.5% | ||||
| Hammad et al. [161] | 2019 | 65 | IDR | 99.3% |
| Ciocoiu and Cleju [83, 84] | 2019/20 | 65 | IDR | |
| EER | 95% | |||
| 8.6% | ||||
| Belo et al. [36] | 2020 | 63 | IDR | |
| EER | 100% | |||
| 0.0% | ||||
| Srivastva et al. [412] | 2021 | 63 | IDR | 99.7% |
| Wang et al. [451] | 2021 | 63 | IDR | 96.8% |
| Huang et al. [180] | 2022 | 63 | IDR | |
| EER | 88.5% | |||
| 1.48% | ||||
| Jyotishi and Dandapat [209] | 2020 | 63 | IDR | 79.4% |
| Ibtehaz et al. [185] | 2021 | 63 | IDR | 73.9% |
| Luz et al. [284] | 2018 | 61 | EER (raw) | |
| EER (spect.) | ||||
| EER (fusion) | 14.1% | |||
| 26.4% | ||||
| 12.8% | ||||
3.2.5 Deep learning
Deep learning methodologies are quickly revolutionising several fields in pattern recognition, galvanising the machine learning community with outstanding results and unforeseen robustness to input noise and variability in diverse tasks [242, 163, 164, 440]. It achieved these milestones mainly due to the flexibility and robustness of convolutional layers for feature learning, the selective memory of recurrent layers connected to their previous instances, and the versatility of fully-connected layers [242, 483]. Their adaptability to scarce data through techniques such as data augmentation, fine-tuning, transfer learning, and weakly supervised learning, just add to their power for pattern recognition applications.
In the topic of ECG biometrics, the study of deep learning is still a pioneering affair. It has, however, been gathering steam throughout the past four years. Despite a few works which continued focusing on traditional feature extraction and decision models [252, 358, 433, 450, 37], the majority of literature methods proposed since 2020 already include some deep learning architecture responsible for the processes of feature extraction, decision, or both.
Initially, Zhang et al. [483] proposed a multiscale CNN that receives, in parallel, selected autocorrelation coefficients of approximation and detail Wavelet transform coefficient sets of two-second ECG segments. Eduardo et al. [111] replaced the feature extraction stage using an Autoencoder to learn lower-dimensional representations of segmented heartbeats, which were ultimately fed to a kNN classifier.
However, most researchers aim to integrate several stages into the deep learning model. Salloum and Kuo [371], after signal preprocessing and segmentation, replaced the stages of feature extraction and decision with an RNN with Long Short-Term Memory (LSTM) and Gated Recurrent Unit (GRU). Zhang et al. [484] replaced the stages of feature extraction and classification, by feeding 2D representations of single-arm ECG signals to a CNN. Luz et al. [284] also integrated the feature extraction and decision stages, proposing the combined use of two separate CNN, one receiving segmented heartbeats as input and the other receiving the respective heartbeats’ spectrograms, fused at score level.
Labati et al. [238] detected, segmented, and selected QRS complexes from ECG signals, and concatenated them into a QRS vector that served as input to a unidimensional CNN that fulfilled the purposes of feature extraction and decision. With a softmax output, the method attained IDR on the PTB database and, with Hamming distance matching, achieved EER with long-term signals from the E-HOL 24h collection.
Several researchers have also tried to explore two-dimensional representations of ECG signals in order to use 2D deep learning models. Ciocoiu and Cleju [83, 84] have studied S-Transforms, Gramian Angular Fields, Phase-Space Trajectories, and Recurrence Plots of segmented heartbeats on a custom two-dimensional convolutional neural network. They found that S-Transforms offered the best performance, achieving around identification rates on the UofTDB and CYBHi off-the-person databases.
Bento et al. [38] explored spectrograms as inputs to a custom 2D CNN architecture and a DenseNet. The latter achieved the best performance, with almost IDR on ECG-ID and on FANTASIA. Byeon et al. [56] also studied DenseNets, alongside XCeption and ResNet architectures to build ensembles of models receiving spectrograms, log-spectrograms, melspectrograms, scalograms, and MFCCs, achieving approximately IDR on the PTB database.
More recently, Srivastva et al. [412] used images of ECG heartbeat plots as inputs to an ensemble of ImageNet-pretrained DenseNet and ResNet models. With this methodology, they achieved IDR on PTB and CYBHi. Thentu et al. [431] explored continuous wavelet transform-based multi-scale representations of ECG heartbeats on various ImageNet pretrained two-dimensional architectures achieving over accuracy on both CEBSDB and PTB databases.
However, beyond the approaches proposed within this doctoral work, no truly end-to-end methodologies are present in the literature. Two-dimensional representations are promising, especially considering the possibility of using pretrained deep models, but the transformations themselves are still separately optimised processes that may lose important information and limit achievable performance.
Another promising category of approaches is temporal networks, such as LSTMs, which have attained interesting results and are a natural match with ECG signals (time series). However, the aforementioned problem is still valid: if separate processes of denoising, preparation, and/or feature extraction are added to the pipeline, the model may be limited in the information received and thus in the performance it can achieve.
3.3 Open Challenges and Opportunities
Much of the great potential of deep learning for ECG biometrics is still to be explored. Considering the information presented and discussed throughout this chapter, one can align the main challenges in ECG biometrics with the corresponding trends in ECG acquisition, thus painting a panorama of the history and near future of ECG biometrics (see Fig. 3.3).
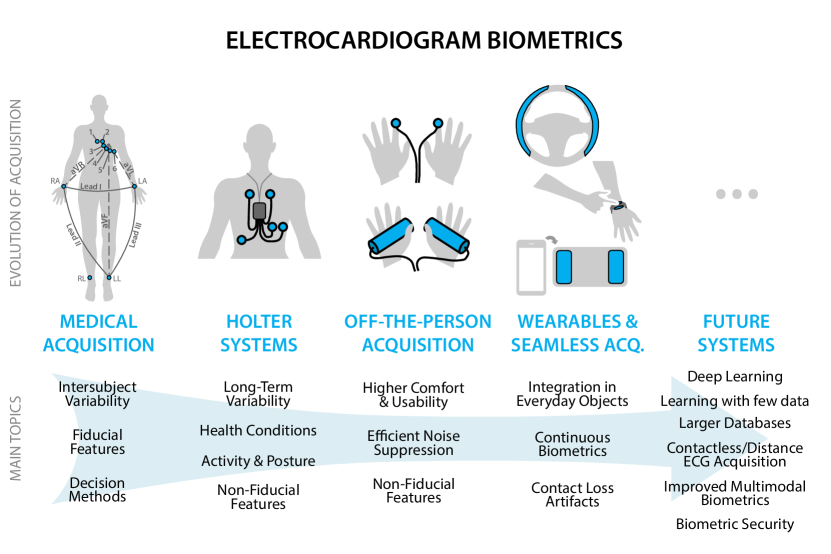
As illustrated in the aforementioned figure, the use of deep learning is a major research opportunity as we move into the future of ECG biometrics. Although deep learning typically brings significantly increased computational costs to biometric systems, these should be compensated by considerable boosts in performance and robustness due to the flexibility offered by deep models.
The integration of all processing stages in a single end-to-end deep model, alongside new techniques of data augmentation and regularisation, could enable the coordinated optimisation for individual recognition and lead us to new levels of robustness against noise and variability. Nevertheless, as we move towards “black-box” deep models, it is important to address the problem of trustworthiness and transparency through the study of model interpretability and explainability in ECG biometrics.
The growth of deep learning should further unveil a serious problem in ECG biometrics: the scarcity of data. This places significant hurdles on the development of accurate and robust biometric models, which should only worsen with data-hungry deep learning methodologies. As we delve deeper into deep learning methodologies for ECG biometrics, it is important to build larger and more complete off-the-person ECG collections. Additionally, researchers should devote further efforts to data augmentation, siamese architectures, triplet learning methodologies, unsupervised and self-supervised learning, and other strategies towards the mitigation of the effects of data scarcity.
Partially linked to data scarcity, another large problem currently plaguing ECG biometrics is the prevalence of unrealistic and mismatching evaluation settings. The diversity of databases and data subsets is noticeable throughout this literature review and makes it impossible to adequately compare different methodologies. The high frequency of random train/test subset splits makes results unrealistic. Moreover, the rarity of long multi-session data acquisitions makes long-term performance a hidden problem waiting to be truly unveiled and solved.
Hence, this thesis part focuses on five contributions to these open challenges and opportunities. Specifically:
-
•
In Chapter 4, we propose the first true end-to-end methodology for ECG-based identification, complete with a study on the progressive integration of pipeline stages within the deep model and various tailored data augmentation strategies;
-
•
In Chapter 5, we adapt the previous model for identity verification and explore identification vs. triplet loss training for template similarity matching. The proposed methodology is also benchmarked against state-of-the-art approaches on a restructured evaluation setup for more realistic results;
-
•
In Chapter 6, we study the effect of long-term variability on the performance of state-of-the-art approaches using a database of day-long Holter acquisitions, along with the application of template/model update strategies;
-
•
In Chapter 7, we study the relative importance of ECG waveforms, with a special focus on the QRS, throughout experimental setups with varying database size and noise/variability using interpretability tools;
-
•
In Chapter 8, we propose an end-to-end methodology for the recovery of the entire set of twelve standard leads requiring as input just one single-lead blindly-segmented ECG signal.
Chapter 4 End-to-End Models and Augmentation
Strategies for Identification
4.1 Context and Motivation
The state-of-the-art in ECG-based recognition mostly consists of pipeline algorithms, composed of separate stages of denoising, signal preparation, feature extraction, and decision, as discussed in Chapter 3. Even the most recent methods using deep learning techniques still rely on some of these separate processes.
However, Convolutional Neural Networks (CNNs) possess the tools to integrate all phases of processing, from acquisition to decision, into a single model. This integration replaces separate, step-by-step tuning with a holistic optimisation process, synergically adapting the model to attain the best performance possible.
Furthermore, the flexibility of convolutional and fully-connected layers makes deep networks able to autonomously learn the most fitted features for the task at hand. Meanwhile, these keep the ability to generalise and be robust against high variability and noise dominance over the signals [242, 483]. Hence, it could be the key to improving the inferior performance results verified in off-the-person ECG biometrics.
This work aimed to study the full extent of the capabilities of CNNs for biometric identification using non-intrusive ECG signal acquisitions. A CNN architecture is proposed for the complete integration of traditional pipeline stages in a single model, for higher accuracy and robustness in off-the-person settings. To obtain further improved performance, unidimensional data augmentation strategies are designed specifically for ECG-based biometrics.
4.2 Methodology

4.2.1 Model
The proposed convolutional neural network (see Fig. 4.1) integrates all common pipeline stages into a single, end-to-end model receiving raw five-second ECG segments and delivering the corresponding identity. It follows the typical structure of a convolutional neural network: the first part includes convolutional and max-pooling layers, and the second part includes one fully-connected layer.
Convolutional layers hold filter banks to learn the most advantageous representation of the input signal segment. Pooling quickly reduces the number of parameters, controlling the computational cost and training time, and improves robustness to small input variations. The proposed architecture uses Rectified Linear Unit (ReLU) activations, filters’ size , stride , pooling size , and pooling stride .
The feature maps output by the last convolutional layer are concatenated into a single unidimensional vector of features. This serves as input to the fully-connected layer, which weighs and combines the received features at each neuron. The fully-connected layer is composed of neurons (where is the number of enrolled subjects), with softmax activations. The neuron that outputs the highest value will correspond to the predicted identity.
Based on a batch of train samples fed to the network, a measure of loss is computed by comparing the output of the network with the true labels of the batch. The weights/parameters that compose the neural network are adjusted to reduce that loss, using an optimiser function. In this work, the optimiser Adam [219] was used, with empirically adjusted initial learning rate in , and Sparse Categorical Cross-entropy loss.
To avoid overfitting, the network used dropout. Dropout will avoid learning overly specific patterns in the training data [231, 411]. They are placed between two layers and act upon the connections between them, setting the corresponding input to zero. In the proposed method, dropouts are used on the connections between the flattened vector of features and the fully-connected layer, effectively blocking the access of the classifier to a part of the features, and requiring it to become less specific to the training set, and more robust to unexpected variability and noise.
4.2.2 Data augmentation strategies
Data augmentation is used to obtain a more robust classifier. It consists of the application of small transformations or changes to the train samples while protecting the integrity of the underlying label of each sample, to simulate larger datasets and ensure the network is robust to such variability [231, 71]. Like deep learning in general, data augmentation techniques are significantly more frequent in 2D networks (for images) than in 1D (signals).
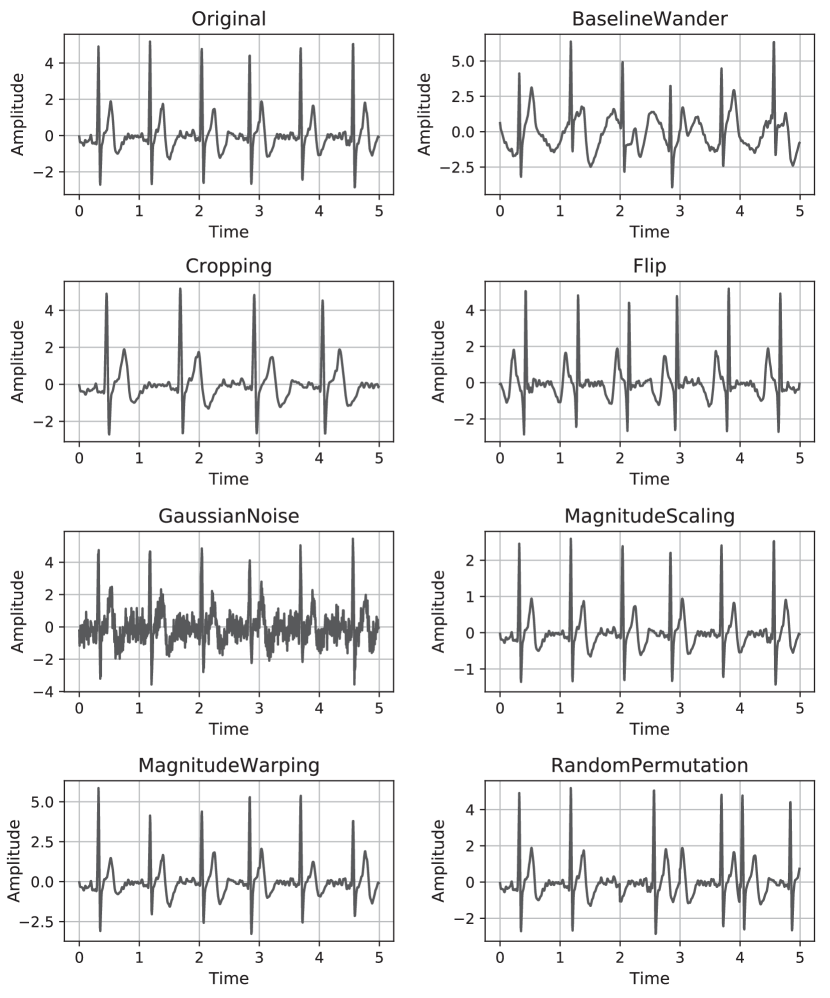
Based on the recent work of [440], and taking into account the unique characteristics of the ECG signals, seven different types of data augmentation are proposed and explored for 1D convolutional neural networks (see Fig. 4.2). These types are:
-
•
Baseline Wander: simulates a periodic undulation on the signal, by adding a sinusoidal wave with a frequency near Hz;
-
•
Cropping: takes a contiguous subsegment and resamples it to match the original length. In the case of ECG signals, this technique simulates slower cardiac frequencies;
-
•
Flip: inverts the signal along the time axis, which causes the inversion of the heartbeat waveforms and their relative locations;
-
•
Gaussian Noise: introduces Gaussian noise (with mean zero and standard deviation about ten times lower than the signal amplitude) to cause high-frequency distortions on the signal, similar to movement artefacts and powerline interference noise;
-
•
Magnitude Scaling: rescales the original train sample by multiplying it by a factor inferior or superior (but close) to ;
-
•
Magnitude Warping: similar to the previous technique, it rescales the signal in a non-uniform fashion, using a sinusoidal wave instead of a fixed factor, so that different parts of the signal will have their amplitude reduced or increased;
-
•
Random Permutations: divides the signal into contiguous subsegments with similar lengths, and their order is randomly changed. This may cause discontinuities in the heartbeats and their waveforms, simulating sensor faults or abrupt segment terminations.
4.3 Experimental Setup
The performance of the proposed convolutional neural network architecture, as previously described, was evaluated on off-the-person ECG recordings of the University of Toronto ECG Database (UofTDB) [445]. Besides the entire database of subjects, two subsets were also used, with and subjects, to evaluate the performance in smaller datasets. The datasets were divided with of the data for training and for testing.
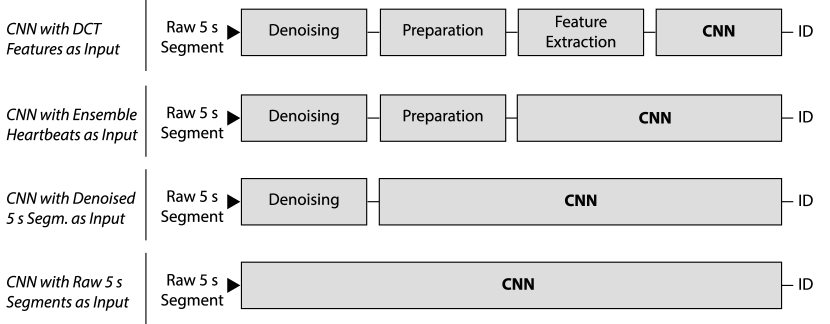
The proposed method suffered slight adaptations to allow the study of the progressive integration of the traditional pipeline stages into the CNN model (see Fig. 4.3). Thus, besides the proposed end-to-end version that receives raw five-second ECG segments, three other variants were evaluated. The first receives five-second ECG segments denoised using a Hz bandpass filter. The second receives the average of heartbeats detected using the Engelse-Zeelenberg algorithm and normalised to zero mean and unit variance. The third variant receives DCT features extracted from the average heartbeats. The pool size of max-pooling, which was set at for five-second segments as input, was changed to for ensemble heartbeats, or for DCT features.
The proposed method was compared with a baseline algorithm, adapted from the method proposed by Pinto et al. [342] using SVM and kNN for decision, and the state-of-the-art algorithm based on autoencoders proposed by Eduardo et al. [111], and the algorithm based on AC/LDA features by Matta et al. [292], evaluated in the same conditions.
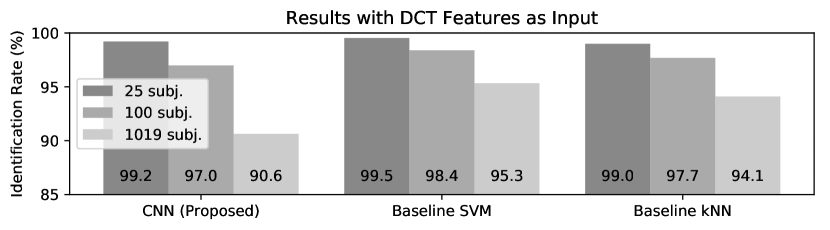
4.4 Results and Discussion
With DCT features as input (see Fig. 4.4), the performance of the proposed method is similar to that of the baseline algorithm for subjects. However, with the increase of subjects on the dataset (with and subjects), the proposed algorithm falls behind. This may be caused by the very concise information that the input carries, fitted for typical pipeline algorithms as the baseline but not for deep learning. The results of the evaluation using ensemble heartbeats as input support this hypothesis (see Fig. 4.5), as the performance increases and approaches that of the baseline methods, and even surpasses that of the kNN classifier on the two smaller datasets.
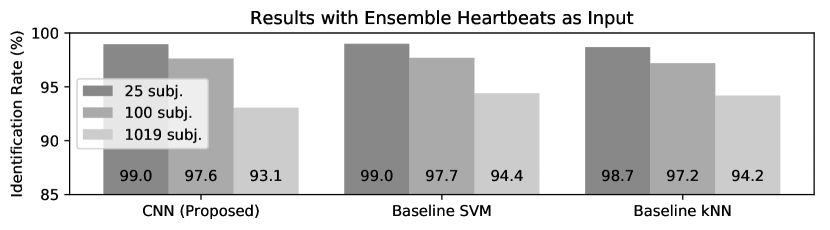
Integrating additional stages into the deep learning model allows us to simplify its structure, and use longer signal segments as inputs (in this case, five seconds). This means an increase in complexity of the input, which can harm the performance of the network, but also an increase in available information and variability, which can allow for a more robust model.
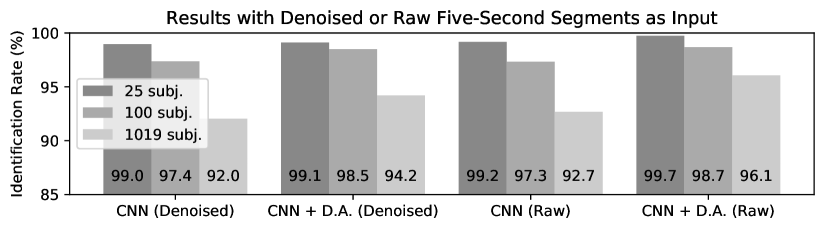
The results of the use of denoised and raw five-second segments (see Fig. 4.6) illustrate the trade-off between signal complexity and the increase of robustness due to extra information and variability, as the results were similar to those of the CNN receiving ensemble heartbeats. Moreover, in general, the results of the CNN with raw segments surpassed those of the CNN with denoised segments, which likely result from the benefit of increased variability during training.
Increased variability is, in turn, the goal of data augmentation (D.A.). The aforementioned techniques were separately tested on the subsets of and subjects (see Fig. 4.7). Most of the techniques of data augmentation bring improvements to the algorithm’s identification rates. The exceptions were magnitude scaling in the smallest dataset, cropping and magnitude warping in the subject dataset, and Gaussian noise in both. Likely, this performance decay is the result of a corruption of the underlying labels with these techniques.
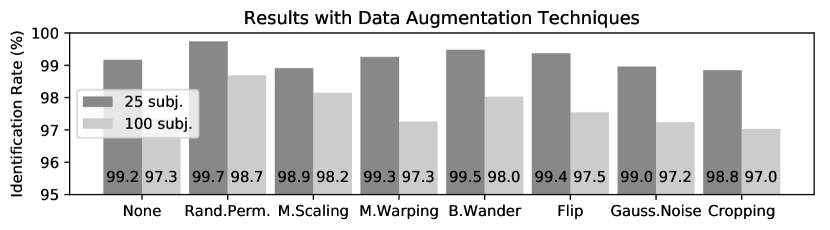
The most promising data augmentation techniques were random permutations (that excelled in both datasets), baseline wander, and flip. These were evaluated in groups to assess if the combination of two or three techniques would offer performance improvements. The results (see Fig. 4.8) show that the sole use of random permutations is the best option, although the combinations also caused an improvement in identification performance.
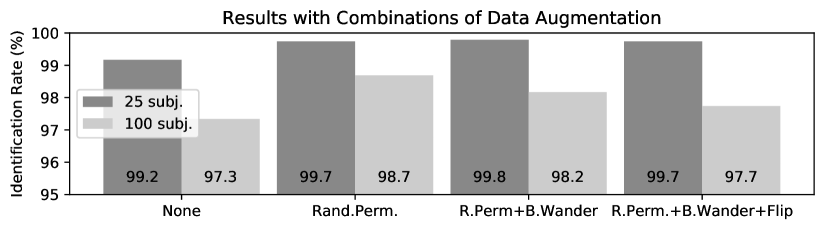
We compared the proposed and baseline algorithms with state-of-the-art algorithms. As they were implemented and tested in the same conditions, the algorithms of Eduardo et al. [111] and Matta et al. [292] can be used for a direct benchmarking (see Fig. 4.9). The proposed method presents better results than the alternatives and a slightly slower decay with the increase of the number of subjects, denoting better scalability to larger populations. The state-of-the-art algorithms likely suffer from using nearest neighbour classifiers, prone to overfit, as the results of the baseline algorithm with kNN were also consistently worse than with SVM. The method of Eduardo et al. [111], despite showing remarkably good results in the denoising of signals during our experiments (using the entire encoder-decoder), falls short in these conditions.
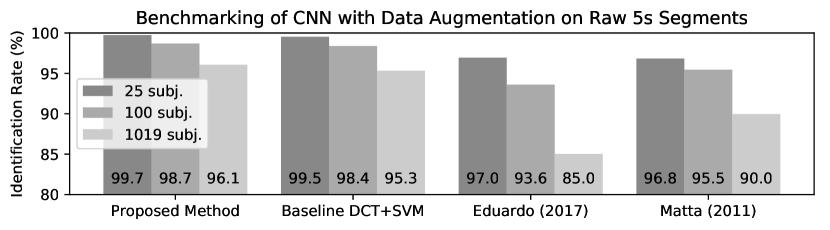
Finally, the results of the proposed and baseline algorithm can be compared with the results reported by the most recent prior artworks (see Table 4.1). The IDR of the proposed and baseline algorithms may pale in comparison with some results reported in some of the considered prior works, but it is important to consider the evaluation settings. Only Wieclaw et al. [457] used an off-the-person database, as opposed to the much cleaner signals of on-the-person databases still used by most researchers. Also, the UofTDB collection enabled the evaluation of the proposed algorithm with a much larger set of subjects than any other identification method.
| Authors | Brief Description | Dataset | IDR | |||||
| Proposed Method |
|
|
96.1% | |||||
| Baseline |
|
|
95.3% | |||||
| Salloum and Kuo [371] | LSTM-GRU RNN |
|
100% | |||||
| Zhang et al. [483] | Multiscale CNN |
|
93.5% | |||||
| Wieclaw et al. [457] | Heartbeats + MLP |
|
89.0% | |||||
| Tan and Perkowski [426] |
|
|
99.5% | |||||
| Carreiras et al. [66] | Heartbeats + kNN |
|
84.4% | |||||
| Brás and Pinho [54] |
|
|
99.9% | |||||
| Wang et al. [449] |
|
|
99.5% |
However, it is important to recall that deep learning both requires and benefits greatly from large datasets where each class is represented by a large number of samples. While, as visible in the results presented here, data augmentation attenuates the prejudicial effects of scarce data, it is difficult to acquire sufficient ECG signals from each subject to compensate for the increased noise and variability in off-the-person settings.
In the datasets used, each subject was represented, on average, by just five-second ECG segments, which is arguably too few to train a convolutional neural network to robustly discriminate between individuals. Considering this, with future efforts devoted to adequately dealing with scarce data, deep learning methodologies could see their potential for ECG biometrics be better harnessed and place themselves as clearly better alternatives to traditional pipeline algorithms.
4.5 Summary and Conclusions
This work proposed a convolutional neural network for biometric identification based on non-intrusive electrocardiogram acquisitions. The proposed method was evaluated for incremental integration of traditional ECG biometric pipeline stages, including a complete substitution by the CNN architecture, that received raw five-second ECG segments and output a decision on the corresponding identity.
Besides this study, seven data augmentation techniques for unidimensional signals were explored and their individual and collective impact on the algorithm’s performance was assessed. The results on the UofTDB database were compared with those of a baseline algorithm and two promising state-of-the-art methods.
The results show that the total integration of traditional pipeline processes in the CNN architecture was successful. The proposed CNN with data augmentation and receiving raw five-second segments surpassed, in all settings, the baseline and state-of-the-art algorithms in direct benchmarking. Among other recent state-of-the-art methods, considering the diverse dataset characteristics, the proposed method has also shown promise as an accurate and robust biometric identification algorithm.
Chapter 5 Triplet Loss and Transfer Learning
for Identity Verification
5.1 Context and Motivation
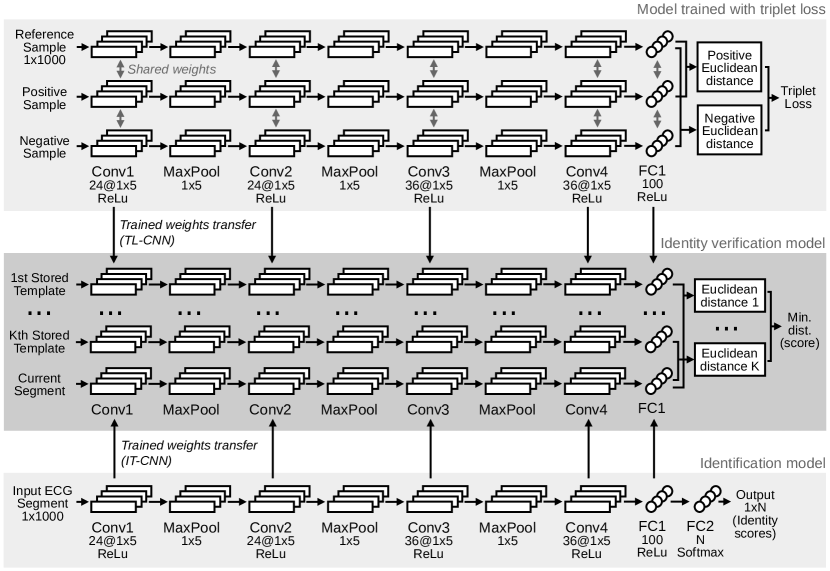
The field of ECG biometrics has been steadily evolving from on-the-person signals to off-the-person acquisition setups. Despite the enhanced usability and comfort, the increased dominance of noise and variability in off-the-person signals places serious hurdles to the real application of ECG biometric systems (more detailed information in Chapter 3).
Some researchers have resorted to deep learning in order to fight off noise and variability and achieve better performance and robustness [111, 284, 344, 483, 484]. However, these still rely on separate predefined feature transforms and/or noise removal techniques, which are not optimised for the task at hand and therefore limit the achievable performance. In fact, the work presented in Chapter 4 shows that end-to-end deep models offer considerable performance benefits in off-the-person ECG biometric identification, especially when using tailored augmentation techniques.
Building upon the work in Chapter 4, this work studied the use of end-to-end convolutional neural networks (CNN) for ECG identity verification. The main goal was to discover if dismissing all separate processes of denoising or preparation in favour of a single integrated model (granted complete control over the robustness to signal noise and variability) would also improve performance and robustness in the task of identity verification. Besides the use of metric learning through the triplet loss, this work introduces the technique of weight transfer from a similar model trained for identification. This aimed to assess whether parameters optimised for identification tasks would offer performance benefits in identity verification.
The proposed network and both training methodologies were extensively evaluated on three ECG collections, which include on-the-person and off-the-person signals with varying signal quality, multi-session recordings from several subjects, and the influence of emotions, posture, and exercise. This evaluation included the assessment of the trained model’s applicability to other signal collections, through cross-database tests using transfer learning and fine-tuning.
5.2 Methodology
5.2.1 Model architecture
The proposed method for ECG biometric identity verification is based on a CNN (see Fig. 5.1, darker grey). All enrolled users have one or more fixed-length ECG segments (templates) stored in the system, that have been blindly segmented (without requiring any process of reference point detection) from a recording obtained upon enrollment.
When a user claims to be an enrolled individual, the model receives and processes, simultaneously, the stored templates of the claimed identity and current segment of the user. The comparison between the processed current segment and each of the stored templates allows the model to output a dissimilarity score, which can be used to accept or reject the identity claim.
After sample-wise normalisation to zero mean and unit variance, the processing of each input segment or template starts with a succession of convolutional and pooling layers. As visible in Fig. 5.1, four unidimensional convolutional layers are alternated with three max-pooling layers. All have filters, and the convolution is performed with unit stride and no padding. The first two convolutional layers hold feature maps, while the last two hold .
The second part of the network is composed of a fully-connected layer. The outputs of this fully-connected layer for each stored template (a) and for the current segment (b) are compared using normalised Euclidean distance [461] (see Eq. (5.1)), using their variance () so the output lies in . Among the distances computed, the minimum is output as the final dissimilarity score for identity verification.
| (5.1) |
5.2.2 Model training
The weights for the identity verification model layers are transferred either from a model trained for identification or from a model trained using triplet loss (see Fig. 5.1). The training methodology of transferring weights from an identification model aimed to take advantage of the training process of identification deep neural networks and assess how it could benefit a neural network for identity verification. On the other hand, triplet loss has been recently and successfully used in biometrics, for identity verification and other similar tasks [73, 74, 102].
The training process requires specific structural changes to the model, which are illustrated in Fig. 5.1 and described below. In all cases, during training, the optimiser used was Adam [219] with an initial learning rate of , , , and no decay. Dropout [411] and data augmentation (random permutations, as in [344]) were used to prevent overfitting. After training, the weights are transferred to the respective layers on the identity verification model.
5.2.2.1 Transfer from identification network (IT-CNN)
In the case of identification training (IT-CNN), the model is structured to receive input segment and contain one additional fully-connected layer (FC2), using softmax activation, that will output scores. It is trained for identification with data from identities (following the work of Pinto et al. [344]).
5.2.2.2 Triplet loss training (TL-CNN)
To be trained using triplet loss (TL-CNN), the identity verification model, which has inputs and output, is restructured to receive inputs and offer outputs. The three inputs are the reference template, a positive template (whose identity is the same as the reference), and a negative template (of a different identity). The network processes each input and computes the dissimilarities between the reference and the positive template () and between the reference and the negative template ().
Using adequate triplets of signal segments, the goal is to minimize and maximize . Hence, the model is trained using triplet loss [73], which can be computed for each triplet of inputs through the function:
| (5.2) |
where controls the margin to be enforced between the scores of positive and negative pairs (in this work, ). This margin eases the choice of an effective threshold for the purpose of identity verification.
5.3 Experimental Setup
In this work, one of the main concerns was ensuring the performance results were as realistic as possible. To achieve this, all databases were split between training subjects and testing subjects, to ensure the model can be trained and applied to data from two entirely disjoint sets of subjects. Furthermore, cross-database tests were performed to ensure the model can generalise to other population samples and acquisition settings. Subject enrollment was limited to realistic durations (5, 10, 15, or, at most, 30 seconds of the earliest data from each subject).
5.3.1 Data and reference methods
The three selected databases were UofTDB [445], CYBHi [394], and PTB [49, 146]. UofTDB (off-the-person, subjects) was used for most experiments due to its intermediate but realistic signal quality. The PTB (on-the-person, subjects) and CYBHi (off-the-person, subjects) databases were used to assess performance in better and worse signal quality settings, respectively. To match UofTDB, CYBHi and PTB signals were resampled to Hz. For PTB, only Lead I signals were used.
Three literature methods were used as reference: the AC/LDA method, proposed by Agrafioti et al. [10]; the Autoencoder method, proposed by Eduardo et al. [111]; and the DCT method, proposed by Pinto et al. [344, 342] (adapted for identity verification, using cosine distance normalised to for matching).
5.3.2 Evaluation scenarios
The proposed and implemented methods were evaluated across four scenarios, as detailed below, using the Equal Error Rate (EER, see [343] for more details). Here, each signal segment used as input for the proposed model was five seconds long ( samples at Hz sampling frequency).
In the single-database scenario, the proposed model was evaluated on UofTDB data, and compared with the aforementioned reference state-of-the-art methods. The last subjects were reserved for training, while the data from the remaining subjects were used for testing. The number of enrollment templates varied between , , , or five-second segments.
The varying identity set size scenario aimed to study how the performance is affected by the number of subjects used to train the model. Instead of the original subjects, training was performed using the , , or last subjects of UofTDB, and the remaining , , or subjects, respectively, were used for testing.
The cross-database scenario was designed to assess the proposed model’s applicability to signals from other databases. The proposed model, previously trained on subjects from UofTDB, was directly tested on data from CYBHi and PTB, without fine-tuning.
At last, in the fine-tuning scenario, the goal was to assess the performance benefits brought by fine-tuning. As in the cross-database scenario, the proposed model trained on UofTDB data (from subjects) was fine-tuned to CYBHi/PTB data (from subjects). This was compared to the model directly trained, from scratch, on data from CYBHi or PTB (from subjects, following the single-database scenario). With subjects reserved for training, the tests on this scenario were performed for (CYBHi) or (PTB) subjects.
5.4 Results and Discussion
5.4.1 Single-database scenario
The results obtained in the single-database scenario are presented in Table 5.1. In all cases, the IT-CNN model, which used weights trained for identification, attained better results than TL-CNN, which was trained using triplet loss. With seconds of user enrollment, IT-CNN achieved % EER, while TL-CNN offered % EER in the same circumstances.
When considering shorter enrollment recordings ( s, s, and s), the performance of both proposed methods worsens, but always remained below % EER. It is noteworthy that IT-CNN presented a wider advantage over TL-CNN with more enrollment data, which may denote it takes better advantage of the availability of data.
| Enrolment duration | ||||
| Method | 5 s | 10 s | 15 s | 30 s |
| IT-CNN | 13.70 | 10.92 | 9.52 | 7.86 |
| TL-CNN | 13.93 | 11.89 | 10.90 | 9.94 |
| AC/LDA [10] | 30.27 | 17.90 | 16.55 | 15.82 |
| Autoencoder [111] | 21.82 | 19.68 | 18.84 | 17.09 |
| DCT [344, 342] | 23.05 | 20.41 | 18.55 | 17.38 |
Among the reference methods, AC/LDA presented the best results in most settings. When compared with these results, both proposed methods offered consistently lower EER. Considering the best reference method for each enrollment duration, IT-CNN attained an EER reduction of around %, which can be regarded as a significant improvement over the state-of-the-art.
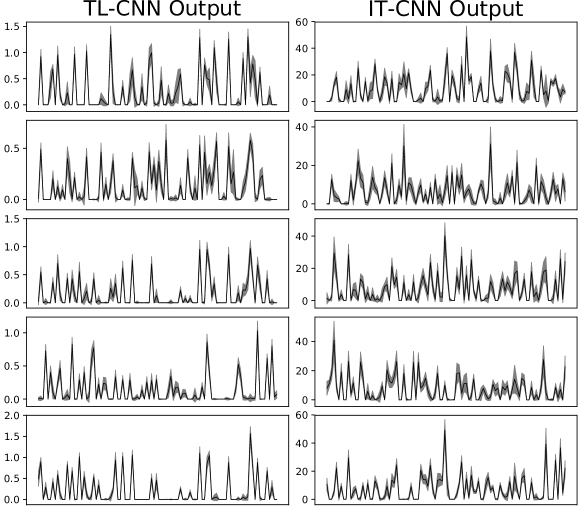
Among other state-of-the-art works, Luz et al. [284], under similar settings, reported % EER with UofTDB data. All IT-CNN and TL-CNN performance results are better, even when considering only seconds of enrollment (much less than what was used by Luz et al.).
Moreover, Louis et al. [272] reported % EER, but only using single session data from UofTDB subjects. Using only data from subjects with more than one session ( subjects), Louis et al. reported % EER, while Komeili et al. [225] reported % EER. Although the evaluation settings are different, the proposed method’s results are aligned with these (% for IT-CNN with s enrollment).
| Enrolment duration | ||||
| Method | 5 s | 10 s | 15 s | 30 s |
| IT-CNN | 11.3 0.14 | 9.4 0.12 | 8.4 0.14 | 7.0 0.14 |
| TL-CNN | 11.6 0.16 | 10.3 0.11 | 9.7 0.14 | 8.7 0.11 |
| AC/LDA [10] | 17.7 0.18 | 15.6 0.17 | 14.6 0.17 | 13.3 0.31 |
| Autoencoder [111] | 18.4 0.17 | 16.3 0.14 | 15.9 0.16 | 13.8 0.12 |
| DCT [344, 342] | 21.2 0.16 | 18.6 0.15 | 16.4 0.14 | 15.5 0.21 |
The statistical significance of the results was assessed, repeating the evaluation on one-hundred random subject data divisions between enrollment and testing (Table 5.2). Overall, the results were better, as this test is arguably less realistic than the remaining tests performed in this study (a real biometric system will always use the very first data of a subject for enrollment). Applying a paired two-sided t-test to the EER estimates, the results of the proposed methods IT-CNN and TL-CNN were significantly different in all cases (the differences are statistically significant at the level), not only from each of the implemented state-of-the-art methods but also between themselves.
Additionally, the outputs of the network for five-second training segments from different subjects were visualised (see Fig. 5.2). These are, effectively, the feature vectors used for the identity verification decision. It is possible to observe that, despite the blind segmentation and the noise and variability carried by each five-second segment, the trained network was able to represent each input segment in a way that maximises similarity with other segments from the same subject. Although some variability is still present, it is reduced to a manageable level for the biometric identity verification task, and the differences between the subjects’ output patterns are noticeable even through a simple visualisation of the plots.
5.4.2 Varying identity set size scenario
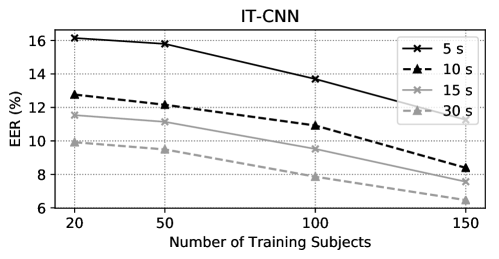
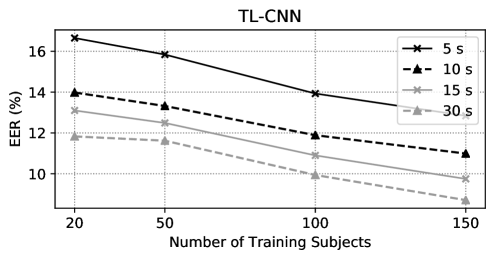
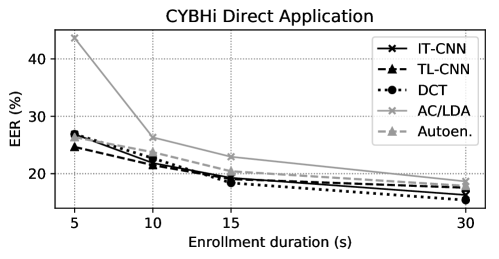
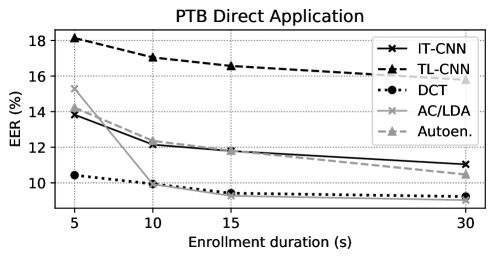
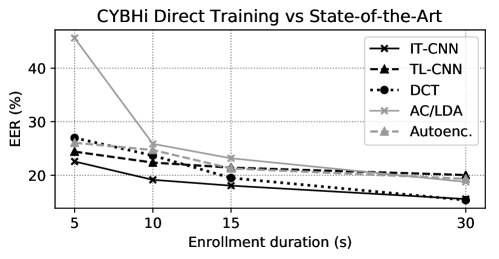
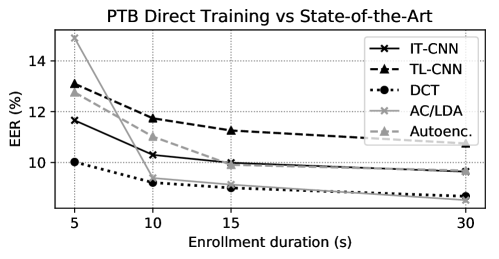
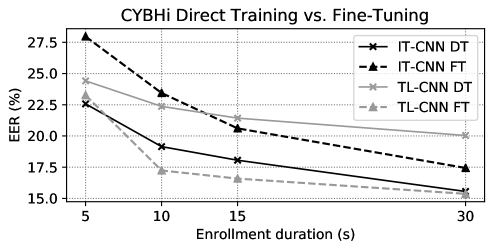
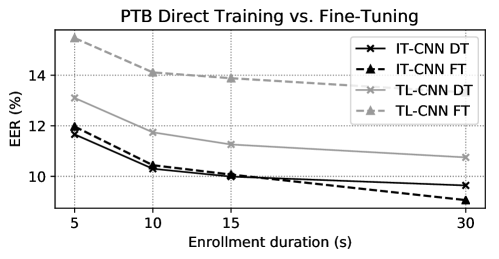
In the varying identity set size scenario, multiple numbers of UofTDB subjects reserved for training were explored (Fig. 5.3). In all cases, an increase in the number of training subjects resulted in performance improvements. The best results were obtained with training subjects and seconds enrollment, with % EER and % for IT-CNN and TL-CNN, respectively. Nevertheless, even with just training subjects, IT-CNN offered performance under % EER (%, with s enrollment).
As in the single-database scenario, it was noticeable that the performance advantage of IT-CNN over TL-CNN was greater when more data was available, either for model training or user enrollment. For example, the EER difference between IT-CNN and TL-CNN grew from % to % when increasing the number of training subjects from to and the enrollment duration from to s.
Despite this, one could expect the IT-CNN method to perform better than the state-of-the-art, even under scarce data conditions. Based on these results, when pretrained with only subjects with s enrollments, IT-CNN should offer an EER lower than % on a population of nearly one thousand individuals.
5.4.3 Cross-database scenario
In the cross-database scenario, the proposed methodologies were directly applied to CYBHi and PTB data, after training on data from UofTDB subjects (Fig. 5.4).
With CYBHi, IT-CNN offered better performance than TL-CNN when using s enrollment (% against % EER). However, with reduced enrollment duration ( s), TL-CNN performed better (% against % EER). This reinforces the idea that TL-CNN is better in scarce data situations, while IT-CNN takes better advantage of the greater availability of data. With PTB, IT-CNN was, in all cases, the most successful proposed method (% EER with s enrollment).
Among the state-of-the-art methods, AC/LDA behaved as in the single-database scenario (see Table 5.1), offering the worst results when using s enrollment, but sharply improving with more enrollment data, offering the best result with PTB (% EER). DCT presented the best result with CYBHi (% EER), while IT-CNN offered the second-best result (% EER). Both proposed methods were, in general, worse than the state-of-the-art with the PTB database.
5.4.4 Fine-tuning scenario
In the fine-tuning scenario, the model was trained with CYBHi/PTB data and compared with the state-of-the-art (Fig. 5.5) and when trained with UofTDB data and fine-tuned to CYBHi/PTB (Fig. 5.6).
Directly trained on CYBHi data, TL-CNN attained % EER, but it offered % EER if trained with UofTDB data, and further improving to % EER if fine-tuning is performed. TL-CNN was able to attain better performance than IT-CNN in more difficult settings, once again indicating that this method may be better fitted for scarcer data or noisier signals.
On PTB, TL-CNN did not offer competitive results. For IT-CNN, fine-tuning (% EER with s enrollment) improved the results over the direct application, but it was not enough to significantly improve the results of direct training. Apparently, training with UofTDB data over-prepared the network for a degree of noise and variability that is not verified on PTB signals, which ultimately harmed its performance. A hybrid method where, before regular training, the neural network would be encouraged to mimic the behaviour of traditional methods, could be beneficial in cross-database settings.
Overall, the proposed methodologies presented more competitive results on CYBHi than on PTB, likely due to PTB signals’ lesser noise and variability. Thus, while the proposed model has shown robustness to noise and variability in off-the-person settings, the state-of-the-art methods are more fitted to cleaner on-the-person signals.
5.5 Summary and Conclusions
In this work, an end-to-end model, based on a CNN, was proposed for biometric identity verification using ECG signals. It was designed to use a set of stored templates of a claimed identity and an ECG segment of the current user, and output a dissimilarity score used to accept or reject the identity claim. The model was trained using triplet loss or by transferring weights from a similar model trained for identification.
The proposed model was successful in improving the performance of state-of-the-art methods, especially in off-the-person signals, increasingly used in ECG-based biometrics. Using identification training has offered better performance than triplet loss when more training and enrollment data are available and could bring benefits for other tasks or biometric traits. Both methods have shown the ability to overcome increased noise and variability of off-the-person signals, focusing on subject-specific signal patterns for accurate identity verification. Nevertheless, further efforts should be devoted to improving performance and turning the ECG into a reliable biometric trait.
Chapter 6 Long-Term Performance
and Template Update
6.1 Context and Motivation
Modern ECG biometric techniques generally report relatively high identification rates and low verification error, while current off-the-person ECG acquisition techniques contribute towards increased simplicity, usability, and comfort [342, 343]. Nevertheless, as with most alternatives, the performance decays over time, especially when considering long-term usage [224].
The natural variability of the input biometric data, the effects of ageing, and variations caused by the subject’s interaction with the sensor contribute to intrasubject variability [201]. This causes stored individual templates to quickly lose representativity, resulting in poor recognition performance and placing serious challenges on long-term recognition. Thus, long-term biometrics benefits from the frequent update of stored templates to keep up with the variability and ageing of the users, thus maintaining acceptable performance over time [134].
Specifically for ECG biometrics, long-term performance and template update remain open challenges. In the most thorough work yet on this topic, Labati et al. [236] have studied the performance decay over time on their proposed algorithm for ECG-based authentication, finding that performance decays significantly even over relatively short periods of time. However, the focus of this study was limited to authentication and the algorithm proposed by the authors.
In this work, we build upon the study of Labati et al. [236]. We aim to more thoroughly explore the problem of long-term performance decay in ECG biometrics and how to correctly address it. Specifically, we extend it to (a) focus on the task of ECG biometric identification, (b) study diverse state-of-the-art biometric methods, and (c) evaluate how different update techniques may be able to improve long-term performance.
6.2 Related Work
In the literature, it is difficult to find a strong and widely accepted rule for template update. Most methods are based on heuristics and empirically determined thresholds, which are highly dependent on the data and the application scenario. For example, Komeili et al. [224], for authentication, have set the acceptance threshold equal to the point of zero false acceptance rate, thus ensuring updates with only genuine samples.
Nevertheless, it is possible to identify some common mechanisms that may vary depending on different factors: these include the choice of the update criterion (based on thresholds or graphs), the update periodicity (online or offline), the selection mechanism, and the template update working mode system (supervised or semi-supervised). The taxonomy of template update (see Fig. 6.1) divides the existing techniques into two categories: supervised and semi-supervised.
Supervised methods are offline methods in which label attribution is given by a supervisor. These contain the Clustering subcategory, which includes the MDIST that aims to search for the templates that minimise the distance among all the samples in the database (i.e., the most similar) and DEND that aims to search for the templates that exhibit large intraclass variations resort to the dendrogram (i.e., the most different) [282].
The second subcategory comprises Editing-based methods, which are independent of the number of templates and give focus on the whole collected training set . A subset is generated, maintaining the classification performance offered by . The best subsets were obtained by reviewing the structure of the data (which needs to be done for each subject) [134, 184]. All the algorithms (based on k-Nearest Neighbours) must be representative of and can be roughly described as incremental when the starts empty and grows, or decremental when starts equal to and in each iteration some instances are deleted until some criterion is reached [134].
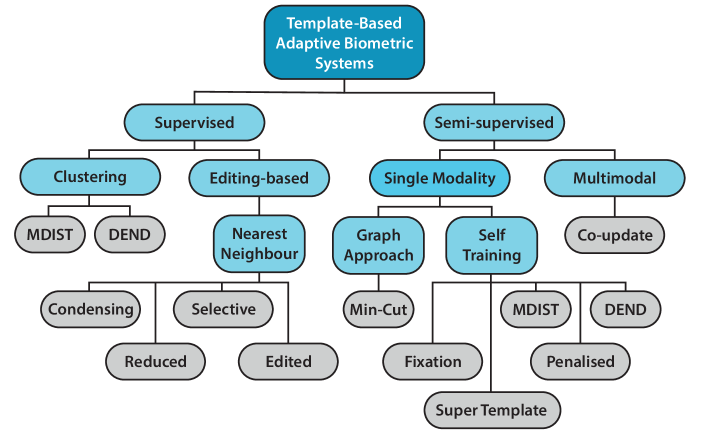
Semi-supervised methods merge labelled (in biometrics, these correspond to the initial training samples) and unlabelled (corresponding to the samples available during system operation) data to improve the system’s performance. This category comprises the Single Modality (for unimodal biometric systems) and Multiple Modality (for systems using more than one biometric trait) subcategories. The Single Modality subcategory includes the Self-Training approaches such as FIFO (first-in-first-out), Fixation, Super Template ( composed by templates ) where new genuine date is always fused to a common single template [237] updated online during the execution of continuous verification, Penalised template update method based on the mean of the past ECG’s and the actual ECG [80] and clock method where the current template is tested against all the others stored in the database [378].
Generally, a new unknown trait measurement is used for template update if its score (returned by the biometric recognition system) is above a set threshold. Hence, the future performance of the system relies heavily on the chosen threshold value [364].
The update threshold is commonly estimated using enrollment templates or training data. When training data are scarce or when using short enrollments, this may lead to some problems. First, important intrasubject variability information may be missed since only the patterns similar to the stored templates are used (and all others are discarded). Second, the effectiveness of the online methods depends on the order of the input data. Third, the methods are vulnerable to large intraclass variations. At last, since the algorithms normally look for the minimal cost (high scores), they may get stuck in local maxima and always only use high-confidence data for updating.
Semi-supervised methods also include Graph approaches. These commonly define a graph where the nodes are either labelled (the identity is known) or unlabelled (unknown identity) data, and the edges (which can have different weights) are the similarity between those samples [364, 494]. To be considered a graph-based semi-supervised method, it must estimate a function , approximate the known on the labelled nodes, and include two terms to smooth the graph: a loss function and a regulariser. These two terms are what define each approach (as can be seen in Table 6.1) [494], among which the most common in biometrics is min-cut graphs [364].
Considering the topic of template update is still to be adequately addressed in ECG biometrics, this work studies the effect of ECG permanence and variability in long-term identification performance. Furthermore, it aimed to evaluate the effect of template update techniques, on the performance of several state-of-the-art methods.
| Method | Source | Loss | Regulariser | ||
|
[44] | ||||
|
[495] | ||||
|
[479] | ||||
|
[35] | ||||
|
[402] | ||||
|
[70] | ||||
|
[495] | ||||
|
[222] |
6.3 Methodology
6.3.1 Biometric identification methods
To fully and objectively evaluate the effects of ECG variability on the performance of biometric algorithms, a study was conducted on four literature methods:
-
•
Plataniotis et al. [349] proposed an ECG biometric recognition method using a non-fiducial approach. Signals are preprocessed using a bandpass filter ( Hz), followed by feature extraction with autocorrelation (AC) and dimensionality reduction using discrete cosine transform (DCT). The fifteen most relevant features were selected, and Euclidean distance was used for classification;
-
•
Tawfik et al. [429] used a bandpass filter ( Hz) in the preprocessing phase. QRS complexes (the most stable part of ECG) were cut from the signal using a second window. The average ensemble QRS was computed and features were extracted using the DCT technique (the thirty most relevant features were selected). A multilayer perceptron (MLP) is used for classification;
-
•
Belgacem et al. [32] also preprocessed signals with a bandpass filter ( Hz). The QRS complexes were located and cut from the signal, and the average QRS was computed. The feature extraction resorted to Discrete Wavelet Transform (DWT). From all DWT decomposition levels, only the most relevant were selected, and a Random Forest is used for classification. This method was originally proposed for authentication and adapted here for identification;
-
•
Eduardo et al. [111] used a Finite Impulse Response ( Hz) filter for preprocessing. Heartbeats were cut with a fixed length of ms around each R peak. Outliers were detected and removed using DMEAN ( and , with Euclidean distance). For decision, the k-nearest neighbours (kNN) classifier was used with and cosine distance.
Beyond these literature methods, this work also explored the deep learning-based methodology presented in Chapter 4 (proposed in Pinto et al. [344]). This method uses an end-to-end unidimensional convolutional neural network, that receives five-second blindly-segmented z-score normalised ECG segments to perform biometric identification. The feature extraction part of the model is composed of four convolutional layers, interleaved with three max-pooling layers, with filter/pooling size and ReLU activation units. For classification, the network uses a single fully-connected layer and softmax activation units.
6.3.2 Template update methods
FIFO:
First-In-First-Out is the most common strategy and, computationally, is very lightweight. Here, the database is updated using new samples whose score is above or below a threshold (whether the score represents similarity or dissimilarity, respectively), or between two threshold values (discarding previously stored sample) [224, 87]. The score of a new sample can either be output by a classifier or be a measure of distance or similarity between that sample and the stored templates [274].
In this work, the training data were used to search for threshold values. Among all training samples, % were used to train a model, which was used to obtain scores for the remaining data samples. Comparing the scores with several thresholds, the error at each threshold was analysed (Fig. 6.2) to find one that simultaneously maximises true positives and minimises false positives.
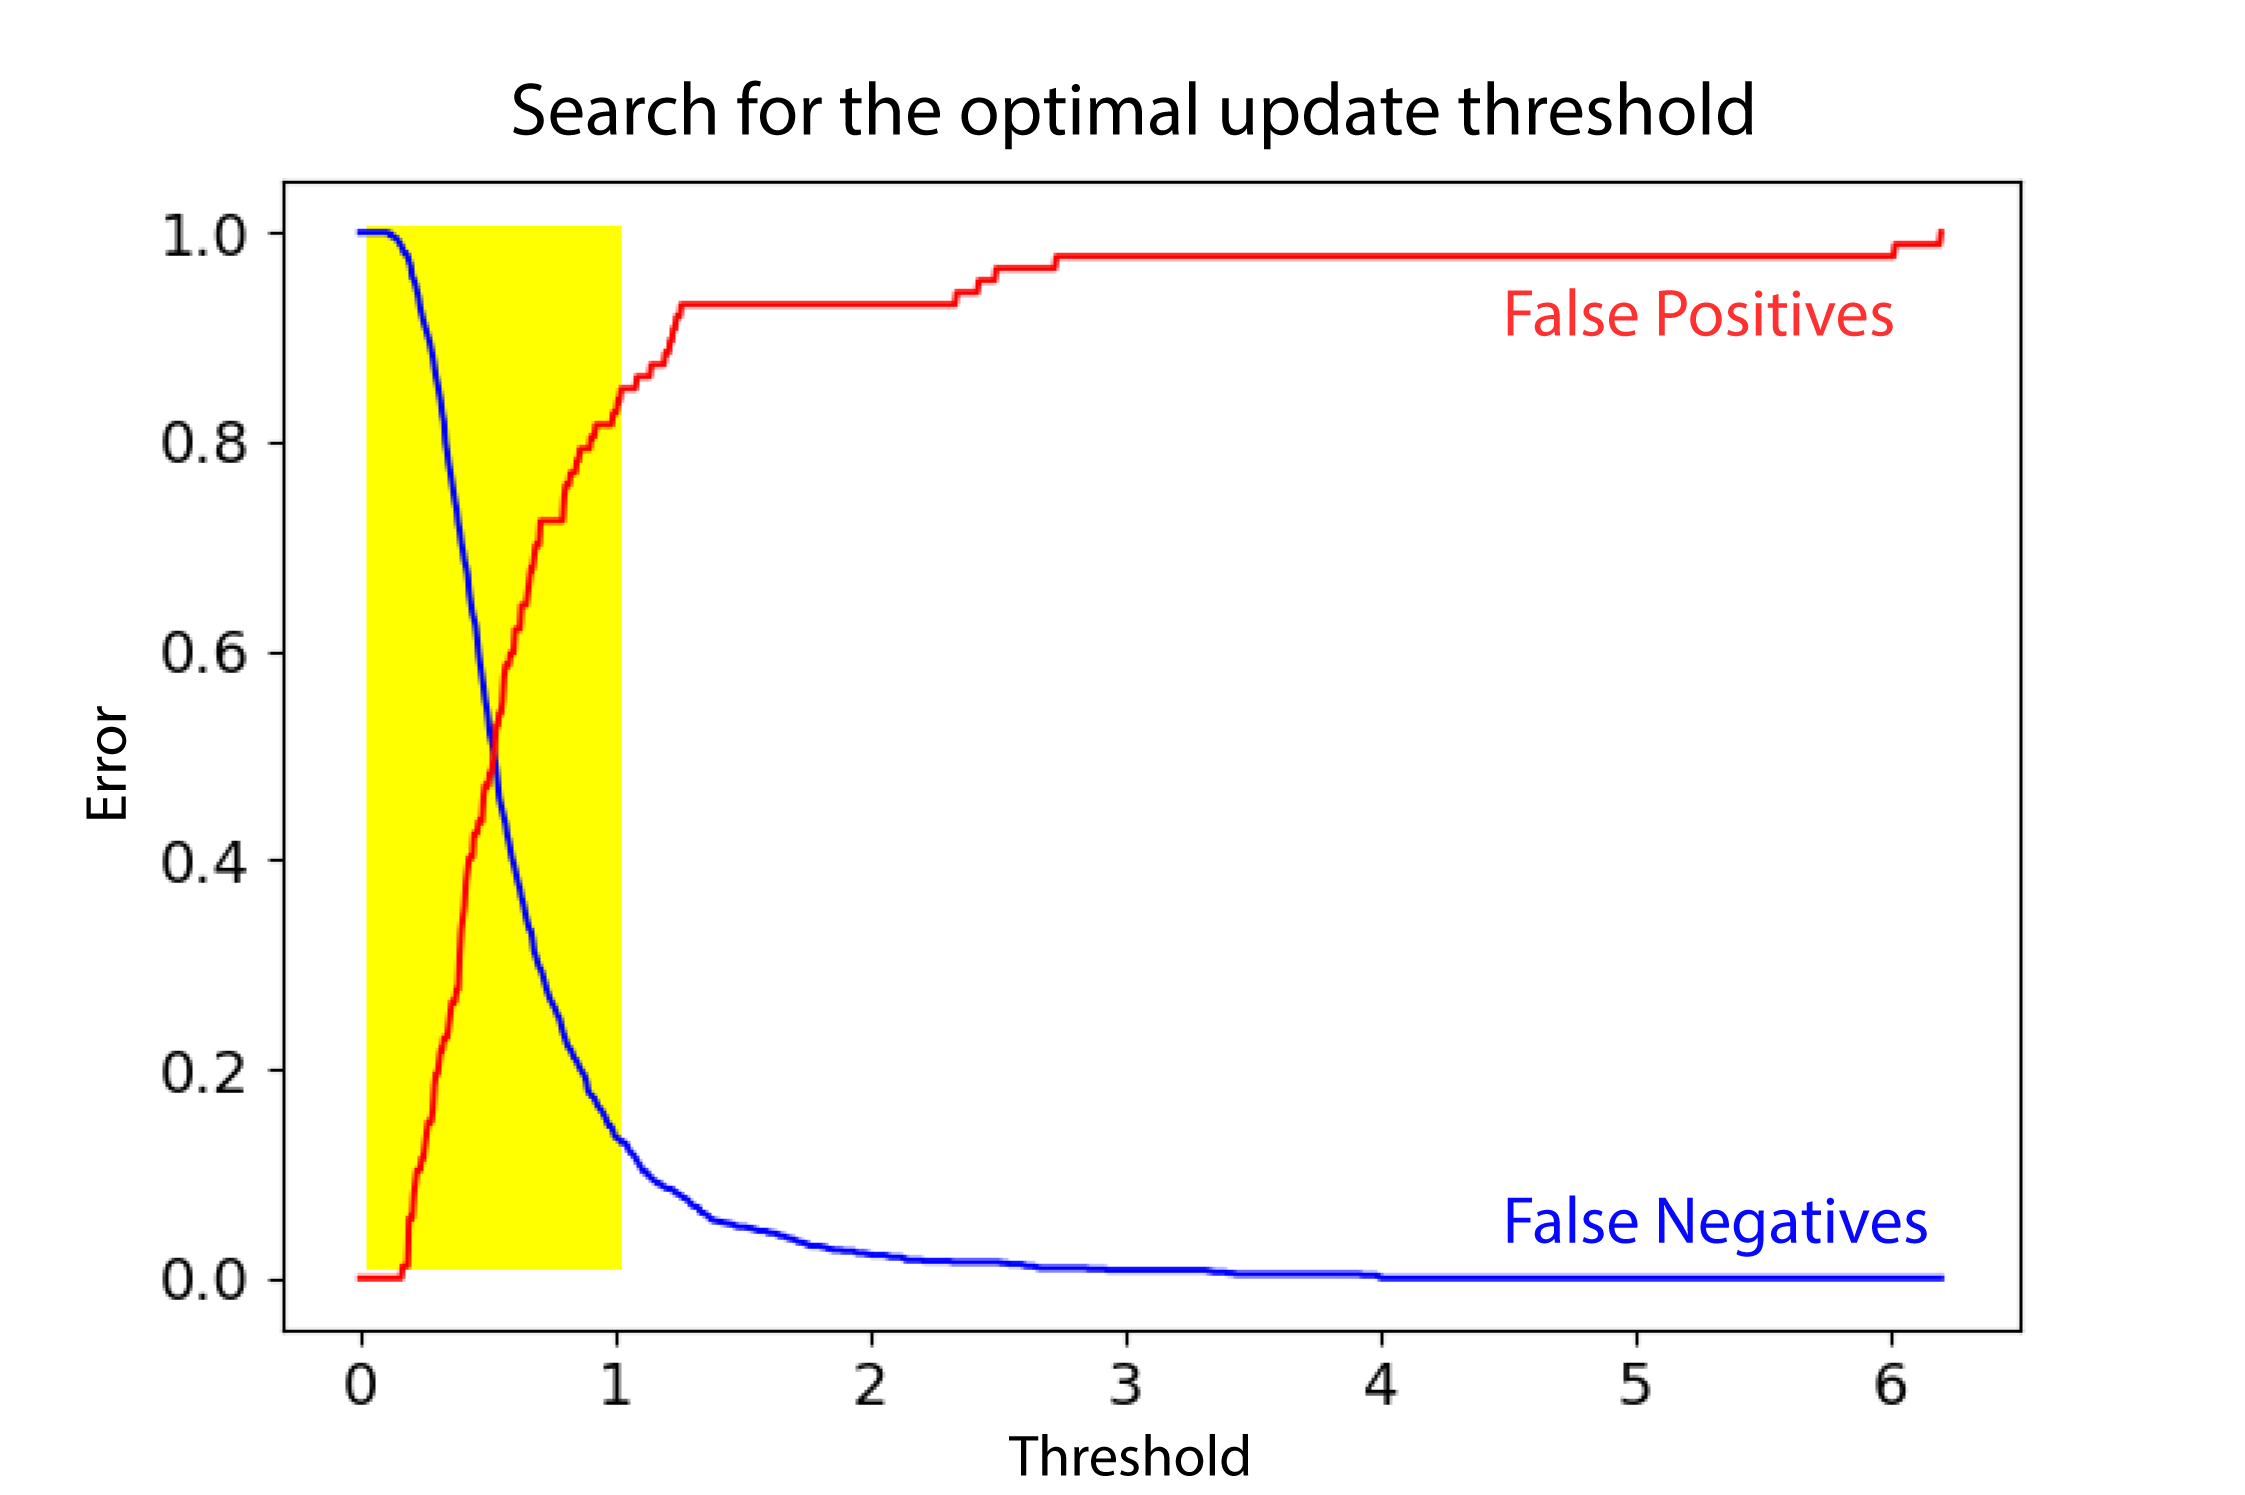
Fixation:
This method consists of fixing certain templates, allowing only the remaining stored samples to be updated [157]. In this work, , , or % of the enrollment templates of the individual are fixed, while the rest of the samples are free to be updated. This ensures some initial, labelled information of the subjects remains on the system over time.
An adaptation of this technique was explored. Here, samples were fixed, where is the number of fixed initial templates, and increases over time. In this work, increased by one at each testing moment (), which allowed the system to fix more and more samples over time, thus storing information on the subject’s variability over time. In a real system with potentially endless use, the parameters and should be carefully chosen to avoid the eventual fixation of the entire template gallery.
Fine-Tuning:
In this technique, the model is briefly optimised with the samples accepted for update, using the predicted labels. The model retains knowledge of the users’ supervised training samples, as it was trained using their enrollment samples, but is slightly adapted to the new personal patterns carried by the new signals. This is explored exclusively for the CNN method [344].
6.4 Experimental Setup
6.4.1 Dataset
For evaluation, the ECG signals used were from the E-HOL-03-0202-003 database111THEW. Available on: http://thew-project.org/Database/E-HOL-03-0202-003.html. (most commonly designated as E-HOL 24h). This database consists of a study of 202 healthy subjects (only 201 were provided), recorded using three leads at Hz sampling frequency, after an initial resting supine period of 20 minutes. From the available data of subjects, thirteen were discarded due to saturation or unacceptable noise (subjects , , , , , , , , , , , and ), similar to what was done by Labati et al. [237]. From each of the remaining subjects, only the lead most closely resembling Lead I ECG was selected, to approximate off-the-person settings.
6.4.2 Experiments
Standard sample wise normalisation was performed following Eq. (6.1) for all methods except that of Eduardo et al. [111], which required min-max normalisation, Eq. (6.2), where represents the input signal and the normalised signal.
| (6.1) |
| (6.2) |
In order to fit the used data, some changes were introduced to the original methods. On the method from Eduardo et al., the cutoff frequencies of the bandpass filter were changed to and Hz, to retrieve important information on higher frequencies. Outlier removal was reparametrized with and . The autoencoder had the topology and was trained using the Adam optimiser with a learning rate . Classification used . For the method of Belgacem et al., DWT feature extraction was performed in four decomposition levels, due to lower data sampling rate, and , , , and coefficients were used as features.
Data were divided into train and test sets. The training phase used the last seconds (mimicking short enrollments on real-life applications) of the first minutes (avoiding unrealistic calm after the initial resting period) of each subject. Five-second overlap was used to obtain samples from every seconds of training data. To study performance over time, testing was performed over seven time points (see Fig. 6.3): one immediately after enrollment, another after one hour, and regularly until the end of the records. From each point, from 15 minutes of data, thirty s samples are extracted, and batches are built with one sample from each of the subjects.
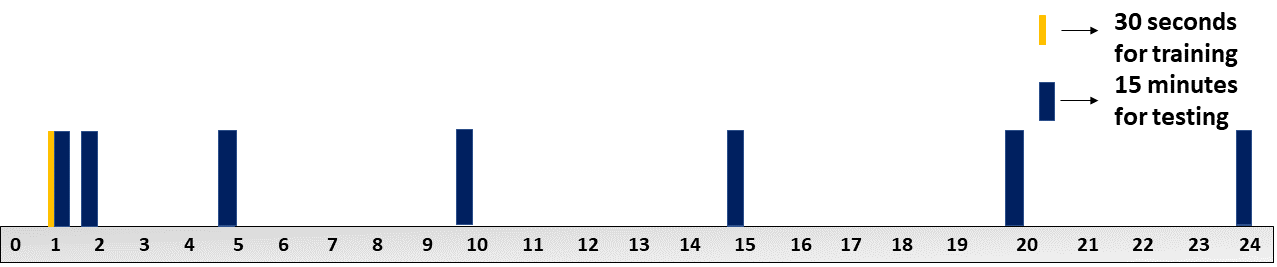
6.5 Results and Discussion
6.5.1 Handcrafted methodologies
After implementing, for identification, the method proposed by Labati et al. [236] (replicating their evaluation conditions), it was possible to conclude that the ECG signal is not fully permanent over 24 h. However, similarly to what was stated by Labati et al., the results are relatively good over the first two hours (see Fig 6.46.4(a)), although permanence was not verified.
The performance results at each test hour, obtained through the weighted average of the corresponding batches, for the state-of-the-art methods can be found in Fig. 6.46.4(b). It was found that the performance is mostly acceptable in the first test point, but performance decays significantly over time and variability changes considerably over the day.
Moreover, a minimum around the 15th hour occurs independently of the chosen method. Considering that most of the records start between 8-12 am, after 15 hours the subjects must be sleeping. In this perspective, it appears that the ECG is most different from normal when the subject is asleep.
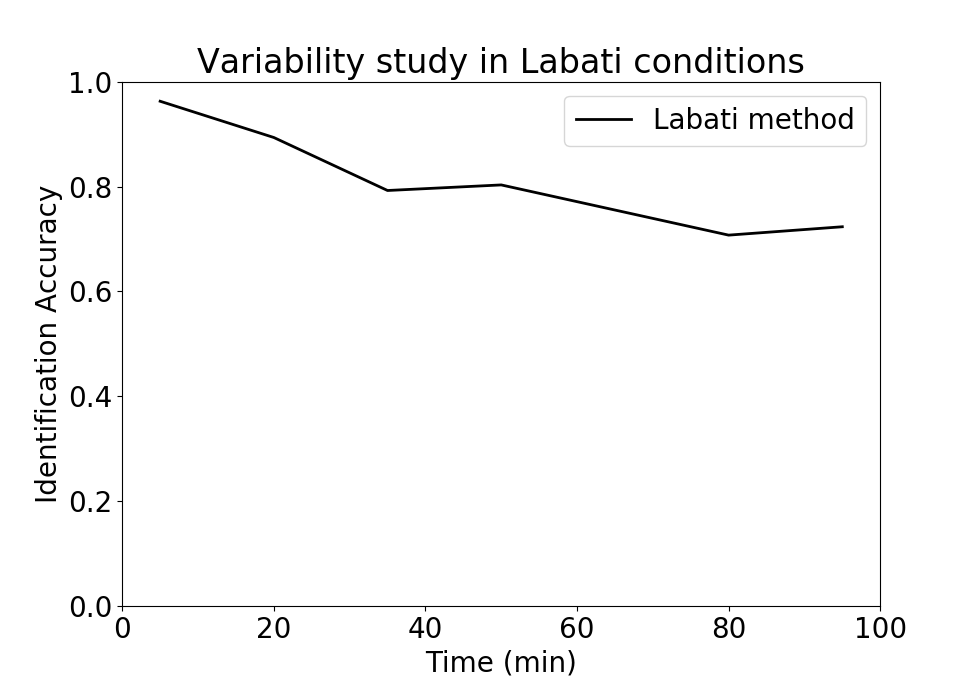
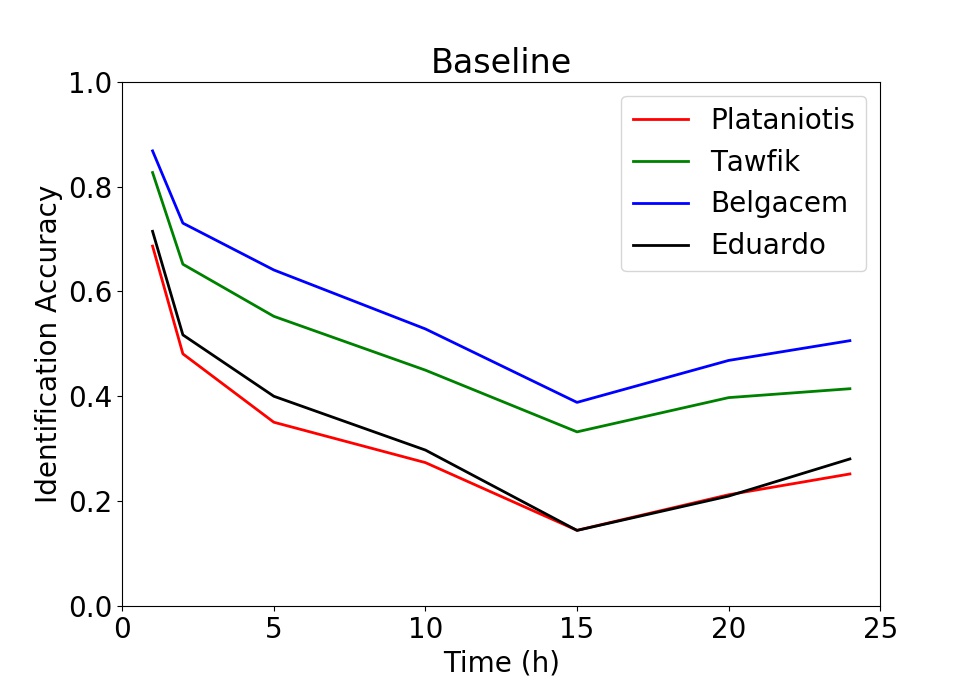
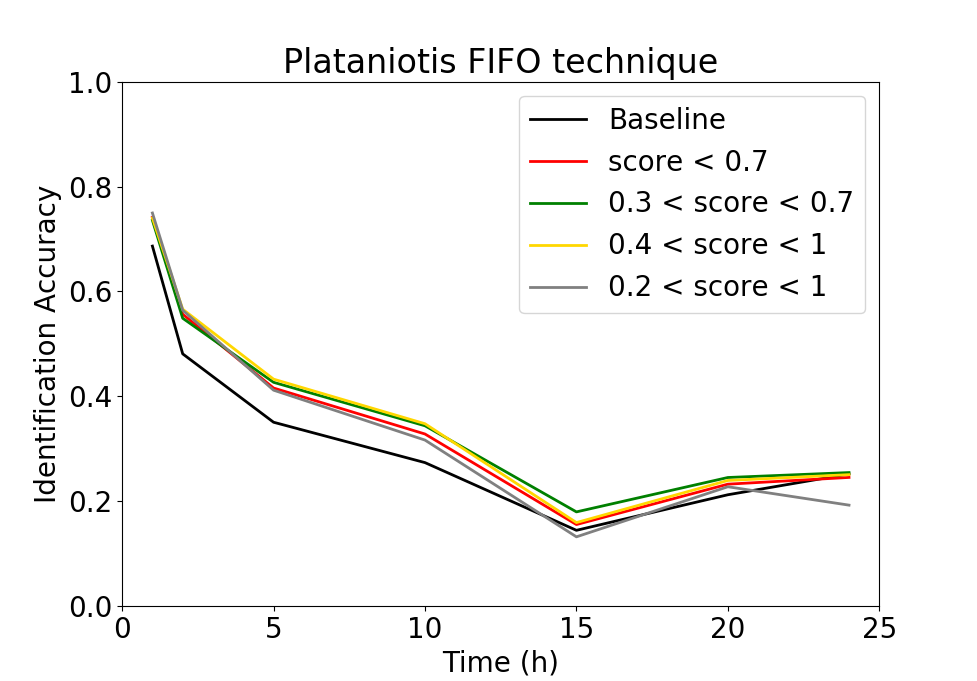
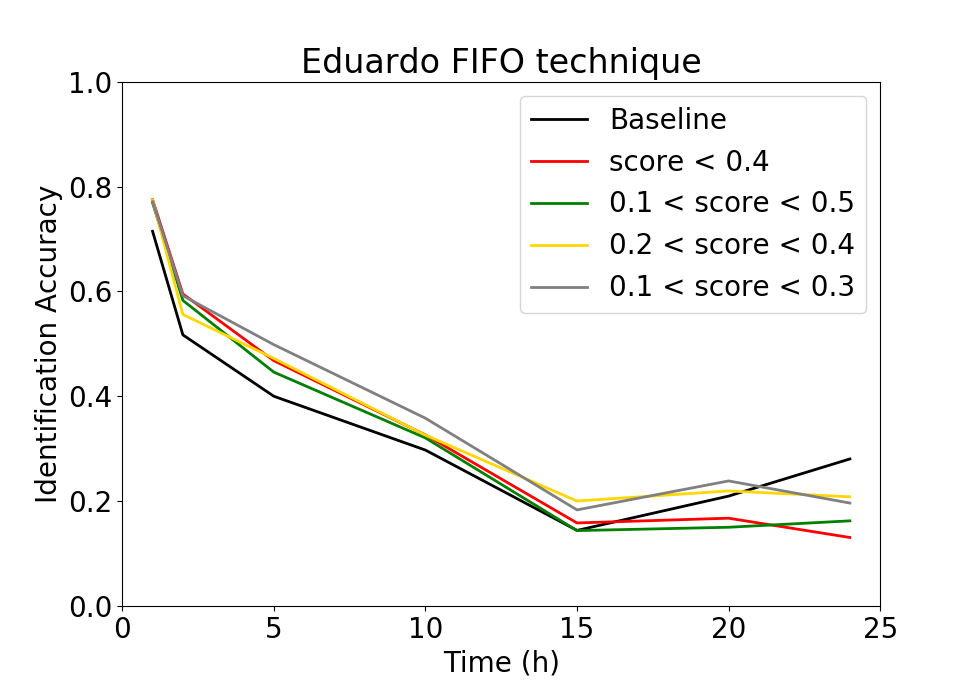
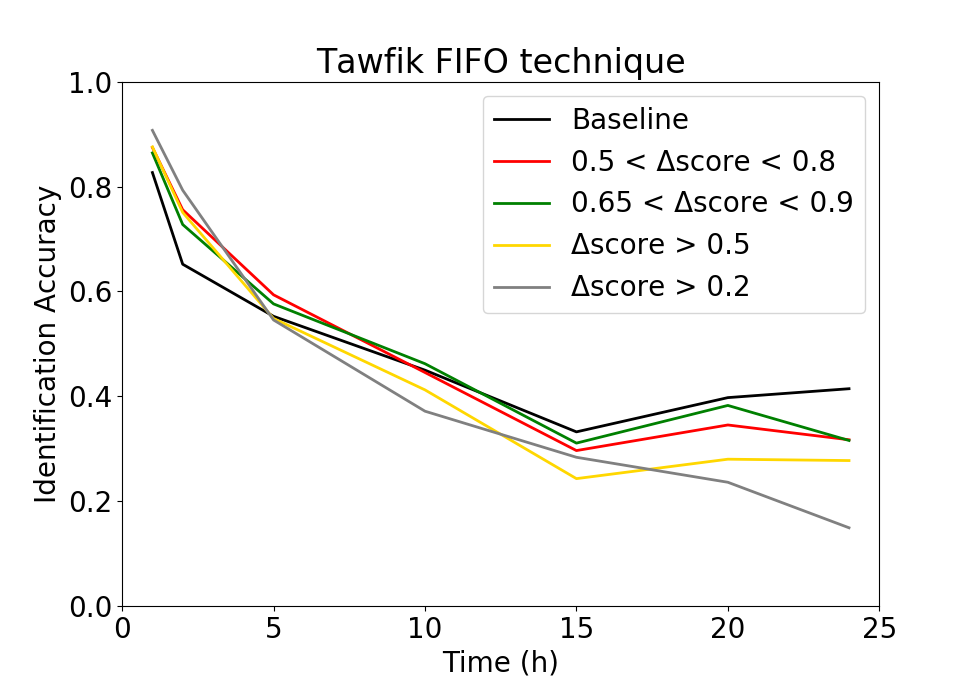
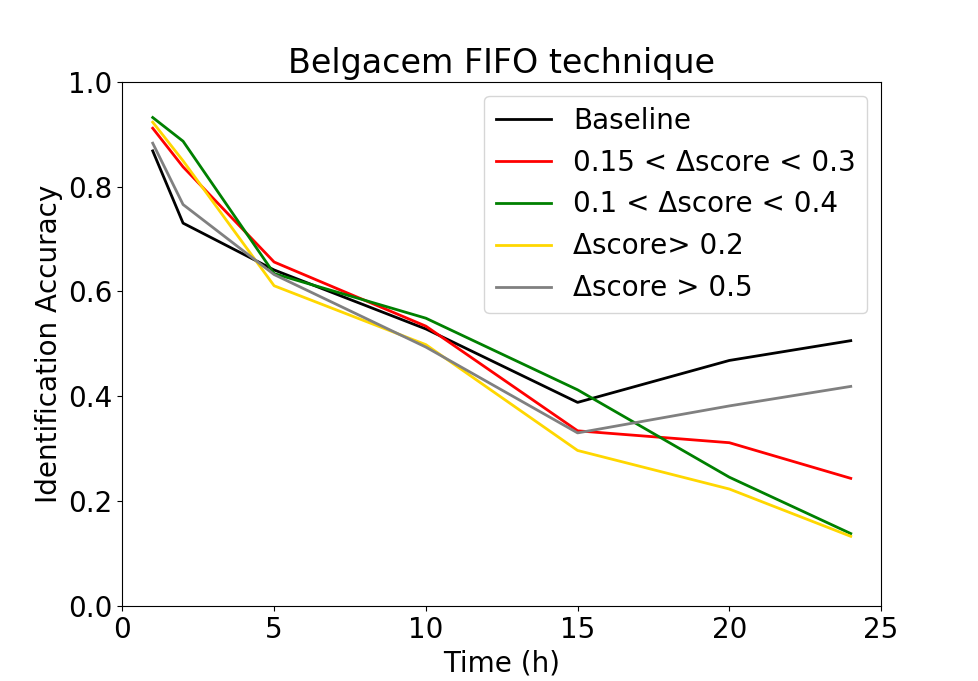
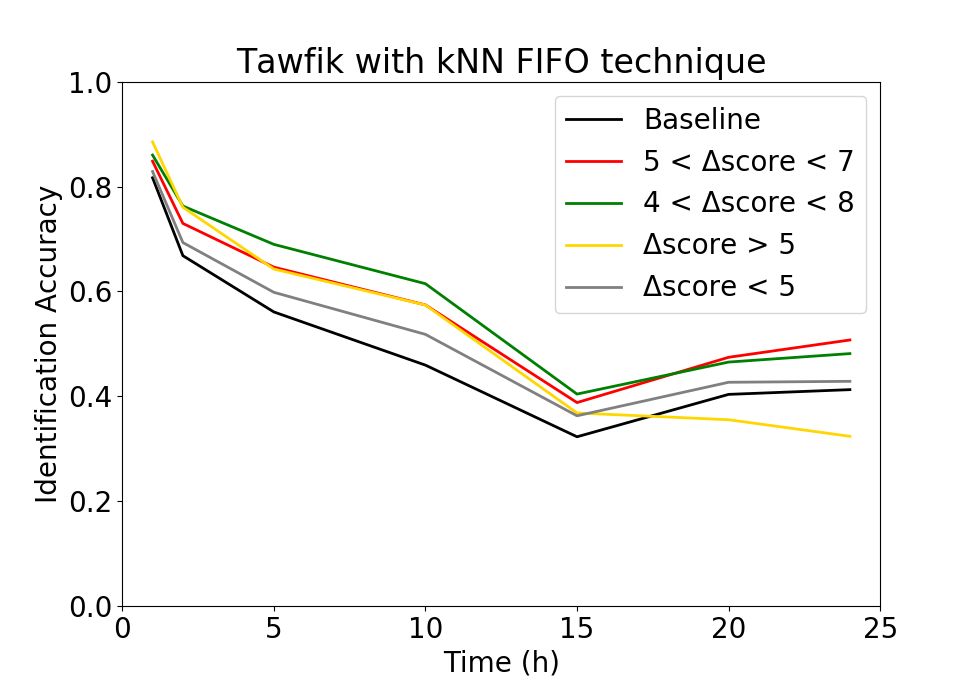
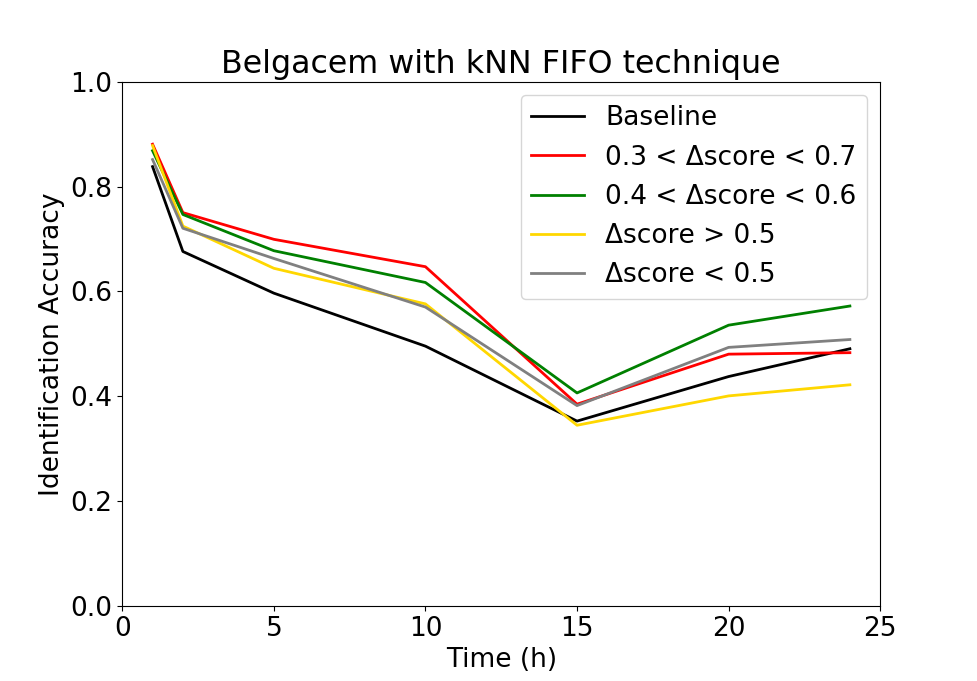
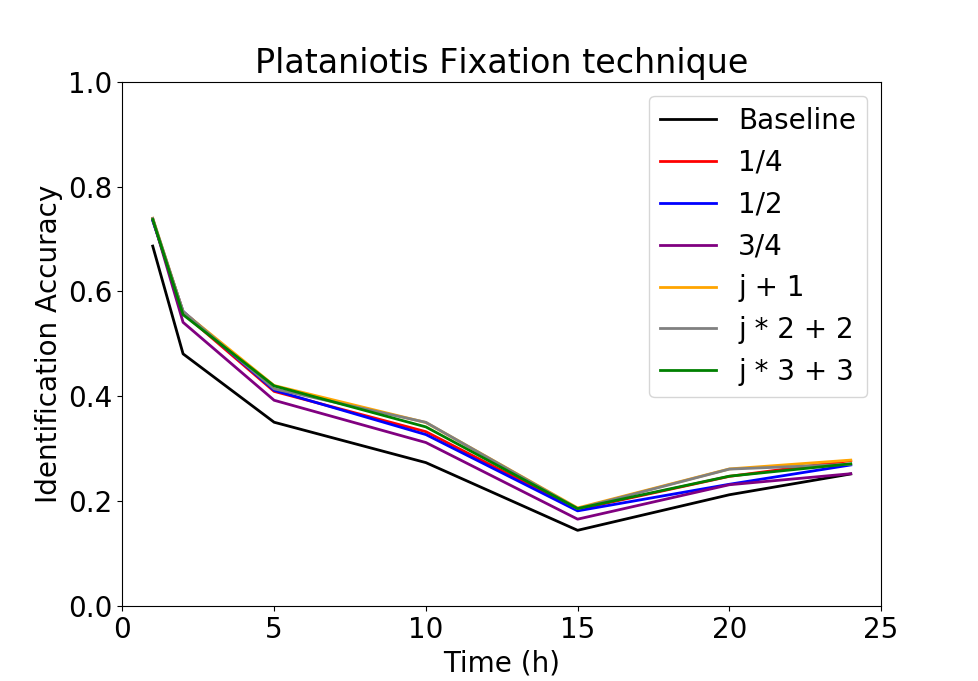
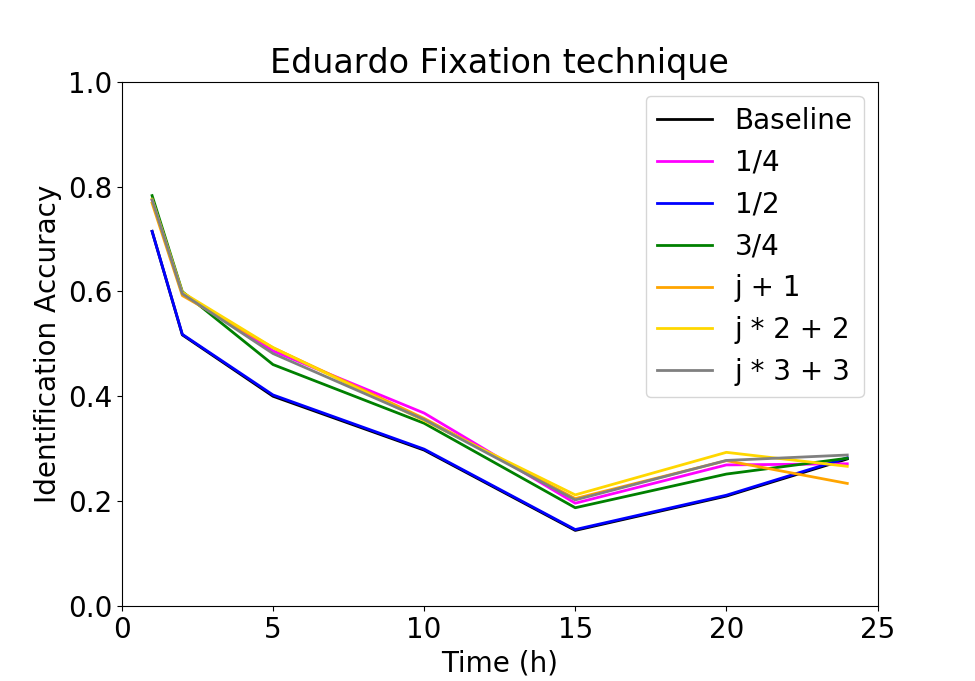
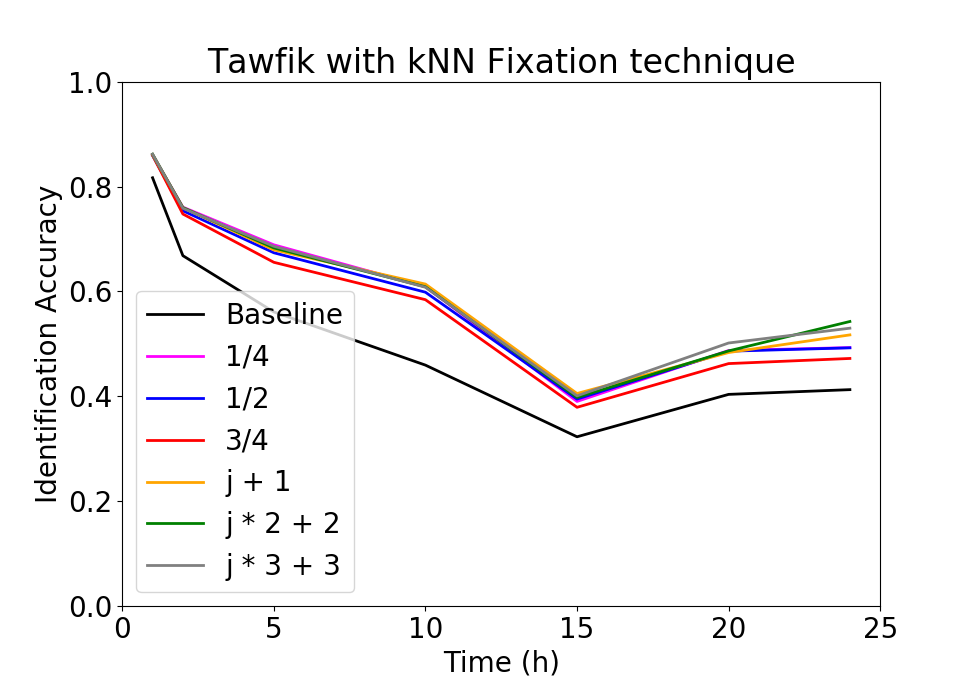
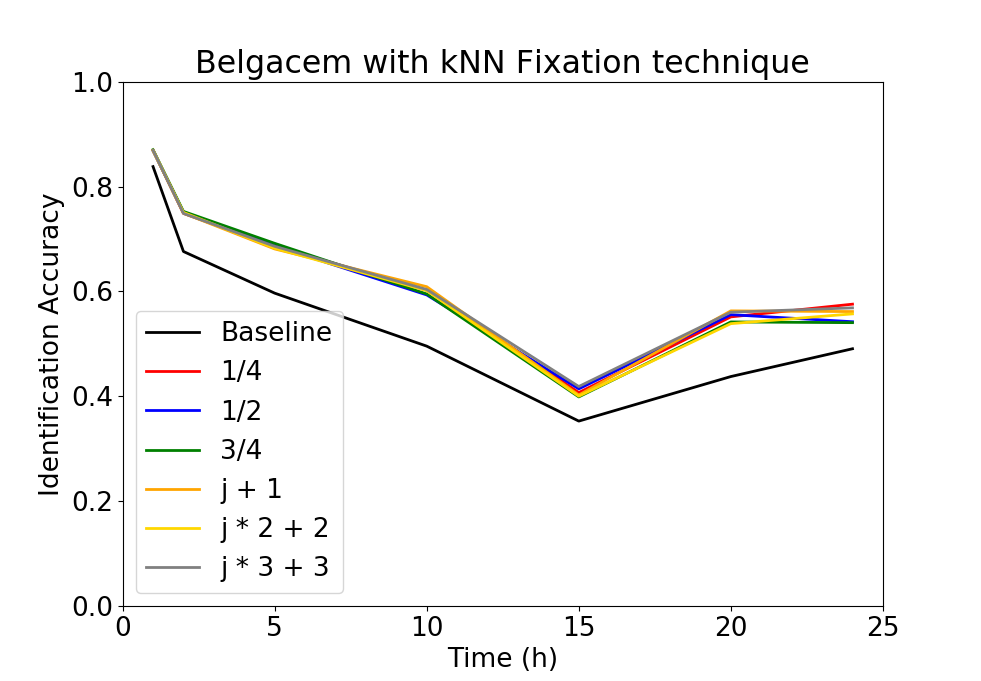
Considering the previous results, template update was applied to the methods, in an effort to avoid performance decay over time. Fig. 6.5 presents the results using the FIFO technique, with diverse thresholds.
For the methods of Plataniotis et al. and Eduardo et al., the best results were obtained using two thresholds, respectively, ( accuracy improvement) and ( accuracy), improving all performance results until the 15th hour. However, for the method of Belgacem et al., the performance worsens with template update after the first two hours (best results were obtained when the difference between the highest and second highest scores ). The same was verified for the method of Tawfik et al. which, in the first two hours, offered the best results with . In general, using two thresholds instead of one offered the best results.
Considering this, it appeared that the Random Forest and MLP classifiers are not suitable for these kinds of template/model update. This was confirmed after a repetition of the evaluation of these methods, with kNN replacing the classifiers (see Fig. 6.6). With kNN, the template update was able to reduce the performance decay over time, improving accuracy, on average, by and , respectively, for the methods of Belgacem et al. and Tawfik et al.
As for the Fixation technique, the obtained results were more promising (see Fig. 6.7). This template update technique brought performance improvements for all methods. The fixation technique that offered the best results was , improving the baseline identification accuracy, on average, by .
6.5.2 Deep convolutional network
The results for the implemented end-to-end convolutional neural network are presented in Fig. 6.8. Model update offered a small improvement in performance in the first test point ( versus without update). However, the model experiences sharp performance decay and, after the fifth hour, the model update is unable to improve identification accuracy. In fact, model update caused a decrease in identification rate, which is coherent with the findings regarding update with multilayer perceptron classifiers reported by Lopes et al. [269].
Different results were obtained when the fully-connected layer of the network was replaced by a kNN classifier (see Fig. 6.9). Although the results with kNN are slightly worse than those of the end-to-end network ( vs. for the first test point), the template update technique is more successful and is able to offer performance improvements for almost all test points.
When compared with the results reported by Lopes et al., the CNN (either end-to-end or with kNN classification) offers the best performance in the first test points after enrollment. However, it gradually loses that advantage as time passes, even with template update.
Likely, the network will require more data with more variability during the first training phase. Increasing the training data to thirty minutes or even a few hours per subject would enable the network to better learn the common variability patterns of the ECG. This should not only increase the initial performance, immediately after enrolment but also reduce the performance decay over time.
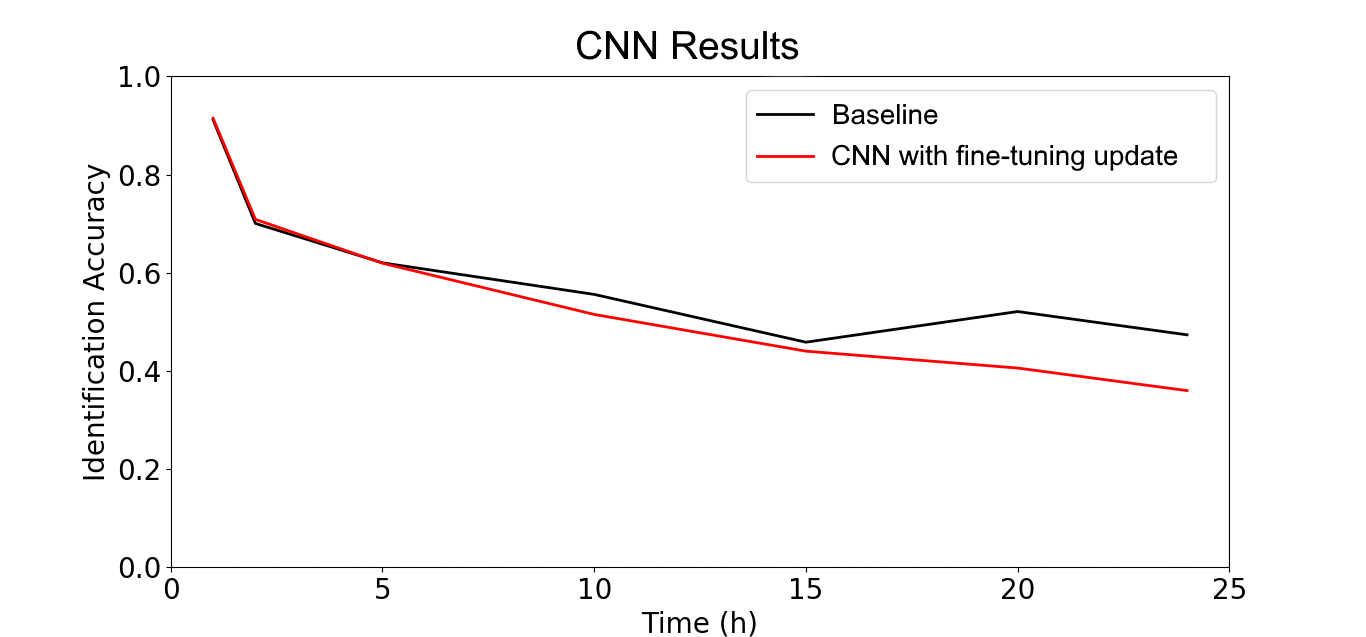
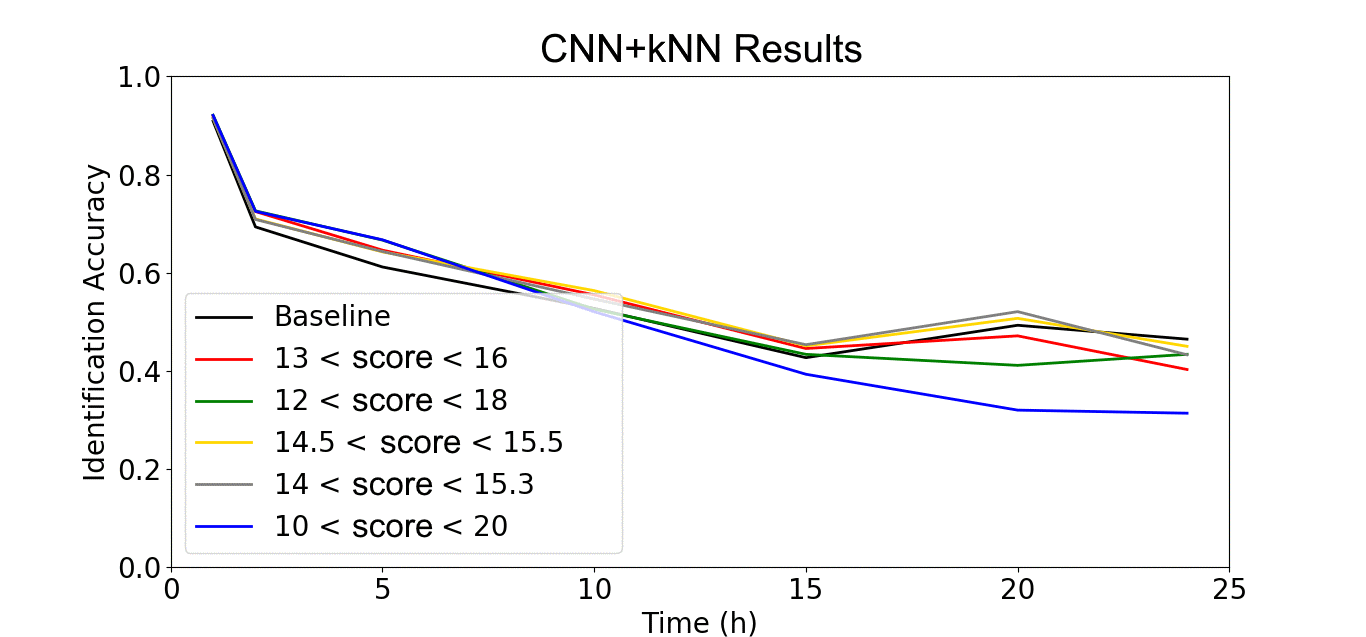
6.6 Summary and Conclusions
This work studied how ECG variability affects the performance of state-of-the-art biometric algorithms, and how template update could mitigate performance decay over time. The results have shown long-term identification performance in ECG biometrics is generally weak, despite the promising results often presented in the literature.
Template update techniques proved successful in enhancing the long-term performance of handcrafted state-of-the-art methods, especially when using template fixation techniques. Additionally, with a deep learning algorithm, results are better than traditional methods immediately after enrollment, although it offers slightly worse performance as time progresses.
Generally, one can conclude that further efforts are needed for the study and development of more advanced techniques. The obtained results in these more realistic settings show that the performance levels commonly reported in the literature would likely not be verified upon real application. Special focus should be devoted to supervised update techniques, so that ECG-based biometric systems can offer reliable performances over long periods.
Chapter 7 Leveraging Explainability
to Understand ECG Biometrics
7.1 Context and Motivation
Throughout the past twenty years, research on biometrics based on the electrocardiogram (ECG) has largely been a success story [343]. After successful proofs-of-concept in cleaner medical signals (on-the-person), the focus is quickly shifting to acquisitions in more realistic scenarios (off-the-person). Deep learning approaches [238, 284, 344, 338, 162] have been essential in dealing with the increased noise and variability in off-the-person settings, despite the performance and robustness issues that still hinder application in real scenarios.
However, deep learning decisions are obscure: unlike traditional methods based on fiducial features, we don’t know what information the model uses to distinguish people [372, 107]. One can assume that the models look mainly to the QRS since it is the most stable part of the ECG in the face of noise and variability [379, 172]. Several methods have thus focused on QRS complexes for ECG biometrics [446, 238], but this practice has become uncommon in recent works. This indicates the true role of this waveform complex in identity discrimination is still to be adequately recognised.
Currently, pattern recognition researchers understand the importance of knowing what specific information is relevant for their models to reach decisions. Retreating to easily explainable traditional models (such as decision trees) is often unacceptable due to their performance limitations. Hence, various interpretability tools are being developed to peek into the inner workings of deep networks applied to diverse tasks [67, 397, 385].
This work uses, for the first time in the literature, such interpretability tools on a deep ECG biometric model, to understand what parts of the ECG are most useful for automatic human identification. The model is a competitive state-of-the-art method [344, 338] applied for ECG-based identification in data subsets with diverse signal quality and number of identities. With this, we aim to assert the importance of the QRS and other waveforms for ECG biometrics and discuss future possibilities as this topic evolves towards more challenging and realistic scenarios. Additionally, we propose an intuitive way to visualise interpretations for unidimensional signals. The code and additional results are available online111xECG Github Repository. Available on: https://github.com/jtrpinto/xECG..
7.2 The Electrocardiogram as a Biometric Trait
As presented in Chapter 2, subsection 2.2.2, the ECG is approximately a cyclical repetition of a set of waveforms (P, Q, R, S, and T) that corresponds to a heartbeat (see Fig. 7.1) [286, 343]. Each of these waves corresponds to specific phenomena involved in the heart’s contraction and relaxation.
As a measurement of the electrical currents spread across the heart, the ECG signals will reflect the geometry of this organ. For example, larger hearts, with more cells to depolarise and repolarise, will result in ECG waveforms with larger amplitudes. Higher or lower basal heart rates will also result in different signal morphologies. Since heart geometry and basal heart rates vary across individuals, this intersubject variability is what makes the ECG sufficiently unique to be used in biometric recognition [172, 441].
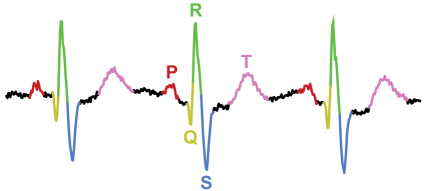
However, the ECG signals are also susceptible to intrasubject variability factors. Noise sources during acquisition, the short-term and long-term effects of exercise, emotional states, stress, drowsiness, and fatigue are some of the factors that reflect mainly in the heart rate variability, changing the morphology of the P-R and S-T segments [379, 10]. These are the sources of uncertainty that hinder the use of the ECG as a biometric trait. While these are largely controlled in medical or on-the-person settings (where the subject is at rest, laying down, and signals are acquired using several high-quality gel electrodes), their effects are dominant for realistic off-the-person signals (acquired using fewer dry electrodes on the hands, during common daily activities) [342, 343, 338].
When compared with the P and T waves, the QRS corresponds to a larger polarisation event over a shorter period. In practice, this makes the QRS more dominant over noise and intrasubject variability than the other ECG waveforms [342, 343]. Hence, the QRS is considered more stable over time and across variable conditions, which makes it better suited for biometric recognition.
Despite this, it is still unclear how much identity information is carried by the QRS complex compared to the other waveforms, and whether it is enough for an accurate and robust biometric recognition system. Studies on ECG-based biometric identification have shown it is possible to distinguish small sets of individuals in on-the-person settings using only the QRS complex or QRS fiducial amplitude and time measurements [446, 238]. Nevertheless, this practice is becoming uncommon as research evolves towards realistic off-the-person signals and larger databases.
This denotes that the sole use of the QRS may not be adequate for off-the-person settings, or the individual information carried by the QRS may not be enough to distinguish individuals in large populations. This work aimed to address these doubts through a study on the role and relevance of the QRS and the other waveforms in ECG-based biometric identification. Interpretability tools are used to assess which parts of the ECG are more relevant to the decisions of an end-to-end identification model [344], with on-the-person and off-the-person signals and data subsets with a varying number of identities.
7.3 Methodology
7.3.1 Biometric identification model
The biometric model for identification followed the architecture proposed by Pinto et al. [344], which has attained state-of-the-art results in off-the-person settings for both identification and, later, identity verification [338]. The model (see Fig. 7.2) receives five-second blindly segmented ECG signals and outputs probabilities for each of the identities considered. Finding the highest probability score allows us to assign the respective identity to the input signal.
The model consists of an end-to-end 1D convolutional neural network (CNN) with four convolutional layers (with filters, two layers with followed by two with ), followed by ReLU activation. Neighbouring convolutional layers are separated by max-pooling layers. The last convolutional layer is followed by two fully-connected layers ( neurons with ReLU and neurons with softmax activation).
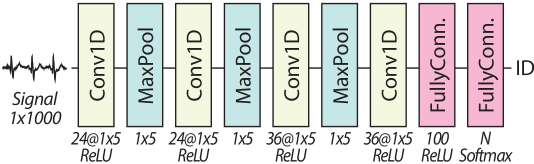
7.3.2 Interpretability tools
To capture the dynamics behind the decisions of the biometric model, four interpretability methods are applied to the trained model: Occlusion, Saliency, Gradient SHAP, and DeepLIFT. Occlusion and Saliency are two of the simplest interpretability methods, while Gradient SHAP and DeepLIFT are more sophisticated and powerful. These are implemented in the Captum toolbox [221] for PyTorch and are described below.
Occlusion
The Occlusion method [478] consists in measuring the influence of hiding a portion of the input on the output of the model. When hidden, the more relevant input parts will cause larger changes in the output, and will thus be assigned greater relevance in the explanations offered by this method. This is the simplest method to interpret a model, although the size of occluded regions should be carefully defined to obtain meaningful explanations.
Saliency
The Saliency method [401] is based on the gradients of a model given a certain input. Through backpropagation, the gradient of target class scores w.r.t. the input is obtained. A saliency map is then generated by rearranging the class score derivatives, generating saliency maps that assign higher relevance to input regions that correspond to higher gradients. Requiring a single backpropagation pass, this method is a simple and fast way to obtain explanations of model predictions.
Gradient SHAP
Gradient SHAP [283] is an approach based on game theory which considers the explanations of a model’s predictions as models themselves. For sophisticated deep learning models, the explanation models are simplified and interpretable approximations of the respective models. SHapley Additive exPlanation (SHAP) values, inspired by game theory’s Shapley values, are computed through the gradient of a random point between a baseline and the input with added random noise. The SHAP values denote how much a given part of the input raises the probability for the considered class, and are reportedly better aligned with human intuition and effective in discriminating among output classes.
DeepLIFT
DeepLIFT (Deep Learning Important FeaTures) [391] performs backpropagation to track the contributions to the output to the responsible parts of the input. Throughout this process, it compares the difference in inputs and outputs considering a reference (or baseline) input, assigning contribution scores to each neuron of the model. It also allows for the study of negative contributions: how much a specific part of the input contributes to lower the probability for the considered class.
7.3.3 Visualisation
Decision explanations obtained using interpretability tools are visualised using the multicoloured line plot feature of Matplotlib [183]. ECG signals are plotted so that the colour of each signal component represents its relative relevance to the decision. In this case, lighter yellow colours represent less relevant time samples, whereas more relevant samples assume darker purple colours. This way, both the ECG morphology and the relevance of each of its components are easily and intuitively presented.
7.4 Experimental Setup
The data used for model training and evaluation have been drawn from the Physikalisch-Technische Bundesanstalt ECG Database (PTB) [49, 146] and the University of Toronto ECG Database (UofTDB) [445]. The PTB database includes on-the-person (high-quality) 12-lead ECG signals acquired at 1 kHz from subjects at rest. The UofTDB includes single-lead off-the-person (more noisy and realistic) data acquired from subjects. To match the UofTDB, PTB signals were downsampled to Hz and only Lead I was used.
Five-second segments were blindly extracted (without fiducial detection) from the recordings. Fifty per cent of those segments (per identity) were used during training and the remaining were reserved for testing. This provided more challenging test settings than those commonly found in the literature, but also deliberately avoided the most realistic settings (see [338]), for the sake of obtaining meaningful interpretations.
To simulate gradually increasing identification difficulty within each database, subsets of identities are considered, with . The identities in each subset are the first in lexicographical order. Each subset includes all identities that compose smaller subsets, so subjects #1 and #2 are the main focus of analysis since these are present in all subsets. Throughout this paper, denotes the subset of UofTDB data from subjects and denotes the subset of PTB data from identities. As stated in Table 7.1, was used instead of to take advantage of the entire PTB dataset. Model training details can be found online at this project’s repository.
Performance evaluation is based on the True Positive Identification Rate (or accuracy): the fraction of test samples that are correctly assigned to their true identity by the trained model. Interpretations are examined through the proposed visualisation method.
7.5 Results and Discussion
| Database | Number of Identities | ||||||||
| 2 | 5 | 10 | 20 | 50 | 100 | 2001 | 500 | 1019 | |
| PTB | 100.0 | 100.0 | 99.63 | 99.50 | 98.92 | 98.76 | 97.73 | - | - |
| UofTDB | 100.0 | 97.26 | 98.30 | 95.46 | 93.86 | 91.16 | 89.70 | 91.20 | 91.45 |
1For PTB, this column corresponds to the entire set of 290 subjects.
The results of the performance evaluation are presented in Table 7.1. These results roughly follow the expected patterns considering the use of on-the-person versus off-the-person ECG data. The model is able to attain high true positive identification rates in both databases when the population is small, but as the set of subjects grows, performance decreases and a wide gap distinguishes the more challenging off-the-person settings from the more controlled on-the-person settings.
Additionally, one can find some unusual patterns in the performance results. Considering , one would expect identification performance with subset to be higher than with subset . With UofTDB off-the-person data this is not always verified: e.g., from to , performance increases from to . In these cases, we need to consider that datasets with fewer identities have fewer data and, thus, more unstable results. Alternatively, the identities added to to create may be easier to discriminate (“sheep”, according to the concept of biometric menagerie [104, 468]) and thus contribute to improving accuracy. However, one should also regard the substantial regularisation needed to avoid overfitting and the instability during training as possible causes for these discrepancies. This is a very important insight into the increased difficulties of using off-the-person data and the need for improved and more robust biometric models.
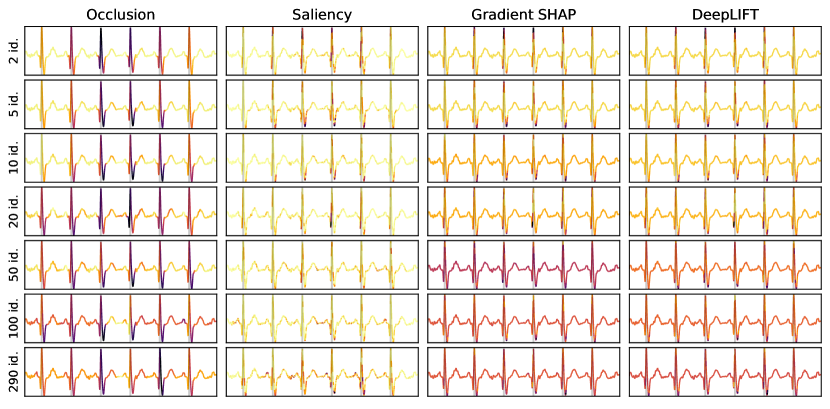
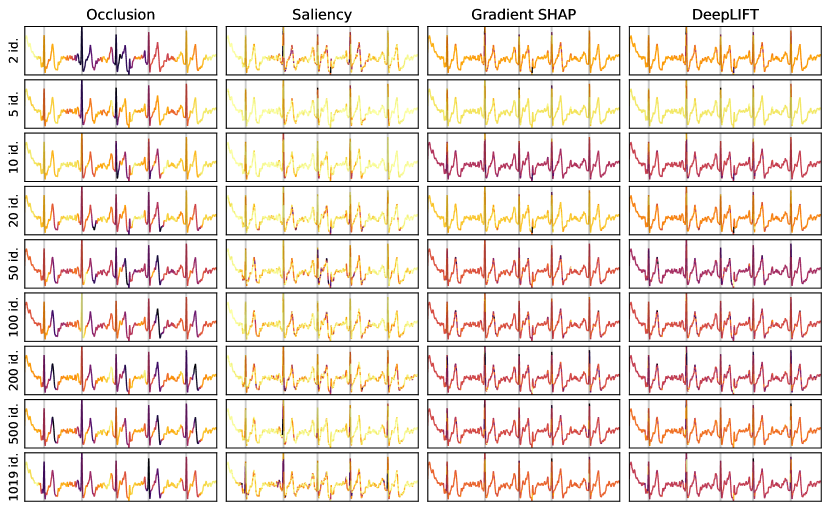
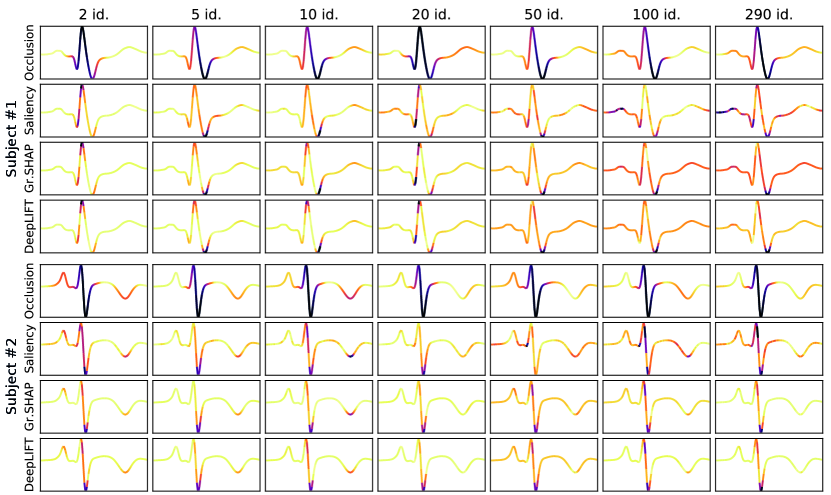
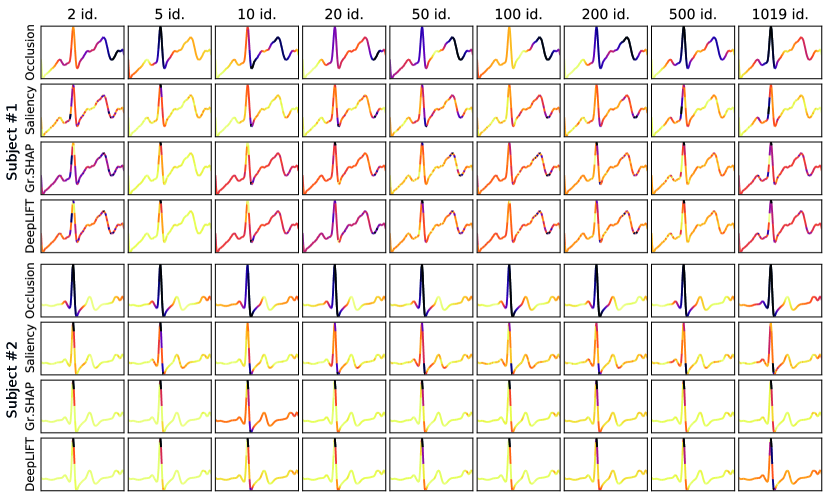
Analysing the explanations obtained using the four interpretability tools (examples in Fig. 7.3 and Fig. 7.4), a trend is verified from smaller to larger identity subsets, consisting on the deviation from focusing mainly on the QRS complex to the increasing relevance of other parts of the heartbeats. This is also confirmed when combining the explanations of all heartbeats of each person into a single average heartbeat (see Fig. 7.5 and Fig. 7.6).
With the cleaner medical signals from PTB, the focus is mostly on the QRS complex, but information from other waveforms starts to become more and more relevant as more identities are added. It is noteworthy how, when discriminating PTB subjects #1 and #2 in a two-subject scenario (see Fig. 7.5), the model still focuses mainly on the QRS, even though subject #2 has a very specific characteristic, the inverted T-wave, that is arguably their most distinctive feature. This denotes how, in these cleaner signals, the QRS complex is so stable that the remaining waveforms, more susceptible to heart rate variability, are largely ignored by the model regardless of any visually obvious intersubject differences they may present.
With the more realistic off-the-person signals from UofTDB, the QRS retains high importance but the relevance is more evenly spread among the signal waveforms. In the specific case of subject #2 (see Fig. 7.6), it is evident that the QRS retains the highest importance for the decision, even in (the largest subset). This may denote that, even in these more challenging settings, the identification models will still give preference to the QRS over other waveforms if it is sufficiently unique among the considered identities. Nevertheless, in such large sets of identities, the expected behaviour is that of subject #1 (see Fig. 7.6), since the limited identity information carried by the QRS will lead the model to also look to other parts of the signal.
One interesting aspect is the difference between the results with Occlusion versus the other methods. Occlusion generally grants the QRS complex much more relevance, regardless of the settings. In the state-of-the-art approaches, the QRS complex is not only a source for identity features but also frequently used as an easily detectable reference landmark for the location of other ECG waveforms. This may also be the case in this end-to-end deep model. Although there are challenging contexts where the QRS may not be the main contributor to the decision, it may be essential to the deep model as a reference landmark to locate other waveforms in the signal. Hence, when occluded, it will be the signal component that most impacts the decision, causing the occlusion method to generally consider it the most relevant.
7.6 Summary and Conclusions
This work aimed to explain how deep models use ECG signals to distinguish people, using interpretability tools. Overall, the obtained results partially confirm the claim that the QRS is the key to ECG-based biometrics. With small populations in on-the-person settings, it can alone be used for reliable recognition. However, as we evolve towards larger populations and off-the-person settings, other components become relevant in discriminating people, as the models require more identity information to overcome the hurdles placed by enhanced intrasubject variability.
However, even though relevance is more evenly shared in off-the-person identification in large sets of identities, the QRS is shown as essential by the occlusion method. It appears that, just like several literature methods, the implemented end-to-end model learnt to use the QRS as a landmark for the location of other ECG components in the signal, resulting in large output changes when the QRS is occluded. Hence, despite the literature claims, one should avoid relying too heavily on any single part of the ECG, including the QRS complex, since all waveforms carry identity information that proves increasingly useful in more realistic settings and larger populations.
Beyond these insights, further efforts should be devoted to extending this study and offering a deeper, more thorough, and more objective analysis of the contribution of each ECG waveform to the model’s decisions. Obtaining more systematic and complete explanations could create new opportunities for the use of interpretability tools during model training. Using explanations to regularise models and promote the focus on the most relevant signal components or the distributed use of the whole signal (instead of just the QRS) could lead to improved recognition accuracy and robustness.
Chapter 8 Interlead Conversion of Electrocardiographic Signals
8.1 Context and Motivation
The electrocardiogram (ECG) is the measurement of electrical potentials that make the heart contract and relax as intended. The morphology of the ECG signal depends on the location of the electrodes used for acquisition: different electrode placement results in different perspectives over the heart [343]. For medical purposes, the standard configuration acquires the ECG over twelve leads for more information, but it requires ten electrodes placed on the patient’s arms, legs, and chest. Using fewer electrodes allows for more comfortable and inexpensive acquisitions, at the expense of certain leads that could be ideal for a more accurate diagnosis of certain conditions.
To get the best of both worlds, researchers have proposed methods for the automatic interlead conversion of ECG signals [395, 408, 244, 293, 407]. These transform short ECG segments to mimic other perspectives, using acquired leads to reconstruct any leads that were not recorded. However, these methods still present limited applicability, since they typically require multiple leads as input. Even the most advanced methods [244, 293], that only use one input lead, still require the inputs to be single heartbeat segments aligned in time, which makes them dependent on separate processes and, overall, less flexible and robust.
This chapter presents a study on the feasibility of ECG interlead conversion using short segments from just one limb lead without any kind of temporal alignment (blindly-segmented). With such input, the proposed methodology is trained to reconstruct other leads as faithfully as possible. This aims to open up new possibilities for more comfortable ECG acquisition in clinical scenarios or wearable devices without giving up the benefits of multi-lead recordings for medical diagnosis.
The proposed methodology, based on deep learning encoder-decoder structures, is explored for interlead conversion using either lead II or lead I (limb leads) signals as reference, and using a single shared encoder or an individual encoder for each target lead. Beyond the training and testing on the widely used PTB database, the conversion models are evaluated on cross-database scenarios with the INCART and PTB-XL databases. Additionally, the clinical annotations of the PTB-XL database are also used for a differential performance evaluation in the presence of medical conditions. The code is available online111Interlead ECG Conversion Github Repository. Available on: https://github.com/jtrpinto/ecg-conversion..
8.2 Related Work
At the onset of research on interlead conversion, methodologies commonly required several leads as reference for robust lead reconstruction. Zhu et al. [496] performed a preliminary study on the conversion of ambulatory ECG recordings into standard 12-lead ECG signals using lead-field theory and the least-squares method. Nelwan et al. [306] learned generic and patient-specific linear regression coefficient templates to reconstruct up to four missing leads with high correlation results.
Later, Yoshida et al. [474] used 12 lead acquisitions to synthesise additional leads (right ventricular leads V3R, V4R, and V5R and posterior chest leads V7, V8, and V9) which provide important information for the diagnosis of acute myocardial infarction. Their algorithm was based on the transfer coefficient estimated from the learning data.
Silva et al. [395] developed three methods for obtaining the Frank leads using the 12 standard leads as reference: the Kors Quasi-Orthogonal method, the Kors Linear Regression method, and the Dower Inverse Matrix. The conversion was successful for signals from healthy subjects but presented limitations on signals from subjects with pathologies. The recent work by Smith et al. [407] was one of the first to use machine learning techniques for interlead conversion. They used a focused time-delay neural network (FTDNN), which is well suited for time series prediction. However, their methodology required seven input leads (all limb leads and V1).
Atoui et al. [22] used ensembles of fully-connected neural networks to learn to synthesise V1, V3, V4, V5, and V6 heartbeats from three-lead inputs (I, II, and V2). Schreck and Fishberg [380] performed the first study on the synthesis of the entire set of 12 standard leads and scalar 3-lead derived vectorcardiogram from just three measured leads. Their proposed methodology used nonlinear optimisation to construct a universal patient transformation matrix. Hansen et al. [165] applied linear generic and subject-specific transforms to convert recordings from adhesive patch-type ECG monitors to the standard 12-lead ECG signals. In [438, 435], researchers also explored personalised statistically determined linear transforms and went on to achieve improved results.
Lee et al. [243] proposed methods based on linear regression and artificial neural networks to reconstruct the 12 standard leads from subsets of 35 channels acquired using one single large patch covering the subject’s chest. Although accurate, the method is arguably incompatible with scenarios focused on ease of use and patient/user comfort. Similarly, Grande-Fidalgo et al. [154] used linear regression and fully-connected networks to reconstruct the entire set of twelve standard leads from a subset of just three input leads. Sohn et al. [408] used long short-term memory (LSTM) networks to reconstruct the twelve ECG standard leads from a three-lead patch-type device. Their results show their method was able to correctly retain pathological abnormalities from medical conditions on the reconstructed signals.
The work of Lee et al. [244] was one of the few that studied the synthesis of standard leads using only one reference lead. In their study, chest leads (V1 to V6) were synthesised from lead II using a generative adversarial network (GAN). However, input segments had to be single heartbeats, aligned according to the R-peaks, which decreases the difficulty of the proposed method but also its applicability. Matyschik et al. [293] developed patient-specific models to more accurately reconstruct eleven missing ECG signals from a single available lead of the standard 12-lead system. However, the reference lead was either V1, V2, or V3 which, being chest leads, do not enable the usage in less obtrusive setups which would preferentially use limb leads.
In this work, we explore the more challenging scenario of reconstructing the entire set of twelve standard leads using only one reference lead. Moreover, the reference signals are blindly-segmented (without any kind of temporal alignment) and pertain to one of the limb leads to allow for applications on the least obtrusive setups. Our main goal is to assess whether it is possible to reconstruct the electrocardiogram signal in such challenging scenarios and discuss the next steps towards the use of interlead conversion in less obtrusive clinical setups and wearable devices.
8.3 Methodology
8.3.1 General overview
The proposed methodology for interlead ECG conversion follows the encoder-decoder structure typically used for deep image segmentation. The encoder receives an input signal and processes it to create a compressed representation that retains relevant information for the task at hand. The decoder receives this representation and processes it so that the output matches the ground-truth as closely as possible. Here, the input to the encoder is a short ECG segment of one lead (X) and the ground-truth is the corresponding segment in a different lead (Y). Thus, the encoder is in charge of selecting the information from X that is needed for Y, and the decoder will use that information to reconstruct the corresponding lead Y signal.
8.3.2 Model architectures
The general encoder-decoder structure allows for diverse specific model architectures. This work focuses on the U-Net model, a fully convolutional architecture that has found many applications related to semantic segmentation and can also be adapted for the task of ECG lead conversion.
8.3.2.1 U-Net
The U-Net was initially proposed by Ronneberger et al. [367] as a tool for biomedical image segmentation. In this work, the implemented architecture (see Fig. 8.1) receives an input segment of lead X, which initially goes through a chain of three sequential blocks, each with half the signal resolution of the previous block. Each block includes two convolutional layers (each followed by batch normalisation and ReLU activation) and ends with a max-pooling layer.
Between the encoder and the decoder, two convolutional layers compose the latent space or bottleneck block, which corresponds to the maximum point of information compression. The decoder mirrors the encoder in its structure, with three similar blocks composed of an upsampling layer and two transposed convolutional layers. The last transposed convolutional layer outputs a single-channel signal whose size corresponds to the input segment. The activation function of this last layer is the hyperbolic tangent for an output signal with amplitudes in .
One aspect of the U-Net which is often cited as the key to its widespread success is the skip-connection. U-Nets typically include skip-connections between corresponding blocks on the encoder and the decoder. This means the feature maps from the encoder blocks are directly routed to the corresponding decoder blocks, allowing the model to propagate context information from multiple resolutions between the encoder and the decoder for higher flexibility.
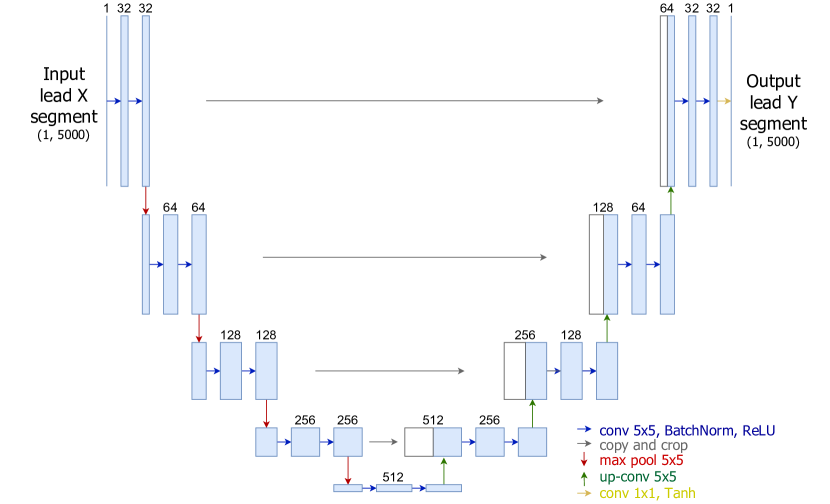
8.3.2.2 Convolutional autoencoder (AE)
Beyond the aforementioned U-Net architecture, adapted for unidimensional signal inputs, we also explore a convolutional autoencoder (AE, see Fig. 8.2). Its architecture is very similar to the U-Net, albeit without skip-connections. As a result, the structure is simplified, when compared to the U-Net, and the latent representation sent from the encoder to the decoder is smaller. Experiments with the AE architecture aim to assess if the skip-connections are essential for the task at hand or if the simplified structure could avoid overfitting and bring performance benefits.
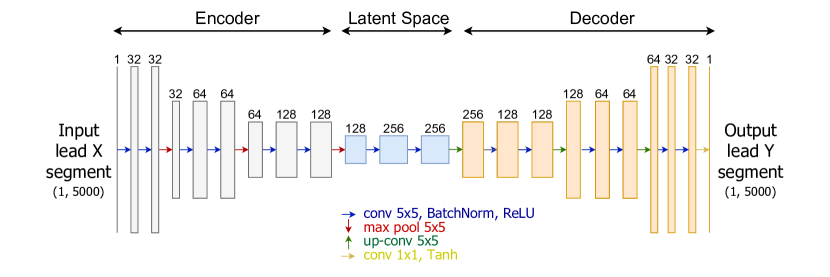
8.3.2.3 Label refinement network (LRN)
The third architecture explored in this work was based on Label Refinement Network (LRN, see Fig. 8.3) was originally proposed by Islam et al. [190] for semantic image segmentation. Its architecture is identical to the aforementioned U-Net. The singularity of the LRN lies in the supervision strategy: while the U-Net only uses the output of the last decoder block in the reconstruction loss, the LRN computes the loss at the outputs of every decoder block. This results in supervision at several resolution levels, leading the decoder to offer a coarse reconstruction right after the first block, which should be gradually refined by the subsequent blocks for improved results at higher resolutions. Experiments with the LRN architecture aim to assess if the multi-level resolution could bring improved performance to the task of signal lead conversion as they have for semantic segmentation.
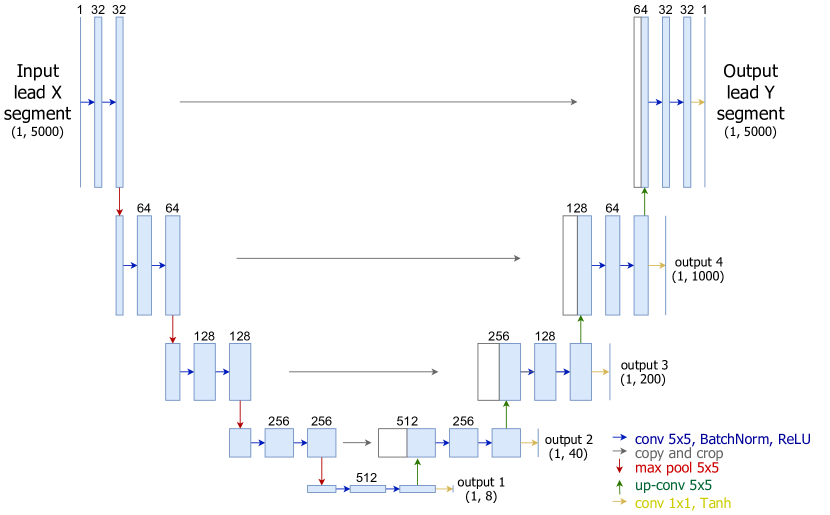
8.3.3 Shared vs. individual encoders
The conversion of one lead into multiple missing leads requires multiple decoders - each one will fulfil the task of reconstructing their respective lead based on the compressed latent representation. In the case of the encoder, however, it is possible to have a single one whose output will be shared by all decoders or have multiple encoders, each one dedicated to one individual decoder.
In this work, we explore both possibilities for 12-lead reconstruction - using one shared encoder connected to all 11 decoders, for all 11 output leads except the one corresponding to the input, or using one individual encoder for each of the 11 decoders. Using individual encoders grants more flexibility to each lead conversion process, as each encoder will be able to learn a unique way to obtain compressed representations and each encoder-decoder pair will work independently from all others. On the other hand, using one shared encoder results in a much lighter and faster algorithm and the added simplicity may contribute to avoiding overfitting.
8.4 Experimental Setup
8.4.1 Data
The experiments conducted in this work used mainly the data provided in the PTB Diagnostic ECG Database [49], available on Physionet [146]. The PTB database includes data from 16 channels, including all 12 standard leads, sampled at kHz. It contains a total of records from individuals, with one to five records per subject. Recordings were cropped into segments of s ( samples). A second-order Butterworth bandpass filter with cut-off frequencies was applied to each segment to remove noise while retaining the most useful ECG information. The amplitudes of the values of each signal were then min-max normalised to the interval following the equation:
| (8.1) |
The data from PTB was divided into train and test sets, with approximately , and of the segments, respectively, for a total of , , and ECG segments for each set. For a more thorough and challenging evaluation, subjects are divided between the train/validation and test sets: the latter had recordings from subjects to while the former had recordings from subjects to .
The INCART database (officially the St. Petersburg INCART 12-lead Arrhythmia Database), also available on Physionet, was used to test the performance of trained models on cross-database scenarios. This database contains Holter recordings from subjects undergoing tests for coronary artery diseases. Each record is minutes long and contains twelve standard leads sampled at Hz. Recordings from this database were resampled to kHz and processed as described above for PTB.
The PTB-XL database [444, 443], created by the same team as the PTB, includes clinical ECG recordings from a total of patients. Each recording is 10 seconds long, includes all twelve standard ECG leads, and is originally sampled at Hz. The waveforms were annotated by up to two cardiologists, who assigned annotations to each record. The 71 possible annotation statements have been clustered into five superclasses: NORM (normal ECG), MI (myocardial infarction), STTC (ST/T change), CD (conduction disturbance), and HYP (hypertrophy). This dataset was originally created for the training and evaluation of automatic ECG interpretation algorithms but also shows great promise for the development of lead conversion algorithms. In this work, we take advantage of expert clinical annotations to study the effect of medical conditions on the quality of the lead conversion results. From the total of recordings, we selected the that did not have conflicting superclass annotations. From each recording, the first seconds were cropped, resampled to kHz, and processed as described above for PTB.
8.4.2 Model training and evaluation
The models were trained using the -loss between the model outputs and the corresponding ground-truth signals as the objective function. The was chosen empirically as it allowed the model to learn most adequately both the overall morphology of the signals and their finer details. The Adam optimiser was used with an initial learning rate of , over a maximum of epochs with batch size (shared encoder) or (individual encoder) and early stopping patience of epochs.
To compare lead conversions with the corresponding measured ground-truth signals, this work used the following metrics: the average and median Pearson correlation coefficient (, used in the majority of the related literature), the average root mean square error (RMSE), and the average Structural Similarity Index Measure (SSIM).
8.5 Results and Discussion
8.5.1 Architecture comparison
To compare the selected architectures, the first experiment entailed the one-to-one lead conversion from II to I, two of the most used ECG leads for medical purposes (see Table 8.1). According to the results, the U-Net performs better than both alternatives AE and LRN. Although the AE achieves the same median as the U-Net, the average is lower, meaning that the least successful results are generally worse with the AE than with the U-Net.
| Model | (avg.) | (med.) |
| U-Net | 0.69 | 0.78 |
| Autoencoder | 0.67 | 0.78 |
| LRN | 0.65 | 0.75 |
| Average Correlation to Lead II | |||||||||||
| I | III | aVR | aVL | aVF | V1 | V2 | V3 | V4 | V5 | V6 | |
| PTB | 0.45 | 0.36 | -0.71 | 0.01 | 0.77 | -0.34 | -0.20 | 0.00 | 0.28 | 0.72 | 0.81 |
| INCART | 0.46 | 0.80 | -0.86 | -0.49 | 0.95 | -0.45 | -0.19 | 0.25 | 0.65 | 0.82 | 0.77 |
| PTB-XL | 0.70 | 0.31 | 0.25 | -0.82 | 0.83 | -0.44 | -0.04 | 0.37 | 0.68 | 0.81 | 0.84 |
| Shared Encoder | Individual Encoders | |||||||||
| Lead | (avg.) | (med.) | RMSE | SSIM | (avg.) | (med.) | RMSE | SSIM | ||
| I | 0.67 | 0.73 | 0.28 | 0.28 | 0.66 | 0.71 | 0.29 | 0.26 | ||
| III | 0.56 | 0.65 | 0.29 | 0.63 | 0.56 | 0.70 | 0.29 | 0.64 | ||
| aVR | 0.89 | 0.95 | 0.12 | 0.92 | 0.90 | 0.95 | 0.12 | 0.92 | ||
| aVL | 0.47 | 0.58 | 0.36 | 0.15 | 0.47 | 0.61 | 0.36 | 0.16 | ||
| aVF | 0.81 | 0.88 | 0.20 | 0.64 | 0.83 | 0.90 | 0.19 | 0.64 | ||
| V1 | 0.77 | 0.84 | 0.20 | 0.87 | 0.80 | 0.86 | 0.18 | 0.88 | ||
| V2 | 0.66 | 0.72 | 0.26 | 0.80 | 0.67 | 0.75 | 0.24 | 0.81 | ||
| V3 | 0.56 | 0.62 | 0.33 | 0.65 | 0.59 | 0.66 | 0.31 | 0.66 | ||
| V4 | 0.50 | 0.57 | 0.36 | 0.43 | 0.50 | 0.58 | 0.36 | 0.44 | ||
| V5 | 0.70 | 0.77 | 0.27 | 0.36 | 0.74 | 0.80 | 0.26 | 0.40 | ||
| V6 | 0.79 | 0.87 | 0.21 | 0.49 | 0.80 | 0.87 | 0.21 | 0.49 | ||
The skip-connections give it the capability to send more information (and at more resolution levels) from the encoder to the decoders, granting it more flexibility and ultimately better performance than the AE. The multi-resolution supervision of the LRN, expected to improve overall performance, appears to excessively draw the model’s attention away from the details, which results in worse performance. Following the results of this comparison, subsequent experiments focus solely on the U-Net architecture.
8.5.2 One-to-all leads conversion
Not all leads can be converted equally: the correlation between leads depends on their perspectives of the heart. Table 8.2 presents an overview of the average correlation between lead II and the remaining eleven standard leads, computed using the PTB, INCART, and PTB-XL test segments. Specifically for the PTB data, one can observe that some leads such as aVF or aVR are highly (positively or negatively) correlated with lead II. On the other hand, aVL is almost orthogonal. Hence, one should expect aVL to be much harder to accurately convert from lead II than aVF or aVR, since the former shares much less information with lead II than the latter.
| Average Correlation to Lead I | |||||||||||
| II | III | aVR | aVL | aVF | V1 | V2 | V3 | V4 | V5 | V6 | |
| PTB | 0.45 | -0.49 | -0.82 | 0.82 | -0.05 | -0.47 | -0.21 | 0.03 | 0.30 | 0.64 | 0.68 |
| INCART | 0.46 | 0.02 | -0.62 | 0.32 | 0.26 | -0.36 | 0.01 | 0.11 | 0.35 | 0.51 | 0.44 |
| PTB-XL | 0.70 | -0.24 | 0.77 | -0.86 | 0.32 | -0.54 | -0.06 | 0.33 | 0.63 | 0.80 | 0.83 |
| Shared Encoder | Individual Encoders | |||||||||
| Lead | (avg.) | (med.) | RMSE | SSIM | (avg.) | (med.) | RMSE | SSIM | ||
| II | 0.49 | 0.54 | 0.37 | 0.17 | 0.50 | 0.55 | 0.36 | 0.19 | ||
| III | 0.44 | 0.49 | 0.35 | 0.53 | 0.46 | 0.52 | 0.35 | 0.55 | ||
| aVR | 0.89 | 0.92 | 0.14 | 0.92 | 0.90 | 0.93 | 0.13 | 0.93 | ||
| aVL | 0.76 | 0.84 | 0.25 | 0.45 | 0.77 | 0.85 | 0.26 | 0.46 | ||
| aVF | 0.26 | 0.29 | 0.43 | 0.28 | 0.28 | 0.32 | 0.42 | 0.27 | ||
| V1 | 0.81 | 0.88 | 0.18 | 0.88 | 0.79 | 0.88 | 0.19 | 0.88 | ||
| V2 | 0.73 | 0.80 | 0.23 | 0.81 | 0.70 | 0.77 | 0.25 | 0.80 | ||
| V3 | 0.67 | 0.73 | 0.28 | 0.70 | 0.67 | 0.74 | 0.29 | 0.68 | ||
| V4 | 0.59 | 0.65 | 0.33 | 0.48 | 0.62 | 0.71 | 0.32 | 0.48 | ||
| V5 | 0.62 | 0.73 | 0.30 | 0.31 | 0.64 | 0.73 | 0.30 | 0.28 | ||
| V6 | 0.66 | 0.75 | 0.26 | 0.39 | 0.67 | 0.77 | 0.26 | 0.39 | ||
This is verified in the results for multi-lead conversion on the PTB database (see Table 8.3). Conversion from lead II to aVF, aVR, and V6 consistently offer good results, while the conversions to aVL, lead I, or V4 were overall the least successful. This behaviour is also visible in the example of Fig. 8.4222Examples were selected among all test samples to correspond to the median overall result for each scenario. Hence, they represent a median result and the methodology should offer better results in half of the occasions. where the model is unable to capture the finer details of the signals in lead aVL and leads V1-V4. The opposite happens in lead III, aVF, V6, and especially aVR, where the model was consistently able to capture the morphological details of the signals.
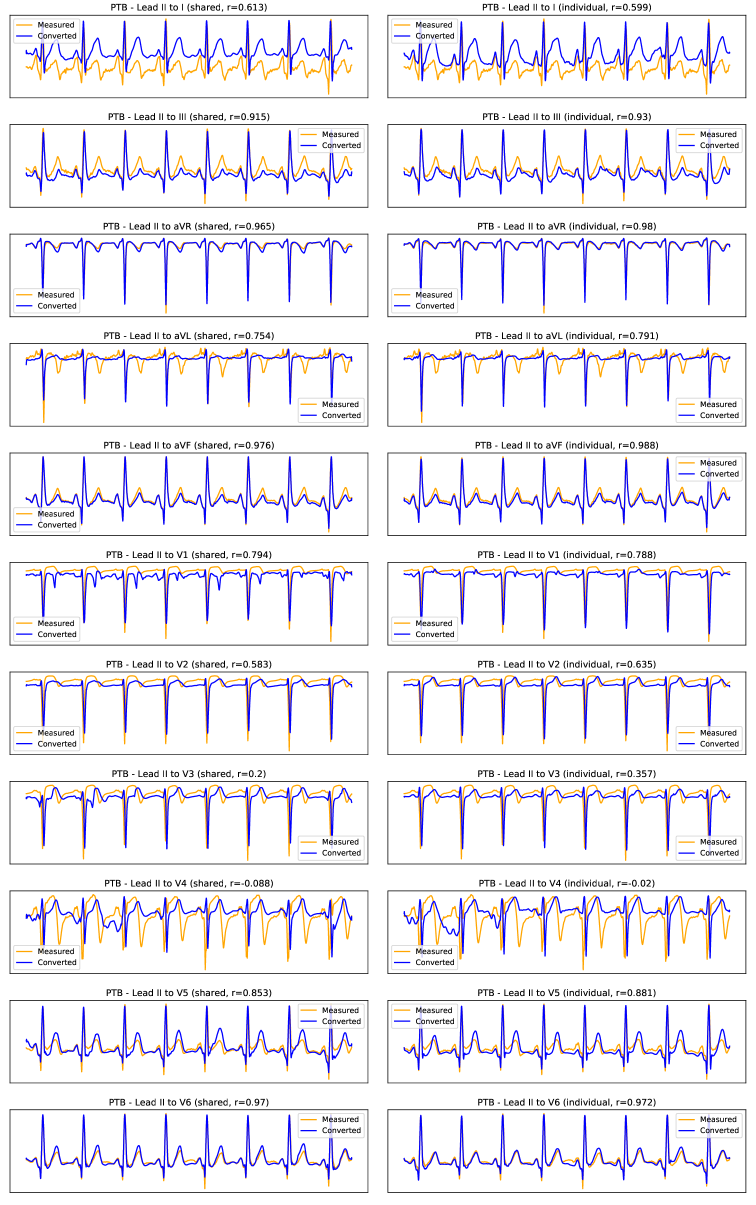
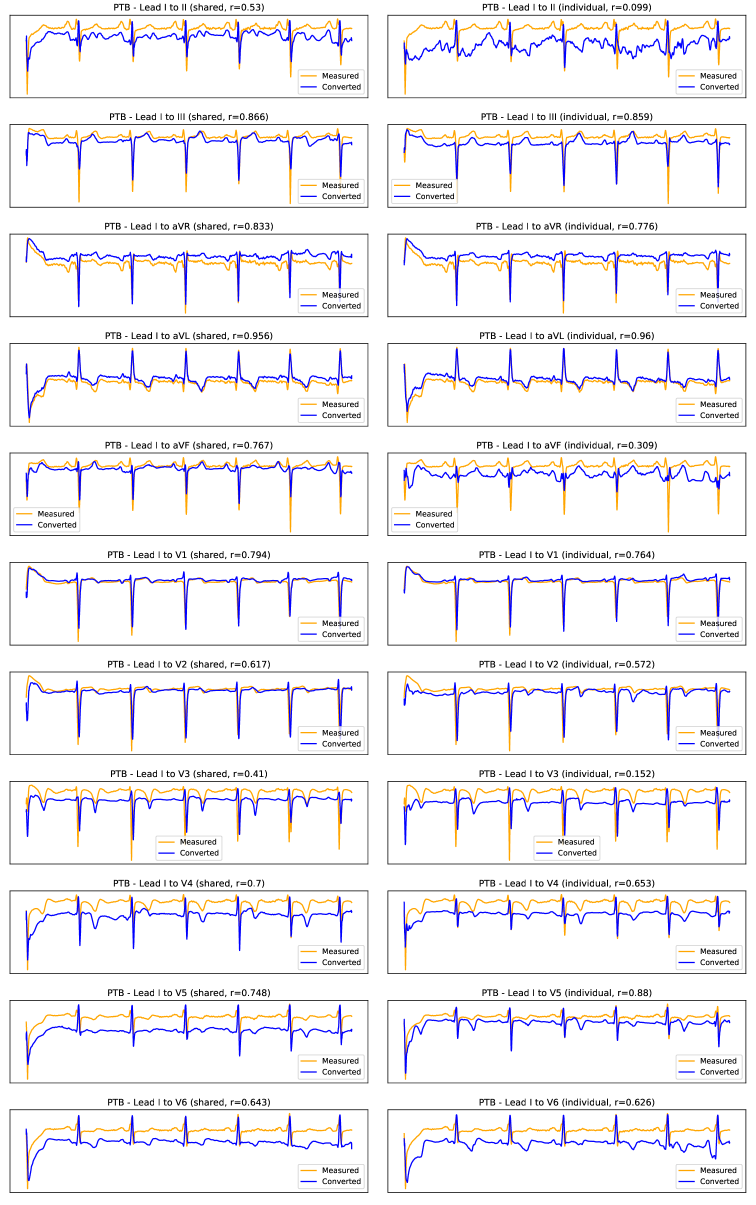
While lead II ECG signals are generally better for medical diagnosis in clinical scenarios, lead I is becoming increasingly important. The widespread implementation of ECG acquisition equipment in smartwatches, fitness bands, and other gadgets for daily use allows for the collection of lead I signals. Combining these growing applications with robust conversion algorithms would enable the recovery of missing leads on wearables and empower the next generation of robust continuous health monitoring.
Table 8.4 presents the average correlation between lead I and the remaining eleven standard leads on the PTB, INCART, and PTB-XL test segments. Like lead II, lead I is more correlated (positively or negatively) with certain leads, such as aVR, aVL, or V6, while it is almost orthogonal with aVF or V3. As such, one can observe, in Table 8.5, that the proposed methodology obtains better performance with aVR and aVL while struggling to convert from lead I to lead aVF. The same can be observed in Fig. 8.5: for aVR and aVL, the model is able to correctly capture the target morphology, while the reconstructions of aVF and V3-V6 are largely unsuccessful.
From the example result in Fig. 8.5, one can also identify a shortcoming of the proposed methodology: the occasional offsets between the baseline of the measured and converted signals. We suspect this is due to the min-max normalisation of the signals, drawing them into the amplitude range. Alternatives to this normalisation, such as standard normalisation, should be further investigated.
Considering the overall results, no lead is perfect for converting all twelve standard leads. Hence, lead II should be chosen as reference input when aVF or V5-V6 are the most important leads for the application at hand. Lead I serves better as a reference when aVR, aVL, or V1-V2 are more important. Otherwise, other leads (such as lead III) should probably be explored. Nevertheless, the results show it is possible to nicely reconstruct several leads using only one input lead without temporal alignment.
Using either lead as a reference, there is apparently no considerable or consistent difference between using one single shared encoder or using an individual encoder for each target lead. It appears as if the additional flexibility of having multiple encoders is only beneficial up to a point, and the higher complexity ends up opening the door to overfitting and loss of robustness. As such, for this application, one should expect a shared encoder to be the best option, considering its higher simplicity and similar performance.
8.5.3 Comparison with the state-of-the-art
For a comparison with the state-of-the-art, we implemented the method recently proposed by Grande-Fidalgo et al. [154] as a baseline. This method is based on a simple fully-connected model that receives each signal point’s amplitude in three reference leads as inputs and returns the same point’s amplitude in all twelve leads. Here, we adapt the methodology so it receives signal point amplitudes from one single lead (leads I or II), to exactly match the evaluation conditions of the proposed method.
Unlike what has been reported in [154], the baseline was not successful in learning to retrieve the entire set of leads from just one reference lead. In fact, across all leads, the average test of this method ranged from to , considerably worse than the proposed methodology. One can assume that, although such a simplistic model presents advantages in terms of lightweight operation and robustness to overfitting, single-lead information is not enough for it to achieve reliable interlead conversion.
The fact the baseline method reconstructs signals point-by-point, unable to analyse broader local context information, makes it hard to reconstruct the signal without already having data from more than one channel. On the other hand, using convolutional layers allows the proposed method to use broader local information as context to adequately learn to reconstruct signals using only one lead as reference.
| Shared Encoder | Individual Encoders | |||||||||
| Lead | (avg.) | (med.) | RMSE | SSIM | (avg.) | (med.) | RMSE | SSIM | ||
| I | 0.46 | 0.51 | 0.34 | 0.18 | 0.44 | 0.50 | 0.35 | 0.16 | ||
| III | 0.57 | 0.63 | 0.28 | 0.49 | 0.57 | 0.63 | 0.29 | 0.45 | ||
| aVR | 0.91 | 0.95 | 0.11 | 0.92 | 0.92 | 0.95 | 0.11 | 0.92 | ||
| aVL | 0.13 | 0.11 | 0.41 | 0.33 | 0.10 | 0.09 | 0.44 | 0.27 | ||
| aVF | 0.88 | 0.93 | 0.15 | 0.68 | 0.92 | 0.95 | 0.13 | 0.71 | ||
| V1 | 0.63 | 0.79 | 0.23 | 0.82 | 0.65 | 0.82 | 0.23 | 0.83 | ||
| V2 | 0.53 | 0.64 | 0.26 | 0.73 | 0.55 | 0.69 | 0.27 | 0.74 | ||
| V3 | 0.42 | 0.51 | 0.33 | 0.56 | 0.42 | 0.53 | 0.34 | 0.55 | ||
| V4 | 0.52 | 0.59 | 0.35 | 0.28 | 0.52 | 0.60 | 0.35 | 0.30 | ||
| V5 | 0.73 | 0.80 | 0.25 | 0.31 | 0.74 | 0.80 | 0.25 | 0.29 | ||
| V6 | 0.73 | 0.83 | 0.23 | 0.42 | 0.72 | 0.81 | 0.24 | 0.39 | ||
| Shared Encoder | Individual Encoders | |||||||||
| Lead | (avg.) | (med.) | RMSE | SSIM | (avg.) | (med.) | RMSE | SSIM | ||
| II | 0.35 | 0.37 | 0.37 | 0.18 | 0.36 | 0.38 | 0.37 | 0.19 | ||
| III | 0.17 | 0.19 | 0.41 | 0.27 | 0.17 | 0.19 | 0.43 | 0.28 | ||
| aVR | 0.65 | 0.74 | 0.23 | 0.81 | 0.67 | 0.78 | 0.22 | 0.83 | ||
| aVL | 0.40 | 0.49 | 0.32 | 0.52 | 0.36 | 0.46 | 0.35 | 0.47 | ||
| aVF | 0.17 | 0.15 | 0.41 | 0.23 | 0.17 | 0.14 | 0.41 | 0.22 | ||
| V1 | 0.55 | 0.62 | 0.25 | 0.78 | 0.57 | 0.64 | 0.24 | 0.79 | ||
| V2 | 0.50 | 0.57 | 0.27 | 0.73 | 0.50 | 0.56 | 0.28 | 0.73 | ||
| V3 | 0.35 | 0.35 | 0.37 | 0.46 | 0.36 | 0.37 | 0.37 | 0.44 | ||
| V4 | 0.27 | 0.26 | 0.43 | 0.16 | 0.34 | 0.36 | 0.41 | 0.19 | ||
| V5 | 0.46 | 0.51 | 0.36 | 0.11 | 0.45 | 0.53 | 0.35 | 0.11 | ||
| V6 | 0.44 | 0.49 | 0.34 | 0.22 | 0.45 | 0.52 | 0.34 | 0.21 | ||
8.5.4 Cross-database evaluation
The cross-database tests aimed to assess the behaviour of the proposed methodology in more diverse scenarios. Here, the models used were the same as in the previous experiments (trained with PTB data), and the evaluation was conducted using data from the INCART and PTB-XL databases.
| Shared Encoder | Individual Encoders | |||||||||
| Lead | (avg.) | (med.) | RMSE | SSIM | (avg.) | (med.) | RMSE | SSIM | ||
| I | 0.74 | 0.80 | 0.25 | 0.31 | 0.72 | 0.79 | 0.26 | 0.29 | ||
| III | 0.44 | 0.50 | 0.32 | 0.50 | 0.45 | 0.52 | 0.32 | 0.50 | ||
| aVR | -0.38 | -0.53 | 0.72 | 0.09 | -0.39 | -0.55 | 0.72 | 0.09 | ||
| aVL | -0.33 | -0.44 | 0.64 | 0.23 | -0.33 | -0.45 | 0.67 | 0.17 | ||
| aVF | 0.83 | 0.90 | 0.19 | 0.61 | 0.84 | 0.92 | 0.19 | 0.62 | ||
| V1 | 0.79 | 0.87 | 0.17 | 0.91 | 0.81 | 0.89 | 0.16 | 0.91 | ||
| V2 | 0.71 | 0.79 | 0.22 | 0.84 | 0.72 | 0.82 | 0.21 | 0.85 | ||
| V3 | 0.61 | 0.68 | 0.30 | 0.66 | 0.62 | 0.70 | 0.30 | 0.66 | ||
| V4 | 0.64 | 0.71 | 0.31 | 0.31 | 0.66 | 0.74 | 0.32 | 0.32 | ||
| V5 | 0.79 | 0.86 | 0.22 | 0.37 | 0.80 | 0.87 | 0.23 | 0.39 | ||
| V6 | 0.85 | 0.91 | 0.18 | 0.58 | 0.85 | 0.91 | 0.18 | 0.58 | ||
| Shared Encoder | Individual Encoders | |||||||||
| Lead | (avg.) | (med.) | RMSE | SSIM | (avg.) | (med.) | RMSE | SSIM | ||
| II | 0.60 | 0.66 | 0.33 | 0.23 | 0.62 | 0.70 | 0.31 | 0.26 | ||
| III | 0.31 | 0.34 | 0.38 | 0.43 | 0.33 | 0.38 | 0.37 | 0.45 | ||
| aVR | -0.61 | -0.76 | 0.74 | 0.09 | -0.62 | -0.78 | 0.74 | 0.09 | ||
| aVL | -0.63 | -0.75 | 0.75 | 0.11 | -0.66 | -0.79 | 0.76 | 0.08 | ||
| aVF | 0.29 | 0.31 | 0.41 | 0.23 | 0.32 | 0.36 | 0.40 | 0.24 | ||
| V1 | 0.79 | 0.86 | 0.16 | 0.91 | 0.81 | 0.88 | 0.15 | 0.91 | ||
| V2 | 0.71 | 0.78 | 0.22 | 0.84 | 0.70 | 0.77 | 0.23 | 0.83 | ||
| V3 | 0.65 | 0.72 | 0.29 | 0.64 | 0.67 | 0.76 | 0.28 | 0.66 | ||
| V4 | 0.62 | 0.72 | 0.32 | 0.30 | 0.69 | 0.80 | 0.30 | 0.32 | ||
| V5 | 0.76 | 0.85 | 0.24 | 0.35 | 0.76 | 0.86 | 0.25 | 0.32 | ||
| V6 | 0.80 | 0.87 | 0.20 | 0.53 | 0.81 | 0.89 | 0.21 | 0.51 | ||
For both INCART and PTB-XL, some differences in interlead correlations can be observed when compared to PTB (see Table 8.2 and Table 8.4). This can be explained due to the different acquisition setups, especially the positioning of the electrodes, which potentially causes each lead to offer a different perspective.
For INCART (see Table 8.6 and Table 8.7), the overall quality of the results is inferior to those with PTB. This is as expected since PTB data was seen by the models during training and the INCART database is arguably more challenging regarding noise and variability. Despite these metrics, it is noticeable in Figure 8.6 and Figure 8.7 that both reference leads can offer good conversion results in some leads, especially with lead II. Using this lead as reference, the proposed methodology is relatively good at converting most leads except I, V2, and V3.
For PTB-XL (see Table 8.8 and Table 8.9), results are, overall, the worst, although some leads (namely V4, V5, and V6), due to higher correlation with the reference leads, are better reconstructed than with the PTB database. In Fig. 8.8 and Fig. 8.9, it is possible to observe that, despite occasional baseline offset and prevalent noise, both reference leads enable the approximate reconstruction of most of the set of twelve standard leads.
For either database, differences in acquisition settings and electrode placement result in inferior performance. The ideal solution is to always make sure the acquisition details of training and inference data match, to ensure optimal performance upon deployment. Nevertheless, the robustness in cross-database scenarios is a relevant issue that merits further research.
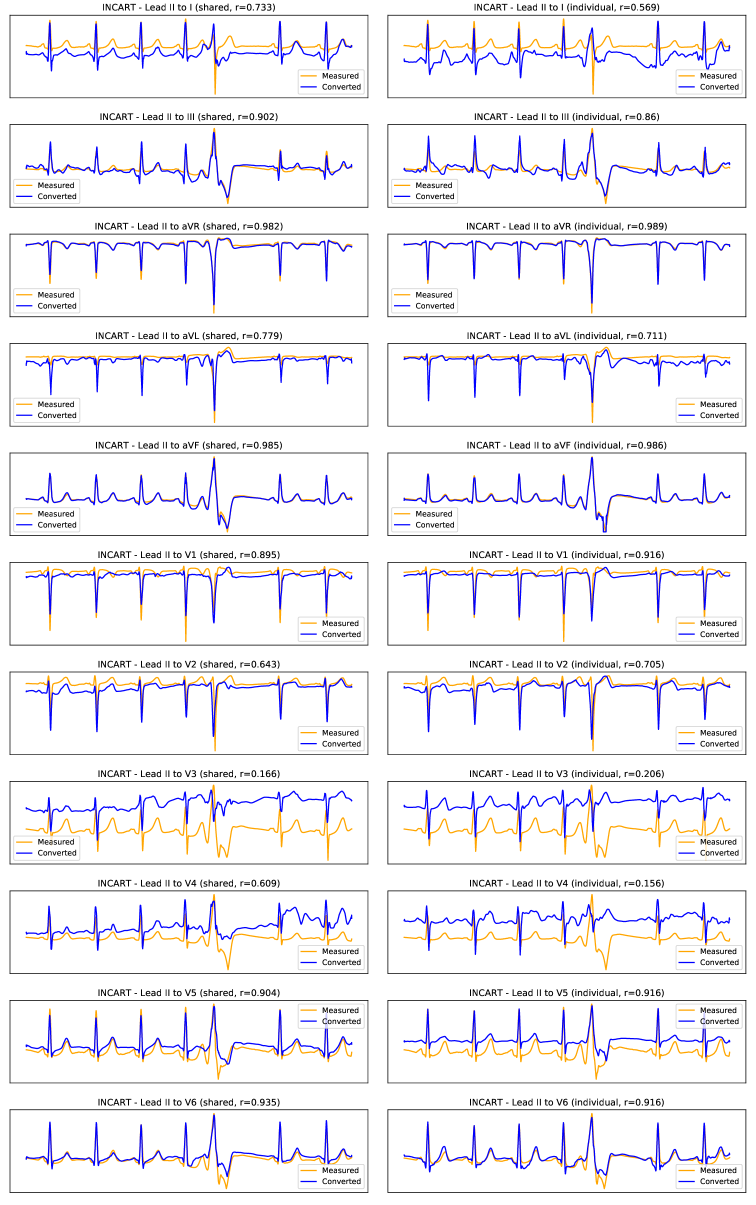
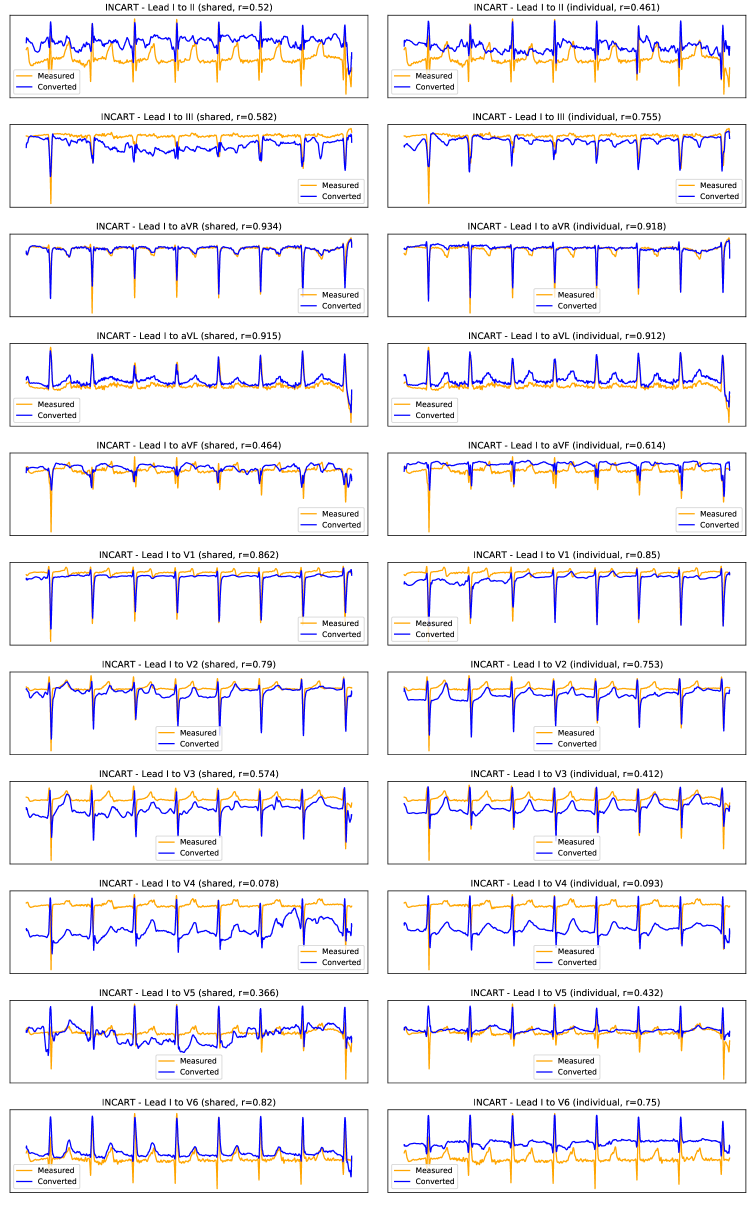
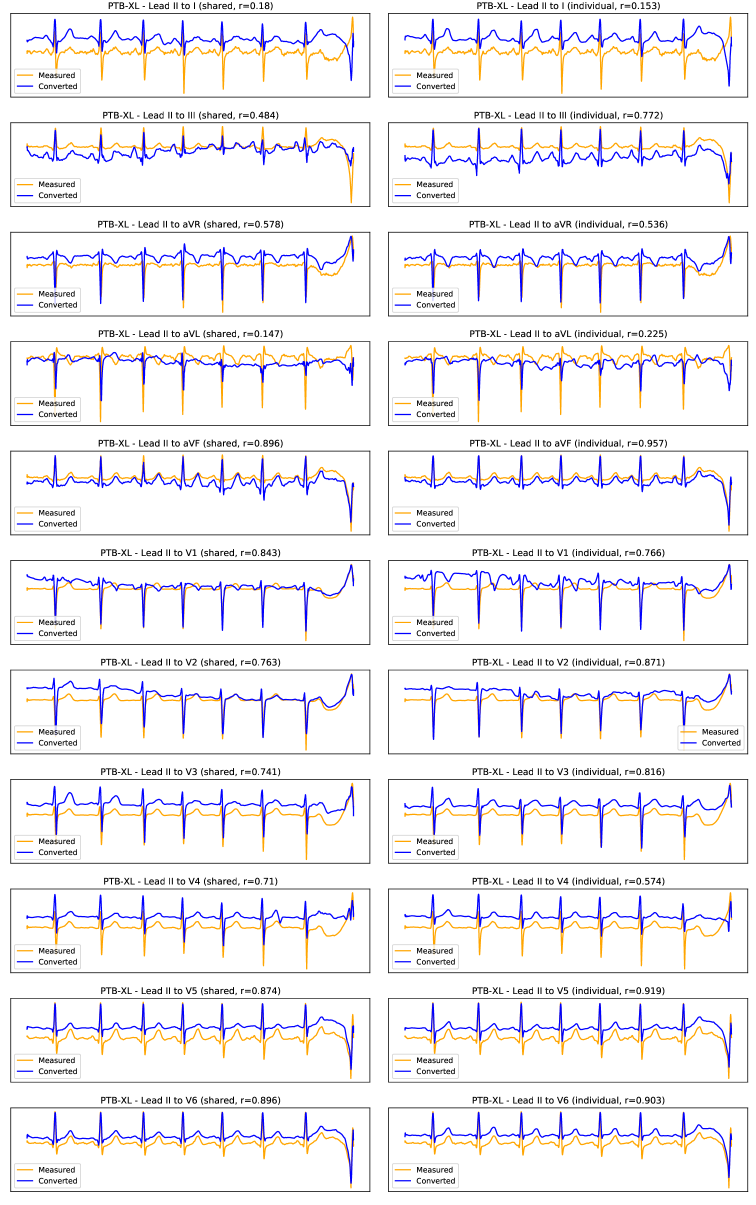
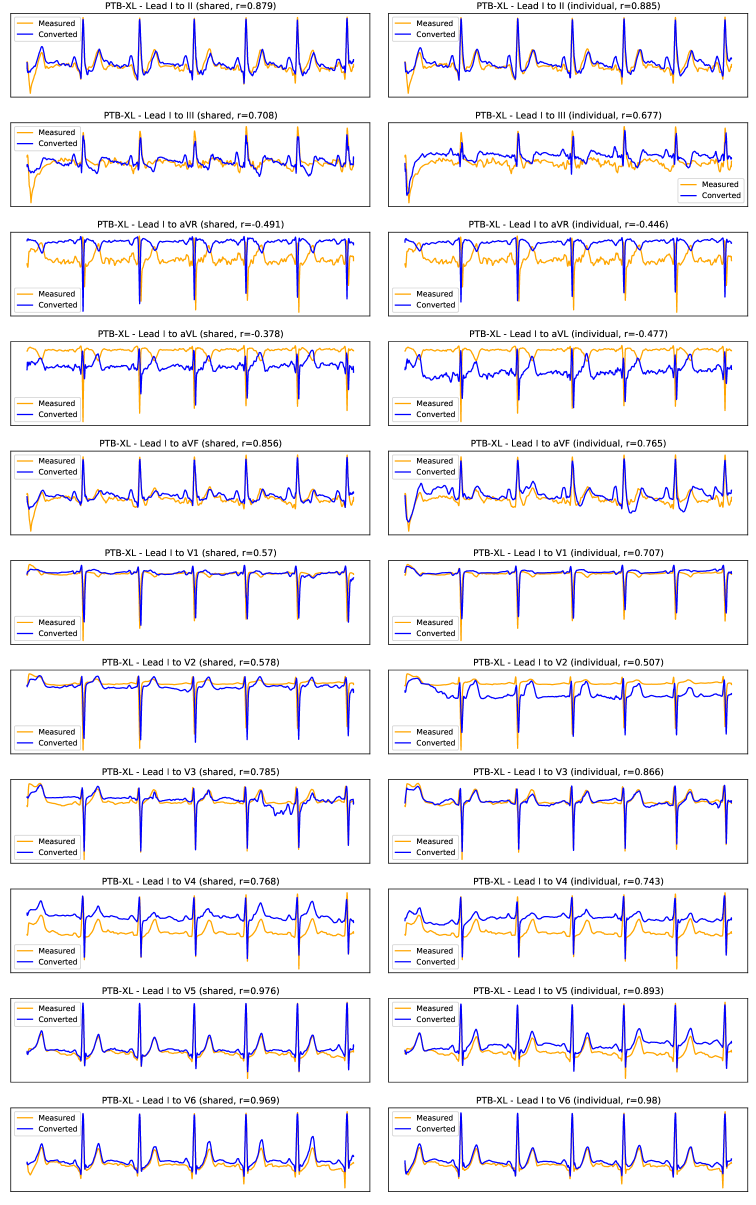
8.5.5 Influence of medical conditions
As aforementioned, medical conditions may affect differently the various leads of an ECG signal. While this is the main motivation behind the quest to reconstruct missing leads it may also be one of the main hurdles. If the medical condition is somehow not evident in the input lead, the algorithm could be led to reconstruct the remaining leads incorrectly without the proper information on the respective medical condition.
As such, we conducted a differential performance evaluation according to the existence and type of diagnosed medical conditions on the signals. To do this, we use the expert clinical annotations on the PTB-XL database and separate the results by the superclass labelling of each test sample. The average results for each converted lead and each superclass are presented in Table 8.10 (using lead II as reference) and Table 8.11 (using lead I as reference).
Overall, no dominant difference could be observed between the results with normal signals and the results with signals with medical conditions. Similarly, no specific medical condition superclass presents considerably different performance results. This is likely due to the presence of medical conditions on the PTB signals originally used for training the model. Thus, although the behaviour of the proposed methodology should be expected to vary slightly in the presence of medical conditions, it should not have a considerable impact on its baseline performance.
8.6 Summary and Conclusions
This work implemented and compared the performance of three deep learning architectures for interlead conversion of ECG signals. Unlike the literature, this work focused on the more challenging scenario of single-lead blindly-segmented inputs from limb leads. The proposed model was explored on 12-lead acquisitions from three different databases. Ablation studies were conducted on the architectures used for conversion and on the use of a shared encoder vs. individual encoders. Moreover, the model was evaluated in both single-database and cross-database scenarios, including an experiment on the effect of medical conditions on signal reconstruction and the study of diagnosis performance with original vs. converted signals.
Despite the considerably more challenging scenario, the proposed methodology based on a U-Net was capable of obtaining relatively good results. Each reference lead enabled the high-quality reconstruction of several of the twelve standard ECG leads, in some cases reaching state-of-the-art level performance. Both lead I and II appear to be especially suitable for certain sets of leads, and could be used on specific target applications that focus on those.
| Converted leads | |||||||||||
| Class | I | III | aVR | aVL | aVF | V1 | V2 | V3 | V4 | V5 | V6 |
| NORM | 0.79 | 0.42 | -0.39 | -0.32 | 0.86 | 0.83 | 0.76 | 0.64 | 0.70 | 0.85 | 0.90 |
| MI | 0.65 | 0.47 | -0.37 | -0.38 | 0.76 | 0.75 | 0.65 | 0.56 | 0.54 | 0.68 | 0.77 |
| STTC | 0.71 | 0.41 | -0.41 | -0.37 | 0.80 | 0.79 | 0.69 | 0.58 | 0.59 | 0.78 | 0.84 |
| CD | 0.65 | 0.60 | -0.31 | -0.28 | 0.84 | 0.59 | 0.54 | 0.58 | 0.58 | 0.63 | 0.71 |
| HYP | 0.75 | 0.42 | -0.40 | -0.24 | 0.80 | 0.85 | 0.70 | 0.56 | 0.61 | 0.81 | 0.87 |
| Converted leads | |||||||||||
| Class | II | III | aVR | aVL | aVF | V1 | V2 | V3 | V4 | V5 | V6 |
| NORM | 0.73 | -0.23 | -0.35 | -0.66 | 0.23 | 0.79 | 0.73 | 0.68 | 0.69 | 0.84 | 0.85 |
| MI | 0.50 | -0.15 | -0.26 | -0.57 | 0.036 | 0.67 | 0.58 | 0.47 | 0.38 | 0.56 | 0.61 |
| STTC | 0.57 | -0.20 | -0.36 | -0.64 | 0.00 | 0.74 | 0.64 | 0.55 | 0.48 | 0.71 | 0.76 |
| CD | 0.40 | -0.31 | -0.11 | -0.48 | -0.06 | 0.35 | 0.38 | 0.42 | 0.39 | 0.52 | 0.54 |
| HYP | 0.65 | -0.29 | -0.37 | -0.60 | 0.07 | 0.78 | 0.65 | 0.58 | 0.59 | 0.78 | 0.82 |
In the cross-database scenario, despite the acquisition setup differences, results were promising especially with the INCART database. Finally, the analysis of the influence of medical conditions has shown no considerable effect of pathologies on the performance of the proposed methodology. However, a state-of-the-art methodology for automatic diagnosis revealed lower accuracy when using reconstructed signals, a problem that should be addressed in future research.
Although the results are promising, further efforts should be devoted towards the improvement of the methodologies for interlead conversion using single-lead blindly-segmented inputs. Namely, the pre-processing and normalisation of the signals, as well as the robustness to diverse acquisition setups, should be the target of further research. Additionally, task-oriented objective functions should be explored to ensure useful signal information is kept and avoid performance losses in subsequent diagnoses.
With some consolidation, the proposed methodology could be the key to better cardiac health monitoring in wearable devices and less obtrusive clinical scenarios. Taking the example of emergency rooms, if we can retrieve all twelve leads (or the most important among these) from Lead I signals, then patients will only need two electrodes placed on the wrists to have their ECG collected, instead of the full set of 10 electrodes on wrists, ankles, and chest. This is a meaningful step towards higher comfort and usability for patients in clinical settings or users in other scenarios involving the monitoring of ECG signals. Additionally, albeit outside the scope of this work, this methodology could also be applicable to other multi-channel signals where the different channels correspond to different perspectives over the same physiological phenomenon.
Part III Face Biometrics
Chapter 9 Prior Art in Face Biometrics
9.1 Data
There are several publicly available databases for research purposes, to develop and benchmark face biometric recognition algorithms. Considering the face is one of the most developed biometric traits, the databases available are some of the largest and most complete, thoughtfully structured for deep and adequate evaluation of recognition algorithms. Table 9.1 compiles some relevant information about the most important databases currently available, which are also described below:
| Database | Spectrum | Subjects | Images | Videos | Resolution | Unconstr. |
| CASIA NIR-VIS [253] | Vis. + NIR | 725 | 17 580 | None | 640x480 | ✕ |
| CASIA WebFace | Visible | 10 575 | 494 414 | None | 250x250 | |
| CelebA [267] | Visible | 10 177 | 202 599 | None | - | |
| COX Face [181] | Visible | 1000 | 1000 | 3000 | - | ✕ |
| CSIST Lab1 [466] | Vis. + NIR | 50 | 1000 | None | 100x80 | ✕ |
| CSIST Lab2 [466] | Vis. + NIR | 50 | 2000 | None | 200x200 | ✕ |
| FERET | Visible | 1199 | 14 126 | None | 512x768 | |
| IJB-C | Visible | 3531 | 138 836 | 11 779 | - | |
| IMDb-Face [448] | Visible | 59 000 | 1 700 000 | None | - | |
| LFW [178, 177] | Visible | 5749 | 13 233 | None | 250x250 | |
| MegaFace [305] | Visible | 672 057 | 4 753 520 | None | - | |
| MS-Celeb | Visible | 99 892 | 8 200 000 | None | - | |
| PaSC [39] | Visible | 293 | 9376 | 2802 | - | |
| PolyU [480] | NIR | 335 | 34 000 | None | 768x576 | ✕ |
| UMD Faces [25] | Visible | 8277 | 367 888 | None | - | |
| UMD Videos [25] | Visible | 3107 | None | 22 075 | - | |
| VGGFace [331] | Visible | 2622 | 2 600 000 | None | Diverse | |
| VGGFace2 [58] | Visible | 9131 | 3 310 000 | None | Diverse | |
| Yale Face | Visible | 15 | 165 | None | 320x243 | ✕ |
| YouTube Faces [460] | Visible | 1595 | None | 3495 | - |
-
•
CASIA NIR-VIS: Also known as CBSR NIR, the CASIA NIR-VIS 2.0 database was created by the Institute of Automation of the Chinese Academy of Sciences (CASIA). It includes pairs of mugshots and corresponding NIR images from 725 people, acquired over four recording sessions, from 2007 to 2010 [253];
-
•
CASIA WebFace: This database was created and made available by the Institute of Automation of the Chinese Academy of Sciences (CASIA). It includes almost five hundred thousand images from more than ten thousand identities collected to support the research in unconstrained face recognition;
-
•
CelebA: This database results from a previous one, CelebFaces+, which has been enriched with fiducial and attribute annotations. It includes over two hundred thousand pictures from over ten thousand celebrities, with five fiducial locations, and forty binary attributes per image [267];
-
•
COX Face: The COX Face database was designed to study recognition across still images and videos. Thus, it includes still images from one thousand subjects in a controlled environment with high quality, and surveillance videos from the subjects in unconstrained and low-quality settings [181];
-
•
CSIST Lab1: The CSIST database was developed by the Chung-Shan Institute of Science and Technology, with images from volunteers at the Harbin Institute of Technology of Shenzhen. The Lab1 dataset contains ten visible light and ten NIR images from each of fifty subjects [466];
-
•
CSIST Lab2: The CSIST Lab2 dataset is part of the CSIST database, and includes twenty visible light and twenty NIR images from fifty volunteers, with natural lighting and artificial lighting [466];
-
•
FERET: The Facial Recognition Technology (FERET) Program was sponsored by the US Department of Defence, and the FERET database is distributed by the National Institute of Standards and Technology (NIST). The database, with more than fourteen thousand face images collected between 1993 and 1996, has the goal to support the development of new techniques for automatic recognition of faces;
-
•
IJB-C: The IARPA Janus Benchmark-C (IJB-C) is a database resulting from a group of challenges created by NIST addressing verification, identification, detection, clustering, and processing of videos. It includes over one hundred and thirty-eight thousand images and eleven thousand face videos from over three thousand identities;
-
•
IMDb-Face: This dataset includes approximately 1.7 million images with faces from fifty-nine thousand celebrities on the IMDb movie database. According to the authors, efforts have been devoted to ensuring this database is cleaner than most other large available databases, making it better for training robust algorithms [448];
- •
-
•
MegaFace: The MegaFace collection includes an average of 7 unconstrained face photos (between 2 and 2469) for each of almost seven hundred thousand identities. It is the surveyed database with the most identities, and the second with most total images [305];
-
•
MS-Celeb: The Microsoft Celeb is a dataset of over eight million images obtained online. It includes faces from nearly one hundred thousand celebrities in unconstrained settings, aiming to accelerate research in face recognition with large target sets;
-
•
PaSC: The Point and Shoot Face Recognition Challenge (PaSC) dataset was created by NIST to encourage the development of face recognition algorithms that are more robust to very unconstrained settings and inexpensive camera technology. It includes over nine thousand images and almost three thousand videos with faces from almost three hundred identities with different distances to the camera, perspective, and locations [39];
-
•
PolyU: This database was created by the Biometric Research Centre (UGC/CRC) at The Hong Kong Polytechnic University, using their own real-time NIR face capture device. It includes approximately thirty-four thousand NIR face images from over three hundred subjects [480];
-
•
UMD Faces: This dataset was created at the University of Maryland (UMD) and contains almost four hundred thousand face images from over eight thousand subjects. Each image includes human-curated face bounding boxes and annotations on pose, gender, and twenty-one keypoints [25];
-
•
UMD Videos: This dataset is similar to UMD Faces, only it includes over three million video frames from twenty-two thousand videos with over three thousand identities. The frames are also annotated with pose, keypoints, and gender information [25];
-
•
VGGFace: This database was created by the Visual Geometry Group (VGG) of the University of Oxford, UK. The group developed a method for minimally-supervised online image collection, which enabled the creation of this large database, with over two million faces in unconstrained conditions [331];
-
•
VGGFace2: The VGGFace database was later extended to create the VGGFace2 database, which includes more than three million unconstrained face images from almost ten thousand identities [58];
-
•
Yale Face: The Yale Face database includes eleven images from each of fifteen subjects. Although not an unconstrained database, it includes annotations on certain expressions and configurations simulated by the subjects, which can be useful in training models for other tasks such as emotion recognition;
-
•
YouTube Faces: This dataset is composed exclusively of faces on YouTube videos. It includes over three thousand videos with over one thousand identities. The videos range from 48 to 6070 frames (average of 181 frames per video) [460].
These databases already cover most bases and offer a good starting point for the study and development of strong biometric algorithms. Nevertheless, it is important to acknowledge the growth of heterogeneous approaches in facial recognition, and the subsequent need for databases of face images acquired in different modalities (e. g., visual spectrum vs. NIR). These databases are still too small and too controlled for the development of robust algorithms. Moreover, it would be useful to have larger databases focused on more specific applications (e. g., face images and videos of car drivers).
9.2 Related Work
According to Barnouti et al. [28], face recognition can be decomposed into three processes: face detection, feature extraction, and face recognition (see Fig. 9.1). Below, we delve into the state-of-the-art in each of these processes. Due to the currently common practice of joining feature extraction and face recognition into a single model using deep learning, these two processes are jointly discussed.

9.2.1 Face detection
Given an image or video stream, the process of face detection has the goal of locating and extracting all human faces visible in the received input. It is an extremely important process not only for face-based biometric recognition, but also for face tracking and person re-identification across surveillance cameras, recognition of expressions and emotions, and analysis of soft-biometrics such as gender or age [476, 232].
Some earlier, simpler methods relied on skin colour for face detection on images [89, 220]. These presented the advantage of being orientation-invariant, as it would serve to detect a face even if it did not present a frontal pose. However, they fail to consider the great variety of skin colours, both due to natural differences between individuals, and due to diverse illumination conditions.
More sophisticated algorithms have been proposed, including the method by Sirovich and Kirby [406] based on eigenvectors from large face image datasets, the method by Viola and Jones [442] which uses cascades of Haar transform filters selected using AdaBoost, or the method by Dalal and Triggs [92] which uses histograms of intensity gradients from image regions and their orientation. These commonly offer very fast detection, adequate for real-time systems, but often fail on non-frontal face detection and faces of very diverse scales.
Like most pattern recognition tasks, traditional methods from earlier literature have been recently replaced with deep learning algorithms. These offer more robust and accurate face detections, especially for non-frontal face detection, making better use of very large datasets currently available.
Some of these datasets currently offer a public benchmark for fair and direct comparison with state-of-the-art methods. These include the WIDER face dataset [469] and the Face Detection Database (FDDB) [203]. These benchmarks are currently largely dominated by deep learning approaches.
The FDDB benchmark is currently dominated by the S3FD, the DeepIR, and the RSA algorithms. S3FD [486] is based on a single deep network specifically fitted to better detect small faces. The DeepIR method [416] uses a Faster Region-based CNN (RCNN) adapted with feature concatenation, multiscale training, and hard negative mining for more robust detections. The RSA algorithm [264] is based on a convolutional network with a recurrent strategy for detection at different scales.
The best scores on the WIDER Face benchmark belong to the AInnoface and the RetinaFace algorithms. The RetinaFace algorithm [99] is a single-stage pixelwise face detector that takes advantage of extra-supervised and self-supervised multitask learning. AInnoface [481] is based on RetinaFace with two-step classification and regression, an IoU loss function, improved data augmentation, and several other structural network changes.
These sophisticated algorithms perform accurate and robust detection for faces in different poses and at different scales. But they are still computationally heavy and require GPUs for real-time operation in images with VGA resolution. Having overcome most challenges in unconstrained face detection, research should now focus on making algorithms faster and more efficient.
9.2.2 Feature extraction and recognition
Having extracted the detected faces from the input, face-based recognition systems need to extract appropriate features from those faces to accurately decide on their identities. Wang and Deng [452], in their survey of deep learning face recognition, have pointed out how the field of face biometrics has moved from traditional machine learning approaches to deep learning (see Fig. LABEL:fig:face_recog_history). However, the best results were only obtained when the development of sophisticated tailored objective functions began (see Fig. LABEL:fig:face_recog_history_2).
As such, Wang and Deng [452] divide approaches into four categories: holistic learning, local handcrafted, shallow learning, and deep learning methods. Below, the most relevant examples of each category are presented, along with their advantages and shortcomings.
Holistic learning approaches are those that use the whole face image to obtain representations that ease the process of face recognition. The Eigenface method [406], described for face detection, is one of these methods, along with the Fisherface method [34], which is similar to Eigenface, but uses the Fisher Linear Discriminant Analysis (FLDA, instead of PCA) for dimensionality reduction. Such methods are simple and fast, but lack robustness to several variability factors.
Eventually, researchers started to explore methods that extracted features from regions of the face image. These methods mostly used Gabor filters and Local Binary Patterns for feature extraction based on intensity gradients and image edges [12, 262]. Methods like these and the Elastic Bunch Graph Matching [459] were able to improve recognition accuracy, but not to make it high enough for real use.
To improve accuracy and robustness to pose variations, researchers proposed learning-based methods, that used available data to learn the best features. The first method to use shallow learning was proposed by Cao et al. [59], using gradient filtering after facial landmark alignment and clustering methods to learn encodings for better recognition.
But truly high accuracy and robustness in face recognition were only attained with the rise of deep learning. The first models were convolutional neural networks with conventional architectures, such as DeepFace [423], VGG-Face [331], or VGG-Face2 [58]. Over time, researchers started to focus on adapting the networks for specific details of face recognition, such as custom loss functions that force increased intersubject separability. This resulted in improved methods such as DeepID [417], L2-Softmax [360], and ArcFace [98].
Both Facenet and DeepID are among the top five non-commercial methods in the LFW benchmark, with and accuracy, respectively. However, as discussed by Wang and Deng [452], the best results yet haven’t been achieved with traditional deep learning losses such as softmax or even triplet loss, but with tailored objective functions specifically designed to make the most of available data for the task of face recognition. According to results reported by Wang and Deng [452], both L2-softmax and ArcFace offer even better performance in the LFW benchmark, with and accuracy, respectively. In fact, ArcFace, using the tailored ArcLoss objective function, is still widely recognised as the state-of-the-art approach for face recognition.
These methods and results show the high potential offered by adapted deep learning networks for face recognition. However, these present the same problem as deep learning approaches for face detection: high computational cost. These models are generally very complex, and researchers should devote efforts to making them more efficient. Furthermore, video-based benchmarks should be used more to evaluate methods also based on their timeliness. Finally, as stated by Arya et al. [21], research in visible or infrared spectra may be reaching its limits, and the future may be based on multispectral imaging.
Overall, face biometric recognition is already a thoroughly developed topic, unlike other biometric characteristics (such as the electrocardiogram). Joint efforts dedicated by several international research groups throughout multiple decades have brought this topic to a stage of high maturity that enables real applications. Proof of that is the currently endless variety of applications of face biometrics in our day-to-day routine, from unlocking our phones to border control, including opening bank accounts remotely.
9.2.3 Presentation attack detection
Just like any other biometric solution or access control system, face biometric systems are prone to attacks. These systems commonly guard goods or information whose value entices attackers to try to fool it into granting them access. In face biometrics, one of the main ways to do this is through presentation attacks: here, an attacker presents to the sensor fake or altered samples of the biometric trait that contains identity information from an authorised person [386].
Presentation attack detection (PAD) algorithms aim to automatically recognise when captured biometric samples have been faked or altered in such a way, preventing a biometric system from granting access to an attacker. They consist of binary classifiers that distinguish between presentation attacks or bona fide samples. Presentation attacks involve presentation attack instruments (PAI) which can be printed photographs, digital screens, paper masks, or even tridimensional silicone masks: each of these types of PAI is called a PAI species (PAISp) [192].
Earlier PAD approaches focused on one single PAISp (i.e., trained and tested only with one type of PAI), a scenario that can be designated as one-attack. This can naturally lead to overly optimistic results that may not be verified in real-life applications, since attackers are perpetually working on new and improved PAI species and face biometric systems will expectedly be faced with more than one during application.
Another (more challenging) scenario is the one where multiple PAISp are used for training and a set of unknown PAISp are used to evaluate performance. This is called unseen-attack and typically enables performance results much more closely related to what would be verified in real applications. A PAD algorithm that is able to generalise well from the seen PAISp to the unseen PAISp and offer good performance in the unseen-attack scenario is much more likely to perform well when faced with novel PAISp once deployed.
As with several other pattern recognition tasks, deep learning architectures have been widely applied in PAD, especially in recent years [334, 40]. These have enabled reaching improved results that allude to the possibility of real implementation. Nevertheless, the evaluation scenarios typically resemble the one-attack scenario and, thus, raise serious doubts about the realism of the reported results. In fact, several works on PAD have doubled down on this issue and called for the widespread adoption of unseen-attack scenarios for more realistic evaluation [365, 384, 132].
The issue of performance degradation in the presence of unseen attacks is currently the biggest challenge in face PAD. As such, some have addressed it using one-class classification or anomaly detection strategies [143, 20, 315, 465, 333, 126, 334] achieving meaningful breakthroughs and fostering the robustness of face PAD to unknown attacks. Others defend that the true solution lies in the use of domain adaptation and interpretability to better control model behaviour and lead PAD systems to achieve true generalising capabilities [385, 386, 335].
9.2.4 Robustness and trustworthiness
Faced with the current state of face recognition, some would say face recognition is a solved topic. Advances in deep learning architectures, tailored loss functions, and massive online-sourced databases have enabled the topic of face biometrics to achieve near-perfect performance metrics. This is true even for edge scenarios, on challenging datasets with significant pose, illumination, and environment variability.
However, diverse challenges remain to be solved or have surged over the recent years due to developments in face recognition or society in general. Here, we focus on two of the most pressing problems: trustworthiness and robustness. The first relates to the significant opacity of deep learning-based state-of-the-art approaches. The second is linked to the difficulty of current methodologies to recognise faces under occlusions, especially masks. Below, we delve deeper into each of these challenges.
9.2.4.1 Face recognition in a masked society


The ongoing Covid-19 pandemic has had a meaningful negative impact on face recognition systems [152]. The widespread (and generally mandated) use of face masks covering the nose, mouth, and chin regions of the face has been reported to significantly degrade the accuracy of existing face recognition solutions [93, 313, 314, 204].
Before the pandemic, research on the robustness to occlusions in face recognition was fairly common. However, it was also rather limited to small occlusions like sunglasses or scarves [324, 409], which do not typically hide as much information as a face mask (see Fig. 9.3). One should easily understand how unprepared the existing face recognition solutions were for this new global paradigm.
Since the dawn of these challenging circumstances, multiple authors have studied in detail the effects of wearing masks on face recognition [152]. Two of the most relevant studies were conducted by the National Institute of Standards and Technology (NIST), focusing on pre-Covid-19 [313] and post-Covid-19 algorithms [314]. These studies were part of the ongoing Face Recognition Vendor Test (FRVT), an independent and thorough benchmark of face recognition solutions, and the results indicate that competitive algorithms, which fail to authenticate less than of probes in typical circumstances, failed up to more frequently in the presence of synthetic masks.
Beyond these studies, some have studied the effect of real masks in academic and commercial solutions. Damer et al. [93] has found that the FMR100 score of the state-of-the-art method SphereFace can increase from to when evaluated with real masked face images from twenty-four participants. Wearing masks has also been reported to significantly impact verification performance of human operators [94], face image quality estimation [136] and presentation attack detection performance [120].
Early works on this topic included the automatic detection of face masks in images [268, 355] which, however, do not effectively solve the problem. Later, Li et al. [256] proposed an attention-based method to train a model on the periocular face region, avoiding the mask areas and achieving promising results.
Most other solutions have focused on the adaptation of existing pretrained face recognition networks, likely due to the limited amount and diversity of data currently available for masked face recognition. Anwar and Raychowdhury [19] studied the benefits of synthesising masks on the training data. [140] augmented existing datasets with realistic masked images using a generative adversarial network (GAN) specifically tailored to retain identity information.
More recently, Boutros et al. [52] proposed an efficient solution to be integrated on top of existing face recognition models, which attempts to unmask the embedding produced by the backbone. The unmasking module is based on a neural network trained with a self-restraining triplet loss which prioritises more affected genuine pairs.
Huber et al. [182] used a template-level knowledge distillation approach to approximate embeddings produced from masked and unmasked images. The teacher model is trained with ElasticFace loss, which is also used to ensure the resulting embeddings retain identity information. Similarly, Li et al. [248] used knowledge distillation combined with image-level face completion.
Despite all these recent efforts and meaningful strides, there are still plenty of hurdles to overcome. The rise of masks in our society uncovered the feeble nature of face recognition systems in the face of extensive occlusions, and researchers are organising to face the challenge (e.g., through large competitions in masked face recognition [50, 100]). Nevertheless, a definitive solution should only be achievable with strong concerted efforts on improving available databases, adapting existing algorithms, and designing novel training strategies.
9.2.4.2 Interpretability in face biometrics
The growing use of increasingly sophisticated and elusive deep learning models has been sparking the need for strategies to better understand their inner workings. This is also true for several biometric applications. Namely, as face recognition systems permeate further into more critical applications such as border control or law enforcement, trustworthiness and transparency are paramount [17, 352, 3, 137].
In recent years, multiple studies have found that biometric systems (especially those based on face) generally present significant demographic biases which have been able to survive largely unnoticed. For example, lower false match scores among men (when compared to women) have been linked to a significantly larger variety of facial hair styles. Similarly, the variety of hairstyles, face morphology, and makeup styles have also been cited as possible causes behind gendered differences in face recognition accuracy [14, 356, 15].
If a biometric model suffers from bias, traditional metrics or visualisation methods will not be able to detect it or explain that these features played a prominent role in the decision. Having more thorough mechanisms of understanding the behaviour of biometric models, for instance through interpretability, could be the key to unveiling and avoiding such biases and ensuring fair treatment at all times (see Fig. 9.4).
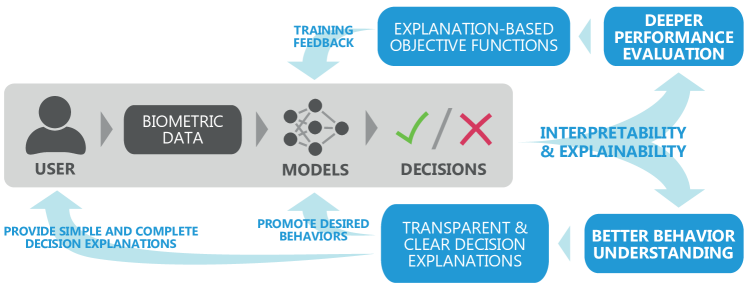
The topic of interpretability in biometrics is still in its early stages, although some researchers have already delved into the study of transparency for face biometrics. Some of these focused on attention mechanisms [206, 387, 6], which allow models to focus on relevant areas that can be adjusted to avoid certain undesirable behaviours.
One of the first approaches for interpretable face recognition was proposed by Yin et al. [473], using feature and spatial activation diversity losses. These were used to promote, respectively, filter robustness against occlusions and the inclusion of semantic information. Williford et al. [458] explored a new way to obtain explanations by combining triplets and an inpainting game. Using subtree excitation backpropagation and density-based input sampling for the explanation, model interpretability is promoted and saliency maps can be built to support explanations. Liu et al. [263] used adversarial training for heterogeneous face recognition, explicitly promoting the introduction of semantic and interpretable information in the model’s latent space.
As for face PAD, most works so far are limited to the simple application of explainability tools (typically GradCAM), or the use of t-distributed stochastic neighbour embedding (t-SNE) as a way to interpret the way features lead to certain decisions [207, 336, 455, 475, 121, 454]. Beyond these works, some authors proposed the application of auxiliary supervision techniques to promote interpretability [265, 266, 470].
Beyond face recognition and presentation attack detection, Seibold et al. [382] studied face morphing attack detection using focused layer-wise relevance propagation (FLRP) as a way to explain decisions to humans. Similarly, Xu et al. [467] proposed the use of FLRP to explain decisions of their deepfake detection method. Alongside a method to simulate face aging, Genovese et al. [141] proposed the cross-GAN filter similarity index (CGFSI) that can be used to explain the behaviour of face GANs.
Despite these first works on interpretability for face biometrics, there is still a long way to go. The effect of causality on the production of explanations and the possibility for multiple simultaneous explanations are still open topics. Likewise, the production of semantic and textual explanations (beyond simply visual ones) is yet to be addressed. All of these issues remark the relevance of calling for transparency in face biometrics and adopting the new technologies in interpretability for this topic.
9.3 Open Challenges and Opportunities
As discussed throughout this chapter, face recognition is an intensively and thoroughly researched topic with praised results and a significant impact in the real world. Through the study of increasingly sophisticated deep learning methodologies and the design of tailored objective functions, face recognition was able to conquer a prominent place in our society with robust and reliable commercial solutions.
Nevertheless, it is also clear that some problems remain largely unsolved. Nowadays, those are mainly related to robustness in masked face recognition scenarios, the trustworthiness of sophisticated deep learning-based solutions, and the detection of presentation attacks using unseen species. These are the topics which currently pose the greatest threats to face recognition applications and, thus, the most promising research opportunities.
Hence, this thesis part focuses on two contributions to these open challenges and opportunities. Specifically:
-
•
In Chapter 10, we propose two methodologies based on triplet and contrastive learning strategies, combined with ArcFace and mean squared error losses to promote similarity between masked and unmasked image embeddings and close the performance gap on masked face recognition;
-
•
In Chapter 11, we study the use of interpretability to better understand the decisions of deep learning models in face PAD, in order to motivate the broader application of interpretability and explainability for more transparent and trustworthy biometrics.
Chapter 10 Masked Face Recognition
10.1 Context and Motivation
Face recognition is one of the most advanced biometric traits. The adoption of sophisticated deep learning architectures and tailored loss functions led to the achievement of very high accuracies. This enabled the widespread adoption of face recognition solutions, from automated border control to personal biometric applications [153, 280].
However, as detailed in Chapter 9, the Covid-19 pandemic and the global mask mandates created yet another hurdle to face recognition solutions. The occlusion of information by the use of a mask has been reported to result in meaningful performance degradation in state-of-the-art face recognition solutions [93, 313, 314, 204].
Recent works have focused mainly on training existing architectures or fine-tuning pretrained models with relatively small datasets of synthetic masked images [19, 140]. Some have proposed more sophisticated approaches for avoiding information that could be occluded by a face mask [248, 182, 52]. However, it is clear that further efforts are needed in the improvement of available databases, the adaptation of existing algorithms, and the design of novel training strategies in order to close the performance gap.
This chapter presents a work partially framed within the Masked Face Recognition (MFR 2021) challenge hosted by the 2021 International Joint Conference on Biometrics (IJCB). Here, we propose two learning strategies based on the combination of triplet and contrastive losses with mean squared error loss to promote both identity information capture and similarity between embeddings of masked and unmasked images. With this, we aimed to adapt face recognition state-of-the-art deep learning methodologies to close the performance gap between face recognition in generic unconstrained scenarios and in the presence of face masks.
10.2 Methodology
Two approaches were explored to close the performance gap between unmasked and masked face recognition. The first one is an adaptation of the triplet loss training strategy [309]. The second one is a multi-task contrastive learning combination of cross-entropy (CE), ArcFace, and mean squared error (MSE) objective functions [308]. Both aim to influence the behaviour of the models through the respective loss functions by leading them to steer clear of information that can be occluded by the use of face masks.
10.2.1 Adapted triplet loss

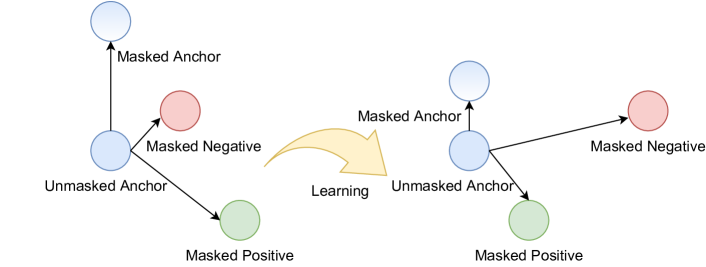
The triplet loss [72] has been frequently used in general pattern recognition tasks, including the particular case of face recognition models. Instead of instance-based learning, this methodology organises training data into triplets composed of an anchor (, which serves as a reference), a positive (, which shares the same identity as the anchor), and a negative sample (, of a different identity). Each input corresponds to a model embedding representation in the learned output space: , , and , respectively. With these, the triplet loss follows the equation:
| (10.1) |
where denotes the Euclidean distance between two embeddings and , and is a tunable margin parameter. By optimising towards the minimisation of this loss, the model is effectively led to bring closer the representations which share the same identities and draw apart those that do not, in the learned output space (see Fig. 10.1).
The triplet loss will lead to embeddings of the same identity being clustered together in the output space. However, they are still allowed some variability as long as it verifies the margin to the negative samples. In the scenario of masked face recognition, adding a mask to an image can be enough to result in a large difference in the embedding within the margin allowance. This is, however, undesirable. A method that is truly robust to face masks should be able to completely ignore masks and, ideally, offer the exact same outputs for a face image and the exact same image but with a face mask. Only thus do we have complete certainty that the model is robust to such occlusions.
As such, we adapt the triplet loss learning strategy to promote such behaviour. Alongside the typical members of a triplet (, , and ), the model also receives a version of the anchor with a synthetically added face mask () covering the mouth, chin, and nose according to health and safety guidelines. The mean squared error (MSE) between and is added to the aforementioned triplet loss formulation to further promote the similarity between the anchor and the masked anchor:
| (10.2) |
With this, we aim to lead the trained model to avoid the regions of the face that are commonly occluded by masks and thus retain performance levels when performing inference on masked face images (see Fig. 10.2).
10.2.2 Multi-task contrastive learning
Building upon the idea of the adapted triplet loss, we propose a multi-task approach for masked face recognition combining multiple objective functions. The proposed methodology, illustrated in Fig. 10.3, receives pairs of masked and unmasked images and is composed of two symbiotic parts: one makes the network aware if a face mask exists in the input image, and the other uses mask awareness for higher stability in identity learning among masked and unmasked images.
The first part consists of the detection of masks in the input image. Embedding features from a common backbone (which can be a pretrained face recognition network) are delivered to a fully-connected module which performs binary classification (masked or unmasked). This module is optimised by minimising the cross-entropy objective function:
| (10.3) |
where represents the number of samples in the mini-batch, is the class number, and represents the output of the module for the sample and target class . This strategy leads the model to become aware of the presence of a mask in the input image and to include this information in the output embedding.
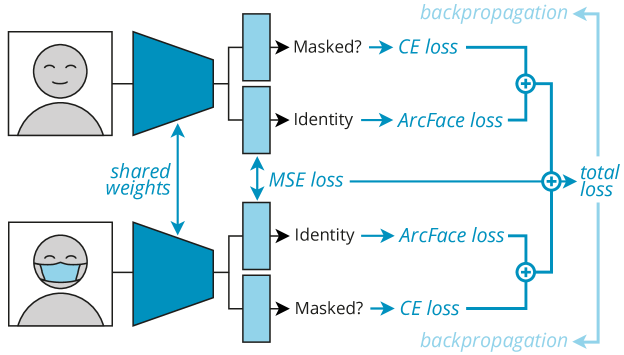
The second part focuses on the identity recognition task. For improved results, we take the ArcFace approach [98], widely considered the state-of-the-art in face recognition. ArcFace learns identity by minimising the following loss function:
| (10.4) |
where represents the embedding distance margin, denotes the scale, and the angle between features () and weights () for sample and target class . Both and are tunable hyperparameters of the loss. ArcFace loss explicitly promotes higher intraclass similarity and diversity among inter-class samples. Also, thanks to the normalisation of both the weights and the feature vector, the loss becomes equal to the geodesic distance margin penalty in a normalised hypersphere.
The global loss is the combination of ArcFace and CE losses computed for both masked and unmasked inputs as well as the MSE between the embeddings of each input. As with the aforedescribed adapted triplet loss approach, the MSE is intended to reinforce the similarity between the latent representations of masked and unmasked inputs throughout the training process, thus further promoting robustness to this kind of face occlusions.
10.3 Experiments and Results
10.3.1 Adapted triplet loss
10.3.1.1 Experimental setup
The development of the adapted triplet loss methodology was partly motivated by the Masked Face Recognition (MFR) competition hosted at the 2021 International Joint Conference on Biometrics (IJCB). As such, the developed methodology is mainly evaluated using the official MFR dataset (MFRC-21) [50]. This dataset is composed of face images of 47 subjects acquired over three different days. The first day is considered the reference, while the second and third days are considered probe sessions. Each session encompassed the acquisition of three videos, two with face masks and one without, using a webcam. In total, 470 non-masked images and 940 masked images are available as references, and 940 non-masked images and 1880 masked images are available as probes.
The training methodology is applied to a ResNet-50 backbone architecture [167] that is used to extract features from masked/unmasked face images. This backbone was trained using cross-entropy loss and stochastic gradient descent for 150 thousand epochs with a batch size of . The initial learning rate was set as , decreased by a factor of 10 whenever validation accuracy began to decay. After convergence, the backbone was fine-tuned either with the original triplet loss or the adapted triplet loss, with empirically set to . Triplets were randomly generated during training, without using any mining strategy, across a total of 65 thousand epochs.
Training used synthetic masked face images. The VGGFace2 dataset [58], composed of over 3.3 million face images from more than nine thousand identities, was adapted to include masked faces. The NIST Dlib C++ toolkit [314] is used to obtain sixty-eight face landmarks which are then used to generate masks appropriately fitted to the mouth/nose region, as detailed in [314, 218], allowing for some controlled variability regarding mask shape and colour. No face alignment was performed, and input images to the model were shaped .
The trained models were evaluated in a biometric verification task in two scenarios: U-M, where the reference is an unmasked image and the probe is a masked image, and M-M, where both the reference and probe are masked face images. The performance is reported through the false non-match rates (FNMR), the FMR100 and FMR10, which are the lowest FNMR for a false match rate (FMR) and , respectively. Additionally, the equal error rate (EER) and the area under the receiver operating characteristic curve (AUC) results are also reported. The genuine mean (GMean) and impostors mean (IMean) scores, which represent the mean distances between the mated and non-mated embedding pairs, were also computed.
10.3.1.2 Results and discussion
The proposed adapted triplet loss methodology was evaluated on two distinct datasets: one with synthetic masks (SMFD) and the other with real masked face images (RMFD). A detailed step-wise ablation study is used to understand the behaviour of the models and the impact of the proposed triplet loss adaptation in masked face recognition.
| Method | GMean | IMean | AUC | EER | FMR100 | FMR10 |
| VGG Face [58, 381] | 0.505 | 0.325 | 0.951 | 11.8% | 38.2% | 13.5% |
| CE Loss | 0.528 | 0.426 | 0.941 | 13.2% | 38.5% | 21.5% |
| CE + TL | 0.601 | 0.320 | 0.977 | 7.8% | 28.9% | 11.9% |
| CE + Adapted TL | 0.596 | 0.319 | 0.985 | 6.2% | 18.5% | 4.1% |
Table 10.1 presents the results on SMFD data. The proposed methodology, combining cross-entropy pretraining, triplet loss, and MSE loss offers the best results across all performance metrics. As visible in the referenced table, the triplet loss training enables considerable performance gains over the CE baseline, outperforming the literature VGG Face model [58, 381] trained on unmasked face images. However, it is the MSE loss between masked and unmasked face images that allows the model to achieve promising results, especially in FMR100 and FMR10.
| Method | Mode | GMean | IMean | AUC | EER | FMR100 | FMR10 |
| VGG Face [58, 381] | U-M M-M | 0.523 0.616 | 0.426 0.461 | 0.769 0.847 | 29.419% 23.552% | 90.587% 68.979% | 58.959% 38.159% |
| CE Loss | U-M M-M | 0.610 0.702 | 0.475 0.503 | 0.931 0.936 | 11.687% 9.002% | 32.041% 16.628% | 12.852% 8.791% |
| CE + TL | U-M M-M | 0.647 0.699 | 0.396 0.414 | 0.943% 0.945% | 11.213 10.806 | 34.744% 26.457% | 11.874% 11.249% |
| CE + Adapted TL | U-M M-M | 0.649 0.699 | 0.383 0.390 | 0.957 0.959 | 9.799% 9.292% | 28.252% 23,507% | 9.678% 9.035% |
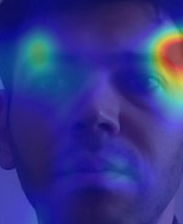
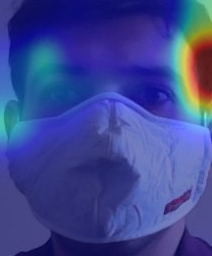
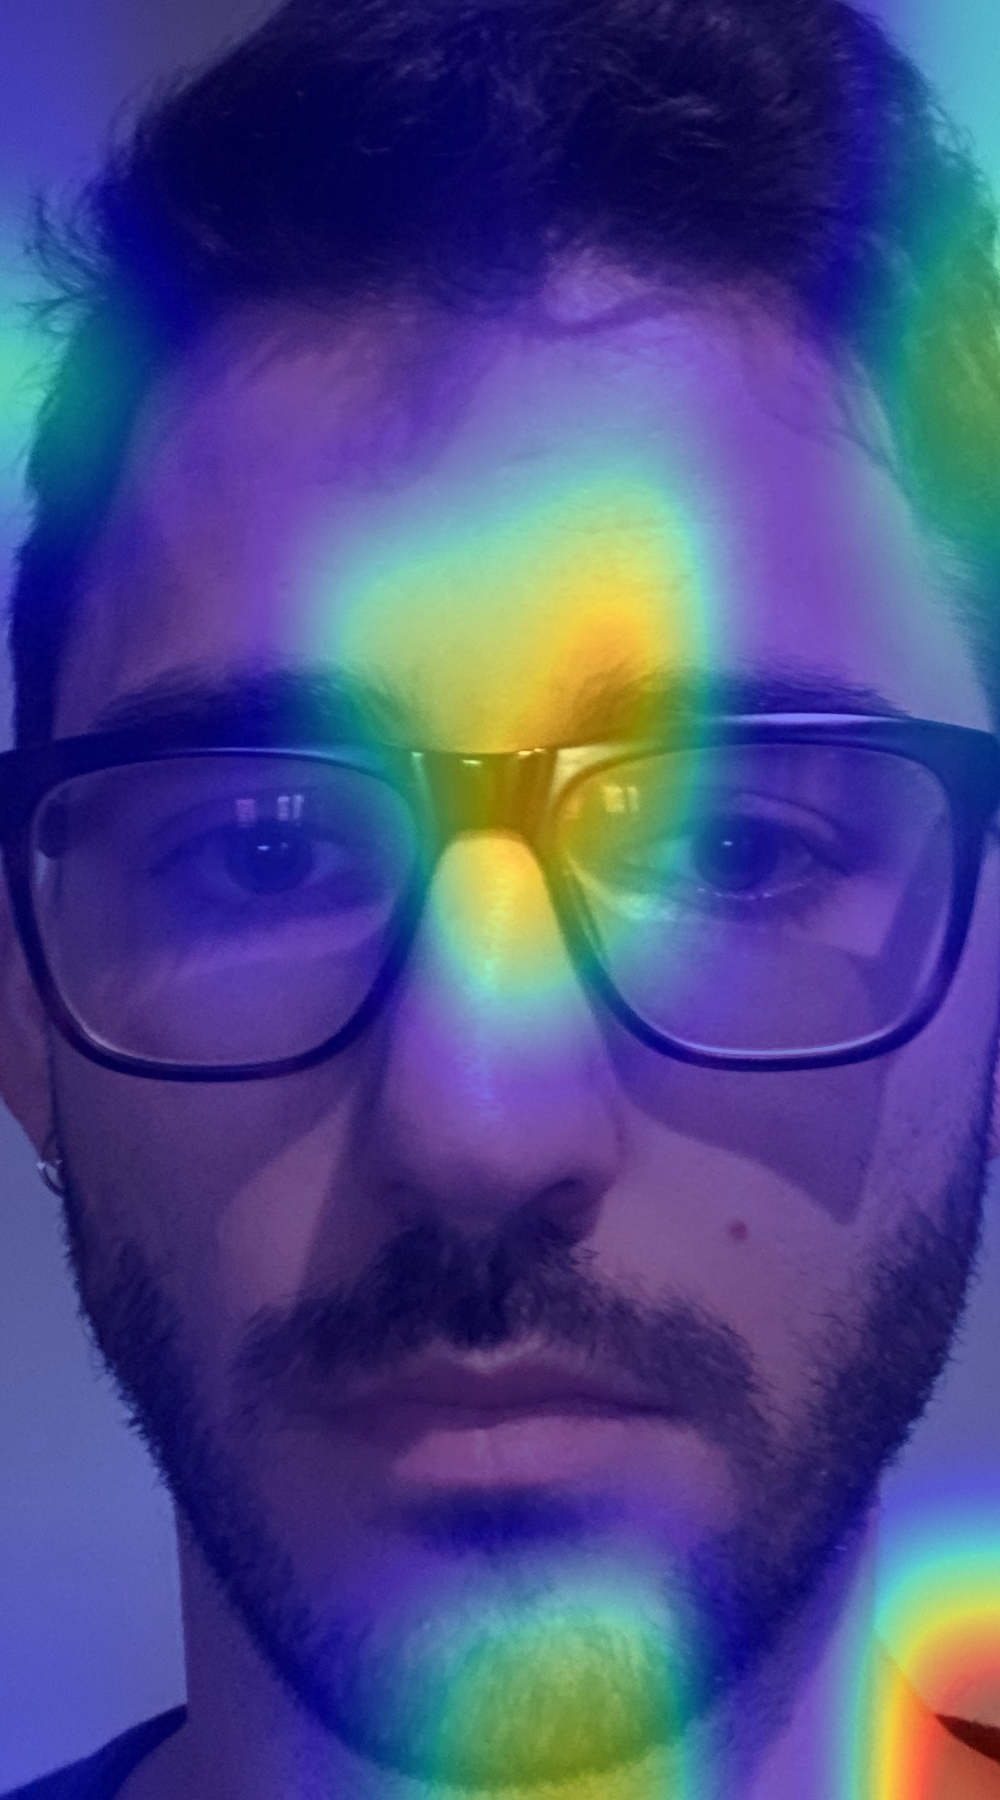
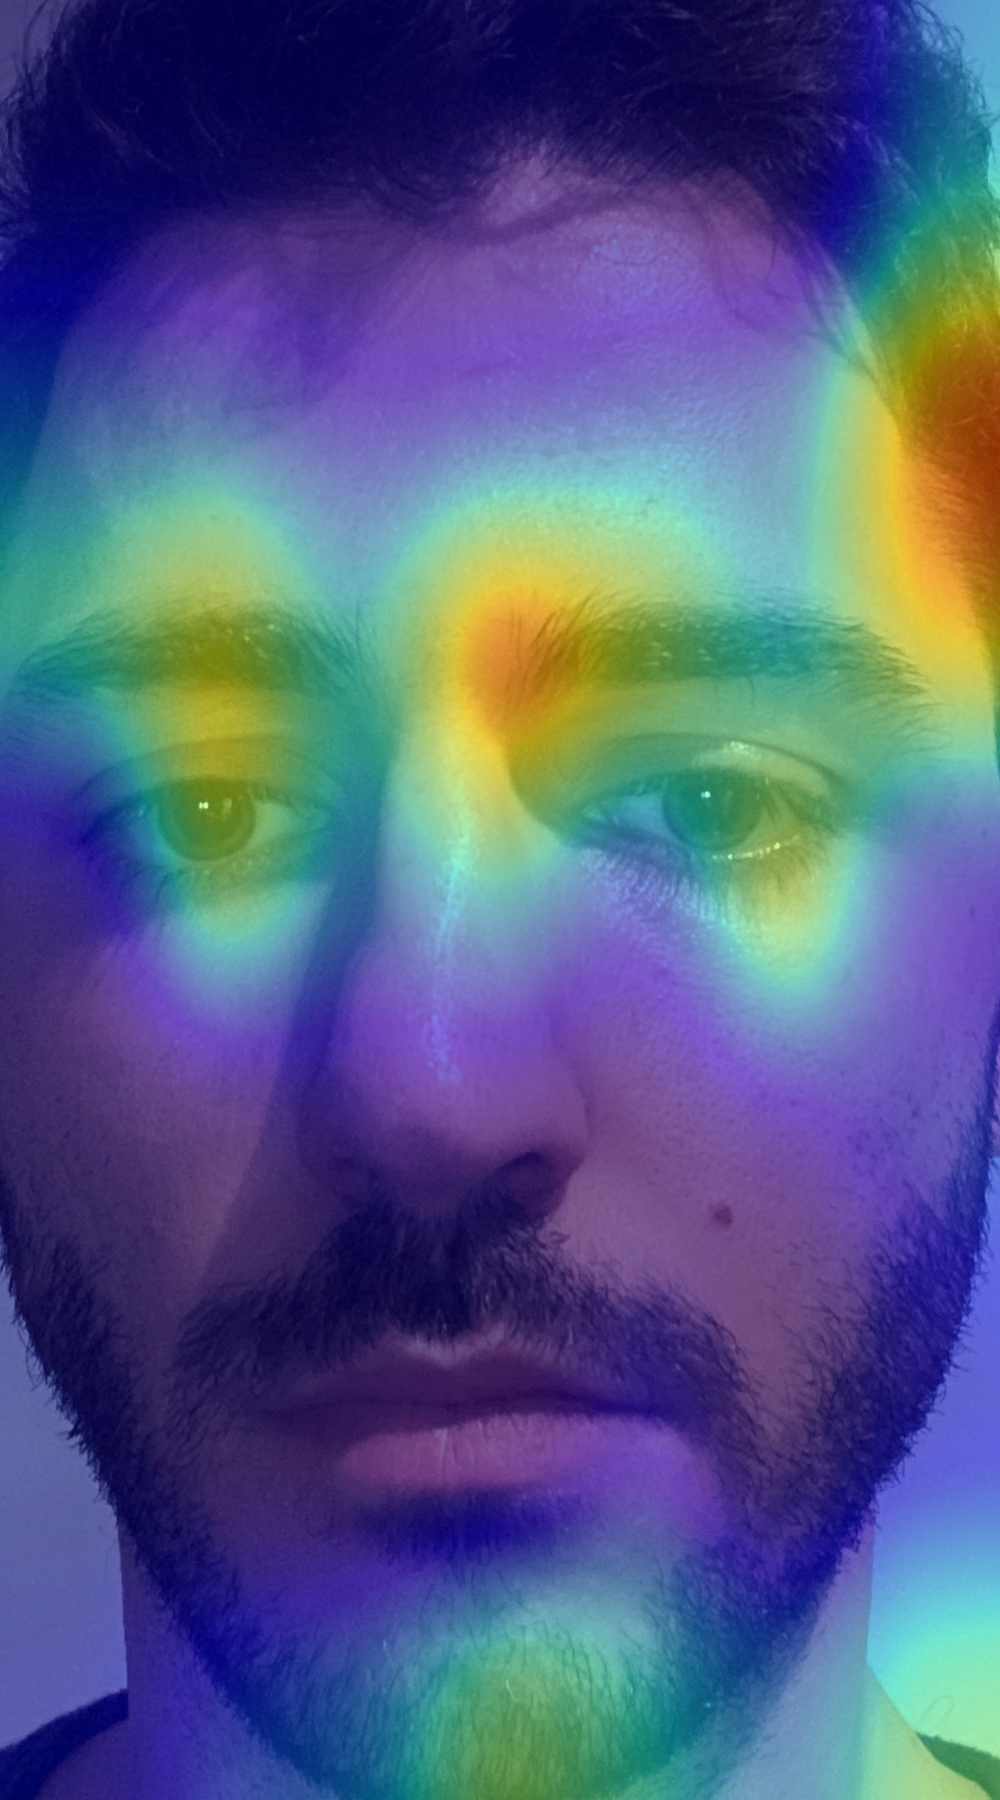
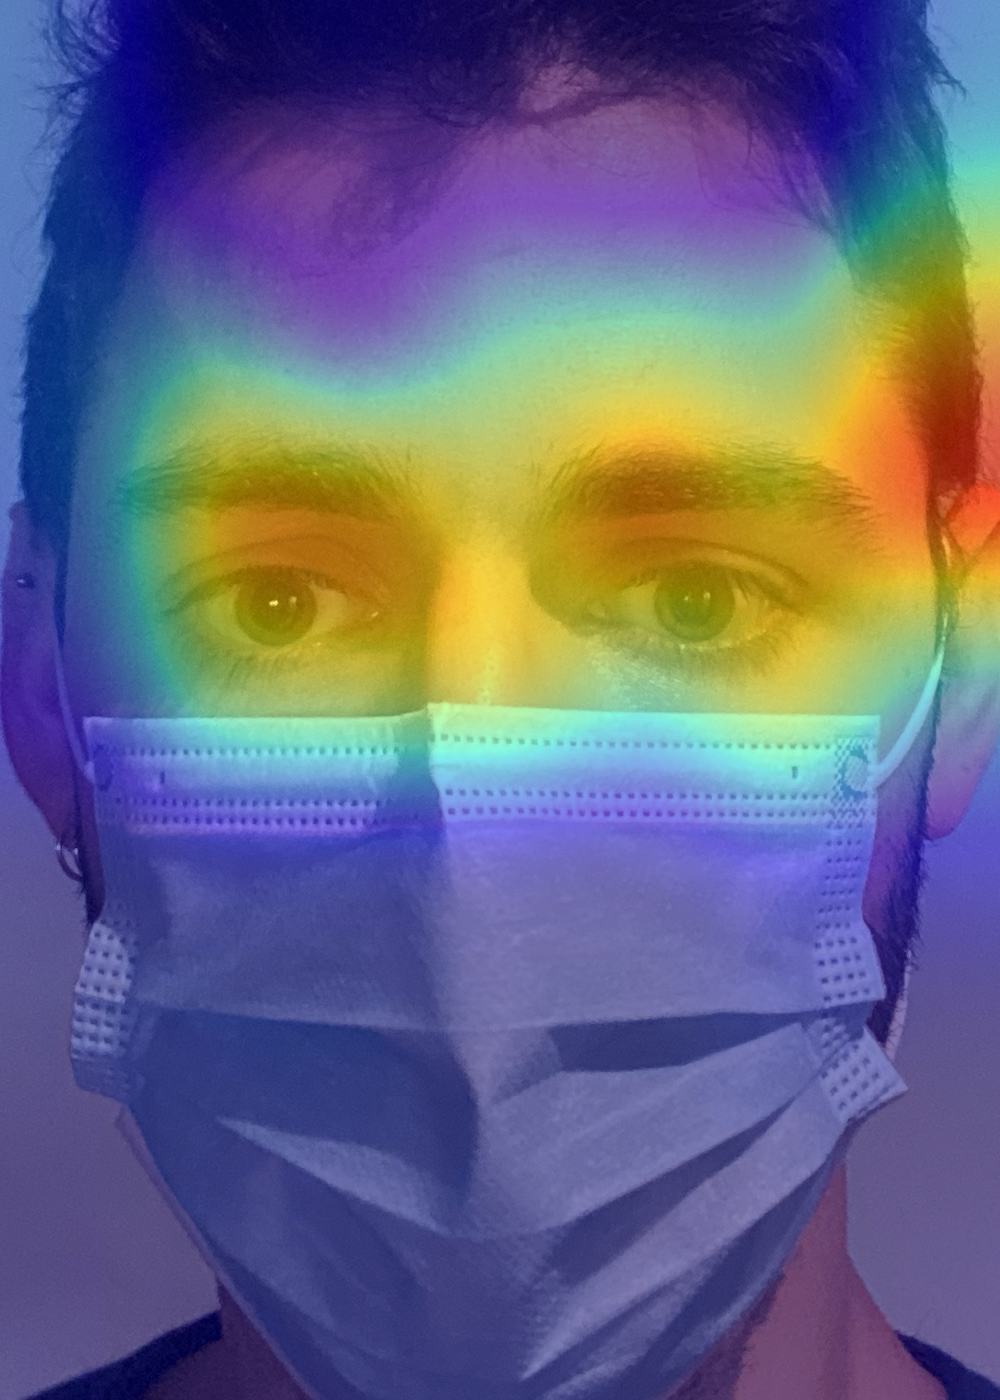

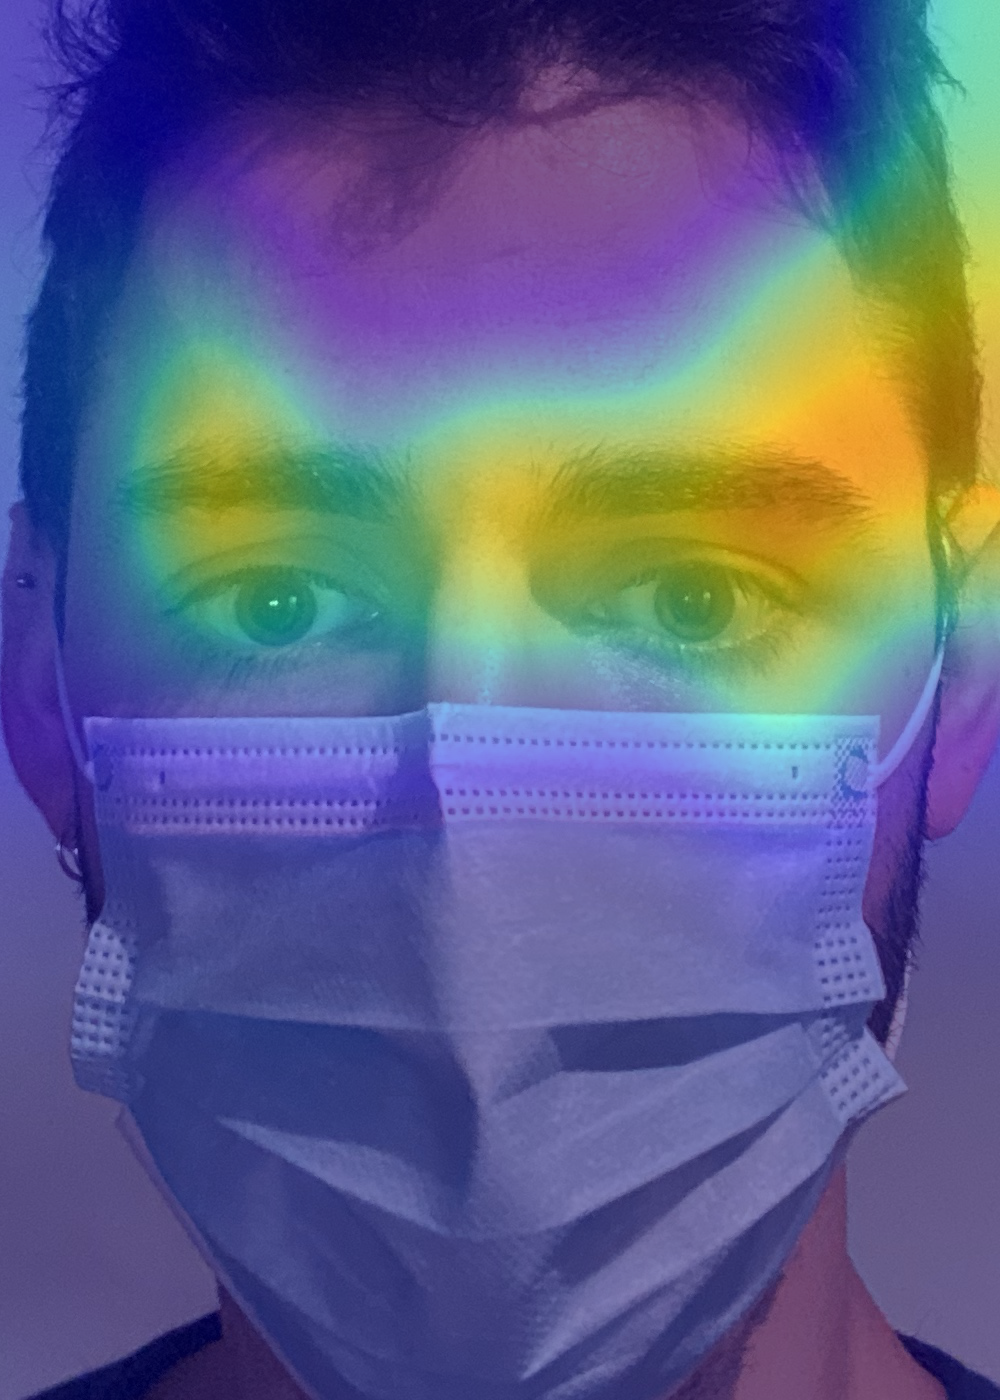
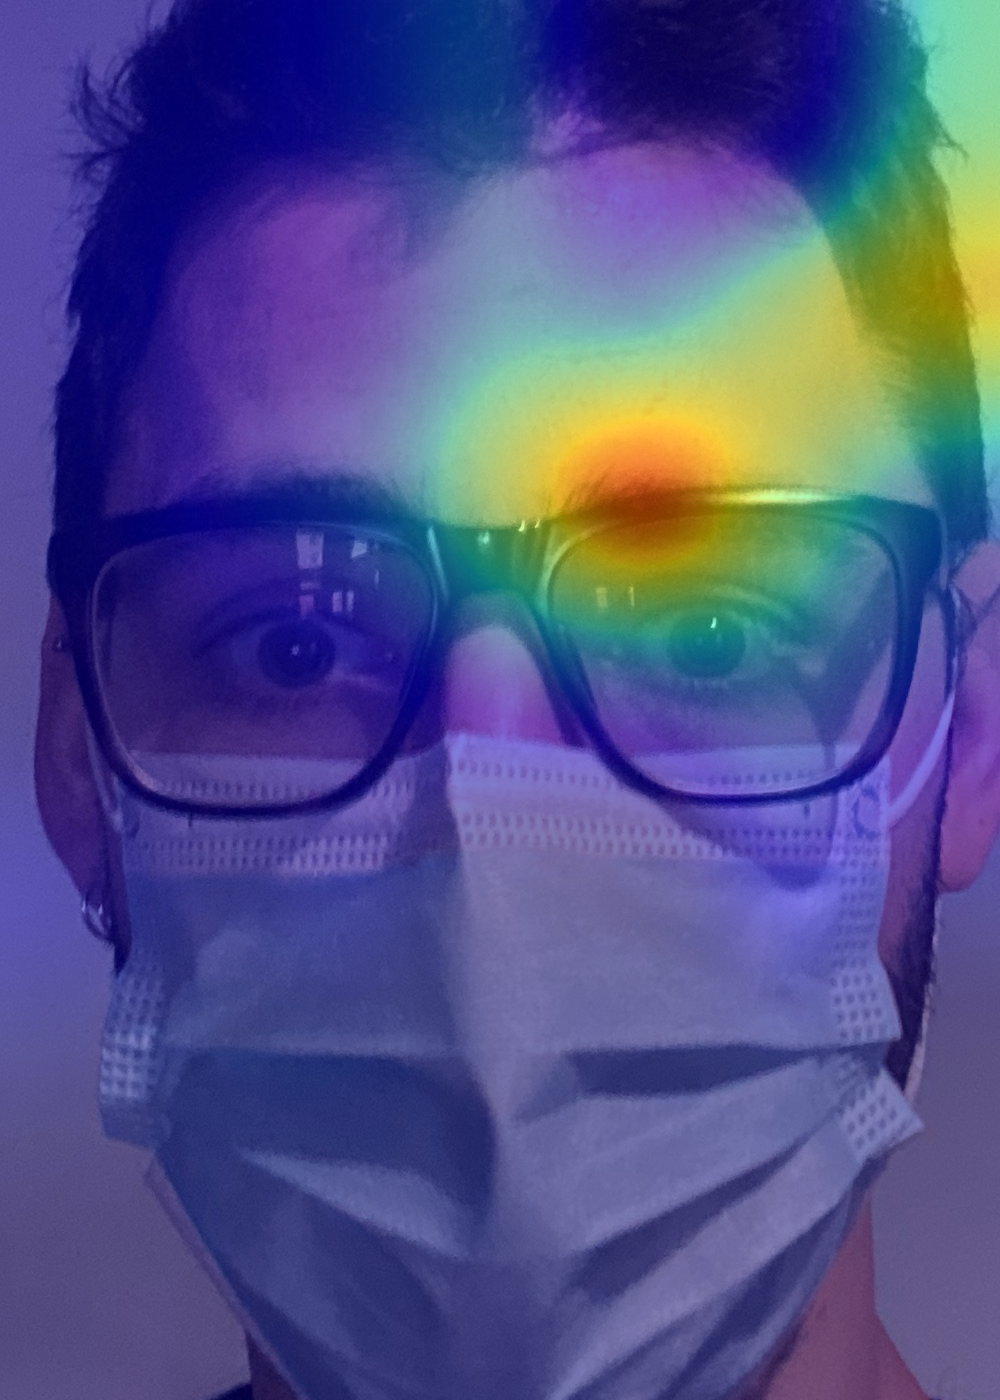
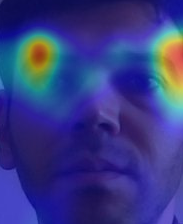
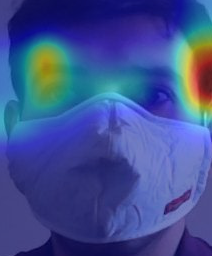
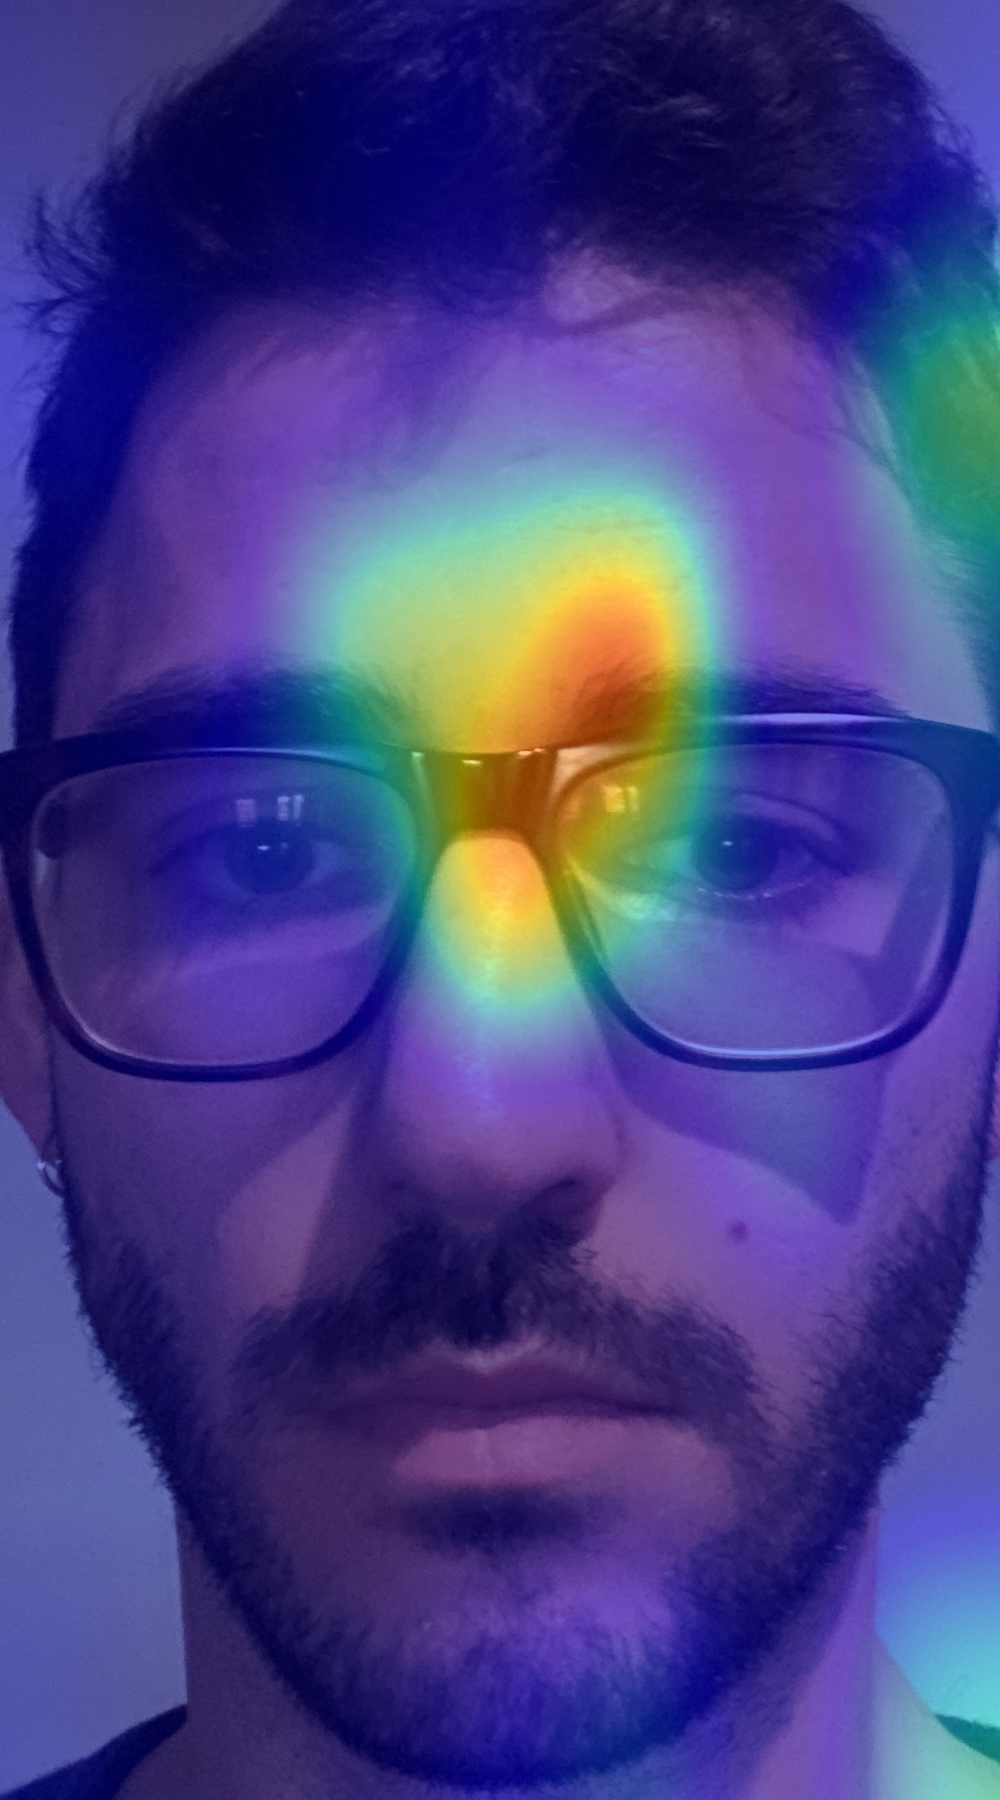
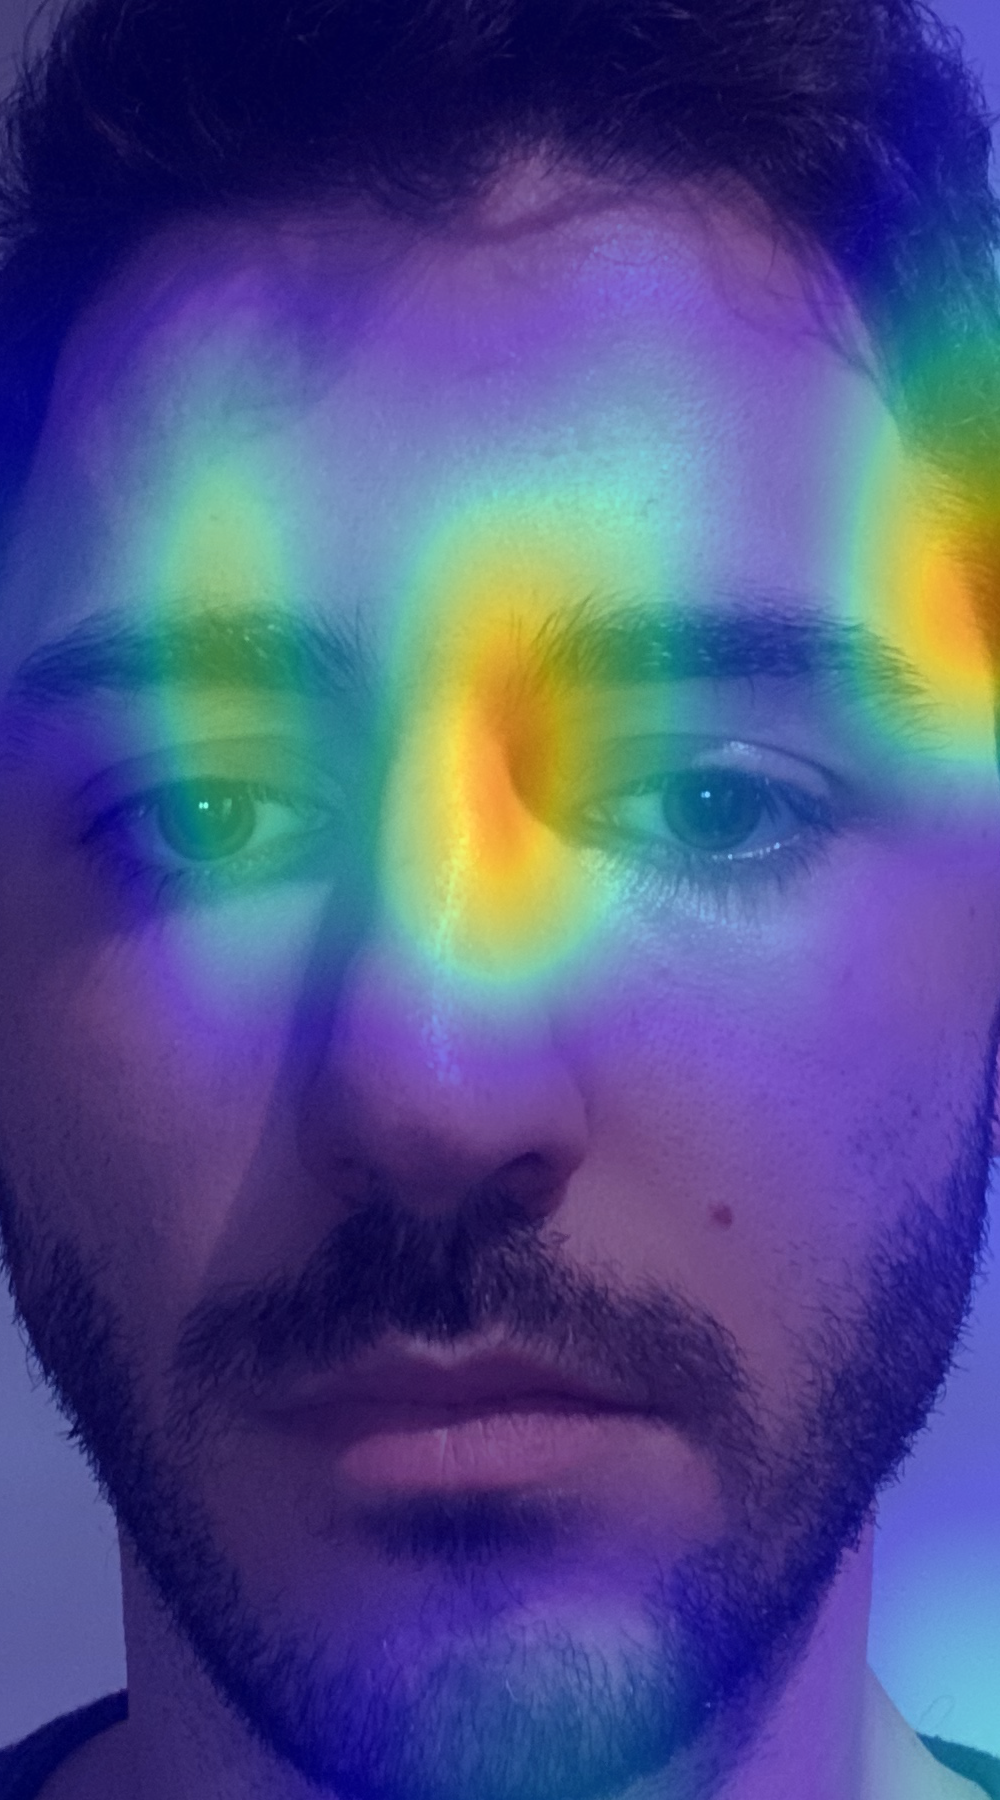
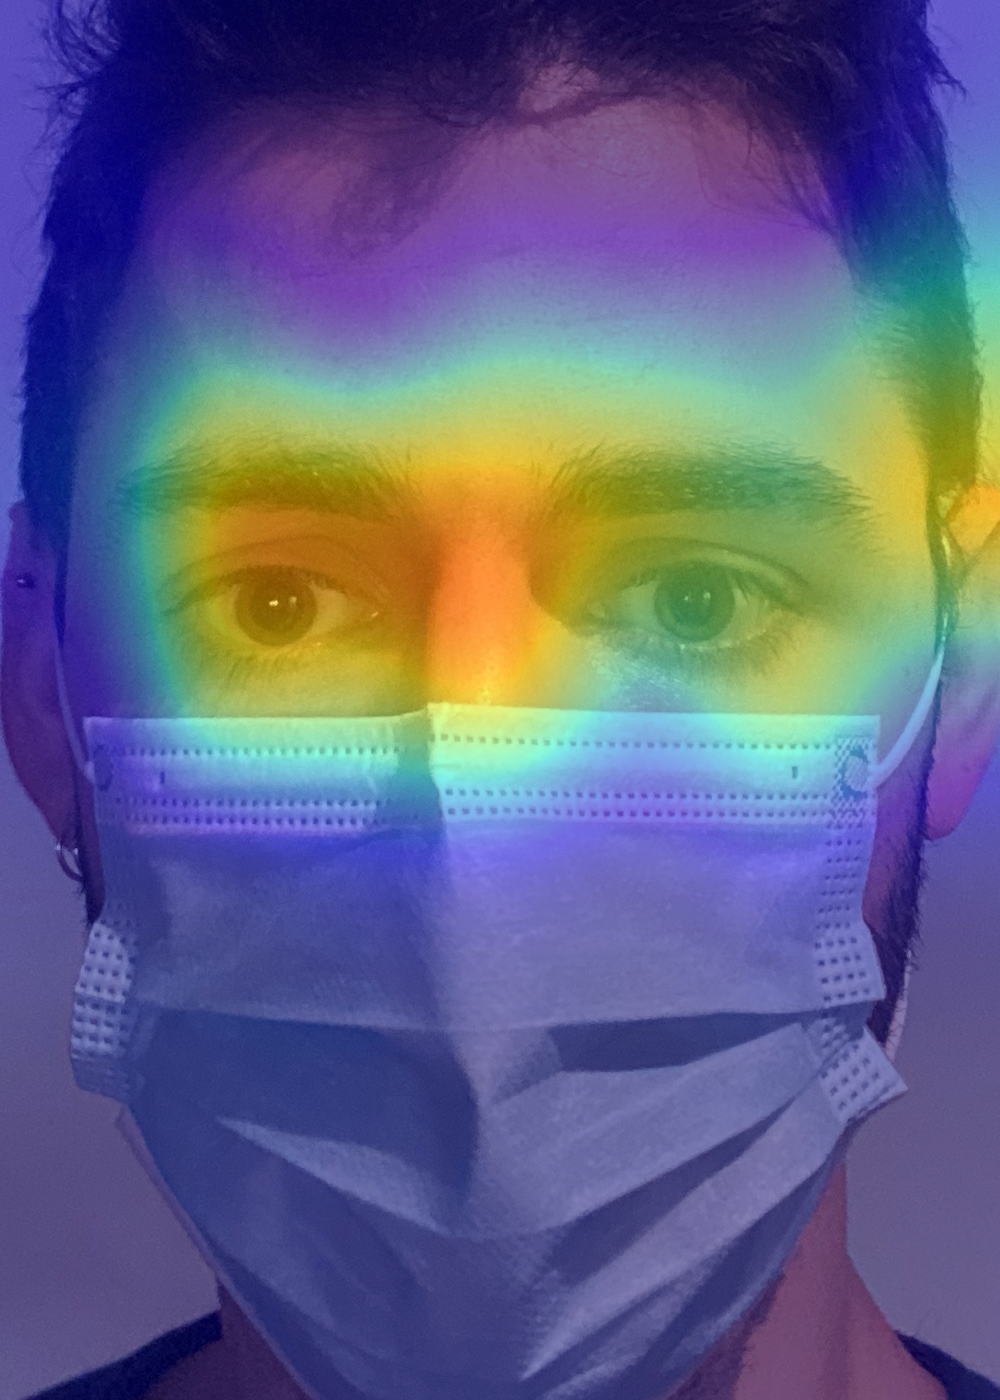
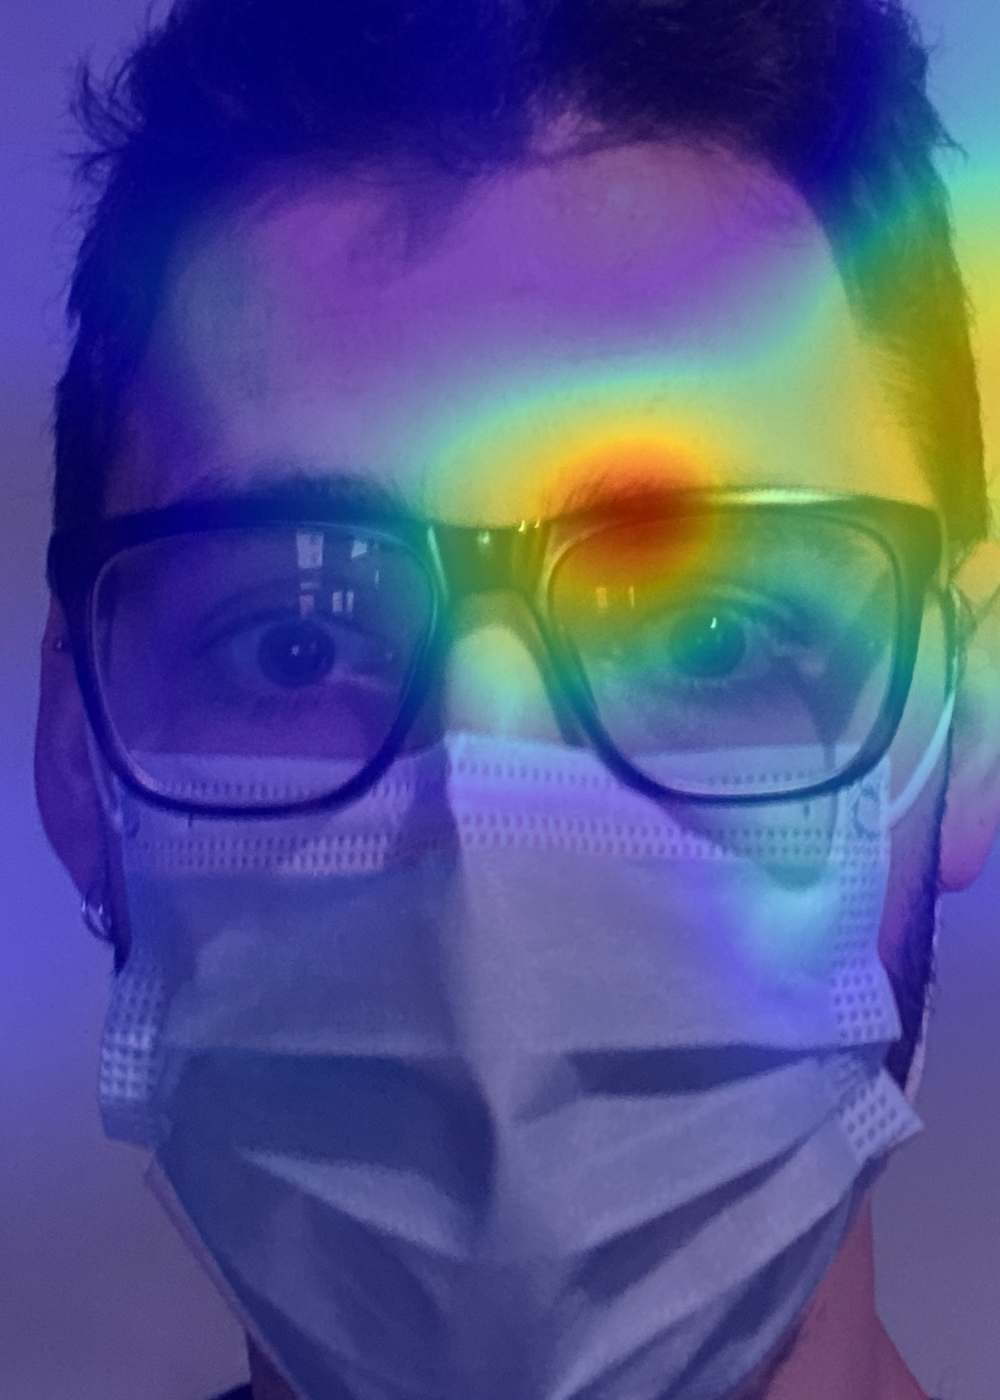
The results on real masked data are presented in Table 10.2, including experiments on the U-M and M-M scenarios. It can be observed that, in general, the performance results are considerably inferior to those on SMFD, likely due to the models being trained with synthetic masks and tested with real masks. However, the proposed adapted triplet loss attained superior performance across all metrics.
It is noteworthy that M-M results, in general, do not differ considerably or consistently from U-M ones. This could be a result of the optimisation process of the adapted triplet loss, which leads the model to minimise the distance between masked and unmasked face embedding pairs. However, it is expected that some applications, such as border control, could consist of the comparison of masked probes (face images captured in loco) with unmasked references (passport photographs).
Alongside the quantitative results presented above, the behaviour of the models trained with the proposed and alternative approaches was also evaluated through explainability. Fig. 10.4 presents six example images for which the Smooth Grad-CAM++ method [322] was used to assess the relevance of the input pixels for the output embedding features. Relevance maps were computed for each embedding feature and then averaged.
It can be observed that the first method, trained only with cross-entropy loss, was already largely able to ignore mask regions in the figures, even when masks are not present. However, it also commonly uses the region of the chin to construct the output embeddings, which does not happen with the remaining two methods. When comparing the explanations of the triplet loss and the adapted triplet loss, it can be observed that the latter typically considers more information from wider regions of the face, thus capturing more information that could be useful for more robust decisions.
10.3.2 Multi-task contrastive learning
10.3.2.1 Experimental setup
After the proposal of the adapted triplet loss, the multi-task contrastive learning methodology aimed to be a more thorough study of masked face recognition. The multi-task contrastive learning methodology was explored for two backbone architectures, ResNet-100 and ResNet-50, both widely used in the face recognition literature [167]. Following the example of Boutros et al. [51], the parameter is set to 64 for the ResNet-100 and 30 for the ResNet-50, with . Training used the Stochastic Gradient Descent (SGD) optimiser with an initial learning rate of , a momentum of , and weight decay of .
Following the example of several literature works [98, 18, 179, 295], this research used the MS1MV2 dataset [98]. The MS1MV2 dataset is based on the MS-Celeb-1M dataset [158] and is composed of 5.8 million images from 85 thousand identities. In this work, this dataset has been augmented, offline, with face masks by generating one image with a face mask for each image in the original dataset.
Face masks were synthesised using the MaskTheFace open source tool [19], which includes five mask options (N95, KN95, surgical, cloth, and gas masks). For each image in the MS1MV2 dataset, one of the first four mask types was randomly selected for the process of synthesising masked face images, and the MaskTheFace tool took care of correctly reshaping and rotating the mask templates to match the detected face landmarks in each image.
The described process was similarly followed for the images in the Labeled Faces in the Wild (LFW) dataset [178], used for model validation during training (see Fig. 10.5 for some examples). Although trained and validated on synthetic data, the method was evaluated on the MFR dataset, composed of real masked face images, just as the adapted triplet loss methodology. Also, like with the adapted triplet loss, we explore the evaluation scenarios U-M (with unmasked references and masked probes) and M-M (with masked references and probes).


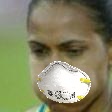
10.3.2.2 Results and discussion
This section presents the results achieved by the multi-task contrastive loss approach. Comparisons focus mainly on the adapted triplet loss methodology, alternative approaches submitted to the MFR competition, and multiple ablation studies.
| Model | Selection | Mode | GMean | IMean | AUC | EER | FMR100 | FMR10 |
| ResNet-50 | Original | U-M M-M | 0.561 0.625 | 0.333 0.341 | 0.988 0.983 | 5.377% 5.346% | 7.285% 6.546% | 4.519% 4.642% |
| ResNet-100 (Pretrained) | Original | U-M M-M | 0.571 0.627 | 0.357 0.365 | 0.987 0.983 | 4.917% 5.005% | 5.986% 6.109% | 3.922% 3.882% |
| ResNet-100 (Pretrained) | Random | U-M M-M | 0.567 0.625 | 0.354 0.361 | 0.984 0.984 | 5.371% 5.581% | 5.986% 6.184% | 4.991% 5.056% |
| ResNet-100 | Original | U-M M-M | 0.624 0.675 | 0.373 0.383 | 0.992 0.992 | 4.594% 4.329% | 5.750% 5.509% | 2.582% 2.836% |
| ResNet-100 | Random | U-M M-M | 0.621 0.671 | 0.371 0.382 | 0.988 0.991 | 5.164% 4.757% | 5.917% 5.695% | 4.197% 3.668% |
The conducted ablation studies explored smaller backbone models, the use of pretrained networks, and diverse image selection approaches for the contrastive learning module. According to the results presented in Table 10.3, four of the explored variants were capable of outperforming the official MFR competition baseline [50] under the U-M scenario. Two of them were capable of outperforming the baseline under the M-M scenario as well.
The non-pretrained ResNet-100 backbone model offered the best overall performance, especially when using the original pair selection process where the masked image is the masked version of the unmasked image. Nevertheless, the results with pretrained models reveal that the proposed method can effectively make existing models able to recognise masked faces with reasonable accuracy and reduced training effort.
In fact, even though accuracy is important, time is also a key factor with such processing-heavy algorithms. Most of the MFR competition submissions using a ResNet-100 backbone required the training of more than 65 million parameters in the backbone model and up to 44 million parameters in the ArcFace layer. Using pretrained weights for the entire backbone (except for the last layer), the number of trainable parameters is reduced by approximately 47.6% while still outperforming the baseline algorithm (see Table 10.4).
| Module | No. Parameters | Inference |
| ResNet-100 w/o Embedding Layer | 52 309 568 | Yes |
| Face Recognition Embedding Layer | 12 846 080 | Yes |
| Mask Detection Embedding Layer | 802 880 | No |
| ArcFace Layer | 43 899 904 | No |
| Mask Detection Fully-Connected Layer | 66 | No |
| Total (Training w/o pretraining) | 109 858 498 | - |
| Total (Training w/ pretraining) | 57 548 930 | - |
| Total (Inference) | 65 155 648 | - |
In general, one can observe that better results were obtained when the masked image corresponds to the unmasked image (original pair selection), likely as this better allowed to reinforce in the model the behaviour of avoiding information that could be occluded by a mask. As for the U-M and M-M scenarios, performance differences were not relevant nor consistent for any of the models. As such, the proposed method is able to outperform the challenge baseline in both scenarios.
A comparison with other submissions to the MFR 2021 competition is presented in Table 10.5, for the U-M and M-M scenarios. The compared methods (A1_Simple, VIPLFACE-M, and MaskedArcFace) were selected based on the competition results, the chosen loss functions (ArcFace loss), the input and feature vector sizes ( and , respectively), and the dataset used (MS1MV2). Additionally, the proposed method is also compared to the challenge baseline and the adapted triplet loss method [309].
| FMR100 | ||
| Method | U-M | M-M |
| Baseline [50] | 6.009% | 5.925 % |
| A1_Simple [50] | 5.538% | 5.771% |
| VIPLFACE-M [50] | 5.681% | 5.759% |
| MaskedArcFace [50] | 5.687% | 5.825% |
| Adapted Triplet Loss [309] | 28.252% | 23.507% |
| Multi-Task Contrastive Learning | 5.750% | 5.509% |
As presented in Table 10.5, it is possible to see that, despite presenting very similar performance between the U-M and M-M scenarios, the proposed multi-task contrastive learning methodology is only able to outperform the selected competition submissions on the M-M scenario. However, the difference between the methods’ performances is relatively small and the contrastive approach was able to consistently outperform both the official baseline and the adapted triplet loss methodology in both scenarios.
In the U-M scenario, a possible explanation for the advantage of A1_Simple is that it uses a larger backbone model than ours, with roughly 34% more parameters. As for VIPLFACE-M, the proponents used a different (improved) mask synthesis technique, which could be responsible for the performance benefit. MaskedArcFace appears to also apply synthetic masks to the test set. As for the M-M scenario, the proposed contrastive solution was able to outperform all alternative methods by a margin of at least FMR100.
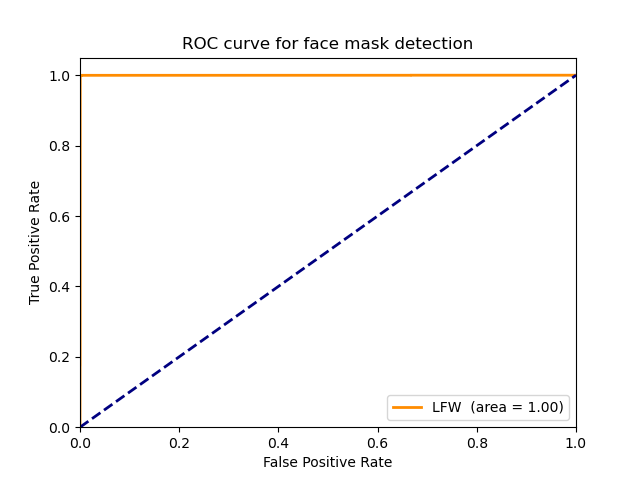
Thanks to the multi-task nature of the proposed methodology, it is possible to leverage the second embedding to perform simultaneous mask detection. Fig. 10.6 shows the ROC curve results of the proposed model on the mask detection task, evaluated on the augmented LFW dataset. The model achieved a perfect face detection score, which could be exaggerated by the relative simplicity of the validation data, but nevertheless show the effectiveness of the proposed multi-task methodology.
Overall, these results showcase the capabilities of the proposed methodology, not only versus the official MFR 2021 competition baseline and the submitted algorithms, but also against the proposed adapted triplet loss. Moreover, the ability to achieve competitive results with largely frozen pretrained backbones enables obtaining multi-task architectures with up to fewer trainable parameters.
10.4 Summary and Conclusions
The work presented in this chapter addressed the challenge of masked face recognition, made relevant by the worldwide face mask mandates born out of the recent Covid-19 pandemic. Despite the extensive work on the robustness to occlusions in face biometrics, the presence of a mask hiding the nose, chin, and mouth has resulted in significant performance decay.
Here, two approaches were presented to mitigate this issue. The first is an adaptation of the triplet loss by combining it with the mean squared error (MSE) loss, which will minimise the distance between embeddings from masked and unmasked versions of a face image. The second is a multi-task contrastive learning approach that aims to make the model aware of the presence of a mask and uses it alongside the ArcFace and MSE losses to achieve a more robust recognition model. Both approaches aim to lead a biometric model into offering the same templates for a face image, whether or not it contains a mask, effectively leading the model to avoid information from the face regions that could be occluded by a mask.
Results show that the combination of different losses and the promotion of embedding similarity between masked and unmasked versions of a face image are successful at improving masked face recognition performance. Experiments with an explainability tool also show the models are indeed led to avoid regions that could be occluded by masks and to better use information from visible face regions.
However, the second proposed approach, based on a multi-task contrastive learning strategy, is the one which offered the best results. By combining the ArcFace loss (widely praised in face recognition literature) with the MSE loss (which showed promise in the adapted triplet loss results) and a strategy to make the network aware of the presence of masks, it was able to outperform the official baseline and the best algorithm submissions in the MFR 2021 challenge.
Although the results are promising, further efforts should be devoted to the improvement of the contrastive learning approach, the preprocessing stage of adding synthetic masks to test data, and the study of larger and more accurate backbone architectures. The topic of masked face recognition would also benefit heavily from larger and improved databases, with real masks of diverse types worn by larger sets of individuals.
Chapter 11 Interpretability for Face Biometrics
11.1 Context and Motivation
Like plenty of other artificial intelligence fields, biometrics has been witnessing a steadily increasing dominance of deep learning-based approaches. This is largely due to the availability of unprecedentedly large datasets and major computational gains offered by powerful graphics processing units (GPU) [242, 212]. As discussed in Chapter 9, the largest downside of such a trend is the lack of transparency of the resulting algorithms, which has been increasingly criticised by the research community [372, 174, 107].
Beyond simple decision accuracy-based metrics, there are several other aspects of a model that may be useful (and even to understand during its development and evaluation to avoid undesirable future consequences. One great example of this was described by Lapuschkin et al. [241], who observed that for the detection of the class “horse” by a deep neural network, the model assigned relevance to the bottom left corner of the images. A careful inspection revealed the presence of a copyright tag in that location, meaning the model was relying on this tag for the decision instead of using meaningful image information.
For the example of a face presentation attack detection (PAD) model, it may be important for a model to verify certain properties that may not be immediately obvious. First, the model should look for the same information in a given sample whether or not that sample has been seen during training. Second, a presentation attack sample should be processed similarly by a model whether or not it was trained to detect that specific attack. Third, the behaviour of the model should be coherent (similar) for different samples with the same predicted label. At last, the model’s choice of information within a sample should be meaningful (as in, a human would likely look to the same regions to provide the same decision).
These ideal behaviours may not be entirely objective and consensual. However, they are aspects of deep learning models that cannot be measured by traditional metrics. The ability to peek deeper into the inner workings of biometric models is the true advantage behind integrating interpretability in their development and evaluation.
The exploratory study presented in this chapter focused on the face PAD task to illustrate how interpretability could be integrated with biometrics to reach the aforementioned goal. As such, this work did not aim to push forward the state-of-the-art in face PAD, but to push forward the almost nonexistent field of the explainability analysis in biometrics. An end-to-end CNN was implemented to perform face PAD, and Grad-CAM was used to explain its decisions, delving deeper into the behaviour of the model and assessing whether or not it verifies the desirable properties discussed above.
11.2 Methodology
11.2.1 Implemented face PAD network
A PAD method receives a biometric trait measurement as input and returns a prediction of whether that measurement belongs to a live individual (referred to as a bona fide sample) or a spoof attempt to intrude the system (in this case referred to as a presentation attack).
In this work, the model used for PAD is an end-to-end convolutional neural network (CNN). As an end-to-end CNN, the model was granted the flexibility to freely learn the most appropriate features for the task at hand. This provides the most interesting context for interpretability studies focused on gaining insight into the inner workings of a classifier. A relatively simple architecture was chosen (see Fig. 11.1), as the emphasis of this work was to study the interpretability of the face PAD model and not necessarily to surpass the PAD state-of-the-art.
The input to the network is a RGB image and the output is a bidimensional softmax layer providing two probability scores. The network is composed of four convolutional layers, with three max-pooling layers interposed between them, and three fully-connected layers. The four convolutional layers are composed of , , , and filters, respectively, with size , unit stride, and padding. The max-pooling is performed in regions with stride . The dense layers are composed of , , and neurons, respectively. All convolutional and fully-connected layers are followed by rectified linear unit (ReLU) activations, except for the last dense layer, which is followed by softmax activation.
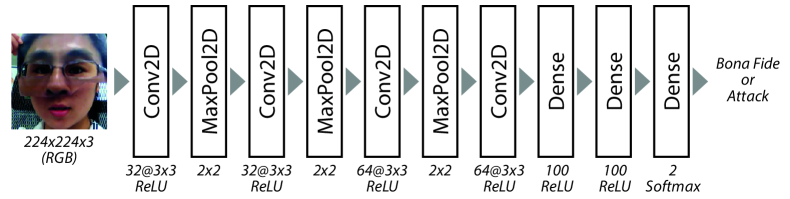
11.2.2 Interpretability method
The Gradient-weighted Class Activation Mapping (Grad-CAM) [383] method is inspired by the Class Activation Mapping (CAM) [492]. CAM was introduced for the identification of discriminative regions in CNNs without fully-connected layers and restricted to the architectures that perform global average pooling over convolutional maps immediately before prediction. Grad-CAM is a generalisation of CAM in the sense that it was designed to be used with any type of CNN architecture.
Grad-CAM consists of the combination of feature maps using the gradient signal. The gradient information flows to the last convolutional layer of the model, thus assigning different importance values to each neuron according to a particular decision of interest. This interpretability tool enables the generation of explanations for any layer of the network. Additionally, it is possible to obtain explanations per class, allowing the analysis of the model predictions at a class-level.
11.3 Experimental Setup
11.3.1 Data
This work used bona fide and presentation attack images extracted from the ROSE-Youtu Face Liveness Detection Dataset [249]. This dataset is composed of videos of twenty subjects, including attack videos of seven different PAI species (see Table 11.1). From each video, frames were extracted every five seconds and faces were detected on each frame using an MTCNN [482]. Face regions were cropped, resized to , and normalised to . The samples from subjects were reserved for testing, while the data from the remaining fifteen subjects were used for training and validation.
| PAI Species | No. Frames | |
| - | Genuine (bona fide) | 2794 |
| Still printed paper | 1136 | |
| Quivering printed paper | 1188 | |
| Video of a Lenovo LCD display | 923 | |
| Video of a Mac LCD display | 1113 | |
| Paper mask with two eyes and mouth cropped out | 608 | |
| Paper mask without cropping | 1194 | |
| Paper mask with the upper part cut in the middle | 1162 |
11.3.2 Implementation details
The PAD end-to-end model was trained on the extracted ROSE Youtu data using the Adam optimiser, with an initial learning rate of for a maximum of epochs with batch size . Early stopping was used, monitoring the validation loss, with patience of epochs. For regularisation, dropout () was used between each pair of consecutive dense layers. Horizontal flips, rotations with a range of degrees, and width and height shifts with a range of were used for data augmentation.
Explainability experiments were performed using the Grad-CAM [383] implementation provided by the Keras Visualisation Toolkit [227] for Python, which is a library that enables visualising and debugging a trained Keras model. It supports the visualisation of class activation maps, saliency maps, and activation maximisation. In the obtained maps, each pixel is assigned a relevance value that corresponds to a specific colour from blue (less relevant to the decision) to yellow (more relevant).
11.3.3 Experimental scenarios and evaluation
The explored scenarios follow those discussed in Chapter 9:
-
•
In one-attack, the PAD model is trained and tested with bona fide samples and only one type of attack/PAD species (PAISp). Therefore, the only type of attack shown to the network during the test phase was already seen in the training step. The expression One-Attack, used throughout the remainder of this chapter, denotes the respective model was trained and tested with bona fide samples and presentation attack samples of type ;
-
•
In unseen-attack, the PAD model is trained with all but one PAISp and tested with the remaining PAISp, besides the bona fide samples in the train and test steps. Therefore, during the test phase, the network is evaluated only with the type of PAD attack that was not present in the training step (the unseen attack). This scenario enables a more thorough evaluation of the generalisation capabilities of the PAD model. The expression Unseen-Attack, used throughout the remainder of this chapter, denotes the respective model was tested with bona fide samples and presentation attack samples of type and trained with bona fide samples and the remaining types of attacks (i.e., trained with ).
Evaluation results are reported using standardised metrics commonly used by the literature in PAD. The Bona fide Presentation Classification Error Rate (BPCER) measures the proportion of bona fide samples erroneously classified as attacks and the Attack Presentation Classification Error Rate (APCER) indicates the proportion of presentation attacks wrongly classified as bona fide [192]. The Equal Error Rate (EER) is the error at the operation point where the APCER and BPCER present the same value.
11.4 Conducted Studies on PAD Interpretability
11.4.1 Representation of a model’s explanations
Beyond qualitative visualisation of explanations, this work entails a quantitative analysis consisting of the comparison between the explanations obtained with bona fide or presentation attack samples and taking into account the different evaluation scenarios (one-attack or unseen-attack). Bona fide samples are present in both training and testing in any scenario, hence these can be tested and explained in any framework One-Attack or Unseen-Attack.
The presentation attack samples belong to a specific type of attack. Considering the one-attack evaluation scenario, an attack sample of type can only be tested for the respective One-Attack scenario. It is not meaningful to test this sample with the models of One-Attack (with ) because then this would be an Unseen-Attack scenario.
As such, let ,…, and ,…, be a set of images and the respective set of explanations. For each image (for ) there is a corresponding explanation . Note that or whether the explanation refers to a classification result within the one-attack or unseen-attack scenario, respectively, and is the type of attack that defines the model used for testing. Thus, each explanation is obtained with a specific model determined by the evaluation framework and the attack used in testing.
11.4.2 Semantic representation of explanations
One of the objectives of this work was to measure the variability of the explanations for both bona fide and presentation attack samples in the two different evaluation scenarios. To do this, one needs a suitable representation of the produced explanations, so that it becomes possible to quantify how much two explanations differ from each other. In this work, this comparison is performed in a semantic context. An illustrative example of how the approach used to perform a quantitative comparison between explanations is depicted in Fig.11.2.
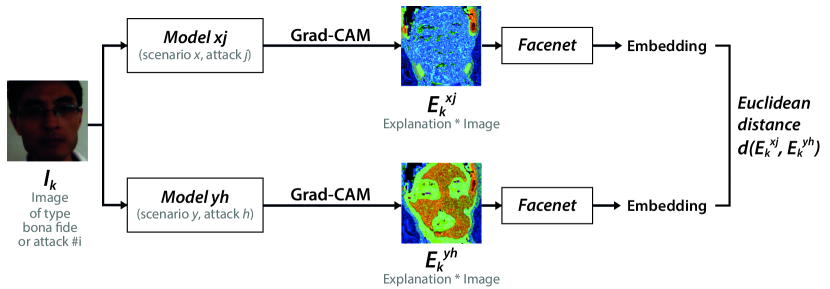
As stated before, the explanations are generated using Grad-CAM, which highlights the image regions that maximise the predicted class. Since Grad-CAM typically produces blobby and coarse explanations that fail to preserve finer details, it was decided to multiply the saliency maps by the respective images. However, this space is still not ideal for image comparison, as it would be highly impacted by the spatial location of important features.
To overcome this issue, and inspired by what is being done in image retrieval [173, 398] and concept-based interpretability [145] to find similar images, the learned features computed by a pre-trained CNN were used as the space to measure the distance between two explanations. This follows the finding of Zhang et al. [485] that the Euclidean distance in the activation space of final layers is an effective similarity metric.
Since this work focused on face images, FaceNet [381], a face-specific network pretrained on the VGGFace2 dataset [58], was used for the extraction of the deep features. This CNN was trained using a triplet loss, aiming to optimise the embedding space and ensure that the FaceNet could learn a function that correctly maps the face images to a compact Euclidean space where distances directly correspond to a measure of face similarity.
To take advantage of these FaceNet properties and achieve meaningful mappings of the Grad-CAM explanations, we start by multiplying the original images by their respective Grad-CAM explanations. We then input the resulting image into FaceNet, and extract the features generated in the penultimate layer. All the Euclidean distances reported in this paper are computed in this semantic space.
11.4.3 Comparison of explanations across different scenarios
One could hypothesise that, for a robust PAD model, explanations for the same sample should be similar whether or not the model is trained to detect that specific attack. Verifying this property means we are in the presence of a PAD algorithm with thorough generalisation capabilities. In this section, we describe a study that addresses the assessment of this property.
For bona fide images, Fig. 11.3 illustrates the process to compare the explanations, having an image , the evaluation framework (either one-attack or unseen-Attack), and fixing as reference the explanation obtained by the model for the PAISp in both frameworks.
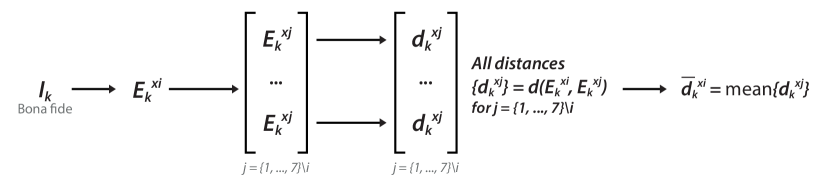
As for presentation attack images, Fig. 11.4 illustrates the process to compare explanations, having a presentation attack image of type Attack . In this case, the comparison is made by fixing as reference the explanation of the result of the classification in the one-attack framework obtained by the model for the Attack . Thus, the evaluation framework is . As mentioned before, this is done in order to have a more stable benchmark for comparison, since in the one-attack scenario the model is trained and tested with the same type of attack.
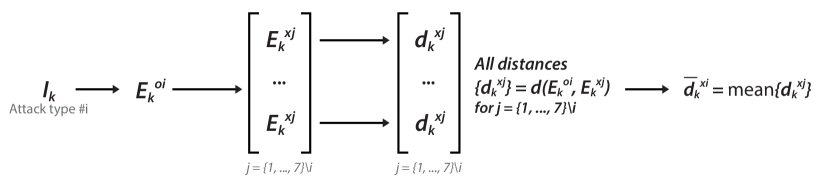
So, for each image (either bona fide or presentation attack), evaluation framework , and using the model regarding attack , a set of six total values is obtained. It results of the comparison between the explanation (always in the presentation attack case) and the explanation (for ).
The distance measurements between explanations provide a quantitative measure of the variability of the explanations produced by the different models when processing the same image. Averaging these values will provide the values for comparison, given by:
| (11.1) |
For sake of clarity, Table 11.2 presents these distance values and their correspondence to the images and scenarios. The values obtained for each image are unique for a presentation attack sample and multiple (one for each ) for a bona fide sample. They can be used for other quantitative interpretability endeavours, including to obtain image average and attack average distances:
-
•
The Image Average () provides a quantitative measure of the variability, across all models, of the explanations produced by each model under the evaluation framework defined by (for or and ) regarding one image . The for the bona fide is given by Eq. (11.2) and for the presentation attacks is given by Eq. (11.3).
for a bona fide sample: (11.2) for an attack sample (type ): (11.3) -
•
The Attack Average () provides a quantitative measure of the variability, across all samples, of the explanations produced by the model under one evaluation scenario defined by (for or and ). Consider the values as defined in Table 11.2 and being ad the number of bona fide and attack samples, respectively. The for the bona fide is given by Eq. (11.4) and for the presentation attacks is given by Eq. (11.5).
for a bona fide sample: (11.4) for an attack sample (type ): (11.5)
| Sample Class | Scenario | Comparisons |
| Bona Fide | One-Attack | |
| Unseen-Attack | ||
| Presentation attack | One-Attack | |
| (type ) | Unseen-Attack |
11.4.4 Interclass comparison in the unseen-attack scenario
This study investigates the interclass comparison between explanations obtained using the models in the unseen-attack framework. In other words, it investigated the variability of the explanations between bona fide and presentation attack samples. To achieve the desired goal, the explanations obtained from the classification of each image, with the different models trained in the Unseen-Attack scenario, are compared in a pairwise manner. This comparison is performed for all images within each class.
By using the unseen-attack models it is possible to test the robustness of the models to the variability in the attacks present in the training and testing steps. Recall that a model resulting from unseen-attack is trained with attacks for .
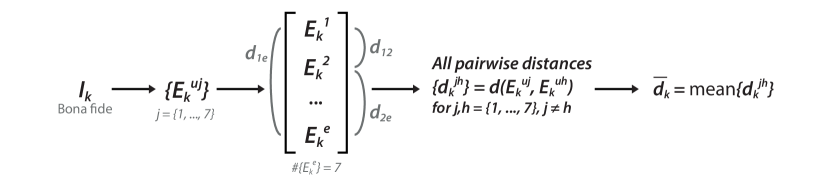
For a bona fide sample , the process to obtain the comparison of all explanations is illustrated in Fig. 11.5. It shows one example of how to obtain the pairwise distances given by: . Then the values in are averaged and is obtained for image . A global value is obtained averaging all these values, , as given by Eq. (11.6):
| (11.6) |
for each bona fide image , .
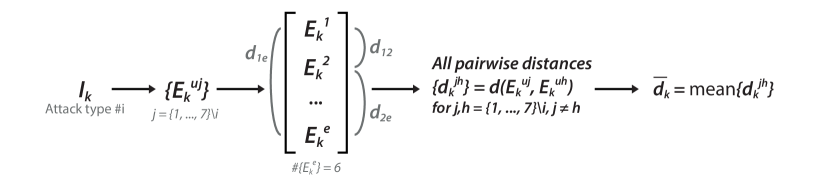
As for a presentation attack image (of type ), Fig. 11.6 shows the process to obtain the comparison between the explanations obtained for the models Unseen-Attack for . The figure shows one example, regarding image of type , on how to obtain the pairwise distances . The values in are averaged and is obtained for image . A global value is obtained averaging all these values, , as given by Eq. (11.7):
| (11.7) |
for each presentation attack image , , of type .
11.4.5 Intraclass comparison across different samples
One other property that a robust PAD solution should verify is that explanations should be similar for different samples with the same label. In other words, the explanations should reveal that the model looks for the same regions of the face even when the images are very different, since the ground-truth label is the same. This means the algorithm is coherent in its decisions and has effectively pinpointed the features that allow for accurate and stable detection of presentation attacks.
It is important to investigate the coherence of explanations for the bona fide samples, in order to understand if the considered PAD solution knows indeed what is a “real face”. However, it is also important to understand how much the explanations vary for presentation attack samples, so we can assess if our algorithm is indeed capable of generalising well to the multiple possible attack species.
This analysis can be performed by measuring how much the explanations for the models’ decisions are affected by variations in the types of presentation attacks known in the learning phase. In this work, this comparison is done by comparing features extracted from the explanations (using the FaceNet model described above) and not in a pixel-to-pixel manner, making it possible to compare the explanations obtained for different samples.
11.5 Results and Discussion
11.5.1 Performance of the face PAD algorithm
The main focus of this work was interpreting the decisions of a face PAD model to illustrate and motivate the application of interpretability to biometrics. Achieving improved face PAD results versus the state-of-the-art was not a priority. Nevertheless, one should not aim to interpret a model that lacks PAD abilities by design, as this will impair and bias the drawn conclusions. As such, the performance results of the implemented model in the one-attack and unseen-attack scenarios are presented in Table 11.3.
The results were generally inferior in the unseen-attack scenario when compared to the one-attack scenario, as expected given the considerably higher difficulty of the former scenario and the insight found in face PAD literature [384]. One reason for such results may be the large variability between the different PAI species found in the ROSE Youtu dataset. Hence, to obtain a truly robust PAD algorithm, the test set should always be composed of PAI species which have not been seen by the algorithm during training [132].
Attack , an upper face mask with eyes cropped out, is a good example of the implemented model’s difficulty to generalise. Although the results are acceptable in the one-attack scenario, the error rates are considerably higher in the unseen-attack scenario. Some exceptions can also be found, such as Attack (full face printed photo), for which both EER and APCER are actually lower in the unseen-attack scenario vs. one-attack. For this specific PAI species, the model is probably learning most of the needed features from various other paper-based attack types in the unseen-attack scenario, taking advantage of the greater availability of data despite the absence of Attack samples in the training.
| Attack | One-Attack | Unseen-Attack | ||||||
| EER | APCER | BPCER | EER | APCER | BPCER | |||
| 1 | 7.29 | 12.15 | 3.06 | 5.90 | 6.94 | 4.90 | ||
| 2 | 3.62 | 6.67 | 1.35 | 5.55 | 3.00 | 10.65 | ||
| 3 | 2.79 | 8.37 | 0.12 | 10.38 | 26.29 | 4.28 | ||
| 4 | 12.66 | 30.38 | 1.84 | 25.34 | 45.73 | 3.92 | ||
| 5 | 1.61 | 1.61 | 1.59 | 4.84 | 3.55 | 7.10 | ||
| 6 | 4.46 | 5.10 | 1.10 | 10.19 | 12.74 | 7.71 | ||
| 7 | 0.73 | 5.23 | 0.00 | 15.49 | 34.31 | 7.71 | ||
11.5.2 Comparison of explanations across different scenarios
11.5.2.1 Image average ()
One of the objectives of this work was to study the behaviour of the PAD models under varying data diversity in the training dataset. For an ideally robust PAD model, the same explanation should be obtained for a given bona fide image, regardless of the PAI species seen during the training stage. However, in reality, models are often sensitive to variations in the training data, both for bona fide and presentation attack samples.
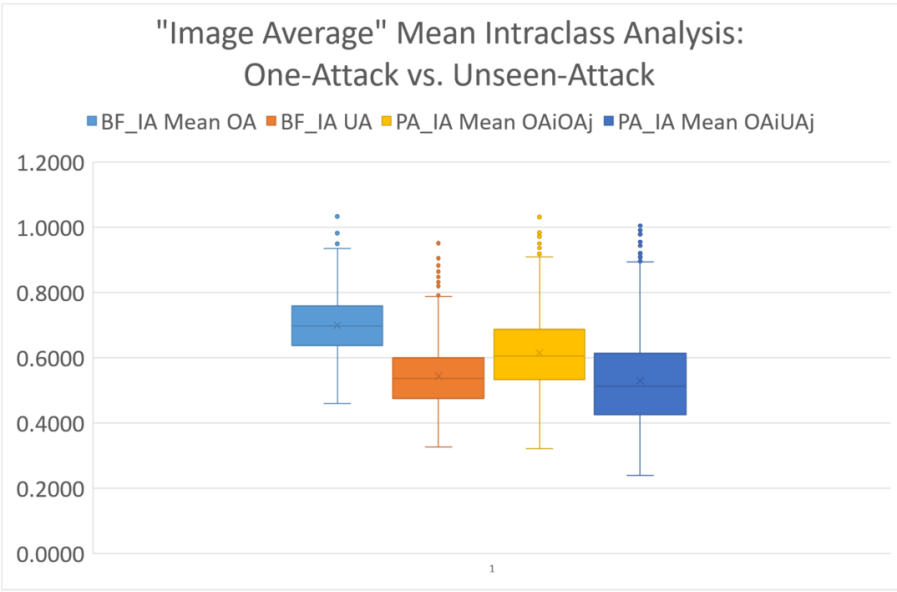
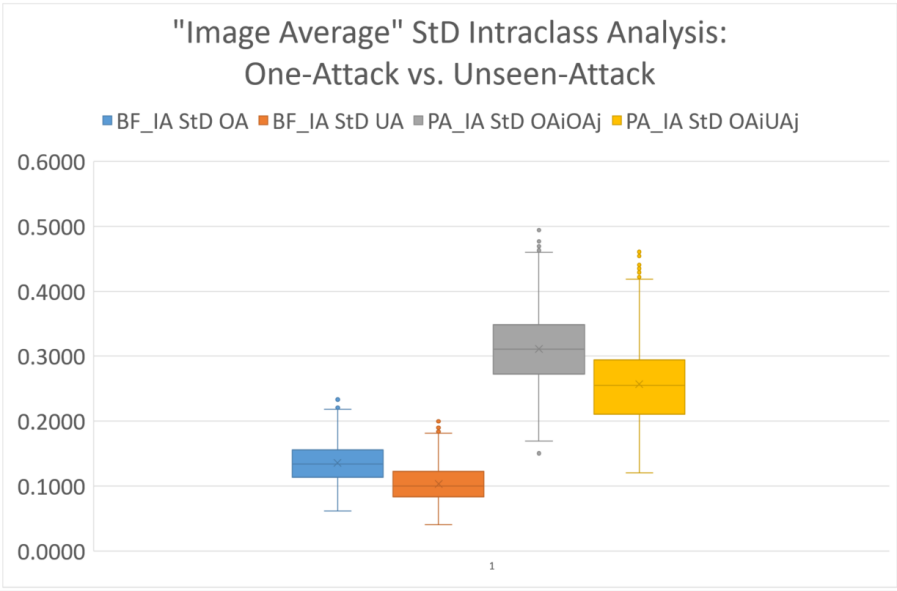
Fig. 11.7 presents the mean results () and respective standard deviation () of the Image average () experiments for bona fide (BF) and presentation attack (PA) samples across the one-attack (OA) and unseen-attack (UA) scenarios. These results show that intraclass variability is higher in the one-attack scenario, as indicated by higher values.
The values also show higher variability in one-attack, according to the results. This suggests that the models in the unseen-attack scenario are better able to generalise in the recognition of bona fide samples, since they see a wider variety of attacks during training. For the PA samples, the variability results also suggest the models are more robust when a wider diversity of attacks is available during training.
Fig. 11.8 and Fig. 11.9 show an example of a PA sample presenting a higher in the one-attack scenario when compared to unseen-attack. These results further support the idea that a model trained with more than one PAI species is able to learn better patterns and become a more robust model with better generalisation capabilities.
| Attack | One-Attack 1 | One-Attack 2 | One-Attack 3 |
 |
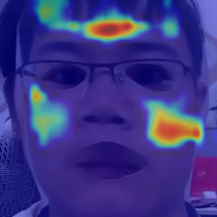 |
 |
 |
| One-Attack 5 | One-Attack 4 | One-Attack 6 | One-Attack 7 |
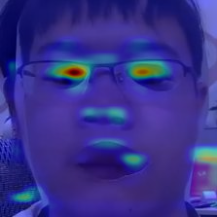 |
 |
 |
 |
| Attack | Unseen-Attack 1 | Unseen-Attack 2 | Unseen-Attack 3 |
|
 |
 |
 |
| One-Attack 5 | Unseen-Attack 4 | Unseen-Attack 6 | Unseen-Attack 7 |
|
 |
 |
 |
11.5.2.2 Attack average ()
The mean and standard deviation of the attack average results (respectively, and ) across the one-attack and unseen-attack scenarios for bona fide and presentation attack samples are presented in Fig. 11.10.
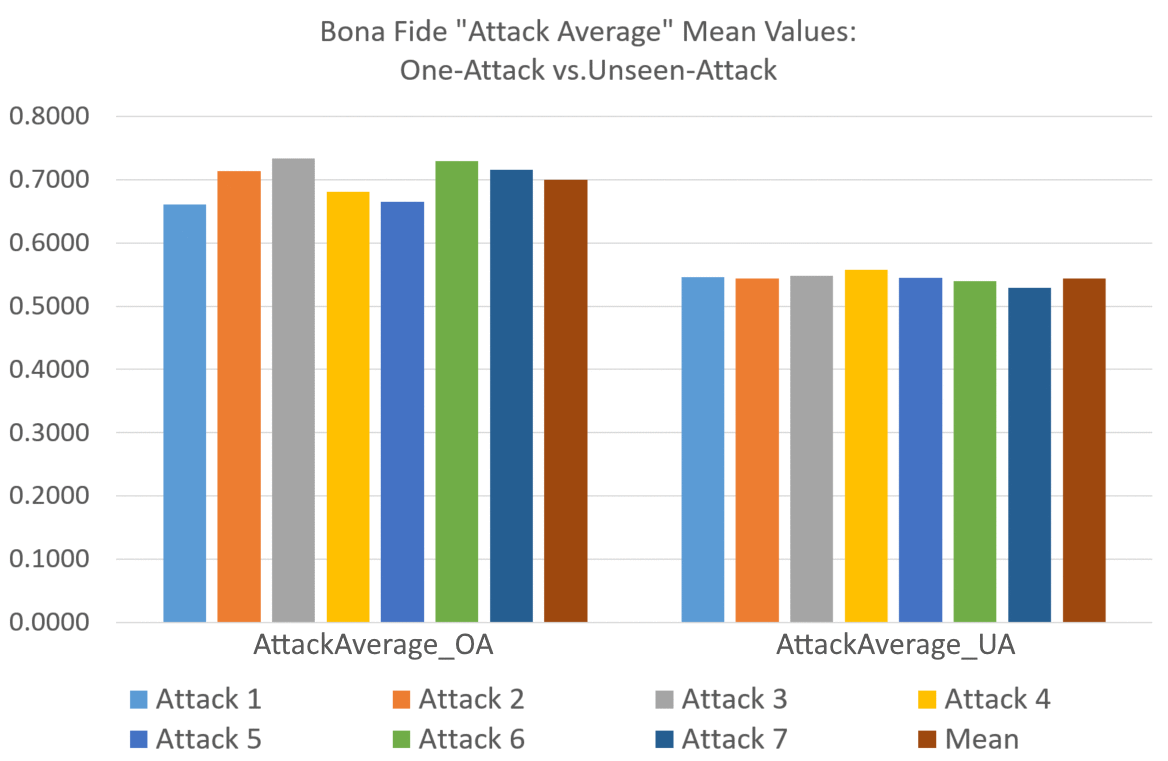
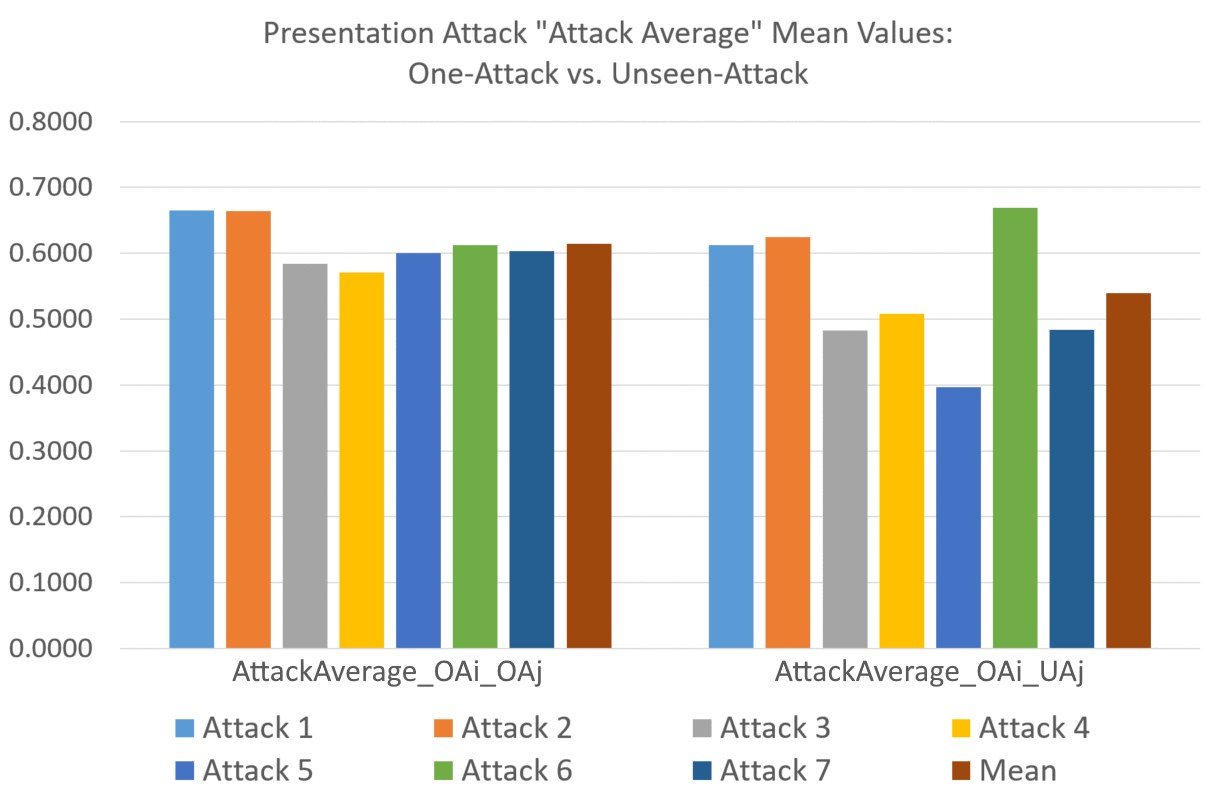
Similar to the results presented before, the results show higher variability in the one-attack scenario. This suggests once again that a training setup that integrates more than one PAI species may be more successful at promoting the learning of more coherent features for the bona fide class. The same is also verified for presentation attack samples, as the mean distance in the unseen-attack scenario is inferior to that in one-attack.
Since each PAI species contains intrinsic specificities, one could hypothesise that grouping multiple of them into a single class “presentation attack” would confuse the model and result in lesser robustness. Yet, the results indicate that the models used to detect them seem to benefit from the integration of more attacks during the training phase.
It is interesting to observe the variability for presentation attack samples across the different attacks in the unseen-attack scenario: although, in general, the values are inferior to those in the one-attack scenario, some specific attacks present much lower results than others. This may denote that differences (and similarities) between PAI species seen in training and evaluation lead to models that are much more sensitive to unseen PAI species in the testing phase.
In particular, in the presentation attack graphs in Fig. 11.10, Unseen-Attack, consisting of paper masks with eyes and mouth cut off, presents the lowest . This may result from the fact that, in this scenario, the model has seen multiple print-based PAI species (like complete photos, complete paper masks, and half paper masks) which help the model prepare for PAI species . The Unseen-Attack (consisting of upper-half face paper masks) presents a higher result since these samples combine skin and paper in the facial area and may be more difficult to learn from the PAI species seen during training.
11.5.3 Interclass comparison in the unseen-attack scenario
| Bona Fide | Unseen-Attack 1 | Unseen-Attack 2 | Unseen-Attack 3 |
 |
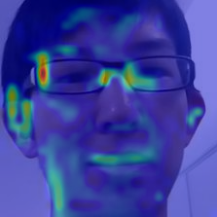 |
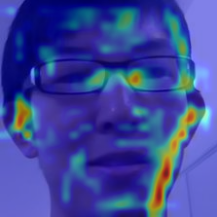 |
 |
| Unseen-Attack 4 | Unseen-Attack 5 | Unseen-Attack 6 | Unseen-Attack 7 |
 |
 |
 |
 |
| Attack | Unseen-Attack 1 | Unseen-Attack 3 | Unseen-Attack 4 |
 |
 |
 |
 |
| Unseen-Attack 5 | Unseen-Attack 6 | Unseen-Attack 7 | |
 |
 |
 |
This experiment aimed to quantify the variability of the explanations between bona fide and presentation attack samples. For the bona fide samples, a result of was obtained, by averaging the value of all bona fide images (, for ) obtained from a pairwise comparison of the explanations of all models in the unseen attack scenario. The associated standard deviation is . As for the presentation attack samples, a result of was obtained by averaging the value of all attack images (, for ) obtained from a pairwise comparison of the explanations of Unseen-Attack for models. The associated standard deviation is .
The obtained results are very similar and the standard deviation values are not only relatively high but similar for both sample classes. The similarity of the values does allude to any definitive comparative conclusion, but it does motivate further investigation. Fig. 11.11 and Fig. 11.12 depict examples of images whose pairwise distance results are close to the respective mean values and . A visual inspection allows us to conclude there is, in fact, considerable variability between explanations. Good examples of this are the Unseen-Attacks in comparison to in Fig. 11.11, and the Unseen-Attacks in comparison to ) in Fig. 11.12.
Nevertheless, despite the observed variability, in both types of samples there are certain regions of the images that are consistently used by all models to make their decisions. This may denote that, despite the variety of training conditions and the resulting noise found in the explanations, the model is generally able to pinpoint some regions of the face that correspond to the real underlying label information. This idea is verified when the pairwise distance is above the median values (see Fig. 11.13 and Fig. 11.14).
| Bona Fide | Unseen-Attack 1 | Unseen-Attack 2 | Unseen-Attack 3 |
 |
 |
 |
 |
| Unseen-Attack 4 | Unseen-Attack 5 | Unseen-Attack 6 | Unseen-Attack 7 |
 |
 |
 |
 |
| Attack | Unseen-Attack 1 | Unseen-Attack 2 | Unseen-Attack 3 |
 |
 |
 |
 |
| Unseen-Attack 4 | Unseen-Attack 5 | Unseen-Attack 6 | |
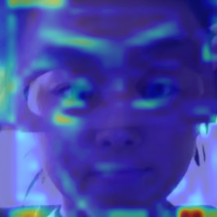 |
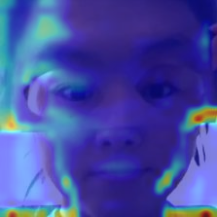 |
 |
Naturally, this rationale based on subjective visual evaluations is limited, but this is a result of the current unavailability of a ground-truth for what is a good or meaningful explanation. These are still muddy unexplored grounds that require further research into the combination of interpretability methods and human expert knowledge in the field of biometrics.
11.5.4 Intraclass comparison across different samples
The intraclass comparison experiment aimed to analyse an expected property of a robust and sound PAD solution: explanations for different samples of the same class should be similar. If true, this means the model learned to behave in a coherent manner, looking for the same regions in the images to reach the same decisions. The results of this experiment are presented in Fig. 11.15.
One can observe that the one-attack scenario (both for bona fide and presentation attack samples) leads to overall higher variability in explanations. This confirms the idea, brought up previously in this section, that a greater variety of PAI species in the training phase will result in models that are more robust and consistent in the information they use for their decisions.
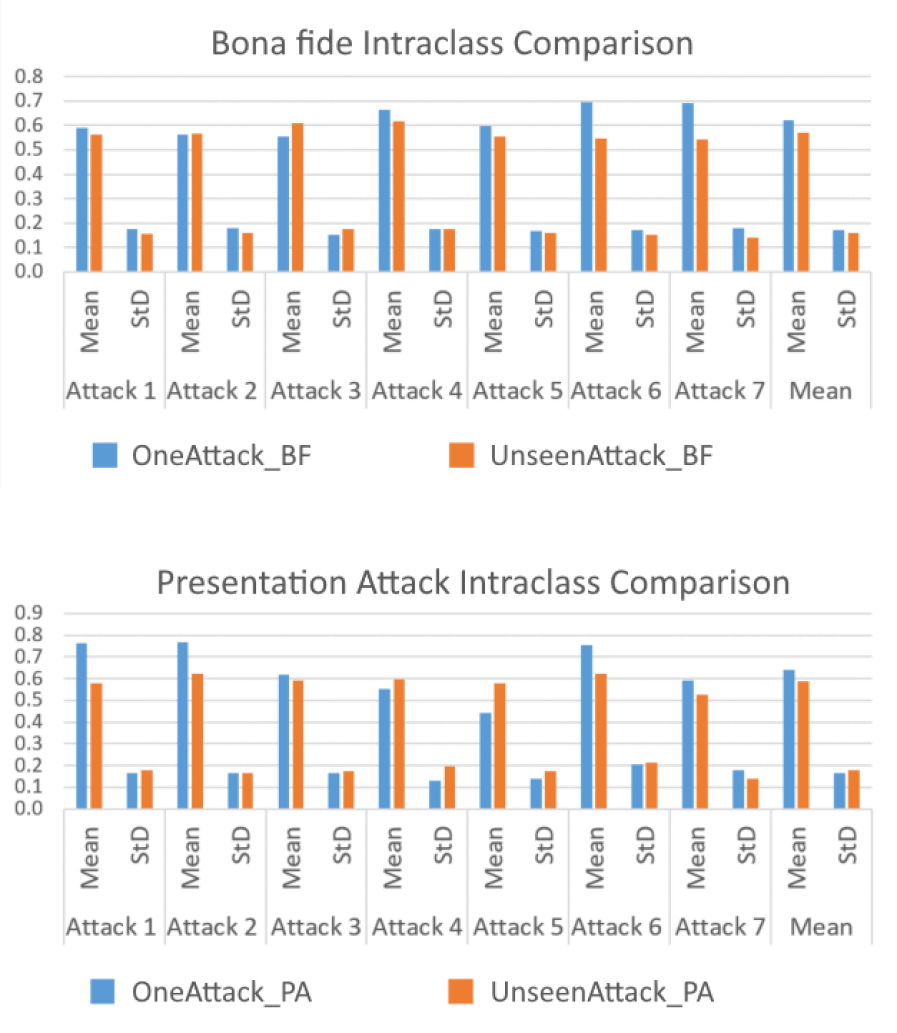
11.6 Summary and Conclusions
This study consisted of an analysis of the explanations produced for a face PAD model explored in different scenarios and settings. Both the standard one-attack and the more challenging unseen-attack scenarios were considered in this exploratory study. Additionally, intraclass and interclass experiments were also conducted to evaluate certain desirable properties of a robust and effective PAD solution.
Focusing on the intraclass comparison of explanations’ variability, it was possible to verify that the one-attack framework led to an increased mean distance value for both bona fide and presentation attack samples. This denotes that the presence of more attacks during training has a positive effect on the generalisation capabilities of the models, despite one-attack performance metrics being generally better than those in unseen-attack.
As for the interclass comparison of explanations, it was found that both classes exhibit similar levels of variability. Further analysis of bona fide and presentation attack samples has shown that, despite the wide variability in explanations, the models were generally able to pinpoint important regions of the face images that correspond to the true underlying labels.
Overall, this exploratory study illustrates the deeper level of insight that can be obtained when biometric studies are combined with interpretability. If one is to overcome the elusive nature of sophisticated deep learning models and move towards more transparent approaches, it is important that evaluation frameworks allow the assessment of the quality and comparison of explanations.
It is clear that there is still much to do. Regardless of the biometric task at hand, it may be very difficult to find a consensual definition of a “good” explanation, or what behaviours an ideal model should exhibit. According to Phillips and Przybocki [335], an explanation must describe how the system came to its conclusion and an “accurate” explanation (whatever that may mean) does not imply that a system provided the correct answer.
As such, the major open challenge is for the biometrics community to evolve from established evaluation metrics based on decision accuracy to novel explanation-based performance metrics. This work took one step forward in this direction. However, improving objectivity by combining subjective but knowledgeable opinions from several experts is essential to consolidate interpretability and thus enable more meaningful performance analysis on biometrics. Additionally, further efforts should be devoted to investigating the integration of the explanations on the training itself as a regularisation method to guide models through the learning of more meaningful features.
Part IV Wellbeing Monitoring
Chapter 12 Emotion Valence
Classification in the Wild
12.1 Context and Motivation
Emotion recognition is a fast-growing research topic, due to its potential for enhanced human-computer interfaces and automatic services that immediately respond to the emotions of the user or client [131]. Horror videogames that adapt the gameplay and sound effects based on the player’s fear, as well as autonomous vehicles that adapt the travel experience based on the occupants’ emotions, are only two of the endless innovations attainable through emotion recognition [294].
State-of-the-art methods for emotion recognition are mainly based on facial expressions, and important hurdles have been overcome in this field [294, 131]. Group-level emotion is a fairly uncharted research topic that extends the analysis to the emotional state displayed by a group of people as a whole [425]. While there are several challenges in individual emotion recognition, approaches for group emotion recognition also need to deal with the variety of emotions, their valence, and arousal levels, that can differ among members of the same group. This topic was the focus of the EmotiW 2020 [101] sub-challenge that motivated this work. The scarce data and the difficulty in obtaining annotations is the reason why few have addressed this topic [415, 456, 159], and why current approaches still offer low accuracy levels.
The task of group emotion recognition shares some similarities with the recognition of human activity based on the video. Unlike the former, the latter boasts several large and thoroughly labelled datasets, such as the Kinetics [65] or the ActivityNet [169], even when restricting to data focused on groups rather than on individuals. These larger sets of available data have allowed for the development of very robust and high-performing algorithms, such as the I3D [65], the SlowFast networks [127], or the stagNet [354].
While methods based on visual information compose most of the literature, some works discuss the advantages of including additional sources of information, especially audio [214, 85, 258, 453]. Specifically, it has been shown that using audio complements some of the flaws of video-based recognition [214], despite offering subpar accuracy results when in a unimodal recognition system. These results have confirmed the advantages of combining audio information with a strong method for video-based recognition.
This work explores the novel application of inflated convolutional neural networks (CNN) to classify emotion valence at the group level in videos. The network uses weights pretrained for activity recognition, to take advantage of the greater availability of data to boost performance on our target task. We also study the use of audio for improved performance, through score-level fusion, with a Bi-LSTM network receiving spectral features. Throughout the experiments, we assess the performance of the proposed method for multimodal and unimodal classification, analyse its behaviour in different scenarios, and compare it directly with the EmotiW 2020 sub-challenge official baseline.
12.2 Methodology
12.2.1 General overview
The proposed algorithm is composed of three modules: a video-based emotion recognition model, an audio-based emotion recognition model, and a multimodal fusion module (see Fig. 12.1). Video and audio-based emotion recognition modules are trained independently, while the fusion module, based on a multiclass SVM receives the softmax scores provided by the other two. Thus, the proposed method consists of a pipeline that relies on late audio-video fusion, at the score level, using a multi-class SVM emotion recognition classifier.
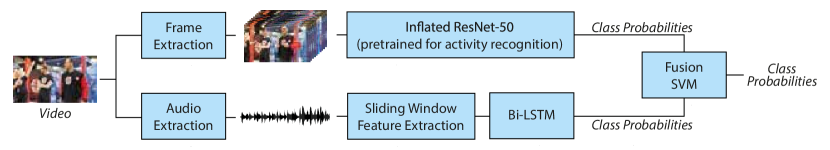
12.2.2 Video-based emotion recognition
The video-based emotion recognition module is based on an inflated bidimensional (2D) convolutional neural network (CNN), similar to I3D [65], the state-of-the-art in activity recognition. The model is an end-to-end network: it receives frames extracted from a video, ordered and concatenated over a time dimension, and returns class probabilities for that video. The architecture of the network follows the structure of a ResNet-50 (see Fig. 12.2), proposed by He et al. [167], whose name stands for residual networks. The shortcut connections that perform identity mapping on each residual learning block enable the stable training of models with more convolutional layers, resulting in deeper representations of the input data.
The inflated ResNet-50 consists of a bidimensional ResNet-50 model where the convolutional filters and layers have been converted into 3D. This allows them to process several frames simultaneously as a single input. Downsampling operation before the first block of each type enables learning multi-resolution features. This model has been pretrained111Multi-Moments in Time models. Available at: https://github.com/zhoubolei/moments_models. to discriminate between activity classes on the Multi-Moments In Time database [300]. To offer probability outputs for each of the three group-level emotion valence classes, the last fully-connected layer of this network is replaced by a three-neuron fully-connected layer, followed by softmax activation, trained on the EmotiW 2020 sub-challenge train dataset.
12.2.3 Audio-based emotion recognition
The audio-based recognition module (see Fig. 12.1) is composed of two main processes: feature extraction on sliding windows, and a Bi-LSTM recognition model. Audio features were extracted using pyAudioAnalysis222pyAudioAnalysis. Available at: https://github.com/tyiannak/pyAudioAnalysis. which contains an off-the-shelf feature set with 34 available features, including signal zero-crossing rate, signal energy, entropy of energy, spectral centroid, spectral spread, spectral entropy, spectral flux, spectral roll-off, mel-frequency cepstral coefficients (MFCC), chroma vector, and chroma deviation. All these features are extracted over sliding windows of milliseconds with a time step of milliseconds.
The features are received by a Bi-LSTM model with local attention that returns the class probabilities for the respective audio (see Fig. 12.3), adapted from [296]. Its weighted-pooling strategy enables the focus on the specific sound parts which contain strong emotional characteristics, controlled by an attention function trained simultaneously with the Bi-LSTM model.
12.2.4 Score-level ensemble
The softmax scores obtained by both video and audio-based emotion recognition models are then concatenated in a feature vector, composed of six class probability values. This vector is then given to a multi-class SVM classifier, which combines the separate audio and video predictions into a single decision.
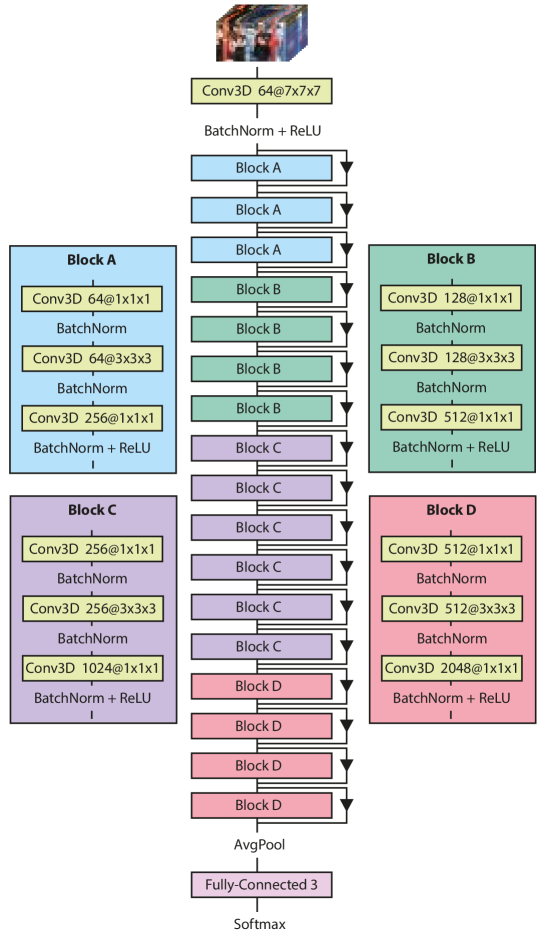
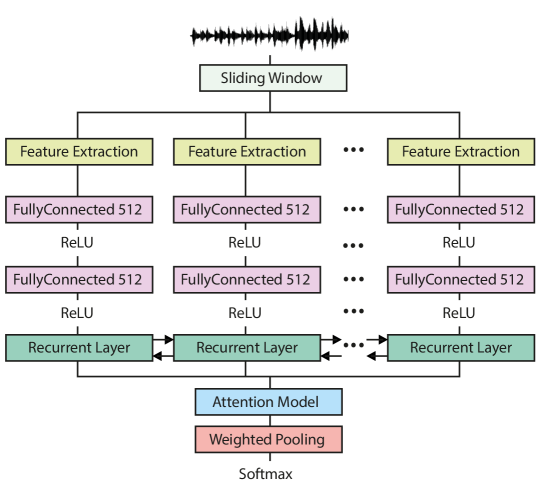
12.3 Experimental Setup
12.3.1 Data
All the experiments were conducted on an adapted version of the “Video-level Group AFfect” (VGAF) dataset [388] for the EmotiW 2020 AV Group-level sub-challenge [101]. The VGAF is a video-based database that contains labels for emotion and cohesion. The data was collected from the YouTube platform and consists of videos under the creative commons license (CC0) and present keywords that correspond to the range of emotions and cohesion.
Since the number of individuals per video is variable, and the groups on each video can also present a varying number of persons over time, the videos have been divided so that each video clip has always the same number of persons per frame. Each VGAF clip was manually labelled by different annotators for emotion and cohesion and every annotator was informed of the basic concepts of emotion and cohesion. Only videos with mutual consensus were kept in the final database. The labels for group emotion are related to emotion valence (i.e., positive, neutral, and negative) whereas the group cohesion labels are in the range , being the state of very low cohesion (dominance over the group members) and the state of very high cohesion.
For the EmotiW 2020 AV Group-Level Emotion sub-challenge, the task was the classification of group emotion. The VGAF dataset videos were divided into five-second videos: for the train, for the validation, and for the test. Each video (except those in the test set) is accompanied by a discrete group emotion valence ground-truth label. In the training dataset, there are positive videos, neutral videos, and negative videos. In the validation set, there are positive videos, neutral videos, and negative videos.
12.3.2 Baseline algorithm
The baseline algorithm is the audiovisual group-level emotion recognition sub-challenge baseline [388] of the EmotiW 2020 Grand Challenge. This method is composed of two streams, for audio and video data processing, fused at the feature level. The video stream is a pretrained Inception V3 network that separately processes frames extracted from a video. The extracted features are combined using a long short-term memory (LSTM) network. The audio stream is composed of a fully-connected network that receives OpenSMILE [117] features extracted from the audio. The outputs from the video and audio streams are concatenated and used by a fully-connected layer to offer two outputs: the probabilities for the three emotion valence classes and an emotion cohesion value on the range.
12.3.3 Preprocessing
The videos on the EmotiW 2020 AV Group-level Emotion sub-challenge were subject to preprocessing before being used by the proposed method. For each five-second video, ten frames were extracted, thus resulting in 2 frames per second. This is an adaptation from the original model pretrained on the Multi-Moments In Time database (MMIT), which worked at 5 frames per second. We found that reducing the frame rate did not harm performance and sped up the recognition process. Before being used on the audio-based recognition module, the audio was extracted from each file by converting them (originally in the MP4 format) to audio files (in the WAV format). Regarding audio, we noticed that after feature extraction some of the generated features could assume non-number values. For training purposes, we removed these samples and trained only with valid ones. For inference during validation/test, we replaced non-number values with zero.
12.3.4 Training
The audio-based recognition module was trained from scratch333Audio submodule code adapted from: https://github.com/RayanWang/Speech_emotion_recognition_BLSTM.. The weights were randomly initialised, and the model was trained over a maximum of epochs, with a batch size of , categorical-cross-entropy as the loss function, and using the Adam optimiser with an initial learning rate of . To prevent overfitting, we used dropout and early-stopping with a patience value of 15 epochs.
The video-based recognition module, pretrained on the MMIT database, was adapted to output probabilities for each of the three valence classes in group emotion recognition. This was achieved by replacing the last fully-connected layer with a new one, with three neurons.
Since this layer needs to be trained, all weights of the network have been frozen (except those of this layer). The network was briefly fine-tuned until convergence over a maximum of epochs, with batch size , using the Adam optimiser with an initial learning rate of .
When training the audio-based module and the video-based module the hyperparameters have been selected empirically, to maximise performance in the validation set. The hyperparameters for the fusion module (e.g., the regularisation parameter “C”, the kernel, or the polynomial degree of the kernel) were found through a grid search. Once the optimal hyperparameters were found, the train and validation set were combined to make a “full train” set, and thus take full advantage of all available labelled data for better performance in the test set.
12.3.5 Experiments
In this work, the aim is not only to assess the proposed method’s performance for group-level emotion recognition but also to examine its behaviour in several conditions.
We use the accuracy metric and confusion matrices to examine the overall performance of the method and also analyse its class-wise accuracy. The performances of the multimodal method and its audio and video-based modules, separately, are evaluated in both the validation set (with available ground-truth labels) and the test set (accuracy values delivered by the EmotiW 2020 sub-challenge organisation upon request). The performance is compared with the official sub-challenge baseline, following the results reported in [388].
The performance is also evaluated according to the number of people in the video. Since the number of people in each video is not included, we use the MTCNN method [482] on each frame of each video, and infer the group size based on the average number of detected faces: a group with less than five detected faces are considered small (total of videos on the validation set), otherwise, it is considered a large group ( videos on the validation set). With this, we aim to evaluate the difficulties associated with recognising emotion in large groups, where cohesion is likely to be generally lower.
12.4 Results and Discussion
The performance results of the proposed method, and the comparison with the official sub-challenge baseline, on the validation and test sets, is presented, respectively, in Table 12.1 and Table 12.2.
On the validation set, the performance offered by the proposed multimodal method is superior to the baseline. The accuracy attained by the video-only approach is close to that offered by the multimodal method, over . This is evidence of the advantages of using pretrained networks (in this case, transferred from the task of human activity recognition). The audio-only approach offers considerably lower performance () than the audio-only baseline (), which indicates the use of OpenSMILE features and fully-connected networks may be better fitted for group emotion recognition based on audio.
| Method | Accuracy | |||
| Overall | Positive | Neutral | Negative | |
| Proposed (A) | 47.19 | 19.93 | 69.64 | 57.61 |
| Proposed (V) | 62.40 | 69.20 | 52.50 | 66.30 |
| Proposed (A+V) | 61.83 | 58.13 | 61.78 | 67.93 |
| Baseline (A) | 50.23 | - | - | - |
| Baseline (V) | 52.09 | - | - | - |
| Baseline (A+V) | 50.23 | - | - | - |
| Method | Accuracy | |||
| Overall | Positive | Neutral | Negative | |
| Proposed (V) | 58.86 | 55.76 | 57.93 | 63.04 |
| Proposed (A+V) | 65.74 | 54.38 | 77.99 | 60.00 |
| Baseline (V) | 42.00 | - | - | - |
| Baseline (A+V) | 47.88 | 45.00 | 10.00 | 70.00 |
From the validation to the test set (Table 12.2), the official video-only baseline suffers a sharp performance decay (from to accuracy), which is also felt with the proposed video-only approach (albeit not as dramatic, from to accuracy). Fusing with audio on a multimodal approach reduced that decrease in the case of the official baseline (from to accuracy), and even reversed it in the case of the proposed method (from to accuracy). This confirms the idea present in the literature that, while audio alone is not suitable for recognition, it offers additional information that is essential for the robustness and accuracy of the method.
| Predicted Class | |||
| True Class | Positive | Neutral | Negative |
| Positive | 60 | 139 | 102 |
| Neutral | 35 | 195 | 50 |
| Negative | 24 | 54 | 106 |
| Predicted Class | |||
| True Class | Positive | Neutral | Negative |
| Positive | 209 | 59 | 34 |
| Neutral | 98 | 147 | 35 |
| Negative | 44 | 18 | 122 |
| Predicted Class | |||
| True Class | Positive | Neutral | Negative |
| Positive | 175 | 99 | 27 |
| Neutral | 78 | 173 | 29 |
| Negative | 27 | 32 | 125 |
Analysing the class-wise accuracies and the confusion matrices (Table 12.3, Table 12.4, and Table 12.5), one can notice that video is, overall, the best modality to recognise emotions. The advantages of using video rely mainly on the “extreme” classes, positive and negative, which denote visual information is more advantageous to recognise strong group emotions. The proposed audio-only approach attains very poor accuracy in the positive class.
Since the positive class is the minority class in the training dataset, the results of the audio-only approach may partially be explained by this slight class imbalance. However, as mentioned before, the video-only approach does not verify this, which is fortunate when combining both approaches into the multimodal proposed method. Using both modalities slightly decreases the accuracy of positive and negative videos, when compared with the video-only approach, but takes advantage of the audio information to considerably improve accuracy on neutral videos and achieve overall better performance.
At last, the results of the group size study are presented in Table 12.6. In both audio and video-only approaches, as well as the multimodal method, the recognition performance is higher in smaller groups. The performance values should serve as a rough reference, since the process of face detection may present errors, and the number of faces may not accurately describe the number of people in the video’s group (which may include occluded faces or people facing the opposite direction of the camera).
Nevertheless, the performance differences are considerable and show expected behaviour: it should be harder for larger groups to consistently show the same emotion than smaller groups. Hence, emotion cohesion should be higher, on average, for smaller groups, and thus the certainty of the algorithms when recognising the emotion valence. This could perhaps be addressed using hierarchical methodologies (from individual-level to group-level) as used in current group activity recognition approaches (discussed in the related work section).
| Method | Group Size | |
| Proposed (A) | 48.61 | 44.49 |
| Proposed (V) | 66.33 | 54.92 |
| Proposed (A+V) | 65.74 | 54.37 |


Through an analysis of some videos where the proposed model failed, a pattern emerged. While there are certain videos where the error was evident, there are several examples where it is very difficult to notice that an apparently neutral scene displays, in fact, a positive or negative group emotion.
Some examples are shown in Fig. 12.4. On the top left, is a short video of a calm conversation on a TV show that is labelled as positive. On the top right, is a negative emotion video that the proposed method classified as positive, since the video only covers the moment before the boy being bullied started crying. On the bottom left, a conference presentation that the method classified as neutral since the positive ground-truth emotion could only be verified by facial expressions. On the bottom right, a conversation is deemed neutral by the proposed method, where only a closer inspection of the audio shows that it is, in fact, part of a protest or a similar confrontation.
Although the information about the underlying ground-truth labels is indeed present in these example videos, it is hidden in contextual clues, expressions in small faces, or the content of conversations. Exploring ways to integrate these aspects into the recognition of group-level emotion could be the way to avoid the most common mistakes of the proposed method, and ultimately achieve better overall performance and robustness.
12.5 Summary and Conclusions
In this work we proposed a novel method for the automatic recognition of group emotion that uses a late-fusion multimodal approach, combining scores from both video and audio-based emotion recognition models that are used to feed a multiclass SVM that returns a final class probability. This method showed significant improvement against the baseline, confirming that the use of acquired knowledge from activity recognition is useful for group-emotion recognition and that the joint utilisation of audio and video benefits the learning of the model.
On the other hand, taking into account the maximum accuracy value, we believe that there is still room for further improvements. Further efforts should be devoted to the study of the links between the tasks of activity recognition and emotion recognition, especially at the group level. Approaches for abnormal behaviour recognition through video anomaly detection, such as [23], could offer meaningful improvements in the automatic distinction between positive and negative emotions. Also, this method could benefit from OpenSMILE features in the audio-based emotion recognition module, the development of multimodal approaches that are based on early-fusion (e.g., input or intermediate-layer levels), and the design of a “fully” end-to-end network that receives both video and audio as input and learns the relevant features for the classification task (e.g., through regularisation methods such as loss functions with different terms and weights).
Chapter 13 Activity and Violence
Recognition in Shared Vehicles
13.1 Context and Motivation
Human action or activity recognition is a vibrant and challenging research topic. Being able to recognise actions automatically is game-changing and often crucial for several industries, including the scenario of shared autonomous vehicles. Without a driver responsible for the vehicle’s and occupant’s security and integrity, it falls upon automatic recognition systems to monitor passenger well-being and actions, and eventually recognise harmful behaviours or even violence [23]. However, the wide range of possible actions that can be portrayed, the variability in the way different individuals portray the same actions, the heterogeneity of sensors and the type of information captured and the influence of external factors still pose significant hurdles to this task.
Despite all the above-mentioned challenges, the topic of action recognition has thrived by following a very recognisable recipe for success. As in plenty of other pattern recognition tasks, the state-of-the-art gradually evolved towards larger and more sophisticated models based on deep learning methodologies [65, 127, 354]. These have achieved increasingly higher accuracy thanks to a growing number of massive databases typically using public video data gathered through online sourcing, such as Kinetics [65], Multi-Moments in Time (MMIT) [300], or ActivityNet [169]. This also means most research in action recognition is based on visual information (images or video). This is the case of the I3D [65], the methodology currently deemed the state-of-the-art in this topic. In fact, I3D goes further beyond simple visual spatial information by adopting a two-stream approach, including optical flow for temporal action encoding. Other approaches have explored recurrent networks for the same purpose [226, 330, 175], but have seldom managed to reach the accuracy level offered by the I3D method.
Despite the meaningful strides brought by such sophisticated methods and large databases, some limitations can be observed. On the one hand, the general nature of the data sourced to train and evaluate the state-of-the-art models lead to overly general results that may not be verified in more specific scenarios, such as in-vehicle passenger monitoring. On the other hand, hefty models based on visual information and optical flow (such as I3D) may offer very high accuracy, but their complexity does not allow for real-time applications in inexpensive limited hardware, such as embedded devices.
This work proposes a set of changes to the state-of-the-art I3D method to bring it closer to real applicability in edge computing scenarios: in this case, we focus on action recognition and violence detection in shared autonomous vehicles. First, inspired by [346], the current work discards the time-consuming optical flow component of I3D and introduces a lightweight model for action recognition with audio. Despite being less frequently used than video, audio is considered one of the most promising options for a multimodal system for action recognition [214, 85, 258]. This way, we obtain a simpler methodology that can use both video and audio modalities for a greater variety of information. Then, as each modality is likely to contribute differently to the recognition of each action, we propose a cascade strategy based on confidence score thresholding. This strategy allows a simplification of the multimodal pipeline by using only one (primary) modality as often as possible; the two modalities are used together only when the primary one is not enough for sufficiently confident predictions. Hence, it is possible to attain significant time and computing energy savings without overlooking classification accuracy.
This chapter is organised as follows: beyond this introduction, a description of the proposed multimodal methodology and cascade strategy is presented in section 13.2; the experimental setup is detailed in section 13.3; section 13.4 presents and discusses the obtained results; and the conclusions drawn from this work are presented in section 13.5.
13.2 Methodology
13.2.1 Multimodal pipeline
The baseline consists of a multimodal pipeline for activity recognition based on an audio-visual module previously proposed for group emotion recognition [346]. The pipeline is composed of three submodules (as illustrated in Fig. 13.1): the visual submodule, which processes visual data; the audio submodule, which processes sound data; and the fusion submodule, which combines individual decisions from the previous two submodules into joint multimodal classifications. The specific structures of each of these submodules are described below.
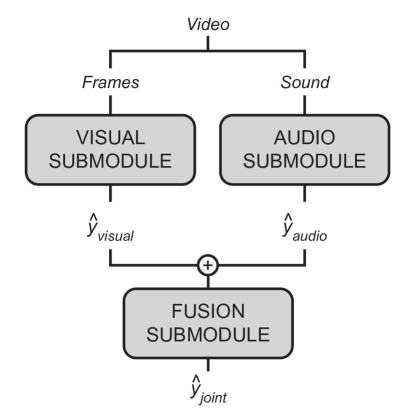
13.2.1.1 Visual submodule
As in [346], the visual submodule is based on an inflated ResNet-50 [167] using pretrained weights for the Multi-Moments in Time (MMIT) activity recognition database [300]. Using an inflated ResNet-50 ensures optimal performance by following the successful example of the state-of-the-art I3D method [65]. Using model weights pretrained on the large MMIT database allows us to transfer deeper and more general knowledge to our narrower task of activity recognition inside vehicles.
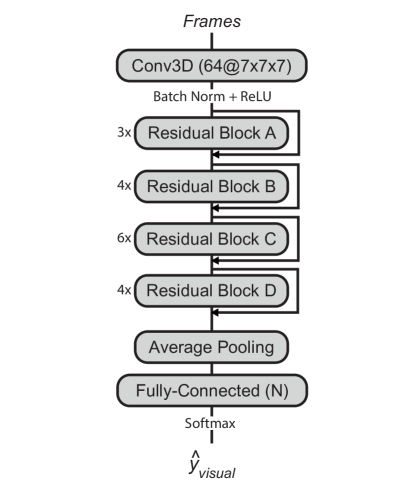
The inflated ResNet-50 model (see Fig. 13.2) is composed of seventeen residual blocks, each including three 3D convolutional layers with to filters, batch normalisation and ReLU activation. Downsampling at each block allows the model to capture important information at different levels of resolution. After an average pooling layer, the last fully-connected layer, followed by a softmax activation function, offers probability scores for each of the considered activity labels.
13.2.1.2 Audio submodule
The audio submodule consists of a simple network based on a bi-directional long short-term memory (LSTM) model. These are known for their ability to encode temporal information, important for audio-related topics, and have been previously successful for tasks such as group emotion valence recognition [346] or speech-based sentiment analysis [296].
Unlike the visual submodule, which largely follows the method proposed in [346] to approach the state-of-the-art performance of I3D, the audio submodule was reformulated. In the aforementioned work, the audio Bi-LSTM model received a set of cepstral, frequency, and energy handcrafted features extracted from each signal window. Moreover, it included multiple convolutional layers with filters each and an attention mechanism after the LSTM layer. In this work, we design a streamlined and faster audio submodule.
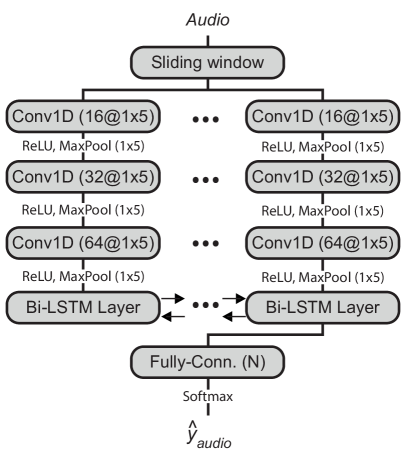
The simplified and lighter Bi-LSTM model (see Fig. 13.3), with less trainable parameters, receives a raw audio signal divided into ms windows with ms overlap, without any preceding process of feature extraction. Each window is processed by three convolutional layers (with , , and filters, respectively, stride , and padding ), each followed by ReLU activation and max-pooling (with pooling size ). A Bi-LSTM layer receives features from the convolutional part for each window, and its output for the last window is sent to a fully-connected layer for classification (with neurons, one for each activity class, followed by softmax activation). In section 13.4, we analyse the advantages of using the proposed audio submodule vs. the one in [346].
13.2.1.3 Fusion submodule
The aforedescribed visual and audio submodules output their respective sets of class probability predictions for a given video. To combine the two separate sets of predictions for each task into a single audio-visual multimodal classification, the fusion submodule is used.
The fusion submodule is composed of a simple support vector machine (SVM) classifier. This classifier receives the probability score sets from the two previous submodules concatenated as a single unidimensional feature vector. The SVM model is trained to use these probability sets to output a joint class prediction for the respective video.
13.2.2 Cascade strategy
In the multimodal pipeline described above, all submodules are used for each instance (video) that needs to be classified. This means that regardless of the difficulty of a given video or the activity portrayed, both visual and sound data are always processed, resulting in two sets of unimodal class predictions which are then combined into a set of multimodal class probabilities.
Given the considerable complexity of both the residual-network-based visual submodule and the Bi-LSTM-based audio submodule, this multimodal pipeline is arguably too heavy for the target application. This is especially true considering, as observed in [346], that different classes may benefit much more from one of the modalities and thus not need the other one. Hence, we design a cascade strategy to explore the possibility of using just one of the modalities and “turning off” the remaining two submodules as often as possible. This aimed to achieve improved processing times and energy usage, offering an alternative or complement to model compression strategies.
In the proposed cascade strategy, one of the data modalities (visual or audio) is selected as the “primary” modality and, as such, the corresponding submodule is always used to offer a starting prediction. The probability score offered for the predicted class is considered a “confidence score”: a measure of how confident the primary submodule is in the prediction it provided. If the confidence score is above a specific confidence threshold , the remaining modules remain unused, and the primary submodule predictions are considered final. However, if the aforementioned condition is not verified, the secondary submodule is called to offer additional information for more confident predictions, which are then combined into a single multimodal prediction (just like the original multimodal pipeline).
The performance benefits of such a strategy are intimately related to the defined confidence threshold. If is too high, most of the instances will use both data sources, thus retaining the accuracy offered by the parallel pipeline but reaping very few benefits related to complexity or processing time. Conversely, if is too low, most instances will be classified using only the primary submodule, which may result in heavily impacted accuracy, despite the complexity benefits of the simplified pipeline. Section 13.4 includes thorough experimental results on the impact of the confidence score on the accuracy and processing requirements of the pipeline for activity classification.
13.3 Experimental Setup
13.3.1 Databases
For generic scenarios, this work used the Multi-Moments in Time (MMIT) database [300], made available by the creators upon request. The MMIT database includes a total of videos, split between a training set ( videos) and a validation set ( videos). These correspond to a total of 339 classes, describing the main activity verified in each video. From those classes, only those related to the target scenario of in-vehicle passenger monitoring were included. This resulted in a subset of twenty-one classes: fighting/attacking, punching, pushing, sitting, sleeping, coughing, singing, speaking, discussing, pulling, slapping, hugging, kissing, reading, telephoning, studying, socialising, resting, celebrating, laughing, and eating. Train and test divisions use the official predefined MMIT dataset splits.
For the in-vehicle scenario, a private dataset was used. The dataset includes a total of videos of the back seat of a car occupied by one or two passengers (see example frames in Fig. 13.4). Videos are acquired using a fish-eye camera to capture most of the interior of the car and microphones to acquire sound data. Each video includes annotations for forty-two action classes: “entering”, “leaving”, “buckle on/off”, “turning head”, “lay down”, “sleeping”, “stretching”, “changing seats”, “changing clothes”, “reading”, “use mobile phone”, “making a call”, “posing”, “waving hand”, “drinking”, “eating”, “singing”, “pick up item”, “come closer”, “handshaking”, “talking”, “dancing”, “finger-pointing”, “leaning forward”, “tickling”, “hugging”, “kissing”, “elbowing”, “provocate”, “pushing”, “protecting oneself”, “stealing”, “screaming”, “pulling”, “arguing”, “grabbing”, “touching (sexual harassment)”, “slapping”, “punching”, “strangling”, “fighting”, and “threatening with weapon”. Videos are randomly drawn into the train dataset () or the test dataset ().
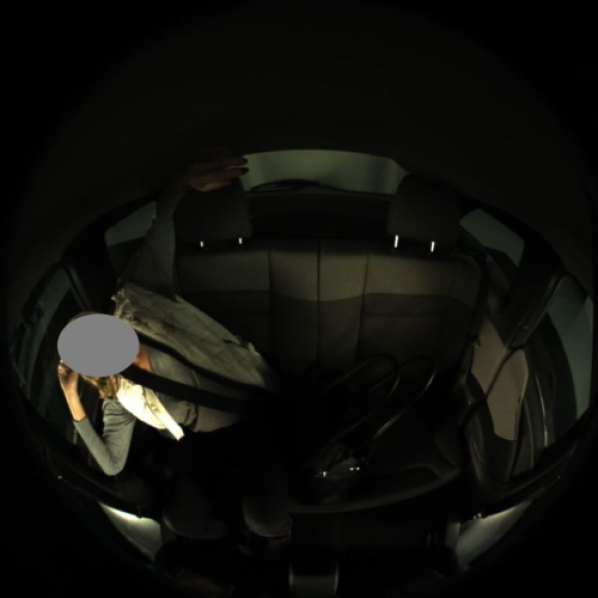
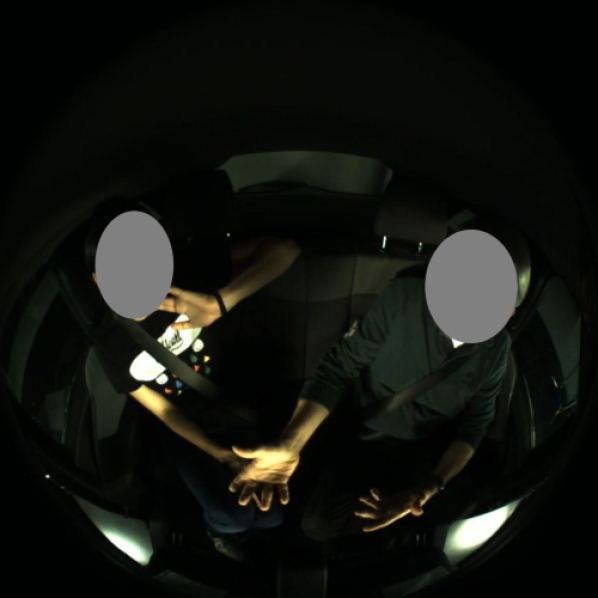
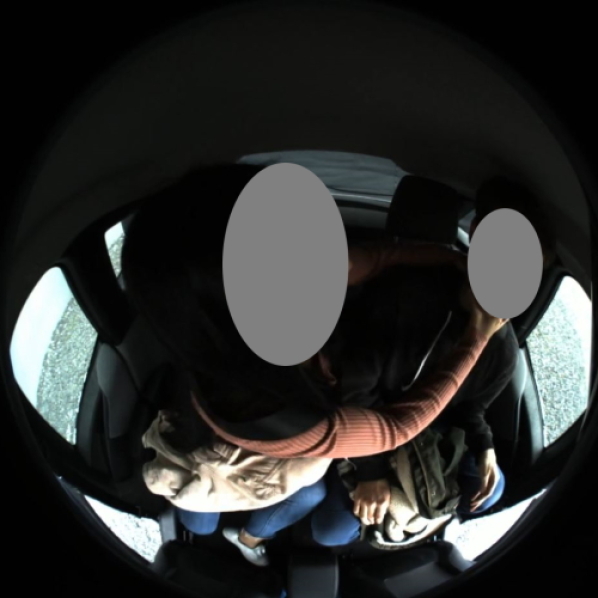
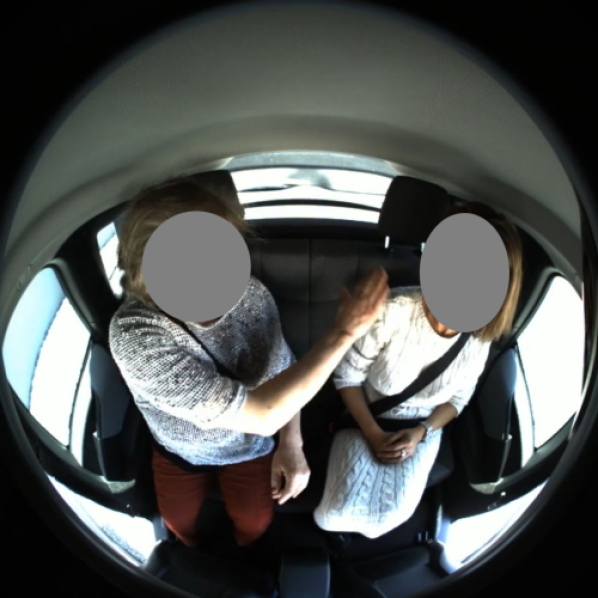
13.3.2 Data preprocessing
A total of frames, evenly spaced, was extracted from each video in the MMIT selected data subset (each with about 5 sec). These frames were concatenated over a third dimension following their temporal order to serve as input to the visual submodule. Two seconds of audio were extracted from each video and normalised to kHz sampling frequency to serve as input to the audio submodule.
For the in-vehicle dataset, each video can have multiple labels (the passengers portray different actions over the course of each acquisition). As such, each video period labelled as one of the 42 classes, is divided into two-second long individual samples. From each of these, 8 frames are extracted, resized and cropped into squares, and concatenated over a third dimension to be used by the visual submodule, and the corresponding audio is resampled to kHz to be used by the audio submodule.
In the specific scenario of in-vehicle violence recognition, the aforementioned forty-two classes of the in-vehicle dataset have been clustered into three classes: normal car usage (from ‘entering’ to ‘pick up item’, in order of appearance), normal interactions (from ‘come closer’ to ‘kissing’), and violence (from ‘elbowing’ to ‘threatening with weapon’).
13.3.3 Model training
The inflated ResNet-50 model used on the visual submodule uses the official pretrained weights from the MMIT database. Given that it was pretrained on the same database used in the laboratory experiments, this work took full advantage of this by setting most of the parameters of the network as non-trainable. The only parameters that were trained are those of the fully-connected layers which correspond to the classification of the selected twenty-one categories. This layer was optimised for a maximum of epochs according to categorical cross-entropy loss, with batch size 32, using the Adam optimiser with an initial learning rate of . For regularisation, dropout with a probability of 0.5 is used before the fully-connected layer. For the in-vehicle scenario, the training process is identical to the one described above. However, since the nature of the in-vehicle video data is substantially different from MMIT, the pretrained weights are also trained (not frozen) alongside the fully-connected layer for classification.
For both the generic and in-vehicle scenarios, the audio submodule was trained for a maximum of epochs with batch size and early-stopping patience of epochs. The optimisation was performed using Adam with an initial learning rate of and cross-entropy loss.
13.4 Results
After training the methodologies previously described, including the proposed cascade strategy, an overview of the obtained accuracy results is presented in Table 13.1. It is clear the overall better performance of the proposed cascade pipeline, particularly with the audio submodule as the first block. Subsections 13.4.1 and 13.4.2 offer a deeper discussion of the results for different configurations of the cascade pipeline for the more generic scenarios and the specific case of in-vehicle monitoring respectively.
| Scenario | Unimodal | Multimodal | Cascade | |||||
| Audio | Visual | Parallel | Audio-First | Video-First | ||||
| Generic (21 classes) | 41.65 | 52.96 | 55.12 | 55.30 | 55.12 | |||
| In-Vehicle (42 classes) | 44.42 | 35.96 | 43.26 | 46.05 | 43.47 | |||
| In-Vehicle (3 classes) | 64.10 | 61.87 | 66.61 | 68.88 | 66.77 | |||
13.4.1 Generic scenarios
For the laboratory experiments using the selected data from the MMIT database, the full parallel multimodal pipeline explored in this work offered accuracy. However, when considering the proposed cascade strategy based on confidence score thresholds, it was possible to achieve an improved accuracy score of (see Fig. 13.5). Beyond this relatively small accuracy improvement, the largest benefit of the proposed cascade algorithm is related to processing time. As presented in Fig. 13.6, the best accuracy of is achieved with an audio-first cascade with a confidence score threshold . This means it is possible to avoid the visual and fusion submodules for approximately of all instances without performance losses.
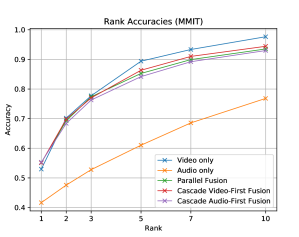
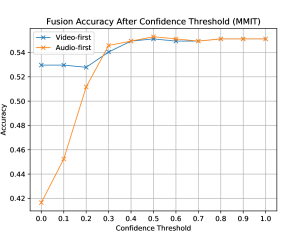
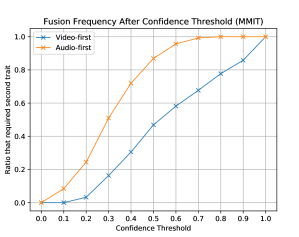
An analysis of size, number of parameters, and average run time per instance for each submodule (see Table 13.2) shows that the visual model is the heftiest among the three submodules. Hence, being able to bypass it on more than half of the instances translates into significant time savings: while the full multimodal pipeline takes, on average, ms to predict an instance’s activity label, the proposed cascade can do it in only ms, on average, without accuracy losses. This brings us closer to real applications using inexpensive hardware in the target in-vehicle scenario.
As visible in Table 13.2, the proposed audio submodule has a total size of MB, approximately thousand parameters, and an average GPU run time of ms per instance. Conversely, the audio submodule used in [346], on this task of activity recognition, has a total size of MB, approximately million parameters, and an average GPU run time of ms per instance (due to the CPU-based handcrafted feature extraction process). Despite the significant reduction in run time, size, and complexity, the proposed audio submodule performed similarly vs. the alternative ( and accuracy, respectively).
| Submodule | Size (MB) | Params. | Run Time (ms) |
| Visual | 176 | 46.2 M | 77.18 |
| Audio | 1.70 | 220 K | 8.30 |
| Fusion | 1.94 | - | 0.38 |
13.4.2 In-vehicle scenario
The results on the data from the target in-vehicle scenario largely follow those discussed above for the laboratory experiments. On the 42-class activity recognition task, an audio-first cascade strategy achieved the best performance ( accuracy) versus the full multimodal pipeline () and the best unimodal submodule (). Similar accuracy improvements are verified up to rank 10 (see Fig. 13.7). With a confidence score threshold of , this cascade strategy is able to avoid the visual submodule for approximately of the instances (see Fig. 13.8). Considering the average run times presented in the previous subsection, this means the cascade is able to offer activity predictions in ms, on average, while offering considerably higher accuracy than the full multimodal pipeline (which would take ms).
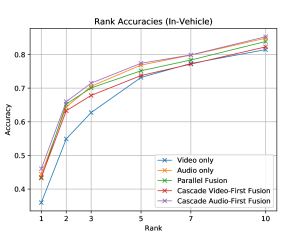
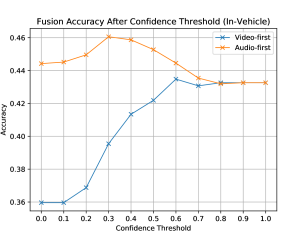
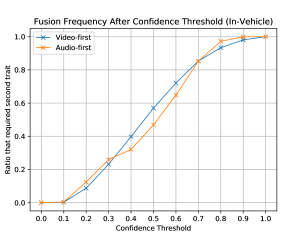
For the three-class violence recognition task, the results follow the same trend, albeit with higher accuracy scores for all submodules and fusion strategies. The proposed cascade strategy with audio as the primary modality was able to attain accuracy, considerably better than the offered by the full multimodal pipeline. This accuracy corresponds to , which enabled avoiding the visual submodule for of all instances (see Fig. 13.9). While this value is lower than those reported for the previous experiments, it still translates into average time savings of ms per instance ( ms for the cascade vs. ms for the full pipeline), accompanied by a considerable improvement in accuracy.
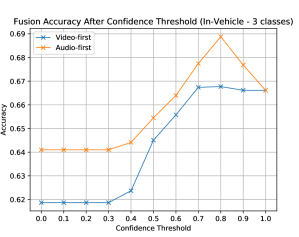
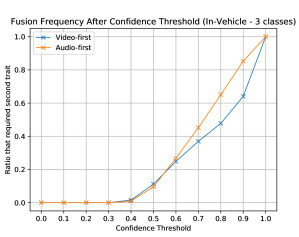
13.5 Summary and Conclusions
This work explored a different strategy for the recognition of human activities, focusing on the scenario of autonomous shared vehicles. In addition to the inherent difficulties of automatically recognising human actions using audio-visual data, this specific scenario poses specific constraints regarding available hardware and energy consumption.
Inspired by state-of-the-art multimodal approaches, the main contributions are two-fold: a lighter-weight deep-learning based audio processing submodule; and a cascade processing pipeline. The proposed audio processing module demonstrated state-of-the-art performance while presenting lesser memory requirements and computational demands. With the submodules implemented, different configurations were tested for the cascade strategy to assess which one provides the best performance, taking into account two critical axes: accuracy and computational performance. Results show that by using audio as the first processing block, it was possible to obtain an accuracy score higher than the state-of-the-art, along with a significant reduction in processing/inference time.
The obtained results are interesting and reveal a high potential for further improvement. Modifications to the individual processing submodules could contribute to even higher accuracies while further reducing computational weight. The latter may benefit from a combination with model compression and acceleration techniques, such as quantisation, avoiding likely losses in accuracy due to compression.
The proposed strategy demonstrated benefits from cascading the processing modules. Other early modules could bring other benefits by filtering out incoming audio-visual data, without relevant content (e. g., without people present or without movement/sound).
Part V Broader Topics on Biometrics and Pattern Recognition
Chapter 14 Learning Template Security
on End-to-End Biometric Models
14.1 Context and Motivation
It is easy to change our keys or passwords when a traditional authentication system is compromised, but it is very hard to change our compromised biometric characteristics. This is the reason why it is paramount that biometric templates are kept secure [186, 304]. This is not easily achievable since, unlike password-based systems, biometric comparison is not binary and must also account for the natural intrasubject biometric variability [200, 304].
While several methods have been proposed to protect biometric templates, most require specific feature extraction or additional processes based on salting, biohashing, or cryptographic protection [200, 304]. Even those proposed for deep learning biometric methods [329, 424] are integrated into end-to-end models, thus creating hurdles that often limit the achievable performance.
Hence, this chapter presents the Secure Triplet Loss, a reformulation of the well-known triplet loss that enables training end-to-end deep learning models to obtain secure biometric templates. Binding keys with the input within the model and considering key divergences in the objective function enables learning template cancelability. A component based on Kullback-Leibler divergence or distance statistics measures and actively promotes unlinkability. Thus, the proposed method aims to allow taking full advantage of the capabilities of end-to-end deep networks while still ensuring the security of the stored biometric data.
A detailed presentation of the Secure Triplet Loss can be found throughout the next sections. This training methodology was thoroughly evaluated for the task of identity verification, considering the template security properties of cancelability, unlinkability, non-invertibility, and secrecy leakage. It was thoroughly evaluated for both ECG and face, to confirm its solidity and flexibility, using the off-the-person University of Toronto ECG database (UofTDB) [445] and the unconstrained YouTube Faces [460] database.
Moreover, it was studied in two scenarios: (a) training a model “from scratch” (initialised with random parameters), or (b) adapting an existing end-to-end biometric model to make it secure (taking advantage of pretrained weights and fine-tuning with the proposed method). The Secure Triplet Loss was also compared with the original triplet loss and competitive state-of-the-art approaches based on Bloom Filters [149] and Homomorphic Encryption [109]. The code used in this work is available online111Secure Triplet Loss Github repository. Available on: https://github.com/jtrpinto/SecureTL..
14.2 Related Work
Beyond accounting for natural biometric characteristic variability, biometric data protection methods need to verify template cancelability, non-invertibility, and unlinkability. Cancelability (or revokability) means the templates can be easily and effectively rendered useless if they become compromised, generally through the change of a personal key that is bound with the template [353, 427].
Non-invertibility requires the transformation from biometric samples to templates to be as close to irreversible as possible. Thus, if the template is compromised, the original biometric sample cannot be reliably recovered or approximated [304, 200]. Finally, template unlinkability means it is difficult to assess if compromised templates from different biometric systems belong to the same identity [149].
One of the first template protection methods was the fuzzy commitment scheme proposed by Juels and Wattenberg [208], using cryptography and error-correcting codes for template cancelability. Later, Teoh et al. [430] proposed BioHashing, an adaptation of the hashing process commonly applied to passwords to deal with fingerprint variability. A similar approach has been proposed by Sutcu et al. [418].
More recently, Rathgeb et al. [362, 363] proposed the Bloom filter approach for alignment-free template cancelability and irreversibility. This approach was later adapted by Gomez-Barrero et al. [149, 151] to ensure template unlinkability, and by Drozdowski et al. [108] for higher computational efficiency. Raja et al. [357] proposed a highly efficient method using neighbourhood-preserving manifolds and hashing for biometric template protection in smartphones.
Among cryptography-based methods, homomorphic encryption (HE) approaches are particularly promising as HE allows arithmetic operations on the encrypted domain [45]. This allows the biometric comparison to be fully conducted on the encrypted domain, ensuring data security [109]. Fully HE approaches, that allow for unlimited operations in the encrypted domain, most notably include Gentry’s [142], Brakerski’s [53], and Fan-Vercauteren’s [118] schemes.
HE has been successfully applied for biometric template protection in face [45, 109, 223], signature [148], and even multibiometric recognition [150]. However, with HE the protection of templates remains the responsibility of a separate process that should, ideally, be harmoniously integrated within the feature extraction algorithm.
Using deep learning, Pandey et al. [329] proposed a template protection scheme that receives features from a convolutional neural network (CNN), quantises them, and applies hashing to obtain exact comparison despite the variability. Later, Talreja et al. [424] used forward error control (FEC) decoding and hashing to protect biometric features extracted by deep neural networks. While these are applied to deep learning, they still require separate protection and comparison schemes. Hence, they are inadequate for recent state-of-the-art biometric recognition methods, which largely rely on end-to-end deep learning models for significantly improved performance.
Considering this, this work proposes the Secure Triplet Loss, a reformulation of the triplet loss [72] that promotes cancelability and unlinkability in end-to-end biometric models. More importantly, it aims to achieve this while avoiding additional protection processes and decreases in performance relative to the original triplet loss.
14.3 The Secure Triplet Loss
14.3.1 Original triplet loss
The triplet loss [72] has been widely used in deep learning to train networks to accurately determine whether or not two samples belong to the same class [338, 73, 74]. During training, such networks receive three inputs (a triplet), in parallel: one is the anchor (, the reference with identity ), the second is the positive sample (, with identity ), and the third is the negative sample (, with identity ). In biometrics, triplets are groups of three biometric samples (images or signals): the anchor and positive inputs correspond to the same individual, unlike the negative input.
For each input, the network will output a representation: e. g., for the anchor, . The three representations are then compared using a measure of distance or dissimilarity , and the network is optimised through the minimisation of the triplet loss function:
| (14.1) |
which leads representations of the same class to be more similar than those of different classes, minimising and maximising . The loss also aims to enforce a minimum margin between the two distances.
This is a generally successful strategy when training neural networks for biometric verification (assessing if the identities of a biometric template and a biometric query match). However, it does not address the important issue of security in biometrics, especially the topics of cancelability and unlinkability.
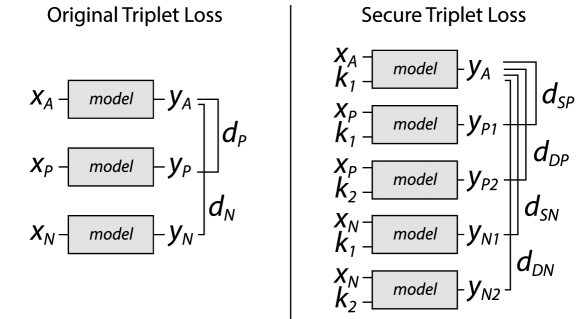
14.3.2 Learning cancelability
In its initial formulation, proposed in [345], the Secure Triplet Loss modifies the original triplet loss to make the final sample representations cancelable (as illustrated in Fig. 14.1). Besides the triplet inputs (, , and ), the network also receives two different keys (, ) that are bound with the inputs by the network itself.
Unlike the original triplet loss, and are processed by the network twice. First, they are combined with and then with . The anchor is only bound with . Thus, five representations are obtained: , , , , . From these, four distances are computed: (with matching identities and keys), (with matching identities but different keys), (with different identities but matching keys), and (with non-matching identities and keys).
The objective is to minimise , when both the identities and the keys match, and maximise the remaining three distances (see Fig. 14.2). Hence, the loss is computed through:
| (14.2) |
where results from the combination of all three distances to be maximised. Here, we consider , with the three distances to be maximised being considered equally relevant. This results in:
| (14.3) |
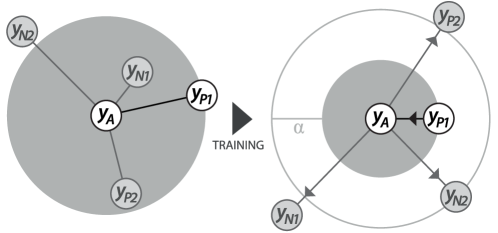
As with triplet loss, enforces a margin between positive and negative distances. In this case, the loss involves four distances, since it also takes into account whether or not the keys match. By minimising the loss in Eq. (14.3), the network learns to deal with the intrasubject and intersubject variability of the biometric characteristic. More importantly, it learns to recognise when the keys do not match, even if the identity is the same. Hence, if the stored templates become compromised, they can easily be invalidated through a key change. However, as reported in [345], fails to promote unlinkability.
14.3.3 Promoting unlinkability
Unlinkability can be achieved by combining the original formulation of the Secure Triplet Loss, , with a component that quantifies linkability in the representations output by the network during training, . Thus, the proposed reformulation of the Secure Triplet Loss, as presented in [347], follows the equation:
| (14.4) |
The component is the original Secure Triplet Loss in Eq. (14.3), focused on biometric performance and template cancelability, following the formulation in Eq. (14.3). The parameter balances the and loss components. The component is focused on measuring template linkability. To achieve unlinkability, one has to ensure similar distance values are obtained when keys don’t match (regardless of whether or not the templates are from the same identity). Hence, and should assume similar values. This can be achieved using the Kullback-Leibler divergence (KLD), computed over each batch. This agrees with the reference linkability metric, which is also inspired by the KLD. In this case, this part of the loss becomes:
| (14.5) |
where and are the probability density functions for the distributions of and , respectively. To obtain these distributions and their respective probability density functions, this part of the loss cannot be computed over each triplet, instead being computed over each batch of triplets. For brevity, this formulation of the Secure Triplet Loss with Kullback-Leibler divergence-based linkability is from now on designated as SecureTL w/KLD.
Alternatively, one can avoid estimating these distributions and the computation of the Kullback-Leibler divergence using simple statistics to promote linkability. If we consider and as the mean and standard deviation, respectively, of the distances on a given batch, and likewise and for the distances on the same batch, then we can reformulate
| (14.6) |
This should lead the model to offer embeddings that result in similar distance scores when the keys do not match, regardless of whether or not the identities match, thus avoiding template linkability. Throughout the remainder of this chapter, for brevity, the formulation of the Secure Triplet Loss with this statistics-based linkability module is designated as SecureTL w/SL.
14.4 Experimental Setup
The proposed methodology for learning secure biometric models was explored for the two biometric characteristics addressed within this doctoral work: the ECG and the face. This section presents the details of the models, the data, and the conducted experiments.
For either characteristic, keys have been randomly generated for each triplet, consisting of unidimensional arrays with binary values. Each key is processed after generation to verify unit norm. For SecureTL w/KLD and SecureTL w/SL, the parameter that controls the balance between the Secure Triplet Loss and the linkability component was set to : this value has overall been able to offer good template unlinkability without considerably harming the validation performance and cancelability.
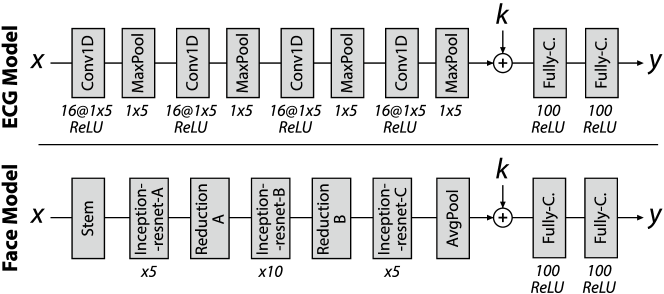
14.4.1 ECG identity verification
14.4.1.1 Data
The ECG data used comes from the University of Toronto ECG Database (UofTDB) [445]. This database includes recordings from subjects over up to six sessions and five different positions. The signals are off-the-person (less obtrusive and more comfortable for realistic biometric applications) and have been acquired at Hz using dry electrodes on the pointer fingers. Each recording is generally to seconds long.
Data from the last identities were used for training, while the data from the remaining 919 subjects have been reserved for testing. From these , one has been discarded for only having a total of seconds of data. Triplets have been generated by selecting an anchor from the first s of data from a subject and positive and negative samples from the remaining data of the same or another identity, respectively. From the training identities, triplets have been generated, with being used for validation. A total of triplets have been generated for testing. Each of the three samples in a triplet is a blindly-segmented five-second raw ECG sample, normalised to zero mean and unit variance.
14.4.1.2 Model
The model for ECG identity verification (see Fig. 14.3) is adapted from the end-to-end architectures proposed in [344, 338] and described in Chapter 4 and Chapter 5. The model is composed of four unidimensional convolutional layers (with , , , and filters, respectively, with size , unit stride, and zero padding), each followed by ReLU activation and max-pooling (with kernels and stride ). The model ends with two fully-connected layers, each with units and followed by ReLU activation.
Once trained, this model receives a second long raw ECG segment ( samples long at Hz sampling frequency) and outputs an embedding or template that can be compared to a reference through the Euclidean distance (during training) or through the normalised Euclidean distance [461] (with the trained model, to obtain dissimilarity scores in the range). In the case of Secure Triplet Loss, the feature vector (the flattened feature maps from the last max-pooling layer) is concatenated with the key array , and both are bound together by the fully-connected layers to make the final secure template .
The model was trained using the Adam [219] optimiser, with an initial learning rate of and weight regularisation with . The training lasted a maximum of epochs, with batch size , with early stopping based on validation loss with patience of epochs.
14.4.2 Face identity verification
14.4.2.1 Data
To fine-tune and evaluate the model, images from the YouTube Faces database [460] were used. This database is composed of frames from YouTube videos, depicting a total of subjects (up to six videos of each subject). Each video corresponds to between and frames. This work used the aligned images provided on the database, which resulted from face detection, cropping, and alignment.
Each face image has been reduced to height and width and resized to to match the input dimensions of the model. Ten random triplets have been generated for each of the first subjects on the database for a total of training triplets, of which have been used for validation. Ten random triplets have also been generated from each of the remaining identities, reserved for testing, resulting in a total of test triplets. Whenever possible, the anchor and positive samples corresponded to different videos of the same identity.
14.4.2.2 Model
The model for face identity verification (see Fig. 14.3) is based on the Inception-ResNet [420]. This network has been pretrained222FaceNet Pytorch Package. Available on: https://github.com/timesler/facenet-pytorch. for identification on the VGGFace2 dataset [58] and offered an accuracy of on the Labelled Faces in the Wild (LFW) dataset and on the YouTube Faces database [381]. The original fully-connected layer has been replaced with two new fully-connected layers, each with units and followed by ReLU activation. For the Secure Triplet Loss, the first of these layers receives the feature vector from the first part of the model, concatenated with the key . The second outputs the template .
All layers on the model have been frozen, to take advantage of the pretrained parameters. The exceptions are the last convolutional block and the fully-connected layers that come, respectively, before and after the average pooling operation. The last convolutional block is fine-tuned to allow for small adjustments during training, while the fully-connected layers are newly created and thus require training. The model was trained for a maximum of epochs at batch size , with early stopping based on validation with a patience of epochs. As with the ECG model, the Adam optimiser was used with an initial learning rate of and regularisation with .
14.4.3 Evaluation frameworks and metrics
The experiments have been designed to quantify the performance of the models trained with the original and Secure Triplet Loss formulations, not only considering verification accuracy but also biometric security.
14.4.3.1 Verification performance
The verification performance is quantified through the measurement of false match rates () and false non-match rates () over the range of possible decision thresholds (for these models, ). These values are presented in vs. plots and detection error trade-off (DET) curves and used to compute the equal error rate (), corresponding to the error where , and the .
14.4.3.2 Cancelability
Avoiding additional processes such as biohashing or template encryption, the proposed Secure Triplet Loss integrates cancelability into the single output of the system, the template , and is reflected in the distance measure between two templates. Although the proposed loss is designed to promote cancelability, this property may not necessarily be achieved.
Hence, the experiments with the Secure Triplet Loss include the measurement of cancelability error. The plots of false match vs. false non-match rates over the dissimilarity/distance scores include both the false match rate based on identity (when identities don’t match, denoted as ) and the false match rate based on cancelability (when keys don’t match, denoted as ). The false non-match rate () values are the same for identity and cancelability since they refer to situations when both identity and keys match. The value of cancelability false accept rate at the operation point that corresponds to the verification , , is also computed.
14.4.3.3 Unlinkability
The template unlinkability analysis followed the method described by Gomez-Barrero et al. [149]. The test samples were paired into mated (different biometric samples from the same identity with different keys) and non-mated instances (different identities and keys). These have been used to compute and : the probability density functions of the distance score given the instances are, respectively, mated (hypothesis ) or non-mated (hypothesis ). From the likelihood ratio , is computed through
| (14.7) |
which allows to compute the linkability metric with
| (14.8) |
The is considered the main metric to quantify template linkability. A biometric system verifying perfect template unlinkability, which is highly desirable, will assume . A biometric system creating entirely linkable templates will verify .
14.4.3.4 Non-invertibility and secrecy leakage
Other aspects of template security offered by the proposed method were evaluated, namely non-invertibility and secrecy leakage. Non-invertibility is measured through the privacy leakage rate, which can be computed through the expression:
| (14.9) |
where is the input biometric, is the output of the model, denotes the entropy of , denotes the conditional entropy of given , and denotes the mutual information between and . The privacy leakage rate, in the range , should be as close to as possible: obtaining information on should be impossible even when one has all knowledge of . The secrecy leakage measures the mutual information between the stored template and the key , through the expression . The keys are public, unlike the templates, so they should reveal as little information as possible on the templates. Hence, the secrecy leakage should be close to zero.
These require the computation of some information theoretical measures, such as entropy and mutual information. This is very difficult in biometrics, due to the high dimensionality of the inputs and the feature sets, as well as their variability. In this work, entropy and mutual information were estimated using a Python implementation333Paul Brodersen’s Entropy Estimators. Available on: https://github.com/paulbrodersen/entropy_estimators. of the methods proposed in [228] and in [229], respectively, for continuous multivariate data. These methods, based on nearest neighbour statistics, were shown to be more accurate than the alternatives [106]. Since the processing cost of such estimations grows exponentially with the size of the dataset, a subset of test anchors has been used for this test.
14.5 Results and Discussion
A general overview of the results obtained is presented in Table 14.1 and Table 14.2, respectively for ECG and face identity verification. The following subsections discuss the results on verification performance, cancelability, and unlinkability, and the comparison with state-of-the-art alternatives.
| Performance | Cancelability | Linkability | ||
| Method | () | |||
| Triplet Loss | 12.56 | 0.9033 | - | - |
| BF [149] | 15.76 | 0.9242 | 0.0075 | 0.234 |
| HE [109] | 12.49 | 0.9573 | 0.0806 | 0.002 |
| SecureTL | 11.36 | 0.8362 | 0.0035 | 0.288 |
| SecureTL w/KLD | 13.58 | 0.8700 | 0.0 | 0.005 |
| SecureTL w/SL | 13.33 | 0.9458 | 0.0 | 0.004 |
| Performance | Cancelability | Linkability | ||
| Method | () | |||
| Triplet Loss | 13.99 | 0.8496 | - | - |
| BF [149] | 17.07 | 0.9103 | 0.0396 | 0.245 |
| HE [109] | 15.06 | 0.8312 | 0.0371 | 0.001 |
| SecureTL | 13.61 | 0.8314 | 0.0966 | 0.399 |
| SecureTL w/KLD | 15.93 | 0.8586 | 0.0089 | 0.132 |
| SecureTL w/SL | 15.15 | 0.8771 | 0.0182 | 0.070 |
14.5.1 Verification performance
On ECG identity verification, the baseline method trained with triplet loss offered EER. This is similar to the results presented in the work that first proposed this end-to-end model [344, 338]. As presented in Table 14.1 and in the receiver-operating characteristic (ROC) curves in Fig. 14.4, the first formulation of the Secure Triplet Loss (SecureTL), without considering linkability, attained EER, which is an improvement in performance over the original triplet loss despite the inclusion of a cancelability module.
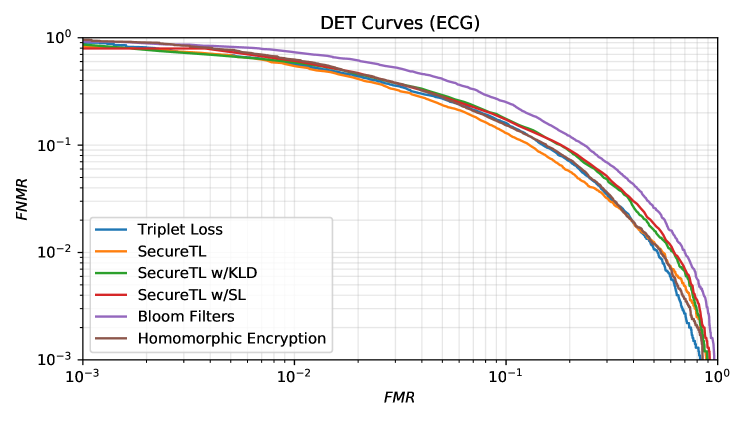
The linkability-focused reformulations of the Secure Triplet Loss, which use the Kullback-Leibler divergence (SecureTL w/KLD) or distance statistics (SecureTL w/SL), led the model to attain, respectively, and EER. These results show that a small performance gap should be expected when considering both cancelability and linkability in the triplet loss. Recalling the performance improvements with the SecureTL formulation, it can be hypothesised that the performance decrease in SecureTL w/KLD and SecureTL w/SL is caused by measuring linkability in a separate loss module computed batch-by-batch. It is likely that, if linkability was better integrated into the Secure Triplet Loss, as was cancelability, then the performance gap would remain closed.
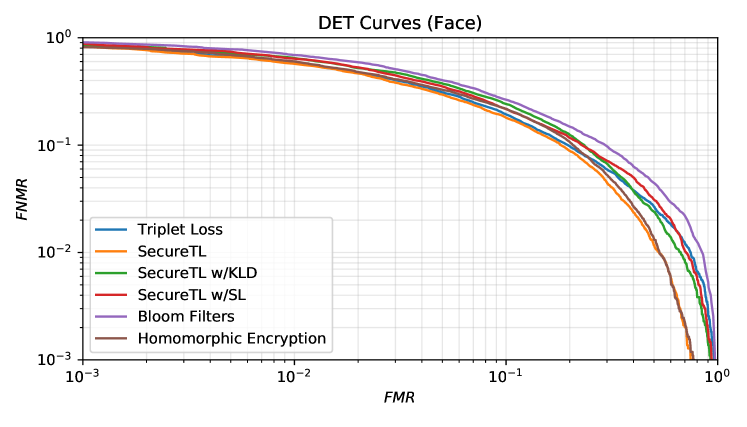
Nevertheless, the model trained with any of the proposed loss formulations still offers considerably better performance than the state-of-the-art methods. The best state-of-the-art method evaluated in the same conditions (in [338]) offered EER vs. attained by SecureTL w/KLD and achieved by SecureTL w/SL. This denotes that the proposed method, while presenting a small performance gap with the linkability loss module, still retains most of the performance advantages associated with deep end-to-end models.
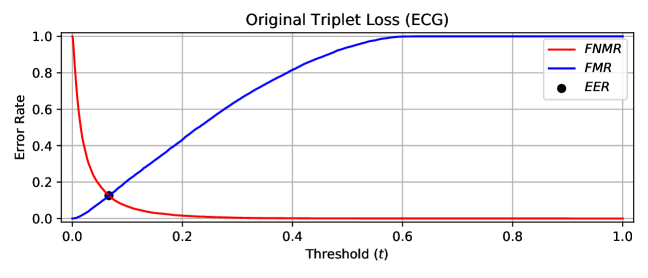
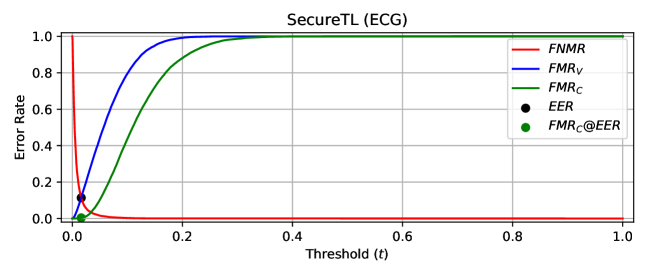
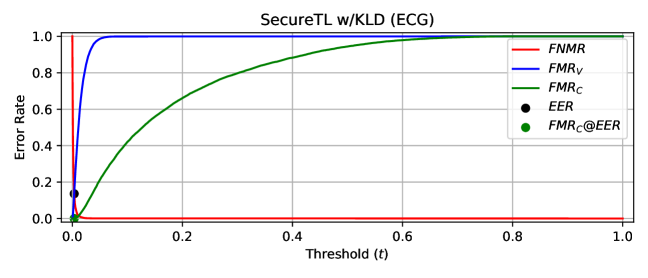
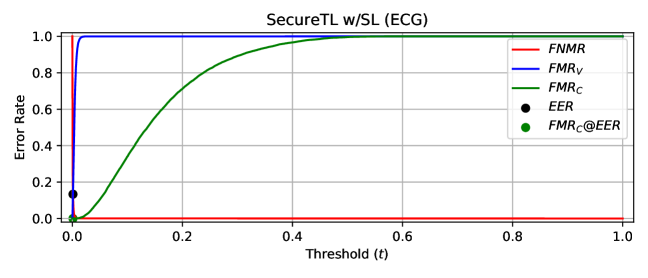
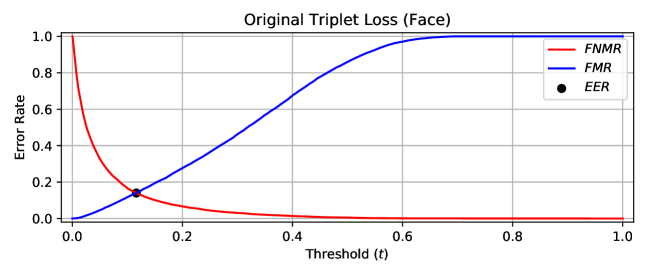
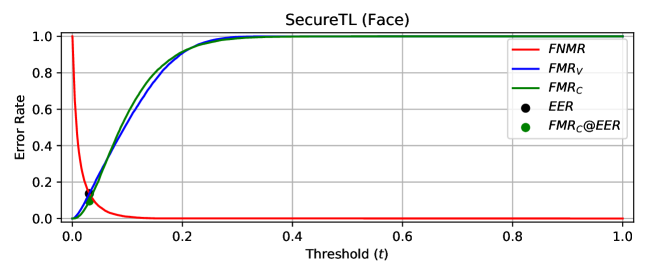
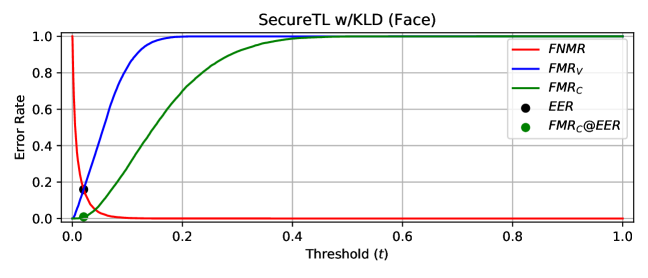
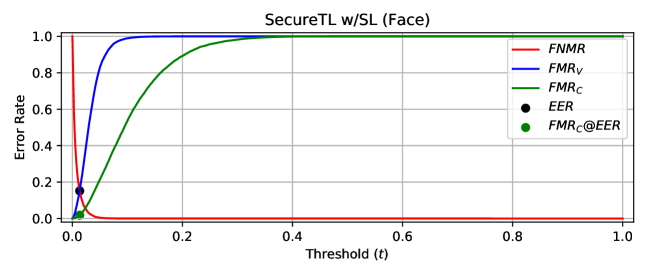
For face identity verification, the performance results are presented in Table 14.2 and in the ROC curves in Fig. 14.5. The model trained with the triplet loss attained EER, which seems adequate given the difficulty of the evaluation settings: YouTube Faces provides a challenging framework for evaluation (noted by the accuracy achieved by the Inception-ResNet model on this database vs. on the LFW database), disjoint subsets of identities are used for training/validation and testing, and each identity is only represented by a single template for each comparison (the gallery size is ).
In harmony with the results on ECG, the model trained with the Secure Triplet Loss without a linkability component offered a small improvement in verification performance ( EER). Likewise, the addition of a linkability-measuring term to the loss leads to a increase in EER. This confirms the aforementioned belief that the separate linkability loss term is affecting performance and improvements could be achieved by integrating it into the Secure Triplet Loss in a more cohesive way.
Overall, the verification performance results denote that it is possible to adequately train or fine-tune an end-to-end model with the proposed loss formulations. With either biometric characteristic, the performance difference between using KLD and distance statistics is not appreciable, which denotes these formulations may each be fitted for specific settings or used interchangeably.
14.5.2 Cancelability evaluation
As aforementioned, by integrating identity verification and template cancelability into a single comparison score, template cancelability is not necessarily ensured. Hence, the results of false match rates based on cancelability () are presented, in Fig. 14.6 and Fig. 14.7, alongside the false match rates based on verification () and the common false non-match rates ().
In all cases, the is lower than at and around the operation point. In most cases, at this point is very small and is lower than or equal to for all operation points, which is highly desirable. As presented in Table 14.1 and Table 14.2, cancelability error is significantly lower in the ECG models. As shown by the results, SecureTL w/KLD and w/SL appear to be better at promoting cancelability than the original secure loss formulation, denoting that the linkability loss term could have a positive effect on cancelability.
Considering these results and the increased difficulty experienced while fine-tuning the face models, one can conclude that the proposed Secure Triplet Loss is likely better fitted for training models from scratch than to adapting previously trained models to become secure. Nevertheless, the cancelability results, especially with the SecureTL w/KLD and SecureTL w/SL, are encouraging in either case.
14.5.3 Unlinkability evaluation
The results of the linkability analysis following the framework established in [149] are presented in Fig. 14.8. In both cases, the original formulation of the Secure Triplet Loss presents relatively high ( for ECG and for face). However, the result with ECG is better than the equivalent reported earlier in [345] (). This results from the fact that linkability was not promoted by this loss during model training: hence, the model may achieve adequate unlinkability, but that would be accidental.
In the case of the proposed SecureTL w/KLD and SecureTL w/SL, linkability is actively promoted during training through the loss. The effects of this loss reformulation are clear: the probability density functions of mated and non-mated are more superposed, which indicates that it would be more difficult, as desired, to distinguish identities in pairs of templates where the keys do not match.
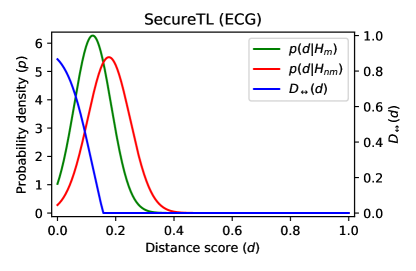

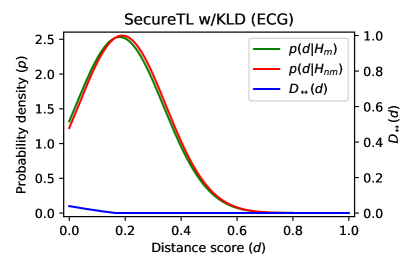
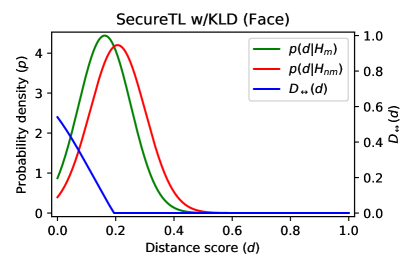
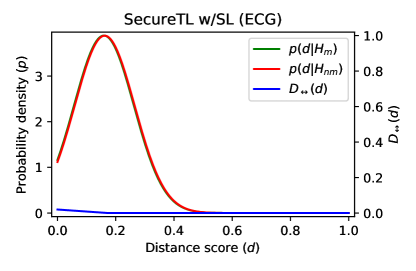
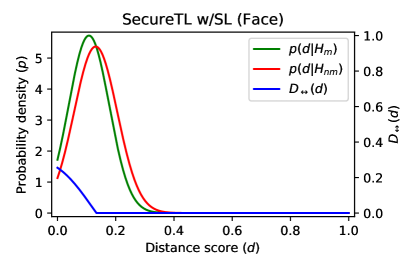
With ECG, assumes the values for SecureTL w/KLD and for SecureTL w/SL. With face, it assumes for SecureTL w/KLD and for SecureTL w/SL. All of these can be considered semi to fully-unlinkable. Just as with cancelability, the proposed method seems more adequate for training models from scratch than for fine-tuning existing biometric models. Additionally, using KLD appears to offer some advantages in linkability for ECG verification, but that should be weighted with the increased instability this alternative has shown during training, relative to SecureTL w/SL, especially in face verification.
14.5.4 Non-invertibility and secrecy leakage
Regarding other security metrics, the privacy leakage rate was estimated as for the model trained with any of the losses. This indicates that it is highly difficult for an attacker to recover the original biometric measurements based on compromised templates output by the model. This could be a result of using end-to-end deep learning models: recent research indicates that optimised deep models compress the inputs retaining only the information needed for the task [434]. This means perfect non-invertibility can be achieved without carefully handcrafted feature extraction algorithms.
Similarly, all losses led the model to offer a perfect secrecy leakage rate of , which denotes that the public keys used to make the templates cancelable reveal no information on them. These results on non-invertibility and secrecy leakage do not show a superiority of the proposed loss formulations over the original triplet loss but emphasise the meaningful advantages of using end-to-end deep learning models for secure biometrics.
14.5.5 Comparison with state-of-the-art approaches
The proposed method was compared with two state-of-the-art approaches: Bloom Filters (BF) and Homomorphic Encryption (HE), as described in [149] and [109], respectively. To provide a fair and direct comparison between the template protection schemes, the features given to those methods were those output by the triplet loss baseline model.
The results are presented in Table 14.1, Table 14.2, Fig. 14.4, and Fig. 14.5. Both with face and ECG, the proposed method outperformed BF in , cancelability, and linkability. HE offered the best linkability results, at the cost of poor cancelability. Additionally, HE took significantly longer for biometric comparison than any of the alternatives, which may grant it limited real applicability.
Although the error results are relatively high, the Secure Triplet Loss is competitive vs. the state-of-the-art alternatives, especially on cancelability and linkability. Moreover, improved results are expected when the Secure Triplet Loss is used on more accurate biometric models.
14.5.6 Effects of varying
Fig. 14.9 presents the and results obtained when varying the parameter which balances the original secure triplet loss formulation and the template linkability component. As shown, lower values () lead to higher with either SecureTL w/KLD or SecureTL w/SL, since template unlinkability takes precedence over verification accuracy on the loss that guides model training. For , lower results are obtained, albeit with a slight increase in template linkability (), especially for . Results may vary in other application scenarios depending on their specificities, but should offer the highest likelihood of success.
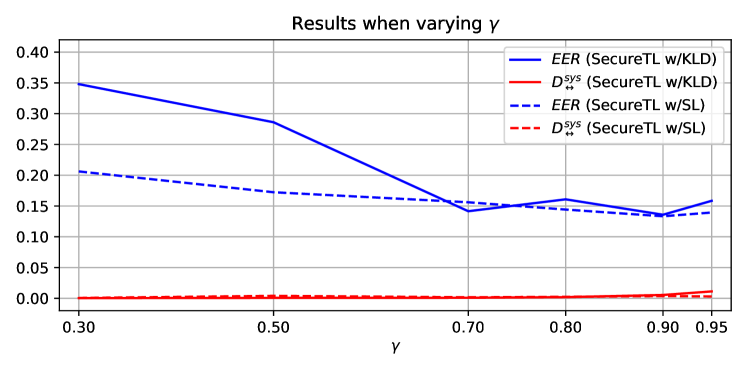
14.6 Summary and Conclusions
This work presented the Secure Triplet Loss, a methodology focused on training end-to-end deep biometric models, without any additional processes, to verify template cancelability, unlinkability, and non-invertibility. The results on ECG and face identity verification show that the proposed method is not only able to fulfil this purpose, but also to adapt pretrained biometric models to offer secure templates, with competitive performance results.
However, there is still room for improvement. Further efforts should be devoted to designing ways to better integrate linkability in the Secure Triplet Loss, in order to avoid performance decreases. A scheme where linkability would be measured triplet-by-triplet (instead of batch-by-batch), similarly to cancelability, should lead to improved performance using the Secure Triplet Loss. This would also enable the formulation of triplet mining approaches for the proposed method. Nevertheless, the Secure Triplet Loss is, overall, a suitable and flexible general scheme for template protection in end-to-end deep biometrics.
Chapter 15 Self-Supervised Learning
with Sequential Data
15.1 Context and Motivation
In recent years, deep learning algorithms have offered improved performance over handcrafted methodologies in several pattern recognition tasks. These commonly take advantage of convolutional layers, which enable the autonomous learning of the most relevant features for the task at hand, and use fully-connected layers for more intricate decision boundaries [242]. However, these improvements come with an important drawback: the need for labelled data.
Most tasks where such performance breakthroughs have been achieved are those where researchers have plenty of labelled data at their disposal. The ImageNet dataset enabled the training of deeper models for better performance in the detection and recognition of objects. Similarly, datasets such as VGGFace [331] and VGGFace2 [58] helped in the development of improved models for biometric recognition based on face images.
However, for some pattern recognition problems, supervised data is scarce. In most of these cases, even though available data is plenty, the annotation process is cumbersome and/or expensive. This is very frequent in automatic medical image diagnosis tasks, where several imaging exams are usually available but lack specific annotations which typically would need to be offered by experts.
Another exemplary application is video surveillance. Given the current ubiquity of surveillance cameras, the availability of data is not a problem. However, the annotation of individuals on the recordings is a long and expensive endeavour. This limits the performance one can attain in these tasks since deeper models will be harder to train.
Yet another key application is continuous biometrics with electrocardiogram (ECG) signals [343]. Deep learning has offered improved performance through increased robustness to signal noise and variability [344]. However, in scenarios with off-the-person signals (acquired during normal activity using few dry electrodes on the fingers and palms), the performance still fails to match the use of cleaner on-the-person signals (acquired on medical-grade settings from subjects at rest, using several wet electrodes on the chest and limbs) [284, 338, 483]. This is verified because current off-the-person signal datasets are too few and too small to train larger and deeper models.
Self-learning (SL) has emerged as a promising approach to learn from unlabelled data. Contrarily to unsupervised learning, SL uses contextual or prior information to automatically define labels and tasks, which then support the learning. Generally, self-learning methods are focused on specific applications, including visual representation learning [128, 147], action classification [129], or human motion capture [439], thus including details that restrict their use to those specific tasks.
On the other hand, several self-learning methods use simple low-level tasks for the training, such as ranking samples [254] or recovering masked parts of an image [437], that do not necessarily guarantee that the learned parameters can be useful for high-level tasks. For example, features that prove adequate for the approximate reconstruction of biometric samples may not be good enough to discriminate their identities. Hence, there is currently a need for a more general and capable self-learning methodology.
In this work, we propose a novel formulation of the triplet loss [72] for self-supervised learning with unlabelled data, unrestricted to specific problems. The triplet loss is particularly suited for this task since it does not require absolute labels for the samples. As samples are combined into triplets, only their relative label information is required. The proposed formulation finds its key application in sequential data scenarios, where mild assumptions about the data acquisition process enable the adoption of a stochastic adaptation of the triplet loss to trigger and sustain the learning.
In the experimental work, the proposed methodology is successfully applied to off-the-person ECG-based biometric identity verification tasks, using signals from the University of Toronto ECG Database (UofTDB) [445], and to unconstrained face identity verification, using the YouTube Faces dataset [460]. Specific stress experiments were conducted on the ECG-based identity verification task to evaluate the behaviour of the proposed methodology in strain conditions.
15.2 The Stochastic Triplet Loss
The triplet loss [72] uses triplets of data samples to train a network to accurately assess if two samples belong to the same class. Each triplet is composed by an anchor with identity and two other samples, one positive () and one negative (), where . The three samples are processed, in parallel, by the same network, which returns a learned representation of each of them (, , and ). A measure of distance is then used to compare the anchor-positive () and anchor-negative () pairs of representations, which are used in the computation of the triplet loss. The triplet loss for a single triplet can be defined as:
| (15.1) |
During training, the goal to decrease the triplet loss will lead the model to adjust its weights to obtain a final representation which brings samples of the same class closer together (reducing ), and samples of different classes further apart (increasing ). Here, the margin parameter will contribute to enforce a minimum distance margin between the samples of different classes.
In the standard triplet loss, it is certain that is sampled from the same class as and is sampled from a class different from the class of . This can be rewritten as and , where is the indicator function.
With unlabelled samples, there is an uncertainty associated with the generation of the triplets, arising from the possibility of errors during the selection of the positive and negative samples. We generalise the previous assumption by modelling as a random variable following a Bernoulli distribution with parameter , i. e., . Similarly, is assumed to follow a Bernoulli distribution with parameter , i. e., .
Assuming the independence of and , and conditioned on the true identity of the observations in the triplet, the triplet loss follows a multinoulli distribution, with:
| (15.2) |
On average, the middle terms in Eq. (15.2) do not contribute to the learning. The last term in the equation negatively impacts the learning process. In practice, one would need more data/time to learn under the noisy sampling of the triplets. The parameters and guide the training of the model through the triplet loss, and their values depend on the specificities of the task and the data. In ideal conditions, these should be as close as possible to to approximate the original triplet loss in supervised settings. Lower values would work against the purpose of the triplet loss and diminish its training effectiveness (or, equivalently, increase the difficulty of the training).
The proposed self-learning methodology can be used to train models with unsupervised data. During triplet generation, after the selection of an anchor sample, one can randomly draw one sample from the dataset to serve as the negative sample. Assuming a balanced dataset with classes will give . If is large, the probability of errors in negative sample selection will be very low (e. g., for or for ), and so will be their impact on the training process. More importantly, in practice, prior knowledge allows us to adopt a sampling strategy with a much higher probability of success.
The positive sample can be obtained through the transformation of the anchor according to . The transformation should be carefully defined in order to change the anchor according to an expected range of intraclass variability but without degrading the underlying label information carried by the sample. The probability will depend on the degree to which complies with this need. Similarly to the negative sample selection, prior knowledge of the data may be useful to maximise the probability of success. For example, when dealing with sequential data, choosing a positive sample closer in time to the anchor will increase the probability of both samples sharing the same label. However, the anchor and the positive sample will likely be more similar, which will restrict the model’s robustness to intraclass variability. Hence, one should find a trade-off between ensuring intraclass variability and maximising the probability of success in positive sample generation.
An approximation of the expected value of the loss in Eq. (15.2) can be computed under some simplified conditions. Assuming a setting with two classes and , with a probability density functions and , respectively. If is sampled from either of the distributions, it results in , with . Setting with a probability density function assumed to be equal to
| (15.3) | ||||
the triplet loss between , , can be described using the Euclidean distance function as with
| (15.4) |
where is the learned representation of .
In the presence of the assumed noise model in the sampling process of the triplets , the probability density function becomes
| (15.5) | ||||
With this, the triplet loss becomes:
| (15.6) | ||||
with:
| (15.7) | ||||
and:
| (15.8) | ||||
Noting that the expected value of the gradient of the loss is zero under and (since and are sampled from the same distribution and the loss is symmetric), the impact of those two cases in a gradient-based learning scheme is small. The total loss is then:
| (15.9) | ||||
under the probability density function, where .
Finally, this loss can be compacted to:
| (15.10) | ||||
In section 15.3, example applications of this methodology are presented for the tasks of electrocardiogram-based biometric identity verification and face identity verification.
15.3 Application Scenarios
The proposed method can be used to train models relying solely on unsupervised data. On classification tasks, the negative sample can be generated through the random selection of a sample in the dataset. Assuming a large number of balanced classes, errors in negative sample selection should be rare. For the positive samples, the function that generates them based on an anchor can be a data augmentation procedure. This should be carefully adjusted to cover the expected intraclass noise and variability while retaining the information pertaining to the underlying image label, which can be difficult.
Alternatively, when training with sequential data, the triplet generation can forgo the data augmentation procedures. In these situations, depending on the acquisition context or protocol, the temporal distance or proximity between data can be used to infer the identity of the subjects. A sample that is very close in time to the anchor can safely be used as . Similarly, a sample that is sufficiently distant in time to the anchor can be assumed to belong to a different user, and thus used as . Some knowledge of the domain and the acquisition settings can be used to adjust the distance between , , and to maximise and .
Both aforementioned alternatives (entirely unsupervised or using sequential data) were explored for the applications described below, through the experiments described in section 15.4.
15.3.1 ECG identity verification
Deep learning models have previously shown improved robustness to off-the-person noise and variability in electrocardiogram-based biometrics [338, 344]. However, to train such models and match the performances reported for cleaner on-the-person signals, one would need large databases of off-the-person acquisitions, which are currently unavailable [343]. In such circumstances, a pretrained network would often be the natural option in computer vision tasks. However, these too are currently nonexistent for unidimensional physiological signals such as the electrocardiogram.
The integration of ECG sensors in everyday objects, e. g. using the CardioWheel steering wheel cover [279] for shared vehicles or similar solutions for shared bicycles or scooters, enables the continuous acquisition of data from several subjects over long periods. This large amount of collected data could be used to train deeper and more sophisticated models. However, this data is commonly unlabelled, as the identity of the users at the moment of acquisition cannot be easily verified.
The proposed methodology for self-learning can be applied to train models for ECG-based identity verification using such data. As aforementioned, perturbations based on data augmentation procedures can be applied to the anchor to generate a positive sample. Thus, the four most successful data augmentation procedures proposed by Pinto et al. [344] were implemented. For each triplet, one of these was randomly selected to generate a positive sample from the anchor:
-
•
Cropping: a smaller contiguous segment is taken from the anchor sample and resampled to match the anchor’s length, to simulate slower heart rates;
-
•
Baseline Wander: a periodic undulation, with a frequency near Hz, is added to the anchor segment to simulate breathing movement artefacts;
-
•
Gaussian Noise: Gaussian noise is added to the anchor signal, simulating high-frequency distortions similar to the electromyogram (EMG) and powerline interference;
-
•
Random Permutation: the anchor is divided into subsegments, which are shuffled to generate a different sample that simulates discontinuities or sensor faults.
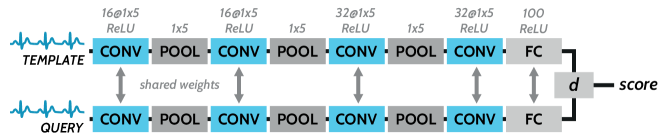
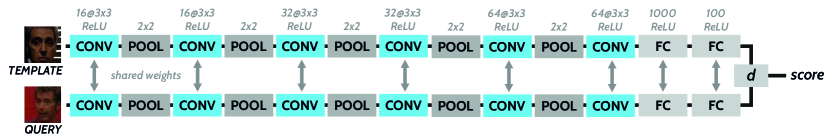
With continuous ECG recordings, it is possible to avoid errors in positive and negative sample selection. Having separate recordings for each person, positive samples are obtained through the selection of a segment of the anchor’s recording. The negative sample is obtained from a different recording. In this case, there should be no errors in positive sample selection. Although there can be several recordings for the same person, errors in negative sample selection should be rare considering the large number of identities in the dataset and the balanced number of recordings per identity.
15.3.2 Face identity verification
More face data are available now than ever before, especially from surveillance feeds or public videos shared on online social media platforms. However, as with ECG-based biometrics, the labelling of faces in acquired datasets is a tedious and lengthy task. Some researchers have taken advantage of online videos to build large datasets for face recognition, such as the YouTube Faces dataset from Wolf et al. [460]. However, these datasets are limited by the number of annotations available.
The proposed self-learning method can be used to train models for face verification without labelled data. In this case, common image data augmentation based on rotations, width and height shifts, and horizontal flips were used as the transformation function that generates a positive sample based on an anchor .
Having short videos, a random detected face from the same recording as the anchor can serve as a positive sample, while a negative sample can be drawn from a different recording. With some knowledge of the recordings, we minimise the probability of errors in positive and negative sample selection. Specifically, we know the YouTube Faces data consists of frames from short video recordings, with several people, with no more than one person per frame. Hence, although the short recordings lack much intrasubject trait variability, selecting triplets in the aforementioned way avoids errors in positive and negative sample selection.
15.4 Experimental Setup
15.4.1 Data
15.4.1.1 ECG data
The data used to train and evaluate the model is from the University of Toronto ECG Database (UofTDB) [445]. This database includes data from subjects, acquired at Hz using dry metallic button electrodes, held by the subjects in contact with one finger of each hand. Each recording is minutes long, and each subject has recordings for up to five different postures (supine, tripod, exercise, standing, and sitting) on up to six sessions over a period of six months.
The data was divided for model training and evaluation as done by Pinto et al. [338]. The last subjects (from subject to subject ) were reserved for model training. The data from the remaining subjects were used for evaluation. One subject () was discarded for having too few data. From the subjects reserved for evaluation, the first seconds of the first recording were used for enrollment, while the remaining data were used for testing. This aimed to mimic a realistic context with scarce supervised data as expected in real ECG-based biometric applications.
15.4.1.2 Face data
For face identity verification, data from the YouTube Faces database [460] were used. This database contains frames from videos of subjects, sourced from YouTube. Each video is to frames long, and there are up to six videos of each subject. This work used the aligned images provided on the database, which resulted from face detection, cropping, and alignment.
The first subjects (in alphabetical order) were used to build the dataset used in this work: the first subjects were reserved for training and validation, while the data from the remaining subjects were used for testing. Triplets were generated using this data subset, after resizing the images to , as detailed below in the experiments’ description.
15.4.2 Models
The self-supervised training method proposed in this work was explored for ECG-based identity verification using an adapted version of the end-to-end network proposed by Pinto et al. [338] (see Fig. 15.1). The model receives two z-score normalised five-second raw ECG segments (a stored template and a query sample) and returns a measure of dissimilarity related to their identity.
The network is composed of four convolutional layers followed by a dense layer. A max-pooling layer (pooling size ) follows each of the first three convolutional layers. The convolutional layers have , , , and filters, respectively, with unit stride, without padding. The dense layer is composed of units. All convolutional and dense layers are followed by ReLU activation.
For face identity verification, the model is a simple convolutional neural network (see Fig. 15.2), which receives two RGB face images, normalised to intensities, and outputs a measure of their dissimilarity. It is composed of six convolutional layers interposed with five max-pooling layers (pooling size ) and followed by two dense layers. The convolutional layers have , , , , , and filters, respectively, with size , unit stride, without padding. The dense layers are composed of and units, respectively. All convolutional and dense layers are followed by ReLU activation.
Both models were trained using the Adam optimiser, with an initial learning rate of . As in [338], the Euclidean distance was used as distance measure during training, while for identity verification this was replaced by the normalised Euclidean distance for scores in . The triplet loss margin was set as . A maximum of epochs was given, with batches of triplets, along with early stopping with a patience of epochs. Dropout was used before each dense layer, with rates of and for the ECG and the face models, respectively. L2 regularisation () was used for the convolutional layers in both models.
15.4.3 Evaluation metrics
The evaluation metrics used are the False Acceptance Rate (FAR), the False Rejection Rate (FRR), the Equal Error Rate (EER), and the Receiver-Operating Characteristic (ROC) curve [343]. The FAR measures the rate at which impostors meet a given acceptance threshold and are falsely granted access. The FRR measures the rate at which genuine users are incorrectly denied access due to their scores not meeting the given threshold. The EER corresponds to the error at the operation threshold where FAR and FRR have equal values. The ROC curve plots the values of FRR versus FAR for the possible range of threshold values.
15.4.4 Experiments’ description
15.4.4.1 Without supervision
In this experiment, the models were trained with triplets whose negative samples are drawn randomly from the entire respective dataset. The positive samples are created through the application of data augmentation procedure to the respective anchor samples. To train the ECG identity verification model, triplets were generated for the training, of which were used for validation during training, and triplets were generated for evaluation. For the face model, triplets were generated for the training, of which were used for validation, and triplets were generated for testing.
Naturally, depending on the dataset used for training, the probability of error in the random selection of a negative sample will vary. In datasets with fewer classes, the probability of randomly selecting a negative sample whose class matches that of the anchor is greater than in datasets with more classes. Hence, the aforedescribed experiment with the ECG identity verification model was repeated, but giving the selection of a negative sample a probability of returning a sample from the anchor’s identity. This probability of error was linked to a simulated number of subjects , with and . This enabled the assessment of how a balanced dataset with fewer classes could impact the training process and the effect on the final identity verification performance.
15.4.4.2 Using recordings
This experiment used the recordings of the UofTDB database and the video recordings of YouTube Faces as a way to infer the identity of the samples through the temporal proximity between them, using prior knowledge to minimise triplet generation errors. Here, the positive sample is drawn from the same recording as the anchor, while the negative sample is drawn from a different recording. As each subject can have several recordings, there is an error associated with the selection of the negative sample, which can accidentally be selected from a different recording of the same subject. The number of generated ECG and face triplets used for training, validation, and testing, was the same as mentioned in 15.4.4.1.
When training the network with longer recordings spanning several users, as described in section 15.2, the possible errors are different. Although the positive sample is selected in the temporal vicinity of the anchor, it can belong to a different identity. The negative sample, despite the distance from the anchor, can accidentally belong to the same user as the anchor. Hence, additional experiments were conducted where the positive and negative sample selection processes failed purposely with probability , to assess the effect of such errors in the final model performance.
15.5 Results and Discussion
15.5.1 ECG identity verification
The baseline results correspond to the identity verification model trained with supervised data. The equal error rate of represents a small improvement over the corresponding result reported in [338]. Considering the evaluation data and conditions were the same, this method also offered significantly better results than the state-of-the-art methods implemented and tested in [338]: the Autoencoder-based solution proposed by Eduardo et al. [111], the AC/LDA method proposed by Agrafioti et al. [10], and the DCT approach proposed by Pinto et al. [344, 342].
The performance results of the model trained with the two unsupervised training approaches are presented in Fig. 15.3, in comparison with the baseline results. The Equal Error Rate values were , , and , for supervised, entirely unsupervised, and recording-based training, respectively. The difference between the performance with entirely unsupervised training and the performance with recording-based training denotes the data augmentation procedures have not been able to completely mimic the variability of the signals, and could perhaps be improved using optimised data augmentation [90, 260]. Despite the worse performance attained with the entirely unsupervised training approach, all of these methods offered better performance than the handcrafted methods evaluated in the same settings in [338], among which the best result was EER.
15.5.2 Face identity verification
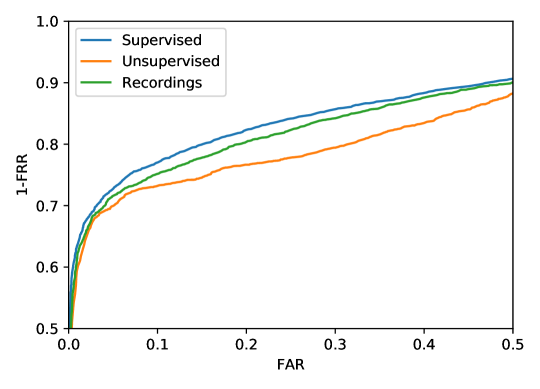
As with the ECG-based identity verification task, the model trained with supervised data was used as a baseline for comparison of results in face identity verification. The performance offered by the baseline was EER. This is considerably higher than the state-of-the-art, which is explained by the relative simplicity of the implemented model and the relatively small dataset used. Nevertheless, the goal of this work was not to overcome or match the state-of-the-art in face verification but to illustrate how the proposed self-learning methodology can be applied to face biometrics with small performance losses relative to a supervised baseline in similar conditions.
The results with the proposed methodology are illustrated in Fig. 15.4. When using entirely unsupervised data, the proposed method offered EER, a increase relative to the use of supervised data. With recording-based triplet generation, the model offered EER, a increase. These small performance losses when forgoing labels during training show that the model can learn without supervision using the stochastic triplet loss, as verified above for ECG biometrics. Besides these two applications, one should expect the proposed self-learning methodology to be successfully applied to similar problems.
15.5.3 Stress experiments
As discussed in subsection 15.4.4, the success of the unsupervised triplet generation technique depends on the number of identities (classes) in the database. Hence, an experiment was performed on ECG identity verification to simulate the variation of the number of identities on the dataset, inducing errors in the negative sample selection with the respective probability. The results (see Fig. 15.5) show that, although the performance worsens with fewer subjects, the errors have a very small effect for datasets with more than subjects. In fact, with subjects or more, the performance results stabilised around EER. Hence, a dataset with classes should be enough to adequately apply this method with better performance than handcrafted state-of-the-art approaches.
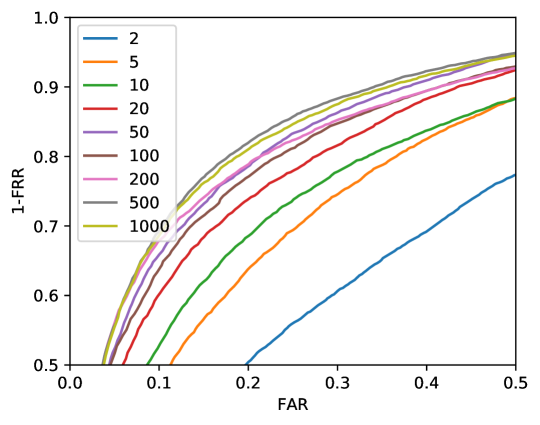
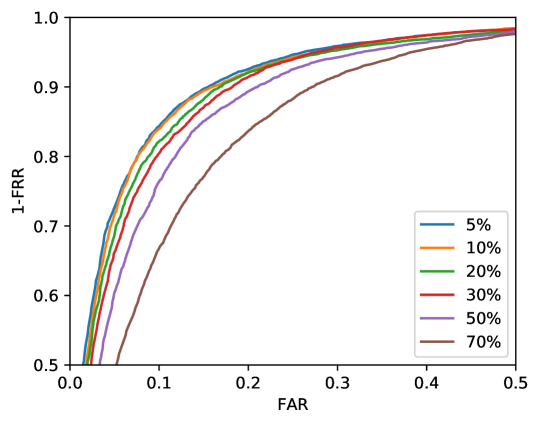
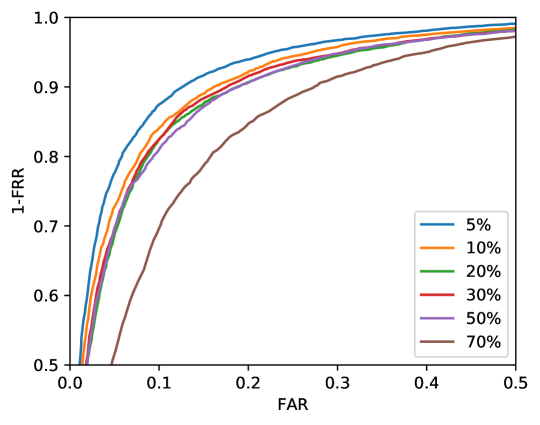
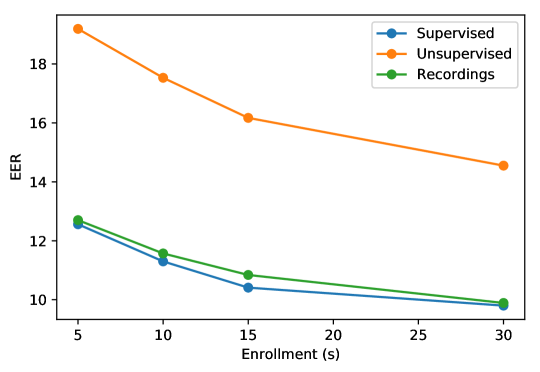
For the training based on temporal proximity between samples, both the selection of positive samples and the selection of negative samples may fail. Hence, enforcing a probability of each error in the recording-based training experiments allows the study of the impact of such errors on the model’s performance. The increase of either positive or negative sample selection error probabilities leads to a decrease in performance (see Fig. 15.6 and Fig. 15.7). However, that decrease is relatively small unless the probabilities of error are over . This means that some knowledge of the typical usage times and patterns during data acquisition would be enough to adjust the process of positive and negative sample selection and ensure the best results.
Results could be further improved using more enrollment data (see Fig. 15.8). As studied by Pinto et al. [338], instead of the simple one-vs-one comparisons performed in the aforedescribed experiments, which correspond to five-second enrollments, the query template can be compared with each of several enrollment templates from each person, and only the minimum score is considered. ECG identity verification performance with the proposed unsupervised and recording-based training approaches reached and , respectively, when using thirty-second enrollments.
15.6 Summary and Conclusions
This work proposed a novel formulation of the triplet loss for self-supervised learning with unlabelled data. This method considers the uncertainty associated with the triplet generation in unsupervised settings and maximises the probability of success using prior knowledge.
In harmony with the goals of this thesis, the proposed methodology was applied to the task of ECG-based biometric identity verification, using transformations based on data augmentation or the temporal proximity between samples to generate valid triplets. The method offered better performance than handcrafted state-of-the-art methods, especially when using temporal proximity between samples, with performance results similar to supervised training.
This pattern was also confirmed on the task of unconstrained face identity verification. Training with entirely unsupervised data using the proposed triplet loss formulation resulted in just a small performance loss when compared with the use of supervised data. When generating triplets based on video streams, this loss was considerably smaller.
It should be noted that the proposed method can be influenced by imbalanced classes and errors in the unsupervised triplet generation. However, the results of the stress experiments show its robustness is sufficient to avoid considerable impacts on performance in most cases. Thus, this method would, according to the presented results, be a viable training option in multiclass classification problems where only unlabelled data are available, especially with sequential data.
Part VI Epilogue
Chapter 16 Summary and Conclusions
The doctoral work presented throughout this thesis had the main goal of advancing the integration of biometric recognition and wellbeing monitoring solutions, especially focused on the case of intelligent vehicles. This goal was carefully targeted through two specific scenarios. The first was personalised wellbeing monitoring systems using biometrics, mainly focused on advancing ECG and face biometric solutions for improved driver assistance systems. The second was occupant monitoring for autonomous shared vehicles, through the development of solutions for efficient and robust group-based monitoring of passengers’ wellbeing inside fully autonomous vehicles.
Always with this major goal in mind, several novel and meaningful contributions were achieved, as introduced in Chapter 1 and described in the various chapters of this document. The main contributions, resulting completely or mostly from the work of the author of this thesis, were:
-
•
The most comprehensive state-of-the-art survey on ECG biometrics to date. This work encompassed one hundred and twenty-five literature methods, a thorough description of the fundamentals behind the ECG as a biometric characteristic, and a critical overview of the evolution of this topic, including extensive considerations on the current research challenges and future opportunities. At the time of writing this thesis, the resulting survey article had been cited in the literature over one hundred and fifty times111João R. Pinto’s Google Scholar. Available on: https://scholar.google.com/citations?user=hhF9Q8kAAAAJ.;
-
•
The first truly end-to-end approach for ECG-based biometrics, proposed for both identification and identity verification tasks, including the development of tailored data augmentation strategies and studies on fine-tuning and transfer learning. Meaningful and significant performance improvements were achieved in challenging and realistic evaluation scenarios using large off-the-person databases. At the time of writing this thesis, the resulting book chapter and international conference article had been cited in the literature over forty times;
-
•
A pioneering study on the relevance of ECG waveforms for the biometric identification task through explainability. End-to-end deep networks trained for biometric identification and analysed using multiple explainability tools offered new insights on the importance of the different parts of the ECG signal, especially the QRS complex, when distinguishing identities in diverse scenarios;
-
•
A multimodal approach for audiovisual recognition of emotion valence in groups of individuals. The proposed approach, based on adapted state-of-the-art sound and video recognition modules, presented promising results in regards to both accuracy and efficiency in the recognition of emotional states of groups of people;
-
•
A cascade strategy to streamline multimodal audiovisual activity recognition in time-sensitive scenarios. When evaluated for multiclass activity recognition and violence detection, including inside real vehicles, the proposed approach was able to offer improved accuracy with up to reduction in runtime;
-
•
The first approach to achieve template security in end-to-end biometric models. Aiming to combine the benefits of end-to-end deep learning with the security of template cancelability and unlinkability, the proposed Secure Triplet Loss was able to outperform the state-of-the-art alternatives and offer minimal performance gaps without requiring separate encryption processes or protection schemes. At the time of writing this thesis, the resulting journal article and international conference article had been cited in the literature fifteen times;
-
•
An adaptation of the triplet loss to allow for fully unsupervised learning. Taking advantage of multiclass balance and the natural structure of sequential data, the proposed approach was able to considerably close the gap to supervised performance levels, even in the more challenging evaluation scenarios.
The secondary contributions of this doctoral work, resulting from collaborations within the scope of this thesis which benefitted partially from the work of the author, were:
-
•
The first study on long-term performance evolution of multiple state-of-the-art ECG biometric methodologies. This study highlighted the problem of intrasubject variability in ECG biometrics, even over relatively short time periods, and proposed multiple template/model update strategies to mitigate its negative effects on identification performance;
-
•
An approach for recovering the full set of twelve standard ECG leads relying only on short single-lead blindly-segmented recordings. The proposed approach has offered promising results in a considerably more challenging evaluation scenario than those found in the literature, and paves the way towards robust and efficient methods for retrieving missing leads in more comfortable acquisition setups;
-
•
Two novel strategies to reduce the performance gap in masked face recognition. Among the proposed approaches, the one based on multi-task contrastive learning outperformed the alternative methods and illustrated the benefits of promoting the similarity between latent masked and unmasked face image representations. At the time of writing this thesis, the resulting three international conference articles had been cited in the literature over fifty times;
-
•
A pioneering study on interpretability for face biometrics, through the presentation attack detection task. This exploratory experiment illustrated how interpretability tools could be used to achieve a deeper understanding of the behaviour of biometric models and motivated their use in the next generation of biometric evaluation strategies.
Through these contributions, this doctoral project touched on several important topics related to each individual research area and the thesis theme as a whole. In ECG biometrics, the work addressed the topics of end-to-end models, transfer learning, data augmentation, long-term performance, template update, interpretability, and interlead conversion. In face biometrics, the topics of masked face recognition, presentation attack detection, and interpretability were covered. In wellbeing monitoring, this work focused on multimodal fusion, group emotion recognition, violence detection, in-vehicle scenarios, and optimisation/efficiency. Additionally, the broader topics of biometric template security and self-supervised learning were also addressed.
Considering the achievements of this work, one can conclude that, although the ideal of truly personalised wellbeing monitoring is yet to be achieved, meaningful and valuable strides have been successfully taken to reach it. As such, a strong framework is now built to support future work towards the central goal of tightly integrating biometric recognition and wellbeing monitoring in a multimodal, seamless, continuous, and realistic way.
This conclusion is supported by the reception of this research within the scientific community. The work described in this thesis has directly resulted in twenty-four scientific publications, including five articles in peer-reviewed journals and eleven articles in the proceedings of international conferences. This increases to thirty-eight total publications if one also considers other minor contributions to other topics in biometrics, computer vision, and pattern recognition, which have not been addressed in this document. These had been welcomed by the scientific community with over three hundred citations by the time this thesis was written.
This doctoral work has been published in multiple major journals and conferences in the international biometrics community. These include the IEEE Transactions in Biometrics, Behavior and Identity Science, IET Biometrics, the International Joint Conference on Biometrics (IJCB), the International Conference on Biometrics: Theory, Applications and Systems (BTAS), and the International Conference of the Biometrics Special Interest Group (BIOSIG). Additionally, part of the work has also been published in reputed venues related to general machine learning, computer vision, or pattern recognition research, such as IEEE Access or the International Joint Conference on Neural Networks (IJCNN). Part of the results of this work also contributed to the AUTOMOTIVE, Easy Ride, and Aurora research projects.
In recognition of the value of the achieved contributions, this doctoral research and its author have also been the recipients of multiple awards. These are the EAB Max Snijder Award at the 2022 European Biometrics Awards organised by the European Association for Biometrics (EAB), the Computers Journal Best Paper Award at the 2020 International Workshop on Biometrics and Forensics, the Best Session Paper Award at the 2020 IEEE International Conference on Image Processing, Applications and Systems (IPAS), and the Jury’s Best Presentation Award at the 2021 NIS Workshop organised by INESC TEC.
Chapter 17 Future Work Considerations
Despite the results achieved in the doctoral work described throughout this thesis, plenty is yet to be done to achieve the full symbiotic integration of biometric recognition and wellbeing monitoring. The successful integration of these two tasks in real scenarios is a challenging endeavour in itself. Nevertheless, plenty of opportunities are yet to be explored in the topics of ECG biometrics, face biometrics, and wellbeing monitoring focused on this doctoral work, which would be essential to achieve our major objective.
When considering the current state of ECG biometrics, it is hard to disagree with the notion that data is the main problem to be tackled. Many would argue that face biometrics is more evolved than ECG biometrics because the ECG is more deeply affected by noise and variability. But this is misleading, since the face suffers (and heavily so in truly unconstrained scenarios) from most of the same factors that affect the ECG, including emotions, exercise, drowsiness, and medical conditions. Even the loss of information due to heavy noise or sensor contact losses in off-the-person ECG is analogous to common occlusions that can deeply limit the available information in unconstrained face images. Face biometrics is more developed thanks to the unprecedented magnitude of data available to train increasingly sophisticated and robust models. The number of subjects, the unconstrained nature of the data, the diversity of scenarios, the variety of acquisition sessions, and the comprehensiveness of current benchmark data in ECG biometrics pale in comparison to what can be found for face biometrics.
As such, researchers should dedicate special efforts to creating larger (and better) datasets for ECG biometrics. Increased number of identities, longer recordings, more sessions across wider periods of time, and more realistic off-the-person scenarios are only some of the aspects that need to be verified by new datasets. Since the ECG could likely serve society better as part of multimodal solutions, new datasets could focus on the simultaneous (and continuous) acquisition of other traits alongside the ECG, especially face video. While such datasets remain unavailable, it would be interesting to find new ways to mitigate the effects of data scarcity. This includes the development of sophisticated pretrained models that could be fine-tuned to multiple tasks, the study of learnable 1D to 2D transformations to take advantage of image pretrained models, and the development of tailored solutions for unsupervised and self-supervised learning. At last, it is also important to standardise the way performance is evaluated in ECG biometrics, through the definition of complete and realistic benchmark datasets to assess and compare the performance of state-of-the-art methods.
Conversely, in face biometrics, data is plenty and models are considerably more accurate. However, as we could witness from the results of this doctoral research, there is still much to do regarding the robustness of face recognition in realistic scenarios. The advent of face masks revealed the feeble nature of current state-of-the-art approaches to unexpectedly drastic scenarios and reignited the old topic of occlusions in face biometrics. In fact, after over two years of heavy and dedicated research in masked face recognition, there is still a considerable performance gap vs. unmasked scenarios. Masks may soon leave our society, but the possibility for such severe occlusions to be witnessed once again (in the shape of masks or any other object) is enough to warrant further research. As such, the successful example of multi-task contrastive learning should be followed with the development of more sophisticated multi-objective schemes for learning to ignore masked face regions. Moreover, the creation of larger datasets of real masked face images and videos is also a key step towards closing the performance gap in masked face recognition.
Additionally, given that face biometrics is a much more developed topic than ECG biometrics, interpretability is also a much greater opportunity in this topic. Face recognition solutions have permeated countless aspects of our society, including deeply sensitive applications such as border control or urban surveillance. This situation starts to raise doubts about the trustworthiness of such algorithms. Interpretability is essential to offer the deeper level of understanding needed to avoid biases, lead models away from undesirable behaviours, and ultimately make the general public more comfortable with the use of such technologies. As such, it is important that more attention is devoted to the topic of interpretability in biometrics (especially face biometrics), through the redefinition of evaluation standards and the development of approaches with interpretability and explainability as one of the main goals (and not just an afterthought).
On the topic of wellbeing monitoring, two major problems are evident from the results of the work conducted during this doctoral project. The first is performance in specific scenarios such as in-vehicle monitoring. Current models present promising results in general purpose scenarios, for which data has become plenty through online sourcing, but are still relatively weak for recognition in specific scenarios. These, naturally, should not be overlooked and researchers should dedicate efforts to better take advantage of generalistic models for specific scenarios, e.g., through more sophisticated methods for transfer learning and domain adaptation. The second problem is subject dependency. This is a well-documented problem in the literature and, while not as evident in the group-level emotion recognition work presented in this thesis, has been encountered and discussed frequently in emotion and drowsiness recognition works linked to this doctoral work and the AUTOMOTIVE project. It is troubling how performance can be affected when wellbeing monitoring models are applied to data from individuals they have never seen before. If wellbeing monitoring is to be applied in real scenarios, this problem should be tackled head-on through dedicated robustness studies and the reformulation of evaluation setups to ensure realistic subject-independent results.
After the aforementioned individual topics are addressed, the integration of biometrics and wellbeing, combined with the integration of multiple data sources, raises new problems in terms of efficiency and data security. Since these solutions would be deployed to edge scenarios, it is important to consider performance costs and develop models with efficiency as one of the main priorities. Multi-task and multimodal integrated solutions, minimising separate processing of information, should be chosen as frequently as possible. At last, since such solutions would deal with highly intimate data carrying identity and health information, it is paramount to continue the efforts on learnable template security to ensure all data is stored in a thoroughly protected way.
Part VII Appendices
Appendix A ECG Biometrics Literature Methods
This appendix presents an overview of the methods proposed for ECG-based biometrics in the literature, from the beginning of the topic in 1999 till today, in Table LABEL:tab:ecg_unimodal_works. This table includes a straightforward description of the most important aspects of ECG biometric methodologies: the denoising methods, the signal preparation pipeline, the feature extraction and dimensionality reduction schemes, and the decision models/strategies. Moreover, it includes the performance reported in the respective publications, alongside information on the evaluation scenario corresponding to such results: the dataset, the number of subjects, and whether the data has been acquired in off-the-person scenarios.
This survey of state-of-the-art approaches began with the research work in [337], initially covering sixty-five literature methods. It was later expanded during this doctoral work to cover ninety-three publications in [343], which has since been cited nearly one hundred and fifty times by the scientific community. In this thesis, it presently covers a total of one hundred and twenty-five state-of-the-art methods for ECG biometrics.
This unprecedentedly comprehensive collection of information on ECG biometric methodologies aimed mainly to empower the easy pinpointing of open challenges and research opportunities. Hence, this work, as published before in [343], is thought to have helped accelerate the development of novel solutions in ECG biometrics and is expected to continue doing so in the near future. The information gathered in this appendix has also been used to thoroughly describe the evolution and current landscape of ECG biometrics in Chapter 3.
References
- Abadi et al. [2015] M. Abadi, A. Agarwal, P. Barham, E. Brevdo, Z. Chen, C. Citro, G. S. Corrado, A. Davis, J. Dean, M. Devin, S. Ghemawat, I. Goodfellow, A. Harp, G. Irving, M. Isard, Y. Jia, R. Jozefowicz, L. Kaiser, M. Kudlur, J. Levenberg, D. Mané, R. Monga, S. Moore, D. Murray, C. Olah, M. Schuster, J. Shlens, B. Steiner, I. Sutskever, K. Talwar, P. Tucker, V. Vanhoucke, V. Vasudevan, F. Viégas, O. Vinyals, P. Warden, M. Wattenberg, M. Wicke, Y. Yu, and X. Zheng. TensorFlow: Large-Scale Machine Learning on Heterogeneous Systems, 2015. URL https://static.googleusercontent.com/media/research.google.com/en//pubs/archive/45166.pdf.
- Abo-Zahhad et al. [2014] M. Abo-Zahhad, S. M. Ahmed, and S. N. Abbas. Biometric authentication based on PCG and ECG signals: present status and future directions. Signal, Image and Video Processing, 8(4):739–751, 2014. ISSN 1863-1711. doi: 10.1007/s11760-013-0593-4.
- Abomhara et al. [2019] M. Abomhara, S. Y. Yayilgan, A. H. Nymoen, M. Shalaginova, Z. Székely, and O. Elezaj. How to Do It Right: A Framework for Biometrics Supported Border Control. In E-Democracy – Safeguarding Democracy and Human Rights in the Digital Age, pages 94–109, 2019. doi: 10.1007/978-3-030-37545-4_7.
- Admane et al. [2019] A. Admane, A. Sheikh, S. Paunikar, S. Jawade, S. Wadbude, and M. J. Sawarkar. A Review on Different Face Recognition Techniques. International Journal of Scientific Research in Computer Science, Engineering and Information Technology, 5(1):207–213, 2019. ISSN 2456-3307. doi: 10.32628/CSEIT195159.
- Afonso [2020] C. Afonso. Changing Perspectives: Interlead Conversion in Electrocardiographic Signals. Master’s thesis, Universidade do Porto, Portugal, 2020. URL https://hdl.handle.net/10216/129630.
- Aghdaie et al. [2021] P. Aghdaie, B. Chaudhary, S. Soleymani, J. Dawson, and N. M. Nasrabadi. Attention Aware Wavelet-based Detection of Morphed Face Images. In IEEE International Joint Conference on Biometrics (IJCB), pages 1–8, Shenzhen, China, Aug. 2021. doi: 10.1109/IJCB52358.2021.9484398.
- Agrafioti [2011] F. Agrafioti. ECG in Biometric Recognition: Time Dependency and Application Challenges. PhD thesis, University of Toronto, Canada, 2011. URL https://tspace.library.utoronto.ca/bitstream/1807/31673/1/Foteini_Agrafioti_F_201111_PhD_thesis.pdf.
- Agrafioti and Hatzinakos [2008] F. Agrafioti and D. Hatzinakos. ECG Based Recognition Using Second Order Statistics. In Annual Communication Networks and Services Research Conference (CNSR), pages 82–87, Halifax, NS, Canada, May 2008. doi: 10.1109/CNSR.2008.38.
- Agrafioti et al. [2011] F. Agrafioti, J. Gao, and D. Hatzinakos. Heart Biometrics: Theory, Methods and Applications. In J. Yang, editor, Biometrics, pages 199–216. InTech, Rijeka, Croatia, 2011. doi: 10.5772/18113.
- Agrafioti et al. [2012] F. Agrafioti, F. M. Bui, and D. Hatzinakos. Secure Telemedicine: Biometrics for Remote and Continuous Patient Verification. Journal of Computer Networks and Communications, 2012:924791, Nov. 2012. ISSN 2090-7141. doi: 10.1155/2012/924791.
- Agrafioti et al. [2016] F. Agrafioti, K. Martin, and S. Oung. Preauthorized wearable biometric device, system and method for use thereof, 2016. URL https://patents.google.com/patent/US9472033B2. Nymi Inc., US9472033B2, USA.
- Ahonen et al. [2006] T. Ahonen, A. Hadid, and M. Pietikainen. Face description with local binary patterns: Application to face recognition. IEEE Transactions on Pattern Analysis and Machine Intelligence, 28(12):2037–2041, Dec. 2006. ISSN 0162-8828. doi: 10.1109/TPAMI.2006.244.
- Akhter et al. [2016] N. Akhter, S. Tharewal, V. Kale, A. Bhalerao, and K. V. Kale. Heart-Based Biometrics and Possible Use of Heart Rate Variability in Biometric Recognition Systems. In R. Chaki, A. Cortesi, K. Saeed, and N. Chaki, editors, Advanced Computing and Systems for Security, volume 1, pages 15–29. Springer India, New Delhi, 2016. ISBN 978-81-322-2650-5. doi: 10.1007/978-81-322-2650-5_2.
- Albiero et al. [2020] V. Albiero, K. Krishnapriya, K. Vangara, K. Zhang, M. C. King, and K. W. Bowyer. Analysis of Gender Inequality In Face Recognition Accuracy. In IEEE Winter Applications of Computer Vision Workshops (WACVW), pages 81–89, Snowmass, CO, USA, Mar. 2020. doi: 10.1109/WACVW50321.2020.9096947.
- Albiero et al. [2022] V. Albiero, K. Zhang, M. C. King, and K. W. Bowyer. Gendered differences in face recognition accuracy explained by hairstyles, makeup, and facial morphology. IEEE Transactions on Information Forensics and Security, 17:127–137, Dec. 2022. ISSN 1556-6013. doi: 10.1109/TIFS.2021.3135750.
- Alduwaile and Islam [2020] D. Alduwaile and M. S. Islam. Single Heartbeat ECG Biometric Recognition using Convolutional Neural Network. In International Conference on Advanced Science and Engineering (ICOASE), pages 145–150, Duhok, Iraq, Dec. 2020. doi: 10.1109/ICOASE51841.2020.9436592.
- Almeida et al. [2016] M. Almeida, P. L. Correia, and P. K. Larsen. BioFoV – an open platform for forensic video analysis and biometric data extraction. In International Conference on Biometrics and Forensics (IWBF), pages 1–6, Limassol, Cyprus, Mar. 2016. doi: 10.1109/IWBF.2016.7449693.
- An et al. [2021] X. An, X. Zhu, Y. Gao, Y. Xiao, Y. Zhao, Z. Feng, L. Wu, B. Qin, M. Zhang, D. Zhang, et al. Partial FC: Training 10 Million Identities on a Single Machine. In IEEE/CVF International Conference on Computer Vision Workshops (ICCVW), pages 1445–1449, Montreal, QC, Canada, Oct. 2021. doi: 10.1109/ICCVW54120.2021.00166.
- Anwar and Raychowdhury [2020] A. Anwar and A. Raychowdhury. Masked face recognition for secure authentication. arXiv, 2020. URL https://arxiv.org/abs/2008.11104.
- Arashloo et al. [2017] S. R. Arashloo, J. Kittler, and W. Christmas. An anomaly detection approach to face spoofing detection: A new formulation and evaluation protocol. IEEE Access, 5:13868–13882, 2017. ISSN 2169-3536. doi: 10.1109/ACCESS.2017.2729161.
- Arya et al. [2015] S. Arya, N. Pratap, and K. Bhatia. Future of Face Recognition: A Review. Procedia Computer Science, 58:578–585, 2015. ISSN 1877-0509. doi: 10.1016/j.procs.2015.08.076.
- Atoui et al. [2010] H. Atoui, J. Fayn, and P. Rubel. A Novel Neural-Network Model for Deriving Standard 12-Lead ECGs From Serial Three-Lead ECGs: Application to Self-Care. IEEE Transactions on Information Technology in Biomedicine, 14(3):883–890, Apr. 2010. ISSN 1089-7771. doi: 10.1109/TITB.2010.2047754.
- Augusto et al. [2020] P. Augusto, J. S. Cardoso, and J. Fonseca. Automotive Interior Sensing – Towards a Synergetic Approach between Anomaly Detection and Action Recognition Strategies. In IEEE International Conference on Image Processing, Applications and Systems (IPAS), Genova, Italy, Dec. 2020. doi: 10.1109/IPAS50080.2020.9334942.
- Bakkes et al. [2013] S. Bakkes, C. T. Tan, and Y. Pisan. Personalised Gaming. The Journal of Creative Technologies, 3, May 2013. ISSN 2230-2115. URL https://ojs.aut.ac.nz/journal-of-creative-technologies/article/view/13.
- Bansal et al. [2017] A. Bansal, A. Nanduri, C. D. Castillo, R. Ranjan, and R. Chellappa. UMDFaces: An annotated face dataset for training deep networks. In IEEE International Joint Conference on Biometrics (IJCB), pages 464–473, Denver, CO, USA, Oct. 2017. doi: 10.1109/BTAS.2017.8272731.
- Barbosa [2022a] G. Barbosa. Going 2D: Exploring Learnable Bidimensional Approaches for ECG Biometrics. Master’s thesis, Universidade do Porto, Portugal, 2022a. URL https://hdl.handle.net/10216/142451.
- Barbosa [2022b] V. Barbosa. Robust occupant action classification in shared autonomous vehicles. Master’s thesis, Universidade do Porto, Portugal, 2022b. URL https://hdl.handle.net/10216/144736.
- Barnouti et al. [2016] N. H. Barnouti, S. S. M. Al-Dabbagh, and W. E. Matti. Face Recognition: A Literature Review". International Journal of Applied Information Systems, 11(4):21–31, Sep. 2016. ISSN 2249-0868. doi: 10.5120/ijais2016451597.
- Beco [2021] S. C. Beco. Make My Heartbeat: Generation and Interlead Conversion of ECG Signals. Master’s thesis, Universidade do Porto, Portugal, 2021. URL https://hdl.handle.net/10216/136092.
- Beco et al. [2021] S. C. Beco, J. R. Pinto, and J. S. Cardoso. Interlead Conversion of Single-Lead Blindly-Segmented Electrocardiogram Signals. In International Conference on Computational Intelligence Methods for Bioinformatics and Biostatistics (CIBB 2021), Avellino, Italy, Nov. 2021.
- Beco et al. [2022] S. C. Beco, J. R. Pinto, and J. S. Cardoso. Electrocardiogram Lead Conversion from Single-Lead Blindly-Segmented Signals. BMC Medical Informatics and Decision Making, 22:314, 2022. ISSN 1472-6947. doi: 10.1186/s12911-022-02063-6.
- Belgacem et al. [2012] N. Belgacem, A. Nait-Ali, R. Fournier, and F. Bereksi-Reguig. ECG based human authentication using wavelets and random forests. International Journal on Cryptography and Information Security, 2:1–11, 2012. ISSN 1839-8626. doi: 10.5121/ijcis.2012.2201.
- Belgacem et al. [2013] N. Belgacem, A. Nait-Ali, R. Fournier, and F. Bereksi-Reguig. ECG Based Human Identification Using Random Forests. In International Conference on E-Technologies and Business on the Web (EBW), Bangkok, Thailand, Mar. 2013.
- Belhumeur et al. [1997] P. N. Belhumeur, J. P. Hespanha, and D. J. Kriegman. Eigenfaces vs. Fisherfaces: recognition using class specific linear projection. IEEE Transactions on Pattern Analysis and Machine Intelligence, 19(7):711–720, July 1997. ISSN 0162-8828. doi: 10.1109/34.598228.
- Belkin et al. [2004] M. Belkin, I. Matveeva, and P. Niyogi. Regularization and Semi-supervised Learning on Large Graphs. In D. Hutchison, editor, Learning Theory, volume 3120, pages 624–638. Springer Berlin Heidelberg, Berlin, Heidelberg, 2004. ISBN 978-3-540-27819-1. doi: 10.1007/978-3-540-27819-1_43.
- Belo et al. [2020] D. Belo, N. Bento, H. Silva, A. Fred, and H. Gamboa. ECG Biometrics Using Deep Learning and Relative Score Threshold Classification. Sensors, 20(15):4078, 2020. ISSN 1424-8220. doi: 10.3390/s20154078.
- Benouis et al. [2021] M. Benouis, L. Mostefai, N. Costen, and M. Regouid. ECG based biometric identification using one-dimensional local difference pattern. Biomedical Signal Processing and Control, 64:102226, 2021. ISSN 1746-8094. doi: 10.1016/j.bspc.2020.102226.
- Bento et al. [2020] N. Bento, D. Belo, and H. Gamboa. ECG Biometrics Using Spectrograms and Deep Neural Networks. International Journal of Machine Learning and Computing, 10(2):259–264, Feb. 2020. ISSN 2010-3700. doi: 10.18178/ijmlc.2020.10.2.929.
- Beveridge et al. [2013] J. R. Beveridge, P. J. Phillips, D. S. Bolme, B. A. Draper, G. H. Givens, Y. M. Lui, M. N. Teli, H. Zhang, W. T. Scruggs, K. W. Bowyer, P. J. Flynn, and S. Cheng. The challenge of face recognition from digital point-and-shoot cameras. In IEEE International Conference on Biometrics: Theory, Applications and Systems (BTAS), pages 1–8, Arlington, VA, USA, Sep. 2013. doi: 10.1109/BTAS.2013.6712704.
- Bhattacharjee et al. [2019] S. Bhattacharjee, A. Mohammadi, A. Anjos, and S. Marcel. Recent Advances in Face Presentation Attack Detection, pages 207–228. Springer International Publishing, Cham, 2019. ISBN 978-3-319-92627-8. doi: 10.1007/978-3-319-92627-8_10.
- Bhowmik et al. [2011] M. K. Bhowmik, K. Saha, S. Majumder, G. Majumder, A. Saha, A. N. Sarma, D. Bhattacharjee, D. K. Basu, and M. Nasipuri. Thermal Infrared Face Recognition – A Biometric Identification Technique for Robust Security system. In P. M. Corcoran, editor, Reviews, Refinements and New Ideas in Face Recognition, chapter 6. IntechOpen, Rijeka, Croatia, 2011. doi: 10.5772/18986.
- Biel et al. [1999] L. Biel, O. Pettersson, L. Philipson, and P. Wide. ECG analysis: a new approach in human identification. In IEEE Instrumentation and Measurement Technology Conference (IMTC), pages 557–561, Venice, Italy, May 1999. doi: 10.1109/IMTC.1999.776813.
- Biel et al. [2001] L. Biel, O. Pettersson, L. Philipson, and P. Wide. ECG analysis: a new approach in human identification. IEEE Transactions on Instrumentation and Measurement, 50(3):808–812, June 2001. ISSN 0018-9456. doi: 10.1109/19.930458.
- Blum and Chawla [2001] A. Blum and S. Chawla. Learning from Labeled and Unlabeled Data using Graph Mincuts. In International Conference on Machine Learning (ICML), pages 19–26, Williamstown, MA, USA, June 2001. doi: 10.5555/645530.757779.
- Boddeti [2018] V. N. Boddeti. Secure face matching using fully homomorphic encryption. In IEEE International Conference on Biometrics: Theory, Applications, and Systems (BTAS), pages 1–10, Redondo Beach, CA, USA, Oct. 2018. doi: 10.1109/BTAS.2018.8698601.
- Bolle et al. [2004] R. M. Bolle, J. H. Connell, S. Pankanti, N. Ratha, and A. W. Senior. Guide to Biometrics. Springer Science+Business Media, New York, NY, first edition, 2004. ISBN 978-1-4419-2305-9. doi: 10.1007/978-1-4757-4036-3.
- Boumbarov et al. [2009] O. Boumbarov, Y. Velchev, and S. Sokolov. ECG personal identification in subspaces using radial basis neural networks. In IEEE International Workshop on Intelligent Data Acquisition and Advanced Computing Systems: Technology and Applications (IDAACS), pages 446–451, Rende, Italy, Sep. 2009. doi: 10.1109/IDAACS.2009.5342942.
- Bounyong et al. [2017] S. Bounyong, M. Yoshioka, and J. Ozawa. Monitoring of a driver’s heart rate using a microwave sensor and template-matching algorithm. In IEEE International Conference on Consumer Electronics (ICCE), pages 43–44, Las Vegas, NV, USA, Jan. 2017. doi: 10.1109/ICCE.2017.7889222.
- Bousseljot et al. [1995] R. Bousseljot, D. Kreiseler, and A. Schnabel. Nutzung der EKG-Signaldatenbank CARDIODAT der PTB über das Internet. Biomedizinische Technik, 40(s1):317–318, 1995. ISSN 1862-278X. doi: 10.1515/bmte.1995.40.s1.317.
- Boutros et al. [2021] F. Boutros, N. Damer, J. N. Kolf, K. Raja, F. Kirchbuchner, R. Ramachandra, A. Kuijper, P. Fang, C. Zhang, F. Wang, D. Montero, N. Aginako, B. Sierra, M. Nieto, M. E. Erakin, U. Demir, H. Kemal, Ekenel, A. Kataoka, K. Ichikawa, S. Kubo, J. Zhang, M. He, D. Han, S. Shan, K. Grm, V. Štruc, S. Seneviratne, N. Kasthuriarachchi, S. Rasnayaka, P. C. Neto, A. F. Sequeira, J. R. Pinto, M. Saffari, and J. S. Cardoso. MFR 2021: Masked Face Recognition Competition. In International Joint Conference on Biometrics (IJCB 2021), pages 1–10, Shenzhen, China, Aug. 2021. doi: 10.1109/IJCB52358.2021.9484337.
- Boutros et al. [2022a] F. Boutros, N. Damer, F. Kirchbuchner, and A. Kuijper. ElasticFace: Elastic Margin Loss for Deep Face Recognition. In IEEE/CVF Conference on Computer Vision and Pattern Recognition Workshops (CVPRW), pages 1578–1587, New Orleans, LA, USA, June 2022a. URL https://arxiv.org/pdf/2109.09416.pdf. (accepted).
- Boutros et al. [2022b] F. Boutros, N. Damer, F. Kirchbuchner, and A. Kuijper. Self-restrained triplet loss for accurate masked face recognition. Pattern Recognition, 124:108473, Apr. 2022b. ISSN 0031-3203. doi: 10.1016/j.patcog.2021.108473.
- Brakerski and Vaikuntanathan [2011] Z. Brakerski and V. Vaikuntanathan. Fully Homomorphic Encryption from Ring-LWE and Security for Key Dependent Messages. In Advances in Cryptology: Annual Cryptology Conference (CRYPTO), pages 505–524, Santa Barbara, CA, USA, Aug. 2011. doi: 10.1007/978-3-642-22792-9_29.
- Brás and Pinho [2015] S. Brás and A. J. Pinho. ECG biometric identification: A compression based approach. In Annual International Conference of the IEEE Engineering in Medicine and Biology Society (EMBC), pages 5838–5841, Milan, Italy, Aug. 2015. doi: 10.1109/EMBC.2015.7319719.
- Buciu and Gacsadi [2016] I. Buciu and A. Gacsadi. Biometrics systems and technologies: A survey. International Journal of Computers Communications & Control, 11(3):315–330, 2016. ISSN 1841-9844. doi: 10.15837/ijccc.2016.3.2556.
- Byeon et al. [2020] Y.-H. Byeon, S.-B. Pan, and K.-C. Kwak. Ensemble Deep Learning Models for ECG-based Biometrics. In Cybernetics & Informatics (K&I), pages 1–5, Velke Karlovice, Czech Republic, Jan. 2020. doi: 10.1109/KI48306.2020.9039871.
- Camara et al. [2018] C. Camara, P. Peris-Lopez, L. Gonzalez-Manzano, and J. Tapiador. Real-time electrocardiogram streams for continuous authentication. Applied Soft Computing, 68:784–794, July 2018. ISSN 1568-4946. doi: 10.1016/j.asoc.2017.07.032.
- Cao et al. [2018] Q. Cao, L. Shen, W. Xie, O. M. Parkhi, and A. Zisserman. VGGFace2: A Dataset for Recognising Faces across Pose and Age. In IEEE International Conference on Automatic Face & Gesture Recognition (FG), pages 67–74, Xi’an, China, May 2018. doi: 10.1109/FG.2018.00020.
- Cao et al. [2010] Z. Cao, Q. Yin, X. Tang, and J. Sun. Face recognition with learning-based descriptor. In IEEE Computer Society Conference on Computer Vision and Pattern Recognition (CVPR), pages 2707–2714, San Francisco, CA, USA, June 2010. doi: 10.1109/CVPR.2010.5539992.
- Capozzi et al. [2021a] L. Capozzi, J. R. Pinto, J. S. Cardoso, and A. Rebelo. End-to-end deep sketch-to-photo matching enforcing realistic photo generation. In Iberoamerican Congress on Pattern Recognition (CIARP), pages 451–460, Porto, Portugal, May 2021a. doi: 10.1007/978-3-030-93420-0_42.
- Capozzi et al. [2021b] L. Capozzi, J. R. Pinto, J. S. Cardoso, and A. Rebelo. Optimizing person re-identification using generated attention masks. In Iberoamerican Congress on Pattern Recognition (CIARP), pages 248–257, Porto, Portugal, May 2021b. doi: 10.1007/978-3-030-93420-0_24.
- Capozzi [2020] L. G. Capozzi. Face Recognition For Forensic Applications: Methods for Matching Facial Sketches to Mugshot Pictures. Master’s thesis, Universidade do Porto, Portugal, 2020. URL https://hdl.handle.net/10216/129080.
- Capozzi et al. [2021c] L. G. Capozzi, P. Carvalho, A. Sousa, C. Pinto, J. R. Pinto, and J. S. Cardoso. Impact of visual noise in activity recognition using deep neural networks - an experimental approach. In International Conference on Pattern Recognition and Machine Learning (PRML), Chengdu, China, 2021c. doi: 10.1109/PRML52754.2021.9520734.
- Capozzi et al. [2022] L. G. Capozzi, V. Barbosa, C. Pinto, J. R. Pinto, A. Pereira, P. M. Carvalho, and J. S. Cardoso. Toward vehicle occupant-invariant models for activity characterization. IEEE Access, 10:104215–104225, 2022. doi: 10.1109/ACCESS.2022.3210973.
- Carreira and Zisserman [2017] J. Carreira and A. Zisserman. Quo Vadis, Action Recognition? A New Model and the Kinetics Dataset. In IEEE Conference on Computer Vision and Pattern Recognition (CVPR), pages 4724–4733, Honolulu, HI, USA, July 2017. doi: 10.1109/CVPR.2017.502.
- Carreiras et al. [2016] C. Carreiras, A. Lourenço, H. Silva, A. Fred, and R. Ferreira. Evaluating Template Uniqueness in ECG Biometrics. In International Conference on Informatics in Control, Automation and Robotics (ICINCO), pages 111–123, Lisbon, Portugal, 2016. doi: 10.1007/978-3-319-26453-0_7.
- Carvalho et al. [2019a] D. V. Carvalho, E. M. Pereira, and J. S. Cardoso. Machine Learning Interpretability: A Survey on Methods and Metrics. Electronics, 8:832, 2019a. ISSN 2079-9292. doi: 10.3390/electronics8080832.
- Carvalho et al. [2019b] J. M. Carvalho, S. Brás, and A. J. Pinho. Compression-Based Classification of ECG Using First-Order Derivatives. In EAI International Conference on Intelligent Technologies for Interactive Entertainment (INTETAIN), pages 27–36, Guimarães, Portugal, Nov. 2019b. doi: 10.1007/978-3-030-16447-8_3.
- Chan et al. [2008] A. D. C. Chan, M. M. Hamdy, A. Badre, and V. Badee. Wavelet Distance Measure for Person Identification Using Electrocardiograms. IEEE Transactions on Instrumentation and Measurement, 57(2):248–253, Feb. 2008. ISSN 0018-9456. doi: 10.1109/TIM.2007.909996.
- Chapelle et al. [2006] O. Chapelle, B. Schölkopf, and A. Zien, editors. Semi-supervised learning. MIT Press, Cambridge, MA, USA, 2006. ISBN 978-0-262-03358-9.
- Chatfield et al. [2014] K. Chatfield, K. Simonyan, A. Vedaldi, and A. Zisserman. Return of the devil in the details: Delving deep into convolutional nets. In British Machine Vision Conference (BMVC), Nottingham, UK, Sep. 2014. URL http://www.bmva.org/bmvc/2014/files/paper054.pdf.
- Chechik et al. [2010] G. Chechik, V. Sharma, U. Shalit, and S. Bengio. Large scale online learning of image similarity through ranking. Journal of Machine Learning Research, 11:1109–1135, 2010. ISSN 1533-7928. URL https://www.jmlr.org/papers/volume11/chechik10a/chechik10a.pdf.
- Chen et al. [2017] W. Chen, X. Chen, J. Zhang, and K. Huang. Beyond Triplet Loss: A Deep Quadruplet Network for Person Re-identification. In IEEE Conference on Computer Vision and Pattern Recognition (CVPR), pages 1320–1329, Honolulu, HI, USA, July 2017. doi: 10.1109/CVPR.2017.145.
- Cheng et al. [2016] D. Cheng, Y. Gong, S. Zhou, J. Wang, and N. Zheng. Person Re-identification by Multi-Channel Parts-Based CNN with Improved Triplet Loss Function. In IEEE Conference on Computer Vision and Pattern Recognition (CVPR), pages 1335–1344, Las Vegas, NV, USA, June 2016. doi: 10.1109/CVPR.2016.149.
- Chi et al. [2010] Y. M. Chi, T. Jung, and G. Cauwenberghs. Dry-Contact and Noncontact Biopotential Electrodes: Methodological Review. IEEE Reviews in Biomedical Engineering, 3:106–119, 2010. ISSN 1937-3333. doi: 10.1109/RBME.2010.2084078.
- Chollet et al. [2015] F. Chollet et al. Keras, 2015. URL https://keras.io.
- Chong et al. [2019] L. Y. Chong, T. S. Ong, and A. B. J. Teoh. Feature fusions for 2.5D face recognition in Random Maxout Extreme Learning Machine. Applied Soft Computing, 75:358–372, 2019. ISSN 1568-4946. doi: 10.1016/j.asoc.2018.11.024.
- Choudhary and Manikandan [2015] T. Choudhary and M. S. Manikandan. A novel unified framework for noise-robust ECG-based biometric authentication. In International Conference on Signal Processing and Integrated Networks (SPIN), pages 186–191, Noida, India, Feb. 2015. doi: 10.1109/SPIN.2015.7095379.
- Chu et al. [2019] Y. Chu, H. Shen, and K. Huang. ECG Authentication Method Based on Parallel Multi-Scale One-Dimensional Residual Network With Center and Margin Loss. IEEE Access, 7:51598–51607, 2019. ISSN 2169-3536. doi: 10.1109/ACCESS.2019.2912519.
- Chun [2016] S. Y. Chun. Single pulse ECG-based small scale user authentication using guided filtering. In International Conference on Biometrics (ICB), pages 1–7, Halmstad, Sweden, June 2016. doi: 10.1109/ICB.2016.7550065.
- Cicchino [2017] J. B. Cicchino. Effectiveness of forward collision warning and autonomous emergency braking systems in reducing front-to-rear crash rates. Accident Analysis & Prevention, 99:142–152, 2017. ISSN 0001-4575. doi: 10.1016/j.aap.2016.11.009.
- Cicchino [2018] J. B. Cicchino. Effects of blind spot monitoring systems on police-reported lane-change crashes. Traffic Injury Prevention, 19(6):615–622, Feb. 2018. ISSN 0001-4575. doi: 10.1080/15389588.2018.1476973.
- Ciocoiu and Cleju [2019] I. B. Ciocoiu and N. Cleju. Off-the-person ECG Biometrics Using Convolutional Neural Networks. In International Symposium on Signals, Circuits and Systems (ISSCS), pages 1–4, Iasi, Romania, July 2019. doi: 10.1109/ISSCS.2019.8801783.
- Ciocoiu and Cleju [2020] I. B. Ciocoiu and N. Cleju. Off-Person ECG Biometrics Using Spatial Representations and Convolutional Neural Networks. IEEE Access, 8:218966–218981, 2020. ISSN 2169-3536. doi: 10.1109/ACCESS.2020.3042547.
- Cosbey et al. [2019] R. Cosbey, A. Wusterbarth, and B. Hutchinson. Deep Learning for Classroom Activity Detection from Audio. In IEEE International Conference on Acoustics, Speech and Signal Processing (ICASSP), pages 3727–3731, Brighton, UK, May 2019. doi: 10.1109/ICASSP.2019.8683365.
- Coutinho et al. [2010] D. P. Coutinho, A. L. N. Fred, and M. A. T. Figueiredo. One-Lead ECG-based Personal Identification Using Ziv-Merhav Cross Parsing. In International Conference on Pattern Recognition (ICPR), pages 3858–3861, Istanbul, Turkey, Aug. 2010. doi: 10.1109/ICPR.2010.940.
- Coutinho et al. [2011] D. P. Coutinho, A. L. N. Fred, and M. A. T. Figueiredo. ECG-based continuous authentication system using adaptive string matching. International Conference on Bio-Inspired Systems and Signal Processing (BIOSIGNALS), pages 354–359, Jan. 2011. doi: 10.5220/0003292003540359.
- Coutinho et al. [2013] D. P. Coutinho, H. Silva, H. Gamboa, A. Fred, and M. Figueiredo. Novel fiducial and non-fiducial approaches to electrocardiogram-based biometric systems. IET Biometrics, 2(2):64–75, June 2013. ISSN 2047-4938. doi: 10.1049/iet-bmt.2012.0055.
- Crowley [1997] J. L. Crowley. Vision for man-machine interaction. Robotics and Autonomous Systems, 19(3):347–358, 1997. ISSN 0921-8890. doi: 10.1016/S0921-8890(96)00061-9.
- Cubuk et al. [2019] E. D. Cubuk, B. Zoph, D. Mane, V. Vasudevan, and Q. V. Le. AutoAugment: Learning Augmentation Strategies From Data. In IEEE/CVF Conference on Computer Vision and Pattern Recognition (CVPR), pages 113–123, Long Beach, CA, USA, June 2019. doi: 10.1109/CVPR.2019.00020.
- Daimi et al. [2021] K. Daimi, N. Hazzazi, and M. Saed. Using Multimodal Biometrics to Secure Vehicles. In K. Daimi, H. R. Arabnia, L. Deligiannidis, M.-S. Hwang, and F. G. Tinetti, editors, Advances in Security, Networks, and Internet of Things, pages 567–584, London, UK, July 2021. doi: 10.1007/978-3-030-71017-0_41.
- Dalal and Triggs [2005] N. Dalal and B. Triggs. Histograms of oriented gradients for human detection. In IEEE Computer Society Conference on Computer Vision and Pattern Recognition (CVPR), pages 886–893, San Diego, CA, USA, June 2005. doi: 10.1109/CVPR.2005.177.
- Damer et al. [2020] N. Damer, J. H. Grebe, C. Chen, F. Boutros, F. Kirchbuchner, and A. Kuijper. The Effect of Wearing a Mask on Face Recognition Performance: An Exploratory Study. In International Conference of the Biometrics Special Interest Group (BIOSIG), volume P-306 of LNI, pages 1–10, Darmstadt, Germany, Sep. 2020. URL https://ieeexplore.ieee.org/document/9210999.
- Damer et al. [2022] N. Damer, F. Boutros, M. Süßmilch, M. Fang, F. Kirchbuchner, and A. Kuijper. Masked face recognition: Human versus machine. IET Biometrics, 2022. doi: 10.1049/bme2.12077. (in press).
- Dar et al. [2015a] M. N. Dar, M. U. Akram, A. Shaukat, and M. A. Khan. ECG Based Biometric Identification for Population with Normal and Cardiac Anomalies Using Hybrid HRV and DWT Features. In International Conference on IT Convergence and Security (ICITCS), pages 1–5, Kuala Lumpur, Malaysia, Aug. 2015a. doi: 10.1109/ICITCS.2015.7292977.
- Dar et al. [2015b] M. N. Dar, M. U. Akram, A. Usman, and S. A. Khan. ECG biometric identification for general population using multiresolution analysis of DWT based features. In International Conference on Information Security and Cyber Forensics (InfoSec), pages 5–10, Cape Town, South Africa, Nov. 2015b. doi: 10.1109/InfoSec.2015.7435498.
- de Melo et al. [2014] C. M. de Melo, A. Paiva, and J. Gratch. Emotion in Games, chapter 21, pages 573–592. John Wiley & Sons, Ltd, Mar. 2014. ISBN 9781118796443. doi: 10.1002/9781118796443.ch21.
- Deng et al. [2019] J. Deng, J. Guo, N. Xue, and S. Zafeiriou. ArcFace: Additive Angular Margin Loss for Deep Face Recognition. In IEEE/CVF Conference on Computer Vision and Pattern Recognition (CVPR), pages 4690–4699, Long Beach, CA, USA, June 2019. doi: 10.1109/CVPR.2019.00482.
- Deng et al. [2020] J. Deng, J. Guo, E. Ververas, I. Kotsia, and S. Zafeiriou. RetinaFace: Single-Shot Multi-Level Face Localisation in the Wild. In IEEE/CVF Conference on Computer Vision and Pattern Recognition (CVPR), pages 5202–5211, Seattle, WA, USA, June 2020. doi: 10.1109/CVPR42600.2020.00525.
- Deng et al. [2021] J. Deng, J. Guo, X. An, Z. Zhu, and S. Zafeiriou. Masked Face Recognition Challenge: The InsightFace Track Report. In IEEE/CVF International Conference on Computer Vision Workshops (ICCVW), pages 1437–1444, Montreal, BC, Canada, Oct. 2021. doi: 10.1109/ICCVW54120.2021.00165.
- Dhall et al. [2020] A. Dhall, G. Sharma, R. Goecke, and T. Gedeon. EmotiW 2020: Driver Gaze, Group Emotion, Student Engagement and Physiological Signal based Challenges. In ACM International Conference on Multimodal Interaction (ICMI), pages 784–789, Utrecht, The Netherlands, Oct. 2020. doi: 10.1145/3382507.3417973.
- Ding and Tao [2015] C. Ding and D. Tao. Robust Face Recognition via Multimodal Deep Face Representation. IEEE Transactions on Multimedia, 17(11):2049–2058, Nov. 2015. ISSN 1520-9210. doi: 10.1109/TMM.2015.2477042.
- Ding and Tao [2018] C. Ding and D. Tao. Trunk-Branch Ensemble Convolutional Neural Networks for Video-Based Face Recognition. IEEE Transactions on Pattern Analysis and Machine Intelligence, 40(4):1002–1014, Apr. 2018. ISSN 0162-8828. doi: 10.1109/TPAMI.2017.2700390.
- Doddington et al. [1998] G. Doddington, W. Liggett, A. Martin, M. Przybocki, and D. Reynolds. Sheep, Goats, Lambs and Wolves: A Statistical Analysis of Speaker Performance in the NIST 1998 Speaker Recognition Evaluation. Technical report, National Institute of Standards and Technology, Gaithersburg, MD, 1998. URL https://apps.dtic.mil/sti/pdfs/ADA528610.pdf.
- Dong et al. [2018] X. Dong, W. Si, and W. Huang. ECG-based identity recognition via deterministic learning. Biotechnology & Biotechnological Equipment, 32(3):769–777, Feb. 2018. ISSN 1310-2818. doi: 10.1080/13102818.2018.1428500.
- Doquire and Verleysen [2012] G. Doquire and M. Verleysen. A comparison of multivariate mutual information estimators for feature selection. In International Conference on Pattern Recognition Applications and Methods (ICPRAM), pages 176–185, Vilamoura, Portugal, Feb. 2012. doi: 10.5220/0003726101760185.
- Doshi-Velez and Kim [2017] F. Doshi-Velez and B. Kim. Towards a rigorous science of interpretable machine learning. arXiv, 2017. URL https://arxiv.org/pdf/1702.08608.pdf.
- Drozdowski et al. [2018] P. Drozdowski, S. Garg, C. Rathgeb, M. Gomez-Barrero, D. Chang, and C. Busch. Privacy-Preserving Indexing of Iris-Codes with Cancelable Bloom Filter-based Search Structures. In European Signal Processing Conference (EUSIPCO), pages 2360–2364, Rome, Italy, Sep. 2018. doi: 10.23919/EUSIPCO.2018.8553053.
- Drozdowski et al. [2019] P. Drozdowski, N. Buchmann, C. Rathgeb, M. Margraf, and C. Busch. On the Application of Homomorphic Encryption to Face Identification. In International Conference of the Biometrics Special Interest Group (BIOSIG), Darmstadt, Germany, Sep. 2019. URL https://ieeexplore.ieee.org/document/8897272.
- Eberz et al. [2017] S. Eberz, N. Paoletti, M. Roeschlin, M. Kwiatkowska, and I. Martinovic. Broken Hearted: How To Attack ECG Biometrics. In Network and Distributed System Security Symposium (NDSS), pages 1–15, San Diego, CA, USA, Feb. 2017. doi: 10.14722/ndss.2017.23408.
- Eduardo et al. [2017] A. Eduardo, H. Aidos, and A. L. N. Fred. ECG-based Biometrics using a Deep Autoencoder for Feature Learning: An Empirical Study on Transferability. In International Conference on Pattern Recognition Applications and Methods (ICPRAM), pages 463–470, Porto, Portugal, Feb. 2017. doi: 10.5220/0006195404630470.
- Ekman [1992] P. Ekman. An argument for basic emotions. Cognition and Emotion, 6(3-4):169–200, Jan. 1992. ISSN 0269-9931. doi: 10.1080/02699939208411068.
- Engelse and Zeelenberg [1979] W. A. H. Engelse and C. Zeelenberg. A single scan algorithm for QRS-detection and feature extraction. Computers in Cardiology, 6:37–42, 1979.
- Ergin et al. [2014] S. Ergin, A. K. Uysal, E. S. Gunal, S. Gunal, and M. B. Gulmezoglu. ECG based biometric authentication using ensemble of features. In Iberian Conference on Information Systems and Technologies (CISTI), pages 1–6, Barcelona, Spain, June 2014. doi: 10.1109/CISTI.2014.6877089.
- Esteves [2021] T. Esteves. Sleepy Drivers: Drowsiness Monitoring Using ECG and Face Video. Master’s thesis, Universidade Nova de Lisboa, Portugal, 2021.
- Esteves et al. [2021] T. Esteves, J. R. Pinto, P. M. Ferreira, P. Costa, L. A. Rodrigues, I. Antunes, G. Lopes, P. Gamito, A. Abrantes, P. M. Jorge, A. Lourenço, A. F. Sequeira, J. S. Cardoso, and A. Rebelo. AUTOMOTIVE: A case study on AUTOmatic multiMOdal drowsiness detecTIon for smart VEhicles. IEEE Access, 9:153678–153700, 2021. ISSN 2169-3536. doi: 10.1109/ACCESS.2021.3128016.
- Eyben [2016] F. Eyben. Real-time Speech and Music Classification by Large Audio Feature Space Extraction, volume 10 of Springer Theses. Springer Cham, 2016. ISBN 978-3-319-27299-3. doi: 10.1007/978-3-319-27299-3.
- Fan and Vercauteren [2012] J. Fan and F. Vercauteren. Somewhat practical fully homomorphic encryption. IACR Cryptology ePrint Archive, Report 2012/144, 2012. URL https://ia.cr/2012/144.
- Fang et al. [2022a] J. Fang, D. Yan, J. Qiao, J. Xue, and H. Yu. DADA: Driver Attention Prediction in Driving Accident Scenarios. IEEE Transactions on Intelligent Transportation Systems, 23(6):4959–4971, June 2022a. ISSN 1524-9050. doi: 10.1109/TITS.2020.3044678.
- Fang et al. [2022b] M. Fang, N. Damer, F. Kirchbuchner, and A. Kuijper. Real Masks and Spoof Faces: On the Masked Face Presentation Attack Detection. Pattern Recognition, 123:108398, Mar. 2022b. ISSN 0031-3203. doi: 10.1016/j.patcog.2021.108398.
- Fang et al. [2022c] M. Fang, N. Damer, F. Kirchbuchner, and A. Kuijper. Learnable Multi-level Frequency Decomposition and Hierarchical Attention Mechanism for Generalized Face Presentation Attack Detection. In IEEE/CVF Winter Conference on Applications of Computer Vision (WACV), pages 3722–3731, Waikoloa, HI, USA, Jan. 2022c. doi: 10.1109/WACV51458.2022.00120.
- Fang and Chan [2009] S.-C. Fang and H.-L. Chan. Human identification by quantifying similarity and dissimilarity in electrocardiogram phase space. Pattern Recognition, 42(9):1824–1831, Sep. 2009. ISSN 0031-3203. doi: 10.1016/j.patcog.2008.11.020.
- Farokhi et al. [2016] S. Farokhi, J. Flusser, and U. U. Sheikh. Near infrared face recognition: A literature survey. Computer Science Review, 21:1–17, Aug. 2016. ISSN 1574-0137. doi: 10.1016/j.cosrev.2016.05.003.
- Fatemian and Hatzinakos [2009] S. Z. Fatemian and D. Hatzinakos. A new ECG feature extractor for biometric recognition. In International Conference on Digital Signal Processing (ICDSP), pages 1–6, Santorini, Greece, July 2009. doi: 10.1109/ICDSP.2009.5201143.
- Fatemian et al. [2010] S. Z. Fatemian, F. Agrafioti, and D. Hatzinakos. HeartID: Cardiac biometric recognition. In IEEE International Conference on Biometrics: Theory, Applications and Systems (BTAS), pages 1–5, Washington, DC, USA, Sep. 2010. doi: 10.1109/BTAS.2010.5634493.
- Fatemifar et al. [2019] S. Fatemifar, M. Awais, S. R. Arashloo, and J. Kittler. Combining multiple one-class classifiers for anomaly based face spoofing attack detection. In International Conference on Biometrics (ICB), pages 1–7, Crete, Greece, June 2019. doi: 10.1109/ICB45273.2019.8987326.
- Feichtenhofer et al. [2019] C. Feichtenhofer, H. Fan, J. Malik, and K. He. SlowFast Networks for Video Recognition. In IEEE/CVF International Conference on Computer Vision (ICCV), pages 6201–6210, Seoul, South Korea, Oct. 2019. doi: 10.1109/ICCV.2019.00630.
- Feng et al. [2019] Z. Feng, C. Xu, and D. Tao. Self-Supervised Representation Learning by Rotation Feature Decoupling. In IEEE Conference on Computer Vision and Pattern Recognition (CVPR), pages 10356–10366, Long Beach, CA, USA, June 2019. doi: 10.1109/CVPR.2019.01061.
- Fernando et al. [2017] B. Fernando, H. Bilen, E. Gavves, and S. Gould. Self-Supervised Video Representation Learning With Odd-One-Out Networks. In IEEE Conference on Computer Vision and Pattern Recognition (CVPR), Honolulu, HI, USA, July 2017. doi: 10.1109/CVPR.2017.607.
- Ferreira [2020] J. G. Ferreira. Head Pose Estimation for Facial Biometric Recognition Systems. Master’s thesis, Universidade do Porto, Portugal, 2020. URL https://hdl.handle.net/10216/129254.
- Ferreira et al. [2018] P. M. Ferreira, F. Marques, J. S. Cardoso, and A. Rebelo. Physiological Inspired Deep Neural Networks for Emotion Recognition. IEEE Access, 6:53930–53943, Sep. 2018. ISSN 2169-3536. doi: 10.1109/ACCESS.2018.2870063.
- Ferreira et al. [2019] P. M. Ferreira, A. F. Sequeira, D. Pernes, A. Rebelo, and J. S. Cardoso. Adversarial learning for a robust iris presentation attack detection method against unseen attack presentations. In International Conference of the Biometrics Special Interest Group (BIOSIG), pages 1–7, Darmstadt, Germany, Sep. 2019. URL https://ieeexplore.ieee.org/document/8897269.
- Fratini et al. [2015] A. Fratini, M. Sansone, P. Bifulco, and M. Cesarelli. Individual identification via electrocardiogram analysis. BioMedical Engineering OnLine, 14(1):78, Aug. 2015. ISSN 1475-925X. doi: 10.1186/s12938-015-0072-y.
- Freni [2010] B. Freni. Template Editing and Replacement: Novel Methods for Biometric Template Selection and Update. PhD thesis, University of Cagliari, Italy, 2010. URL http://pralab.diee.unica.it/it/node/882.
- Friedrich and Yeshurun [2002] G. Friedrich and Y. Yeshurun. Seeing People in the Dark: Face Recognition in Infrared Images. In International Workshop on Biologically Motivated Computer Vision (BMCV), pages 348–359, Tübingen, Germany, Nov. 2002. doi: 10.1007/3-540-36181-2_35.
- Fu et al. [2021] B. Fu, F. Kirchbuchner, and N. Damer. The effect of wearing a face mask on face image quality. In IEEE International Conference on Automatic Face and Gesture Recognition (FG), pages 1–8, Jodhpur, India, Dec. 2021. doi: 10.1109/FG52635.2021.9667088.
- Furberg et al. [2017] R. D. Furberg, T. Taniguchi, B. Aagaard, A. M. Ortiz, M. Hegarty-Craver, K. H. Gilchrist, and T. A. Ridenour. Biometrics and Policing: A Protocol for Multichannel Sensor Data Collection and Exploratory Analysis of Contextualized Psychophysiological Response During Law Enforcement Operations. JMIR Research Protocols, 6(3):e44, Mar. 2017. ISSN 19290748. doi: 10.2196/resprot.7499.
- Galbally et al. [2007] J. Galbally, J. Fierrez, and J. Ortega-Garcia. Vulnerabilities in Biometric Systems: Attacks and Recent Advances in Liveness Detection. In Spanish Workshop on Biometrics (SWB 2007), Girona, Spain, June 2007. URL http://biometrics.eps.uam.es/fierrez/files/2007_SWB_VulnerabilitiesRecentAdvances_Galbally.pdf.
- García-González et al. [2013] M. García-González, A. Argelagós-Palau, M. Fernández-Chimeno, and J. Ramos-Castro. A comparison of heartbeat detectors for the seismocardiogram. In Computing in Cardiology (CinC), pages 461–464, Zaragoza, Spain, Sep. 2013. URL https://ieeexplore.ieee.org/document/6713413.
- Geng et al. [2020] M. Geng, P. Peng, Y. Huang, and Y. Tian. Masked face recognition with generative data augmentation and domain constrained ranking. In 28th ACM International Conference on Multimedia, pages 2246–2254, Lisbon, Portugal, Oct. 2020. doi: 10.1145/3394171.3413723.
- Genovese et al. [2019] A. Genovese, V. Piuri, and F. Scotti. Towards explainable face aging with generative adversarial networks. In IEEE International Conference on Image Processing (ICIP), pages 3806–3810, Taipei, Taiwan, Sep. 2019. doi: 10.1109/ICIP.2019.8803616.
- Gentry [2009] C. Gentry. A Fully Homomorphic Encryption Scheme. PhD thesis, Stanford University, USA, 2009. URL https://crypto.stanford.edu/craig/craig-thesis.pdf.
- George and Marcel [2020] A. George and S. Marcel. Learning one class representations for face presentation attack detection using multi-channel convolutional neural networks. IEEE Transactions on Information Forensics and Security, 16:361–375, July 2020. ISSN 1556-6013. doi: 10.1109/TIFS.2020.3013214.
- Ghofrani and Bostani [2010] N. Ghofrani and R. Bostani. Reliable features for an ECG-based biometric system. In Iranian Conference of Biomedical Engineering (ICBME), pages 1–5, Isfahan, Iran, Nov. 2010. doi: 10.1109/ICBME.2010.5704918.
- Ghorbani et al. [2019] A. Ghorbani, J. Wexler, J. Y. Zou, and B. Kim. Towards automatic concept-based explanations. In International Conference on Neural Information Processing Systems (NeurIPS), pages 9277–9286, Vancouver, BC, Canada, Dec. 2019. doi: 10.5555/3454287.3455119.
- Goldberger et al. [2000] A. L. Goldberger, L. A. N. Amaral, L. Glass, J. M. Hausdorff, P. C. Ivanov, R. G. Mark, J. E. Mietus, G. B. Moody, C.-K. Peng, and H. E. Stanley. PhysioBank, PhysioToolkit, and PhysioNet: Components of a New Research Resource for Complex Physiologic Signals. Circulation, 101(23):e215–e220, June 2000. doi: 10.1161/01.CIR.101.23.e215.
- Gomez et al. [2017] L. Gomez, Y. Patel, M. Rusinol, D. Karatzas, and C. V. Jawahar. Self-Supervised Learning of Visual Features Through Embedding Images Into Text Topic Spaces. In IEEE Conference on Computer Vision and Pattern Recognition (CVPR), pages 2017–2026, Honolulu, HI, USA, July 2017. doi: 10.1109/CVPR.2017.218.
- Gomez-Barrero et al. [2016] M. Gomez-Barrero, J. Fierrez, and J. Galbally. Variable-length template protection based on homomorphic encryption with application to signature biometrics. In International Workshop on Biometrics and Forensics (IWBF), pages 1–6, Limassol, Cyprus, Mar. 2016. doi: 10.1109/IWBF.2016.7449672.
- Gomez-Barrero et al. [2016] M. Gomez-Barrero, C. Rathgeb, J. Galbally, C. Busch, and J. Fierrez. Unlinkable and irreversible biometric template protection based on bloom filters. Information Sciences, 370-371:18–32, Nov. 2016. ISSN 0020-0255. doi: 10.1016/j.ins.2016.06.046.
- Gomez-Barrero et al. [2017] M. Gomez-Barrero, E. Maiorana, J. Galbally, P. Campisi, and J. Fierrez. Multi-biometric template protection based on homomorphic encryption. Pattern Recognition, 67:149–163, July 2017. ISSN 0031-3203. doi: 10.1016/j.patcog.2017.01.024.
- Gomez-Barrero et al. [2018] M. Gomez-Barrero, C. Rathgeb, G. Li, R. Ramachandra, J. Galbally, and C. Busch. Multi-biometric template protection based on bloom filters. Information Fusion, 42:37–50, Jul. 2018. ISSN 1566-2535. doi: 10.1016/j.inffus.2017.10.003.
- Gomez-Barrero et al. [2021] M. Gomez-Barrero, P. Drozdowski, C. Rathgeb, J. Patino, M. Todisco, A. Nautsch, N. Damer, J. Priesnitz, N. W. D. Evans, and C. Busch. Biometrics in the era of COVID-19: challenges and opportunities. arXiv, 2021. URL https://arxiv.org/abs/2102.09258.
- Gorodnichy et al. [2014] D. Gorodnichy, S. Yanushkevich, and V. Shmerko. Automated border control: Problem formalization. In IEEE Symposium on Computational Intelligence in Biometrics and Identity Management (CIBIM), pages 118–125, Orlando, FL, USA, Dec. 2014. doi: 10.1109/CIBIM.2014.7015452.
- Grande-Fidalgo et al. [2021] A. Grande-Fidalgo, J. Calpe, M. Redón, C. Millán-Navarro, and E. Soria-Olivas. Lead Reconstruction Using Artificial Neural Networks for Ambulatory ECG Acquisition. Sensors, 21(16):5542, Aug. 2021. doi: 10.3390/s21165542.
- Grother et al. [2010] P. J. Grother, G. W. Quinn, and P. J. Phillips. Report on the Evaluation of 2D Still-Image Face Recognition Algorithms. NIST Interagency Report, National Institute of Standards and Technology, Gaithersburg, MD, Aug. 2010. URL https://doi.org/10.6028/NIST.IR.7709.
- Guennoun et al. [2009] M. Guennoun, N. Abbad, J. Talom, S. M. M. Rahman, and K. El-Khatib. Continuous authentication by electrocardiogram data. In IEEE Toronto International Conference on Science and Technology for Humanity (TIC-STH), pages 40–42, Toronto, ON, Canada, Sep. 2009. doi: 10.1109/TIC-STH.2009.5444466.
- Guerra-Casanova et al. [2011] J. Guerra-Casanova, C. Sánchez-Ávila, A. S. Sierra, and G. B. del Pozo. Score optimization and template updating in a biometric technique for authentication in mobiles based on gestures. Journal of Systems and Software, 84(11):2013–2021, Nov. 2011. ISSN 0164-1212. doi: 10.1016/j.jss.2011.05.059.
- Guo et al. [2016] Y. Guo, L. Zhang, Y. Hu, X. He, and J. Gao. MS-Celeb-1M: A Dataset and Benchmark for Large-Scale Face Recognition. In European Conference on Computer Vision, pages 87–102, Amsterdam, The Netherlands, Oct. 2016. doi: 10.1007/978-3-319-46487-9_6.
- Gupta et al. [2018] A. Gupta, D. Agrawal, H. Chauhan, J. Dolz, and M. Pedersoli. An Attention Model for Group-Level Emotion Recognition. In ACM International Conference on Multimodal Interaction (ICMI), pages 611–615, Boulder, CO, USA, Oct. 2018. doi: 10.1145/3242969.3264985.
- Guven et al. [2018] G. Guven, H. Gürkan, and U.Guz. Biometric identification using fingertip electrocardiogram signals. Signal, Image and Video Processing, 12:933–940, Feb. 2018. ISSN 1863-1711. doi: 10.1007/s11760-018-1238-4.
- Hammad et al. [2019] M. Hammad, S. Zhang, and K. Wang. A novel two-dimensional ECG feature extraction and classification algorithm based on convolution neural network for human authentication. Future Generation Computer Systems, 101:180–196, Dec. 2019. ISSN 0167-739X. doi: 10.1016/j.future.2019.06.008.
- Hammad et al. [2020] M. Hammad, P. Pławiak, K. Wang, and U. R. Acharya. ResNet-Attention model for human authentication using ECG signals. Expert Systems, 38(6):e12547, Mar. 2020. ISSN 1468-0394. doi: 10.1111/exsy.12547.
- Hannun et al. [2014] A. Y. Hannun, C. Case, J. Casper, B. Catanzaro, G. Diamos, E. Elsen, R. Prenger, S. Satheesh, S. Sengupta, A. Coates, and A. Y. Ng. Deep Speech: Scaling up end-to-end speech recognition. arXiv, 2014. URL http://arxiv.org/abs/1412.5567.
- Hannun et al. [2019] A. Y. Hannun, P. Rajpurkar, M. Haghpanahi, G. H. Tison, C. Bourn, M. P. Turakhia, and A. Y. Ng. Cardiologist-level arrhythmia detection and classification in ambulatory electrocardiograms using a deep neural network. Nature Medicine, 25:65–69, Jan. 2019. ISSN 1546-170X. doi: 10.1038/s41591-018-0268-3.
- Hansen et al. [2015] I. H. Hansen, K. Hoppe, A. Gjerde, J. K. Kanters, and H. B. D. Sorensen. Comparing twelve-lead electrocardiography with close-to-heart patch based electrocardiography. In Annual International Conference of the IEEE Engineering in Medicine and Biology Society (EMBC), pages 330–333, Milan, Italy, Aug. 2015. doi: 10.1109/EMBC.2015.7318366.
- Hassaballah and Aly [2015] M. Hassaballah and S. Aly. Face recognition: challenges, achievements and future directions. IET Computer Vision, 9(4):614–626, Aug. 2015. ISSN 1751-9632. doi: 10.1049/iet-cvi.2014.0084.
- He et al. [2016] K. He, X. Zhang, S. Ren, and J. Sun. Deep Residual Learning for Image Recognition. In IEEE Conference on Computer Vision and Pattern Recognition (CVPR), pages 770–778, Las Vegas, NV, USA, June 2016. doi: 10.1109/CVPR.2016.90.
- Healey and Picard [2005] J. A. Healey and R. W. Picard. Detecting stress during real-world driving tasks using physiological sensors. IEEE Transactions on Intelligent Transportation Systems, 6(2):156–166, June 2005. ISSN 1524-9050. doi: 10.1109/TITS.2005.848368.
- Heilbron et al. [2015] F. C. Heilbron, V. Escorcia, B. Ghanem, and J. C. Niebles. ActivityNet: A large-scale video benchmark for human activity understanding. In IEEE Conference on Computer Vision and Pattern Recognition (CVPR), pages 961–970, Boston, MA, USA, June 2015. doi: 10.1109/CVPR.2015.7298698.
- Hejazi et al. [2016] M. Hejazi, S. Al-Haddad, Y. P. Singh, S. J. Hashim, and A. F. A. Aziz. ECG biometric authentication based on non-fiducial approach using kernel methods. Digital Signal Processing, 52:72–86, May 2016. ISSN 1051-2004. doi: 10.1016/j.dsp.2016.02.008.
- Hoekema et al. [1999] R. Hoekema, G. J. H. Uijen, and A. van Oosterom. Geometrical aspects of the inter-individual variability of multilead ECG recordings. In Computers in Cardiology 1999, volume 26, pages 499–502, Hannover, Germany, Sep. 1999. doi: 10.1109/CIC.1999.826017.
- Hoekema et al. [2001] R. Hoekema, G. J. H. Uijen, and A. van Oosterom. Geometrical aspects of the interindividual variability of multilead ECG recordings. IEEE Transactions on Biomedical Engineering, 48(5):551–559, May 2001. ISSN 0018-9294. doi: 10.1109/10.918594.
- Hofmanninger and Langs [2015] J. Hofmanninger and G. Langs. Mapping visual features to semantic profiles for retrieval in medical imaging. In IEEE Conference on Computer Vision and Pattern Recognition (CVPR), pages 457–465, Boston, MA, USA, June 2015. doi: 10.1109/CVPR.2015.7298643.
- Holzinger et al. [2019] A. Holzinger, G. Langs, H. Denk, K. Zatloukal, and H. Müller. Causability and explainabilty of artificial intelligence in medicine. Wiley Interdisciplinary Reviews: Data Mining and Knowledge Discovery, 9(4):e1312, Apr. 2019. ISSN 1942-4795. doi: 10.1002/widm.1312.
- Hu et al. [2018] J. F. Hu, W. S. Zheng, L. Ma, G. Wang, J. Lai, and J. Zhang. Early action prediction by soft regression. IEEE Transactions on Pattern Analysis and Machine Intelligence, 41(11):2568–2583, Aug. 2018. ISSN 0162-8828. doi: 10.1109/TPAMI.2018.2863279.
- Hu et al. [2022] Z. Hu, C. Lv, P. Hang, C. Huang, and Y. Xing. Data-Driven Estimation of Driver Attention Using Calibration-Free Eye Gaze and Scene Features. IEEE Transactions on Industrial Electronics, 69(2):1800–1808, Feb. 2022. ISSN 0278-0046. doi: 10.1109/TIE.2021.3057033.
- Huang and Learned-Miller [2014] G. B. Huang and E. Learned-Miller. Labeled Faces in the Wild: Updates and New Reporting Procedures. Technical Report UM-CS-2014-003, University of Massachusetts, Amherst, May 2014. URL http://vis-www.cs.umass.edu/lfw/lfw_update.pdf.
- Huang et al. [2007] G. B. Huang, M. Ramesh, T. Berg, and E. Learned-Miller. Labeled Faces in the Wild: A Database for Studying Face Recognition in Unconstrained Environments. Technical Report 07-49, University of Massachusetts, Amherst, Oct. 2007. URL http://vis-www.cs.umass.edu/lfw/lfw.pdf.
- Huang et al. [2020] Y. Huang, Y. Wang, Y. Tai, X. Liu, P. Shen, S. Li, J. Li, and F. Huang. CurricularFace: Adaptive Curriculum Learning Loss for Deep Face Recognition. In IEEE/CVF Conference on Computer Vision and Pattern Recognition (CVPR), pages 5901–5910, Seattle, WA, USA, June 2020. doi: 10.1109/CVPR42600.2020.00594.
- Huang et al. [2022] Y. Huang, G. Yang, K. Wang, H. Liu, and Y. Yin. Robust multi-feature collective non-negative matrix factorization for ECG biometrics. Pattern Recognition, 123:108376, Mar. 2022. ISSN 0031-3203. doi: 10.1016/j.patcog.2021.108376.
- Huang et al. [2015] Z. Huang, S. Shan, R. Wang, H. Zhang, S. Lao, A. Kuerban, and X. Chen. A Benchmark and Comparative Study of Video-Based Face Recognition on COX Face Database. IEEE Transactions on Image Processing, 24:5967–5981, Oct. 2015. ISSN 1057-7149. doi: 10.1109/TIP.2015.2493448.
- Huber et al. [2021] M. Huber, F. Boutros, F. Kirchbuchner, and N. Damer. Mask-invariant face recognition through template-level knowledge distillation. In IEEE International Conference on Automatic Face and Gesture Recognition (FG), pages 1–8, Jodhpur, India, Dec. 2021. doi: 10.1109/FG52635.2021.9667081.
- Hunter [2007] J. D. Hunter. Matplotlib: A 2D Graphics Environment. Computing in Science & Engineering, 9(3):90–95, June 2007. ISSN 1521-9615. doi: 10.1109/MCSE.2007.55.
- Hutchison and Anagnostopoulos [2008] D. Hutchison and G. Anagnostopoulos. Proceedings of the Joint IAPR International Workshop, SSPR & SPRStructural, Syntactic, and Statistical Pattern Recognition, Orlando, USA, December 4-6, 2008. Springer Berlin Heidelberg, Berlin, Heidelberg, 2008. ISBN 978-3-540-89689-0. doi: 10.1007/978-3-540-89689-0.
- Ibtehaz et al. [2021] N. Ibtehaz, M. E. H. Chowdhury, A. Khandakar, S. Kiranyaz, M. S. Rahman, A. Tahir, Y. Qiblawey, and T. Rahman. EDITH : ECG Biometrics Aided by Deep Learning for Reliable Individual Authentication. IEEE Transactions on Emerging Topics in Computational Intelligence, 6(4):928–940, Dec. 2021. ISSN 2471-285X. doi: 10.1109/TETCI.2021.3131374.
- Ignatenko and Willems [2012] T. Ignatenko and F. M. Willems. Biometric security from an information-theoretical perspective. Foundations and Trends in Communications and Information Theory, 7(2–3):135–316, Feb. 2012. ISSN 1567-2190. doi: 10.1561/0100000051.
- Ingale et al. [2020] M. Ingale, R. Cordeiro, S. Thentu, Y. Park, and N. Karimian. ECG Biometric Authentication: A Comparative Analysis. IEEE Access, 8:117853–117866, June 2020. ISSN 2169-3536. doi: 10.1109/ACCESS.2020.3004464.
- Iqbal et al. [2014] F.-t.-Z. Iqbal, K. A. Sidek, N. A. Noah, and T. S. Gunawan. A comparative analysis of QRS and Cardioid Graph Based ECG Biometric Recognition in different Physiological conditions. In IEEE International Conference on Smart Instrumentation, Measurement and Applications (ICSIMA), pages 1–5, Kuala Lumpur, Malaysia, Nov. 2014. doi: 10.1109/ICSIMA.2014.7047431.
- Irvine et al. [2008] J. M. Irvine, S. A. Israel, W. T. Scruggs, and W. J. Worek. eigenPulse: Robust human identification from cardiovascular function. Pattern Recognition, 41(11):3427–3435, Nov. 2008. ISSN 0031-3203. doi: 10.1016/j.patcog.2008.04.015.
- Islam et al. [2017] M. A. Islam, S. Naha, M. Rochan, N. Bruce, and Y. Wang. Label Refinement Network for Coarse-to-Fine Semantic Segmentation. arXiv, 2017. URL https://arxiv.org/pdf/1703.00551.pdf.
- Islam and Alajlan [2017] M. S. Islam and N. Alajlan. Biometric template extraction from a heartbeat signal captured from fingers. Multimedia Tools and Applications, 76(10):12709–12733, May 2017. ISSN 1573-7721. doi: 10.1007/s11042-016-3694-6.
- ISO/IEC JTC1 SC37 [2017] ISO/IEC JTC1 SC37. Information Technology - Biometrics - Presentation attack detection Part 3: Testing and Reporting. Technical Report ISO/IEC 30107-3:2017, International Organization for Standardization, 2017. URL https://www.iso.org/standard/67381.html.
- Israel et al. [2005] S. A. Israel, J. M. Irvine, A. Cheng, M. D. Wiederhold, and B. K. Wiederhold. ECG to identify individuals. Pattern Recognition, 38(1):133–142, Jan. 2005. ISSN 0031-3203. doi: 10.1016/j.patcog.2004.05.014.
- Ivanciu et al. [2021] L. Ivanciu, I.-A. Ivanciu, P. Farago, M. Roman, and S. Hintea. An ECG-based Authentication System Using Siamese Neural Networks. Journal of Medical and Biological Engineering, 41(4):558–570, June 2021. ISSN 2199-4757. doi: 10.1007/s40846-021-00637-9.
- Iyengar et al. [1996] N. Iyengar, C. K. Peng, R. Morin, A. L. Goldberger, and L. A. Lipsitz. Age-related alterations in the fractal scaling of cardiac interbeat interval dynamics. American Journal of Physiology-Regulatory, Integrative and Comparative Physiology, 271(4):R1078–R1084, Oct. 1996. ISSN 0363-6119. doi: 10.1152/ajpregu.1996.271.4.R1078.
- Jager et al. [2003] F. Jager, A. Taddei, G. B. Moody, M. Emdin, G. Antolic, R. Dorn, A. Smrdel, C. Marchesi, and R. G. Mark. Long-term ST database: A reference for the development and evaluation of automated ischaemia detectors and for the study of the dynamics of myocardial ischaemia. Medical & Biological Engineering & Computing, 41(2):172–183, Mar. 2003. ISSN 1741-0444. doi: 10.1007/BF02344885.
- Jahiruzzaman and Hossain [2015] M. Jahiruzzaman and A. B. M. A. Hossain. ECG based biometric human identification using chaotic encryption. In International Conference on Electrical Engineering and Information Communication Technology (ICEEICT), pages 1–5, Savar, Bangladesh, May 2015. doi: 10.1109/ICEEICT.2015.7307417.
- Jain and Kumar [2012] A. K. Jain and A. Kumar. Biometric Recognition: An Overview. In E. Mordini and D. Tzovaras, editors, Second Generation Biometrics: The Ethical, Legal and Social Context, pages 49–79. Springer Netherlands, Dordrecht, 2012. ISBN 978-94-007-3892-8. doi: 10.1007/978-94-007-3892-8_3.
- Jain et al. [1999] A. K. Jain, R. Bolle, and S. Pankanti. Biometrics: Personal Identification in Networked Society. Kluwer Academic Publishers, 1999. ISBN 978-0-306-47044-8. doi: 10.1007/b117227.
- Jain et al. [2008] A. K. Jain, K. Nandakumar, and A. Nagar. Biometric template security. EURASIP Journal on Advances in Signal Processing, 2008:113:1–113:17, Jan. 2008. ISSN 1687-6172. doi: 10.1155/2008/579416.
- Jain et al. [2011] A. K. Jain, A. A. Ross, and K. Nandakumar. Introduction to Biometrics. Springer Publishing Company, Incorporated, 2011. ISBN 9780387773254. doi: 10.1007/978-0-387-77326-1.
- Jain and Kant [2015] R. Jain and C. Kant. Attacks on Biometric Systems: An Overview. International Journal of Advances in Scientific Research, 1(7):283–288, Sep. 2015. ISSN 2395-3616. doi: 10.7439/ijasr.v1i7.1975.
- Jain and Learned-Miller [2010] V. Jain and E. Learned-Miller. FDDB: A Benchmark for Face Detection in Unconstrained Settings. Technical Report UM-CS-2010-009, University of Massachusetts, Amherst, 2010. URL http://vis-www.cs.umass.edu/fddb/fddb.pdf.
- Jeevan et al. [2022] G. Jeevan, G. C. Zacharias, M. S. Nair, and J. Rajan. An empirical study of the impact of masks on face recognition. Pattern Recognition, 122:108308, Feb. 2022. ISSN 0031-3203. doi: 10.1016/j.patcog.2021.108308.
- Jenkins et al. [2011] R. Jenkins, D. White, X. V. Montfort, and A. M. Burton. Variability in photos of the same face. Cognition, 121(3):313–323, Dec. 2011. ISSN 0010-0277. doi: 10.1016/j.cognition.2011.08.001.
- Jiang and Zeng [2021] H. Jiang and D. Zeng. Explainable Face Recognition Based on Accurate Facial Compositions. In IEEE/CVF International Conference on Computer Vision (ICCV), pages 1503–1512, Montreal, QC, Canada, Oct. 2021. doi: 10.1109/ICCVW54120.2021.00175.
- Jourabloo et al. [2018] A. Jourabloo, Y. Liu, and X. Liu. Face De-spoofing: Anti-spoofing via Noise Modeling. In European Conference on Computer Vision (ECCV), pages 297–315, Münich, Germany, Sep. 2018. doi: 10.1007/978-3-030-01261-8_18.
- Juels and Wattenberg [1999] A. Juels and M. Wattenberg. A Fuzzy Commitment Scheme. In ACM Conference on Computer and Communications Security, pages 28–36, Kent Ridge Digital Labs, Singapore, Nov. 1999. doi: 10.1145/319709.319714.
- Jyotishi and Dandapat [2020] D. Jyotishi and S. Dandapat. An LSTM-Based Model for Person Identification Using ECG Signal. IEEE Sensors Letters, 4(8):6001904, Aug. 2020. ISSN 2475-1472. doi: 10.1109/LSENS.2020.3012653.
- Karimian et al. [2017a] N. Karimian, Z. Guo, M. Tehranipoor, and D. Forte. Highly Reliable Key Generation From Electrocardiogram (ECG). IEEE Transactions on Biomedical Engineering, 64(6):1400–1411, June 2017a. ISSN 0018-9294. doi: 10.1109/TBME.2016.2607020.
- Karimian et al. [2017b] N. Karimian, D. L. Woodard, and D. Forte. On the vulnerability of ECG verification to online presentation attacks. In IEEE International Joint Conference on Biometrics (IJCB), pages 143–151, Denver, CO, USA, Oct. 2017b. doi: 10.1109/BTAS.2017.8272692.
- Karpathy et al. [2014] A. Karpathy, G. Toderici, S. Shetty, T. Leung, R. Sukthankar, and L. Fei-Fei. Large-Scale Video Classification with Convolutional Neural Networks. In IEEE Conference on Computer Vision and Pattern Recognition (CVPR), pages 1725–1732, Columbus, OH, USA, June 2014. doi: 10.1109/CVPR.2014.223.
- Kaur et al. [2014] G. Kaur, G. Singh, and V. Kumar. A Review on Biometric Recognition. International Journal of Bio-Science and Bio-Technology, 6(4):69–76, Aug. 2014. ISSN 2233-7849. doi: 10.14257/ijbsbt.2014.6.4.07.
- Kazakos et al. [2019] E. Kazakos, A. Nagrani, A. Zisserman, and D. Damen. EPIC-Fusion: Audio-Visual Temporal Binding for Egocentric Action Recognition. In IEEE/CVF International Conference on Computer Vision (ICCV), pages 5491–5500, Seoul, South Korea, Oct. 2019. doi: 10.1109/ICCV.2019.00559.
- Kim and Pyun [2020] B.-H. Kim and J.-Y. Pyun. ECG Identification For Personal Authentication Using LSTM-Based Deep Recurrent Neural Networks. Sensors, 20(11):3069, May 2020. ISSN 1424-8220. doi: 10.3390/s20113069.
- Kim et al. [2022] H. Kim, T. Q. Phan, W. Hong, and S. Y. Chun. Physiology-based augmented deep neural network frameworks for ECG biometrics with short ECG pulses considering varying heart rates. Pattern Recognition Letters, 156:1–6, Apr. 2022. ISSN 0167-8655. doi: 10.1016/j.patrec.2022.02.014.
- Kim and Lim [2018] H. J. Kim and J. S. Lim. Study on a Biometric Authentication Model based on ECG using a Fuzzy Neural Network. IOP Conference Series: Materials Science and Engineering, 317(1):012030, Mar. 2018. ISSN 1757-899X. doi: 10.1088/1757-899X/317/1/012030.
- King [2009] D. E. King. Dlib-ml: A machine learning toolkit. Journal of Machine Learning Research, 10:1755–1758, Sep. 2009. ISSN 1533-7928. URL https://www.jmlr.org/papers/volume10/king09a/king09a.pdf.
- Kingma and Ba [2015] D. P. Kingma and J. Ba. Adam: A method for stochastic optimization. In International Conference on Learning Representations (ICLR), San Diego, CA, USA, May 2015. URL https://arxiv.org/pdf/1412.6980.
- Kjeldsen and Kender [1996] R. Kjeldsen and J. Kender. Finding skin in color images. In International Conference on Automatic Face and Gesture Recognition (AFGR), pages 312–317, Killington, VT, USA, Oct. 1996. doi: 10.1109/AFGR.1996.557283.
- Kokhlikyan et al. [2019] N. Kokhlikyan, V. Miglani, M. Martin, E. Wang, J. Reynolds, A. Melnikov, N. Lunova, and O. Reblitz-Richardson. Pytorch captum. GitHub repository, 2019. URL https://github.com/pytorch/captum.
- Kokkinos and Margaritis [2017] Y. Kokkinos and K. Margaritis. Local learning regularization networks for localized regression. Neural Computing and Applications, 28(6):1309–1328, June 2017. ISSN 1433-3058. doi: 10.1007/s00521-016-2569-0.
- Kolberg et al. [2020] J. Kolberg, P. Drozdowski, M. Gomez-Barrero, C. Rathgeb, and C. Busch. Efficiency Analysis of Post-quantum-secure Face Template Protection Schemes based on Homomorphic Encryption. In International Conference of the Biometrics Special Interest Group (BIOSIG), pages 1–4, Darmstadt, Germany, Sep. 2020. URL https://ieeexplore.ieee.org/document/9211046.
- Komeili et al. [2018a] M. Komeili, N. Armanfard, and D. Hatzinakos. Liveness Detection and Automatic Template Updating Using Fusion of ECG and Fingerprint. IEEE Transactions on Information Forensics and Security, 13(7):1810–1822, July 2018a. ISSN 1556-6013. doi: 10.1109/TIFS.2018.2804890.
- Komeili et al. [2018b] M. Komeili, W. Louis, N. Armanfard, and D. Hatzinakos. Feature Selection for Nonstationary Data: Application to Human Recognition Using Medical Biometrics. IEEE Transactions on Cybernetics, 48(5):1446–1459, 2018b. doi: 10.1109/TCYB.2017.2702059.
- Kong et al. [2017] Y. Kong, Z. Tao, and Y. Fu. Deep Sequential Context Networks for Action Prediction. In IEEE Conference on Computer Vision and Pattern Recognition (CVPR), pages 3662–3670, Honolulu, HI, USA, July 2017. doi: 10.1109/CVPR.2017.390.
- Kotikalapudi and contributors [2017] R. Kotikalapudi and contributors. keras-vis. GitHub repository, 2017. URL https://github.com/raghakot/keras-vis.
- Kozachenko and Leonenko [1987] L. F. Kozachenko and N. N. Leonenko. Sample estimate of the entropy of a random vector. Problemy Peredachi Informatsii, 23(2):9–16, 1987. URL http://www.mathnet.ru/links/405e4bfe8c7f510915a53ee592a0dbaf/ppi797.pdf.
- Kraskov et al. [2004] A. Kraskov, H. Stögbauer, and P. Grassberger. Estimating mutual information. Physical Review E, 69:066138, June 2004. ISSN 2470-0045. doi: 10.1103/PhysRevE.69.066138.
- Kreiseler and Bousseljot [1995] D. Kreiseler and R. Bousseljot. Automatisierte EKG-Auswertung mit Hilfe der EKG-Signaldatenbank CARDIODAT der PTB. Biomedizinische Technik, 40(s1):319–320, 1995. ISSN 1862-278X. doi: 10.1515/bmte.1995.40.s1.319.
- Krizhevsky et al. [2012] A. Krizhevsky, I. Sutskever, and G. E. Hinton. ImageNet classification with deep convolutional neural networks. In International Conference on Neural Information Processing Systems (NeurIPS), pages 1097–1105, Lake Tahoe, NV, USA, Dec. 2012. doi: 10.5555/2999134.2999257.
- Kumar et al. [2019] A. Kumar, A. Kaur, and M. Kumar. Face detection techniques: a review. Artificial Intelligence Review, 52(2):927–948, Aug. 2019. ISSN 1573-7462. doi: 10.1007/s10462-018-9650-2.
- Kyoso and Uchiyama [2001a] M. Kyoso and A. Uchiyama. Development of an ECG identification system. In Annual International Conference of the IEEE Engineering in Medicine and Biology Society, pages 3721–3723, Istanbul, Turkey, Oct. 2001a. doi: 10.1109/IEMBS.2001.1019645.
- Kyoso and Uchiyama [2001b] M. Kyoso and A. Uchiyama. Development of ECG Identification System. Japanese Journal of Medical Electronics and Biological Engineering, 39(Supplement):559, May 2001b. doi: 10.11239/jsmbe1963.39.Supplement_559.
- Kyoso et al. [2000] M. Kyoso, K. Ohishi, and A. Uchiyama. Development of ECG Identification System. Japanese Journal of Medical Electronics and Biological Engineering, 38(Supplement):392, May 2000. doi: 10.11239/jsmbe1963.38.Supplement_388.
- Labati et al. [2013] R. D. Labati, R. Sassi, and F. Scotti. ECG biometric recognition: Permanence analysis of QRS signals for 24 hours continuous authentication. In IEEE International Workshop on Information Forensics and Security (WIFS), pages 31–36, Guangzhou, China, Nov. 2013. doi: 10.1109/WIFS.2013.6707790.
- Labati et al. [2014] R. D. Labati, V. Piuri, R. Sassi, F. Scotti, and G. Sforza. Adaptive ECG biometric recognition: a study on re-enrollment methods for QRS signals. In IEEE Symposium on Computational Intelligence in Biometrics and Identity Management (CIBIM), pages 30–37, Orlando, FL, USA, Dec. 2014. doi: 10.1109/CIBIM.2014.7015440.
- Labati et al. [2019] R. D. Labati, E. Muñoz, V. Piuri, R. Sassi, and F. Scotti. Deep-ECG: Convolutional Neural Networks for ECG biometric recognition. Pattern Recognition Letters, 126:78–85, Sep. 2019. ISSN 0167-8655. doi: 10.1016/j.patrec.2018.03.028.
- Laguna et al. [1997] P. Laguna, R. G. Mark, A. Goldberger, and G. B. Moody. A Database for Evaluation of Algorithms for Measurement of QT and Other Waveform Intervals in the ECG. In Computers in Cardiology (CinC), pages 673–676, Lund, Sweden, Sep. 1997. doi: 10.1109/CIC.1997.648140.
- Lang [1995] P. J. Lang. The Emotion Probe: Studies of Motivation and Attention. American Psychologist, 50(5):372–385, 1995. ISSN 0003-066X. doi: 10.1037/0003-066X.50.5.372.
- Lapuschkin et al. [2016] S. Lapuschkin, A. Binder, G. Montavon, K.-R. Muller, and W. Samek. Analyzing Classifiers: Fisher Vectors and Deep Neural Networks. In IEEE Conference on Computer Vision and Pattern Recognition (CVPR), pages 2912–2920, Las Vegas, NV, USA, June 2016. doi: 10.1109/CVPR.2016.318.
- LeCun et al. [2015] Y. LeCun, Y. Bengio, and G. Hinton. Deep learning. Nature, 521:436–444, May 2015. ISSN 1476-4687. doi: 10.1038/nature14539.
- Lee et al. [2017] H. J. Lee, D. S. Lee, H. B. Kwon, D. Y. Kim, and K. S. Park. Reconstruction of 12-lead ECG Using a Single-patch Device. Methods of Information in Medicine, 56(4):319–327, Aug. 2017. ISSN 0026-1270. doi: 10.3414/ME16-01-0067.
- Lee et al. [2020] J.-E. Lee, K.-T. Oh, B. Kim, and S. K. Yoo. Synthesis of Electrocardiogram V-Lead Signals From Limb-Lead Measurement Using R-Peak Aligned Generative Adversarial Network. IEEE Journal of Biomedical and Health Informatics, 24(5):1265–1275, Aug. 2020. ISSN 2168-2194. doi: 10.1109/JBHI.2019.2936583.
- Lee and Kwak [2022] J.-N. Lee and K.-C. Kwak. ECG-Based Biometrics Using a Deep Network Based on Independent Component Analysis. IEEE Access, 10:12913–12926, Jan. 2022. ISSN 2169-3536. doi: 10.1109/ACCESS.2022.3147807.
- Lee et al. [2018] W. Lee, S. Kim, and D. Kim. Individual Biometric Identification Using Multi-Cycle Electrocardiographic Waveform Patterns. Sensors, 18(4):1005, Mar. 2018. ISSN 1424-8220. doi: 10.3390/s18041005.
- Lehmann and Buschek [2020] F. Lehmann and D. Buschek. Heartbeats in the Wild: A Field Study Exploring ECG Biometrics in Everyday Life. In Conference on Human Factors in Computing Systems (CHI), pages 1–14, Honolulu, HI, USA, Apr. 2020. doi: 10.1145/3313831.3376536.
- Li et al. [2020a] C. Li, S. Ge, D. Zhang, and J. Li. Look Through Masks: Towards Masked Face Recognition with De-Occlusion Distillation. In ACM International Conference on Multimedia (MM), pages 3016–3024, Seattle, WA, USA, Oct. 2020a. doi: 10.1145/3394171.3413960.
- Li et al. [2018] H. Li, W. Li, H. Cao, S. Wang, F. Huang, and A. C. Kot. Unsupervised domain adaptation for face anti-spoofing. IEEE Transactions on Information Forensics and Security, 13(7):1794–1809, Feb. 2018. ISSN 1556-6013. doi: 10.1109/TIFS.2018.2801312.
- Li and Narayanan [2010] M. Li and S. Narayanan. Robust ECG Biometrics by Fusing Temporal and Cepstral Information. In International Conference on Pattern Recognition (ICPR), pages 1326–1329, Istanbul, Turkey, Aug. 2010. doi: 10.1109/ICPR.2010.330.
- Li et al. [2022] M. Li, Y. Si, W. Yang, and Y. Yu. ET-UMAP integration feature for ECG biometrics using Stacking. Biomedical Signal Processing and Control, 71(B):103159, Jan. 2022. ISSN 1746-8094. doi: 10.1016/j.bspc.2021.103159.
- Li et al. [2020b] R. Li, G. Yang, K. Wang, Y. Huang, F. Yuan, and Y. Yin. Robust ECG biometrics using GNMF and sparse representation. Pattern Recognition Letters, 129:70–76, Jan. 2020b. ISSN 0167-8655. doi: 10.1016/j.patrec.2019.11.005.
- Li et al. [2013] S. Li, D. Yi, Z. Lei, and S. Liao. The CASIA NIR-VIS 2.0 Face Database. In IEEE Conference on Computer Vision and Pattern Recognition Workshops (CVPRW), pages 348–353, Portland, OR, USA, June 2013. doi: 10.1109/CVPRW.2013.59.
- Li et al. [2019] X. Li, S. Liu, S. De Mello, X. Wang, J. Kautz, and M.-H. Yang. Joint-task self-supervised learning for temporal correspondence. In International Conference on Neural Information Processing Systems (NeurIPS), pages 318–328, Vancouver, BC, Canada, Dec. 2019. doi: 10.5555/3454287.3454316.
- Li et al. [2020c] Y. Li, Y. Pang, K. Wang, and X. Li. Toward improving ECG biometric identification using cascaded convolutional neural networks. Neurocomputing, 391:83–95, May 2020c. ISSN 0925-2312. doi: 10.1016/j.neucom.2020.01.019.
- Li et al. [2021] Y. Li, K. Guo, Y. Lu, and L. Liu. Cropping and attention based approach for masked face recognition. Applied Intelligence, 51(5):3012–3025, Feb. 2021. ISSN 1573-7497. doi: 10.1007/s10489-020-02100-9.
- li Liu et al. [2021] Y. li Liu, W. Yan, and B. Hu. Resistance to facial recognition payment in China: The influence of privacy-related factors. Telecommunications Policy, 45(5):102155, June 2021. ISSN 0308-5961. doi: 10.1016/j.telpol.2021.102155.
- Liang and Thomaz [2019] D. Liang and E. Thomaz. Audio-Based Activities of Daily Living (ADL) Recognition with Large-Scale Acoustic Embeddings from Online Videos. Proceedings of the ACM on Interactive, Mobile, Wearable and Ubiquitous Technologies (IMWUT), 3(1):17, Mar. 2019. ISSN 2474-9567. doi: 10.1145/3314404.
- Lim et al. [2020] J. Z. Lim, J. Mountstephens, and J. Teo. Emotion Recognition Using Eye-Tracking: Taxonomy, Review and Current Challenges. Sensors, 20(8):2384, Apr. 2020. ISSN 1424-8220. doi: 10.3390/s20082384.
- Lim et al. [2019] S. Lim, I. Kim, T. Kim, C. Kim, and S. Kim. Fast AutoAugment. In International Conference on Neural Information Processing Systems (NeurIPS), pages 6665–675, Dec. 2019. doi: 10.5555/3454287.3454885.
- Lin et al. [2014] S. L. Lin, C. K. Chen, C. L. Lin, W. C. Yang, and C. T. Chiang. Individual identification based on chaotic electrocardiogram signals during muscular exercise. IET Biometrics, 3(4):257–266, 2014. ISSN 2047-4938. doi: 10.1049/iet-bmt.2013.0014.
- Liu and Wechsler [2002] C. Liu and H. Wechsler. Gabor feature based classification using the enhanced fisher linear discriminant model for face recognition. IEEE Transactions on Image Processing, 11(4):467–476, Apr. 2002. ISSN 1057-7149. doi: 10.1109/TIP.2002.999679.
- Liu et al. [2021] D. Liu, X. Gao, C. Peng, N. Wang, and J. Li. Heterogeneous Face Interpretable Disentangled Representation for Joint Face Recognition and Synthesis. IEEE Transactions on Neural Networks and Learning Systems, pages 1–15, Apr. 2021. ISSN 2162-237X. doi: 10.1109/TNNLS.2021.3071119.
- Liu et al. [2017] Y. Liu, H. Li, J. Yan, F. Wei, X. Wang, and X. Tang. Recurrent Scale Approximation for Object Detection in CNN. In IEEE International Conference on Computer Vision (ICCV), pages 571–579, Venice, Italy, Oct. 2017. doi: 10.1109/ICCV.2017.69.
- Liu et al. [2018] Y. Liu, A. Jourabloo, and X. Liu. Learning deep models for face anti-spoofing: Binary or auxiliary supervision. In IEEE Conference on Computer Vision and Pattern Recognition (CVPR), pages 389–398, Salt Lake City, UT, USA, June 2018. doi: 10.1109/CVPR.2018.00048.
- Liu et al. [2020] Y. Liu, J. Stehouwer, and X. Liu. On disentangling spoof trace for generic face anti-spoofing. In European Conference on Computer Vision (ECCV), pages 406–422, Glasgow, UK, Aug. 2020. doi: 10.1007/978-3-030-58523-5_24.
- Liu et al. [2015] Z. Liu, P. Luo, X. Wang, and X. Tang. Deep learning face attributes in the wild. In IEEE International Conference on Computer Vision (ICCV), pages 3730–3738, Dec. 2015. doi: 10.1109/ICCV.2015.425.
- Loey et al. [2021] M. Loey, G. Manogaran, M. H. N. Taha, and N. E. M. Khalifa. A hybrid deep transfer learning model with machine learning methods for face mask detection in the era of the COVID-19 pandemic. Measurement, 167:108288, Jan. 2021. ISSN 0263-2241. doi: 10.1016/j.measurement.2020.108288.
- Lopes et al. [2019] G. Lopes, J. R. Pinto, and J. S. Cardoso. Don’t You Forget About Me: A Study on Long-Term Performance in ECG Biometrics. In Iberian Conference on Pattern Recognition and Image Analysis (IbPRIA), Madrid, Spain, 2019. doi: 10.1007/978-3-030-31321-0_4.
- Lopes [2019] G. C. Lopes. Don’t You Forget About Me: Enhancing Long Term Performance in Electrocardiogram Biometrics. Master’s thesis, Universidade do Porto, Portugal, 2019. URL https://hdl.handle.net/10216/121823.
- Lopes [2022] P. D. Lopes. Deep Neural Networks for Face-based Emotion Recognition. Master’s thesis, Universidade do Porto, Portugal, 2022. URL https://hdl.handle.net/10216/143004.
- Louis et al. [2016] W. Louis, M. Komeili, and D. Hatzinakos. Continuous Authentication Using One-Dimensional Multi-Resolution Local Binary Patterns (1DMRLBP) in ECG Biometrics. IEEE Transactions on Information Forensics and Security, 11(12):2818–2832, Dec. 2016. ISSN 1556-6013. doi: 10.1109/TIFS.2016.2599270.
- Lourenço et al. [2013] A. Lourenço, H. Silva, C. Carreiras, and A. Fred. Outlier detection in non-intrusive ecg biometric system. In International Conference on Image Analysis and Recognition (ICIAR), pages 43–52, Póvoa do Varzim, Portugal, June 2013. doi: 10.1007/978-3-642-39094-4_6.
- Lourenço et al. [2011a] A. Lourenço, H. Silva, and A. Fred. Unveiling the Biometric Potential of Finger-based ECG Signals. Computational Intelligence and Neuroscience, 2011:1–8, Jan. 2011a. ISSN 1687-5265. doi: 10.1155/2011/720971.
- Lourenço et al. [2011b] A. Lourenço, H. Silva, D. P. Santos, and A. Fred. Towards a Finger Based ECG Biometric System. In International Conference on Bio-inspired Systems and Signal Processing (BIOSIGNALS), pages 348–353, Rome, Italy, Jan. 2011b. doi: 10.5220/0003286803480353.
- Lourenço et al. [2012a] A. Lourenço, H. Silva, and A. Fred. ECG-based biometrics: A real time classification approach. In IEEE International Workshop on Machine Learning for Signal Processing, pages 1–6, Santander, Spain, Sep. 2012a. doi: 10.1109/MLSP.2012.6349735.
- Lourenço et al. [2012b] A. Lourenço, H. Silva, R. L. Lourenço, P. L. Leite, and A. Fred. Real Time Electrocardiogram Segmentation For Finger Based ECG Biometrics. In International Conference on Bio-inspired Systems and Signal Processing (BIOSIGNALS), pages 49–54, Vilamoura, Portugal, Feb. 2012b. doi: 10.5220/0003777300490054.
- Lourenço et al. [2014] A. Lourenço, C. Carreiras, H. Silva, and A. Fred. ECG biometrics: A template selection approach. In IEEE International Symposium on Medical Measurements and Applications (MeMeA), pages 1–6, Lisbon, Portugal, June 2014. doi: 10.1109/MeMeA.2014.6860081.
- Lourenço et al. [2015] A. Lourenço, A. P. Alves, C. Carreiras, R. P. Duarte, and A. Fred. CardioWheel: ECG Biometrics on the Steering Wheel. In European Conference on Machine Learning and Knowledge Discovery in Databases (ECML PKDD), pages 267–270, Porto, Portugal, Sep. 2015. doi: 10.1007/978-3-319-23461-8_27.
- Lovisotto et al. [2017] G. Lovisotto, R. Malik, I. Sluganovic, M. Roeschlin, P. Trueman, and I. Martinovic. Mobile Biometrics in Financial Services: A Five Factor Framework. Technical Report CS-RR-17-03, University of Oxford, Oxford, UK, 2017. URL http://www.cs.ox.ac.uk/files/9113/Mobile%20Biometrics%20in%20Financial%20Services.pdf.
- Lugovaya [2005] T. S. Lugovaya. Biometric human identification based on electrocardiogram. Master’s thesis, Faculty of Computing Technologies and Informatics, Electrotechnical University “LETI”, Saint-Petersburg, Russia, June 2005.
- Lumini and Nanni [2006] A. Lumini and L. Nanni. A clustering method for automatic biometric template selection. Pattern Recognition, 39(3):495–497, Mar. 2006. ISSN 0031-3203. doi: 10.1016/j.patcog.2005.11.004.
- Lundberg and Lee [2017] S. M. Lundberg and S.-I. Lee. A Unified Approach to Interpreting Model Predictions. In International Conference on Neural Information Processing Systems (NeurIPS), pages 4765–4774, Long Beach, CA, USA, Dec. 2017. doi: 10.5555/3295222.3295230.
- Luz et al. [2018] E. J. S. Luz, G. J. P. Moreira, L. S. Oliveira, W. R. Schwartz, and D. Menotti. Learning deep off-the-person heart biometrics representations. IEEE Transactions on Information Forensics and Security, 13(5):1258–1270, May 2018. ISSN 1556-6013. doi: 10.1109/TIFS.2017.2784362.
- Magalhães [2021] I. A. Magalhães. Feel My Heart: Emotion Recognition Using the Electrocardiogram. Master’s thesis, Universidade do Porto, Portugal, 2021. URL https://hdl.handle.net/10216/135339.
- Marieb and Hoehn [2013] E. N. Marieb and K. Hoehn. Human Anatomy & Physiology. Pearson, Glenview, IL, ninth edition, 2013. ISBN 978-0-321-74326-8.
- Mark et al. [1982] R. G. Mark, P. S. Schluter, G. B. Moody, P. H. Devlin, and D. Chernoff. An annotated ECG database for evaluating arrhythmia detectors. IEEE Transactions on Biomedical Engineering, 29(8):600, 1982.
- Matos et al. [2013] A. C. Matos, A. Lourenço, and J. Nascimento. Biometric recognition system using low bandwidth ECG signals. In IEEE International Conference on e-Health Networking, Applications and Services (Healthcom), pages 518–522, Lisbon, Portugal, Oct. 2013. doi: 10.1109/HealthCom.2013.6720731.
- Matos et al. [2014] A. C. Matos, A. Lourenço, and J. Nascimento. Embedded System for Individual Recognition Based on ECG Biometrics. Procedia Technology, 17:265–272, 2014. ISSN 2212-0173. doi: 10.1016/j.protcy.2014.10.236.
- Matta et al. [2021] A. Matta, J. R. Pinto, and J. S. Cardoso. Mixture-Based Open World Face Recognition. In World Conference on Information Systems and Technologies (WorldCIST), pages 653–662, Azores, Portugal, Mar. 2021. doi: 10.1007/978-3-030-72660-7_62.
- Matta [2020] A. J. Matta. Open-World Face Recognition. Master’s thesis, Universidade do Porto, Portugal, 2020. URL https://hdl.handle.net/10216/130042.
- Matta et al. [2011] R. Matta, J. K. H. Lau, F. Agrafioti, and D. Hatzinakos. Real-time continuous identification system using ECG signals. In Canadian Conference on Electrical and Computer Engineering (CCECE), pages 001313–001316, Niagara Falls, ON, Canada, May 2011. doi: 10.1109/CCECE.2011.6030676.
- Matyschik et al. [2020] M. Matyschik, H. Mauranen, P. Bonizzi, and J. Karel. Feasibility of ECG Reconstruction from Minimal Lead Sets Using Convolutional Neural Networks. In Computing in Cardiology, pages 1–4, Rimini, Italy, Sep. 2020. doi: 10.22489/CinC.2020.164.
- Mehta et al. [2018] D. Mehta, M. F. H. Siddiqui, and A. Y. Javaid. Facial Emotion Recognition: A Survey and Real-World User Experiences in Mixed Reality. Sensors, 18(2):416, 2018. ISSN 1424-8220. doi: 10.3390/s18020416.
- Meng et al. [2021] Q. Meng, S. Zhao, Z. Huang, and F. Zhou. MagFace: A Universal Representation for Face Recognition and Quality Assessment. In IEEE/CVF Conference on Computer Vision and Pattern Recognition (CVPR), pages 14220–14229, Nashville, TN, USA, June 2021. doi: 10.1109/CVPR46437.2021.01400.
- Mirsamadi et al. [2017] S. Mirsamadi, E. Barsoum, and C. Zhang. Automatic speech emotion recognition using recurrent neural networks with local attention. In IEEE International Conference on Acoustics, Speech and Signal Processing (ICASSP), pages 2227–2231, New Orleans, LA, USA, Mar. 2017. doi: 10.1109/ICASSP.2017.7952552.
- Mjaaland et al. [2010] B. B. Mjaaland, P. Bours, and D. Gligoroski. Walk the Walk: Attacking Gait Biometrics by Imitation. In International Conference on Information Security (ISC), pages 361–380, Boca Raton, FL, USA, Oct. 2010. doi: 10.1007/978-3-642-18178-8_31.
- Molina et al. [2007] G. G. Molina, F. Bruekers, C. Presura, M. Damstra, and M. van der Veen. Morphological synthesis of ECG signals for person authentication. In European Signal Processing Conference, pages 738–742, Poznan, Poland, Sep. 2007. URL https://ieeexplore.ieee.org/document/7098901.
- Mollahosseini et al. [2019] A. Mollahosseini, B. Hasani, and M. H. Mahoor. AffectNet: A Database for Facial Expression, Valence, and Arousal Computing in the Wild. IEEE Transactions on Affective Computing, 10(1):18–31, Jan. 2019. ISSN 1949-3045. doi: 10.1109/TAFFC.2017.2740923.
- Monfort et al. [2021] M. Monfort, K. Ramakrishnan, A. Andonian, B. A. McNamara, A. Lascelles, B. Pan, Q. Fan, D. Gutfreund, R. Feris, and A. Oliva. Multi-moments in time: Learning and interpreting models for multi-action video understanding. IEEE Transactions on Pattern Analysis and Machine Intelligence, 44(12):9434–9445, Nov. 2021. ISSN 0162-8828. doi: 10.1109/TPAMI.2021.3126682.
- Moody and Mark [1990] G. B. Moody and R. G. Mark. The MIT-BIH Arrhythmia Database on CD-ROM and software for use with it. In Computers in Cardiology (CinC), pages 185–188, Chicago, IL, USA, Sep. 1990. doi: 10.1109/CIC.1990.144205.
- Murali et al. [2022] P. K. Murali, M. Kaboli, and R. Dahiya. Intelligent In-Vehicle Interaction Technologies. Advanced Intelligent Systems, 4(2):2100122, Feb. 2022. ISSN 2640-4567. doi: 10.1002/aisy.202100122.
- N and Jayaraman [2010] V. N and S. Jayaraman. Human Electrocardiogram for Biometrics Using DTW and FLDA. In International Conference on Pattern Recognition (ICPR), pages 3838–3841, Istanbul, Turkey, Aug. 2010. doi: 10.1109/ICPR.2010.935.
- Nandakumar and Jain [2015] K. Nandakumar and A. K. Jain. Biometric template protection: Bridging the performance gap between theory and practice. IEEE Signal Processing Magazine, 32(5):88–100, Aug. 2015. ISSN 1053-5888. doi: 10.1109/MSP.2015.2427849.
- Nech and Kemelmacher-Shlizerman [2017] A. Nech and I. Kemelmacher-Shlizerman. Level Playing Field for Million Scale Face Recognition. In IEEE Conference on Computer Vision and Pattern Recognition (CVPR), pages 3406–3415, Honolulu, HI, USA, July 2017. doi: 10.1109/CVPR.2017.363.
- Nelwan et al. [2004] S. P. Nelwan, J. A. Kors, S. H. Meij, J. H. van Bemmel, and M. L. Simoons. Reconstruction of the 12-lead electrocardiogram from reduced lead sets. Journal of Electrocardiology, 37(1):11–18, 2004. ISSN 0022-0736. doi: 10.1016/j.jelectrocard.2003.10.004.
- Nemirko and Lugovaya [2005] A. P. Nemirko and T. S. Lugovaya. Biometric human identification based on electrocardiogram. In Russian Conference on Mathematical Methods of Pattern Recognition, pages 387–390, Moscow, Russia, 2005. URL http://www.mmro.ru/files/2005-mmro-12.pdf.
- Neto et al. [2021a] P. C. Neto, F. Boutros, J. R. Pinto, N. Damer, A. F. Sequeira, and J. S. Cardoso. FocusFace: Multi-task Contrastive Learning for Masked Face Recognition. In IEEE International Conference on Automatic Face and Gesture Recognition (FG), Jodhpur, India, Dec. 2021a. doi: 10.1109/FG52635.2021.9666792.
- Neto et al. [2021b] P. C. Neto, F. Boutros, J. R. Pinto, M. Saffari, N. Damer, A. F. Sequeira, and J. S. Cardoso. My Eyes Are Up Here: Promoting Focus on Uncovered Regions in Masked Face Recognition. In International Conference of the Biometrics Special Interest Group (BIOSIG), Darmstadt, Germany, Sep. 2021b. doi: 10.1109/BIOSIG52210.2021.9548320.
- Neto et al. [2022a] P. C. Neto, F. Boutros, J. R. Pinto, N. Damer, A. F. Sequeira, J. S. Cardoso, M. Bengherabi, A. Bousnat, S. Boucheta, N. Hebbadj, B. Yahya-Zoubir, M. E. Erakın, U. Demir, H. K. Ekenel, P. B. de Queiroz Vidal, and D. Menotti. IJCB OCFR 2022: Competition on Occluded Face Recognition From Synthetically Generated Structure-Aware Occlusions. In International Joint Conference on Biometrics (IJCB), Abu Dhabi, UAE, Oct. 2022a. (in press).
- Neto et al. [2022b] P. C. Neto, T. Gonçalves, J. R. Pinto, W. Silva, A. F. Sequeira, A. Ross, and J. S. Cardoso. Explainable Biometrics in the Age of Deep Learning. ACM Computing Surveys, 2022b. URL https://arxiv.org/pdf/2208.09500.pdf. (submitted).
- Neto et al. [2022c] P. C. Neto, J. R. Pinto, F. Boutros, N. Damer, A. F. Sequeira, and J. S. Cardoso. Beyond Masks: On the Generalization of Masked Face Recognition Models to Occluded Face Recognition. IEEE Access, 10:86222–86233, Aug. 2022c. ISSN 2169-3536. doi: 10.1109/ACCESS.2022.3199014.
- Ngan et al. [2020a] M. L. Ngan, P. J. Grother, and K. K. Hanaoka. Ongoing face recognition vendor test (FRVT) Part 6A: Face recognition accuracy with masks using pre-COVID-19 algorithms. NIST Interagency/Internal Report (NISTIR) 8311, National Institute of Standards and Technology, Gaithersburg, MD, USA, July 2020a. URL https://doi.org/10.6028/NIST.IR.8311.
- Ngan et al. [2020b] M. L. Ngan, P. J. Grother, and K. K. Hanaoka. Ongoing Face Recognition Vendor Test (FRVT) Part 6B: Face recognition accuracy with face masks using post-COVID-19 algorithms. NIST Interagency/Internal Report (NISTIR) 8331, National Institute of Standards and Technology, Gaithersburg, MD, USA, Nov. 2020b. URL https://doi.org/10.6028/NIST.IR.8331.
- Nikisins et al. [2018] O. Nikisins, A. Mohammadi, A. Anjos, and S. Marcel. On Effectiveness of Anomaly Detection Approaches against Unseen Presentation Attacks in Face Anti-spoofing. In International Conference on Biometrics (ICB), pages 75–81, Gold Coast, QLD, Australia, Feb. 2018. doi: 10.1109/ICB2018.2018.00022.
- Obeid et al. [2012] D. Obeid, G. Zaharia, S. Sadek, and G. El Zein. Microwave doppler radar for heartbeat detection vs electrocardiogram. Microwave and Optical Technology Letters, 54(11):2610–2617, 2012. doi: 10.1002/mop.27152.
- Obied [2006] A. Obied. How to attack biometric systems in your spare time. Technical report, Department of Computer Science, University of Calgary, Calgary, AB, Canada, Nov. 2006. URL http://ahmed.obied.net/research/papers/biometric.pdf.
- Odinaka et al. [2010] I. Odinaka, P. H. Lai, A. D. Kaplan, J. A. O’Sullivan, E. J. Sirevaag, S. D. Kristjansson, A. K. Sheffield, and J. W. Rohrbaugh. ECG biometrics: A robust short-time frequency analysis. In IEEE International Workshop on Information Forensics and Security (WIFS), pages 1–6, Seattle, WA, USA, Dec. 2010. doi: 10.1109/WIFS.2010.5711466.
- Odinaka et al. [2012] I. Odinaka, P. H. Lai, A. D. Kaplan, J. A. O’Sullivan, E. J. Sirevaag, and J. W. Rohrbaugh. ECG Biometric Recognition: A Comparative Analysis. IEEE Transactions on Information Forensics and Security, 7(6):1812–1824, Dec. 2012. ISSN 1556-6013. doi: 10.1109/TIFS.2012.2215324.
- Oliveira et al. [2018] L. Oliveira, J. S. Cardoso, A. Lourenço, and C. Ahlström. Driver drowsiness detection: a comparison between intrusive and non-intrusive signal acquisition methods. In European Workshop on Visual Information Processing (EUVIP), pages 1–6, Tampere, Finland, Nov. 2018. doi: 10.1109/EUVIP.2018.8611704.
- Oliveira et al. [2020] S. P. Oliveira, J. R. Pinto, T. Gonçalves, R. C. Marques, M. J. Cardoso, and J. S. Cardoso. Weakly-Supervised Classification of HER2 Expression in Breast Cancer Haematoxylin and Eosin Stained Slides. Applied Sciences, 10(14):4728, July 2020. ISSN 2076-3417. doi: 10.3390/app10144728.
- Omeiza et al. [2019] D. Omeiza, S. Speakman, C. Cintas, and K. Weldermariam. Smooth Grad-CAM++: An enhanced inference level visualization technique for deep convolutional neural network models. arXiv, 2019. URL https://arxiv.org/pdf/1908.01224.pdf.
- Omidvar [2022] E. Omidvar. Single-Wrist Electrocardiogram Acquisition Application in Biometrics. Master’s thesis, Universidade do Porto, Portugal, 2022.
- Opitz et al. [2016] M. Opitz, G. Waltner, G. Poier, H. Possegger, and H. Bischof. Grid Loss: Detecting Occluded Faces. In European Conference on Computer Vision (ECCV), pages 386–402, Amsterdam, The Netherlands, Oct. 2016. doi: 10.1007/978-3-319-46487-9_24.
- Paiva et al. [2017] J. S. Paiva, D. Dias, and J. P. S. Cunha. Beat-ID: Towards a computationally low-cost single heartbeat biometric identity check system based on electrocardiogram wave morphology. PLOS ONE, 12(7):e0180942, Jul. 2017. ISSN 1932-6203. doi: 10.1371/journal.pone.0180942.
- Pal and Singh [2018] A. Pal and Y. N. Singh. ECG Biometric Recognition. In International Conference on Mathematics and Computing (ICMC), pages 61–73, Varanasi, India, Jan. 2018. doi: 10.1007/978-981-13-0023-3_7.
- Palaniappan and Krishnan [2004] R. Palaniappan and S. M. Krishnan. Identifying individuals using ECG beats. In International Conference on Signal Processing and Communications (SPCOM), pages 569–572, Bangalore, India, Dec. 2004. doi: 10.1109/SPCOM.2004.1458524.
- Pan and Tompkins [1985] J. Pan and W. J. Tompkins. A Real-Time QRS Detection Algorithm. IEEE Transactions on Biomedical Engineering, BME-32(3):230–236, Mar. 1985. ISSN 0018-9294. doi: 10.1109/TBME.1985.325532.
- Pandey et al. [2016] R. K. Pandey, Y. Zhou, B. U. Kota, and V. Govindaraju. Deep Secure Encoding for Face Template Protection. In IEEE Conference on Computer Vision and Pattern Recognition Workshops (CVPRW), pages 77–83, Las Vegas, NV, USA, June 2016. doi: 10.1109/CVPRW.2016.17.
- Pang et al. [2019] G. Pang, X. Wang, J.-F. Hu, Q. Zhang, and W.-S. Zheng. DBDNet: Learning Bi-directional Dynamics for Early Action Prediction. In International Joint Conference on Artificial Intelligence (IJCAI), pages 897–903, Macau, China, July 2019. doi: 10.24963/ijcai.2019/126.
- Parkhi et al. [2015] O. M. Parkhi, A. Vedaldi, and A. Zisserman. Deep Face Recognition. In British Machine Vision Conference (BMVC), pages 41.1–41.12, Swansea, UK, Sep. 2015. doi: 10.5244/C.29.41.
- Pathoumvanh et al. [2014] S. Pathoumvanh, S. Airphaiboon, and K. Hamamoto. Robustness study of ECG biometric identification in heart rate variability conditions. IEEJ Transactions on Electrical and Electronic Engineering, 9(3):294–301, May 2014. ISSN 1931-4981. doi: 10.1002/tee.21970.
- Perera and Patel [2019] P. Perera and V. M. Patel. Learning Deep Features for One-Class Classification. IEEE Transactions on Image Processing, 28(11):5450–5463, May 2019. ISSN 1057-7149. doi: 10.1109/TIP.2019.2917862.
- Perez-Cabo et al. [2019] D. Perez-Cabo, D. Jimenez-Cabello, A. Costa-Pazo, and R. J. Lopez-Sastre. Deep Anomaly Detection for Generalized Face Anti-Spoofing. In IEEE/CVF Conference on Computer Vision and Pattern Recognition Workshops (CVPRW), pages 1591–1600, Long Beach, CA, USA, June 2019. doi: 10.1109/CVPRW.2019.00201.
- Phillips and Przybocki [2020] P. J. Phillips and M. Przybocki. Four Principles of Explainable AI as Applied to Biometrics and Facial Forensic Algorithms. arXiv, 2020. URL https://arxiv.org/pdf/2002.01014.
- Pinto et al. [2020a] A. Pinto, S. Goldenstein, A. Ferreira, T. Carvalho, H. Pedrini, and A. Rocha. Leveraging shape, reflectance and albedo from shading for face presentation attack detection. IEEE Transactions on Information Forensics and Security, 15:3347–3358, Apr. 2020a. ISSN 1556-6013. doi: 10.1109/TIFS.2020.2988168.
- Pinto [2017] J. R. Pinto. Continuous Biometric Identification on the Steering Wheel. Master’s thesis, Universidade do Porto, Portugal, 2017. URL https://hdl.handle.net/10216/106106.
- Pinto and Cardoso [2019] J. R. Pinto and J. S. Cardoso. An End-to-End Convolutional Neural Network for ECG-Based Biometric Authentication. In International Conference on Biometrics Theory, Applications and Systems (BTAS), pages 1–8, Tampa, FL, USA, Sep. 2019. doi: 10.1109/BTAS46853.2019.9185990.
- Pinto and Cardoso [2020a] J. R. Pinto and J. S. Cardoso. Explaining ECG Biometrics: Is It All In The QRS? In International Conference of the Biometrics Special Interest Group (BIOSIG), pages 139–150, Darmstadt, Germany, Sep. 2020a. URL https://dl.gi.de/handle/20.500.12116/34321.
- Pinto and Cardoso [2020b] J. R. Pinto and J. S. Cardoso. Self-Learning with Stochastic Triplet Loss. In 2020 International Joint Conference on Neural Networks (IJCNN), Glasgow, UK, July 2020b. doi: 10.1109/IJCNN48605.2020.9206799.
- Pinto and Cardoso [2021] J. R. Pinto and J. S. Cardoso. ECG Biometrics. In S. Jajodia, P. Samarati, and M. Yung, editors, Encyclopedia of Cryptography, Security and Privacy. Springer, Berlin, Heidelberg, 2021. ISBN 978-3-642-27739-9. doi: 10.1007/978-3-642-27739-9_1517-1.
- Pinto et al. [2017] J. R. Pinto, J. S. Cardoso, A. Lourenço, and C. Carreiras. Towards a Continuous Biometric System Based on ECG Signals Acquired on the Steering Wheel. Sensors, 17(10):2228, Sep. 2017. ISSN 1424-8220. doi: 10.3390/s17102228.
- Pinto et al. [2018] J. R. Pinto, J. S. Cardoso, and A. Lourenço. Evolution, Current Challenges, and Future Possibilities in ECG Biometrics. IEEE Access, 6:34746–34776, June 2018. ISSN 2169-3536. doi: 10.1109/ACCESS.2018.2849870.
- Pinto et al. [2019] J. R. Pinto, J. S. Cardoso, and A. Lourenço. Deep Neural Networks For Biometric Identification Based On Non-Intrusive ECG Acquisitions. In K. V. Arya and R. S. Bhadoria, editors, The Biometric Computing: Recognition and Registration, chapter 11, pages 217–234. CRC Press, Boca Raton FL, United States, 2019. ISBN 9780815393641. doi: 10.1201/9781351013437-11.
- Pinto et al. [2020b] J. R. Pinto, J. S. Cardoso, and M. V. Correia. Secure Triplet Loss for End-to-End Deep Biometrics. In International Workshop on Biometrics and Forensics (IWBF), pages 1–6, Porto, Portugal, Apr. 2020b. doi: 10.1109/IWBF49977.2020.9107958.
- Pinto et al. [2020c] J. R. Pinto, T. Gonçalves, C. Pinto, L. Sanhudo, J. Fonseca, F. Gonçalves, P. Carvalho, and J. S. Cardoso. Audiovisual Classification of Group Emotion Valence Using Activity Recognition Networks. In IEEE International Conference on Image Processing, Applications and Systems (IPAS), pages 114–119, Genova, Italy, Dec. 2020c. doi: 10.1109/IPAS50080.2020.9334943.
- Pinto et al. [2021] J. R. Pinto, M. V. Correia, and J. S. Cardoso. Secure Triplet Loss: Achieving Cancelability and Non-Linkability in End-to-End Deep Biometrics. IEEE Transactions on Biometrics, Behavior, and Identity Science, 3(2):180–189, Apr. 2021. ISSN 2637-6407. doi: 10.1109/TBIOM.2020.3046620.
- Pinto et al. [2022] J. R. Pinto, P. Carvalho, C. Pinto, A. Sousa, L. G. Capozzi, and J. S. Cardoso. Streamlining Action Recognition in Autonomous Shared Vehicles with an Audiovisual Cascade Strategy. In International Conference on Computer Vision Theory and Applications (VISAPP), pages 467–474, Online, Feb. 2022. doi: 10.5220/0010838900003124.
- Plataniotis et al. [2006] K. N. Plataniotis, D. Hatzinakos, and J. K. M. Lee. ECG Biometric Recognition Without Fiducial Detection. In Biometrics Symposium: Special Session on Research at the Biometric Consortium Conference, pages 1–6, Baltimore, MD, USA, Sep. 2006. doi: 10.1109/BCC.2006.4341628.
- Porée et al. [2016] F. Porée, G. Kervio, and G. Carrault. ECG biometric analysis in different physiological recording conditions. Signal, Image and Video Processing, 10(2):267–276, 2016. ISSN 1863-1711. doi: 10.1007/s11760-014-0737-1.
- Prabhakar et al. [2003] S. Prabhakar, S. Pankanti, and A. K. Jain. Biometric recognition: security and privacy concerns. IEEE Security & Privacy, 1(2):33–42, Mar. 2003. ISSN 1540-7993. doi: 10.1109/MSECP.2003.1193209.
- Prema et al. [2019] S. Prema, M. R. V. S. Deen, M. V. P. Krishna, and S. Praveen. Vehicle And License Authentication Using Finger Print. In International Conference on Advanced Computing & Communication Systems (ICACCS), pages 737–740, Coimbatore, India, Mar. 2019. doi: 10.1109/ICACCS.2019.8728402.
- Punithavathi and Subbiah [2017] P. Punithavathi and G. Subbiah. Can cancellable biometrics preserve privacy? Biometric Technology Today, 2017(7):8–11, July 2017. ISSN 0969-4765. doi: 10.1016/S0969-4765(17)30138-8.
- Qi et al. [2020] M. Qi, Y. Wang, J. Qin, A. Li, J. Luo, and L. Van Gool. stagNet: An Attentive Semantic RNN for Group Activity and Individual Action Recognition. IEEE Transactions on Circuits and Systems for Video Technology, 30(2):549–565, Jan. 2020. ISSN 1051-8215. doi: 10.1109/TCSVT.2019.2894161.
- Qin and Li [2020] B. Qin and D. Li. Identifying facemask-wearing condition using image super-resolution with classification network to prevent COVID-19. Sensors, 20(18):5236, Sep. 2020. ISSN 1424-8220. doi: 10.3390/s20185236.
- Qiu et al. [2021] Y. Qiu, V. Albiero, M. C. King, and K. W. Bowyer. Does Face Recognition Error Echo Gender Classification Error? In IEEE International Joint Conference on Biometrics (IJCB), pages 1–8, Shenzhen, China, Aug. 2021. doi: 10.1109/IJCB52358.2021.9484346.
- Raja et al. [2019] K. B. Raja, R. Raghavendra, M. Stokkenes, and C. Busch. Biometric template protection on smartphones using the manifold-structure preserving feature representation. In A. Rattani, R. Derakhshani, and A. Ross, editors, Selfie Biometrics: Advances and Challenges, pages 299–312. Springer International Publishing, Cham, 2019. doi: 10.1007/978-3-030-26972-2_15.
- Randazzo et al. [2020] V. Randazzo, G. Cirrincione, and E. Pasero. Shallow Neural Network for Biometrics from the ECG-WATCH. In International Conference on Intelligent Computing Theories and Application (ICIC), pages 259–269, Bari, Italy, Oct. 2020. doi: 10.1007/978-3-030-60799-9_22.
- Ranjan [2019] A. Ranjan. Permanence of ECG Biometric: Experiments Using Convolutional Neural Networks. In International Conference on Biometrics (ICB), pages 1–6, Crete, Greece, June 2019. doi: 10.1109/ICB45273.2019.8987383.
- Ranjan et al. [2017] R. Ranjan, C. D. Castillo, and R. Chellappa. L2-constrained Softmax Loss for Discriminative Face Verification. arXiv, 2017. URL https://arxiv.org/pdf/1703.09507.pdf.
- Ratha et al. [2001] N. K. Ratha, J. H. Connell, and R. M. Bolle. Enhancing security and privacy in biometrics-based authentication systems. IBM Systems Journal, 40(3):614–634, 2001. ISSN 0018-8670. doi: 10.1147/sj.403.0614.
- Rathgeb et al. [2013] C. Rathgeb, F. Breitinger, and C. Busch. Alignment-free cancelable iris biometric templates based on adaptive bloom filters. In International Conference on Biometrics (ICB), pages 1–8, Madrid, Spain, June 2013. doi: 10.1109/ICB.2013.6612976.
- Rathgeb et al. [2015] C. Rathgeb, M. Gomez-Barrero, C. Busch, J. Galbally, and J. Fierrez. Towards cancelable multi-biometrics based on bloom filters: a case study on feature level fusion of face and iris. In International Workshop on Biometrics and Forensics (IWBF), pages 1–6, Gjovik, Norway, Mar. 2015. doi: 10.1109/IWBF.2015.7110225.
- Rattani [2010] A. Rattani. Adaptive Biometric System based on Template Update Procedures. PhD thesis, University of Cagliari, Italy, 2010. URL http://pralab.diee.unica.it/en/node/879.
- Rattani et al. [2015] A. Rattani, W. Scheirer, and A. Ross. Open set fingerprint spoof detection across novel fabrication materials. IEEE Transactions on Information Forensics and Security, 10(11):2447–2460, Nov. 2015. ISSN 1556-6013. doi: 10.1109/TIFS.2015.2464772.
- Rezgui and Lachiri [2016] D. Rezgui and Z. Lachiri. ECG biometric recognition using SVM-based approach. IEEJ Transactions on Electrical and Electronic Engineering, 11:S94–S100, 2016. ISSN 1931-4981. doi: 10.1002/tee.22241.
- Ronneberger et al. [2015] O. Ronneberger, P. Fischer, and T. Brox. U-Net: Convolutional Networks for Biomedical Image Segmentation. In International Conference on Medical Image Computing and Computer-Assisted Intervention (MICCAI), pages 234–241, 2015. doi: 10.1007/978-3-319-24574-4_28.
- Saechia et al. [2005] S. Saechia, J. Koseeyaporn, and P. Wardkein. Human Identification System Based ECG Signal. In IEEE Region 10 Conference (TENCON), pages 1–4, Melbourne, VIC, Australia, Nov. 2005. doi: 10.1109/TENCON.2005.300986.
- Safie et al. [2011] S. I. Safie, J. J. Soraghan, and L. Petropoulakis. Electrocardiogram (ECG) Biometric Authentication Using Pulse Active Ratio (PAR). IEEE Transactions on Information Forensics and Security, 6(4):1315–1322, Dec. 2011. ISSN 1556-6013. doi: 10.1109/TIFS.2011.2162408.
- Sahayadhas et al. [2012] A. Sahayadhas, K. Sundaraj, and M. Murugappan. Detecting driver drowsiness based on sensors: A review. Sensors, 12(12):16937–16953, 2012. ISSN 1424-8220. doi: 10.3390/s121216937.
- Salloum and Kuo [2017] R. Salloum and C. C. J. Kuo. ECG-based biometrics using recurrent neural networks. In IEEE International Conference on Acoustics, Speech and Signal Processing (ICASSP), pages 2062–2066, New Orleans, LA, USA, Mar. 2017. doi: 10.1109/ICASSP.2017.7952519.
- Samek et al. [2017] W. Samek, T. Wiegand, and K.-R. Müller. Explainable artificial intelligence: Understanding, visualizing and interpreting deep learning models. arXiv, 2017. URL https://arxiv.org/pdf/1708.08296.pdf.
- Sasikala and Wahidabanu [2010] P. Sasikala and R. Wahidabanu. Identification of Individuals using Electrocardiogram. International Journal of Computer Science and Network Security, 10(12):147–153, Dec. 2010. ISSN 1738-7906. URL http://paper.ijcsns.org/07_book/201012/20101220.pdf.
- Savitzky and Golay [1964] A. Savitzky and M. J. E. Golay. Smoothing and differentiation of data by simplified least squares procedures. Analytical Chemistry, 36:1627–1639, July 1964. ISSN 0003-2700. doi: 10.1021/ac60214a047.
- Savran et al. [2008] N. A. Savran, H. Dibeklioğlu, O. Çeliktutan, B. Gökberk, B. Sankur, and L. Akarun. Bosphorus Database for 3D Face Analysis. In European Workshop on Biometrics and Identity Management (BIOID), Roskilde, Denmark, May 2008. doi: 10.1007/978-3-540-89991-4_6.
- Scalise [2012] L. Scalise. Non Contact Heart Monitoring. In R. M. Millis, editor, Advances in Electrocardiograms, chapter 4. IntechOpen, Rijeka, Croatia, 2012. doi: 10.5772/22937.
- Scanlon and Sanders [2007] V. C. Scanlon and T. Sanders. Essentials of Anatomy and Physiology. F. A. Davis Company, Philadelphia, PA, fifth edition, 2007. ISBN 978-0-8036-1546-5.
- Scheidat et al. [2007] T. Scheidat, A. Makrushin, and C. Vielhauer. Automatic Template Update Strategies for Biometrics. Technical report, Otto-von-Guericke University of Magdeburg, Germany, 2007. URL https://citeseerx.ist.psu.edu/viewdoc/download?doi=10.1.1.455.3153&rep=rep1&type=pdf.
- Schijvenaars [2000] R. J. A. Schijvenaars. Intra-individual Variability of the Electrocardiogram: Assessment and exploitation in computerized ECG analysis. PhD thesis, Erasmus University Rotterdam, The Netherlands, 2000. URL https://repub.eur.nl/pub/20458/.
- Schreck and Fishberg [2013] D. M. Schreck and R. D. Fishberg. Derivation of the 12-lead electrocardiogram and 3-lead vectorcardiogram. The American Journal of Emergency Medicine, 31(8):1183–1190, Aug. 2013. ISSN 0735-6757. doi: 10.1016/j.ajem.2013.04.037.
- Schroff et al. [2015] F. Schroff, D. Kalenichenko, and J. Philbin. FaceNet: A unified embedding for face recognition and clustering. In IEEE Conference on Computer Vision and Pattern Recognition (CVPR), Boston, MA, USA, June 2015. doi: 10.1109/cvpr.2015.7298682.
- Seibold et al. [2021] C. Seibold, A. Hilsmann, and P. Eisert. Focused LRP: Explainable AI for Face Morphing Attack Detection. In IEEE/CVF Winter Conference on Applications of Computer Vision Workshops (WACVW), pages 88–96, Waikoloa, HI, USA, Jan. 2021. doi: 10.1109/WACVW52041.2021.00014.
- Selvaraju et al. [2017] R. R. Selvaraju, M. Cogswell, A. Das, R. Vedantam, D. Parikh, and D. Batra. Grad-CAM: Visual Explanations from Deep Networks via Gradient-Based Localization. In IEEE International Conference on Computer Vision (ICCV), pages 618–626, Venice, Italy, Oct. 2017. doi: 10.1109/ICCV.2017.74.
- Sequeira et al. [2016] A. F. Sequeira, S. Thavalengal, J. Ferryman, P. Corcoran, and J. S. Cardoso. A realistic evaluation of iris presentation attack detection. In International Conference on Telecommunications and Signal Processing (TSP), pages 660–664, Vienna, Austria, June 2016. doi: 10.1109/TSP.2016.7760965.
- Sequeira et al. [2020] A. F. Sequeira, W. Silva, J. R. Pinto, T. Gonçalves, and J. S. Cardoso. Interpretable Biometrics: Should We Rethink How Presentation Attack Detection is Evaluated? In International Workshop on Biometrics and Forensics (IWBF), pages 1–6, Porto, Portugal, Apr. 2020. doi: 10.1109/IWBF49977.2020.9107949.
- Sequeira et al. [2021] A. F. Sequeira, T. Gonçalves, W. Silva, J. R. Pinto, and J. S. Cardoso. An Exploratory Study of Interpretability for Face Presentation Attack Detection. IET Biometrics, 10(4):441–455, June 2021. ISSN 2047-4946. doi: 10.1049/bme2.12045.
- Shao et al. [2020] R. Shao, X. Lan, and P. C. Yuen. Regularized fine-grained meta face anti-spoofing. In AAAI Conference on Artificial Intelligence (AAAI), pages 11974–11981, New York, NY, USA, Feb. 2020. URL https://ojs.aaai.org/index.php/AAAI/article/view/6873/6727.
- Sharma et al. [2019] G. Sharma, S. Ghosh, and A. Dhall. Automatic group level affect and cohesion prediction in videos. In International Conference on Affective Computing and Intelligent Interaction Workshops and Demos (ACIIW), pages 161–167, Cambridge, UK, Sep. 2019. doi: 10.1109/ACIIW.2019.8925231.
- Shen et al. [2002] T.-W. D. Shen, W. J. Tompkins, and Y. H. Hu. One-lead ECG for identity verification. In Joint Annual Conference and the Annual Fall Meeting of the Biomedical Engineering Society EMBS/BMES Conference, pages 62–63, Houston, TX, USA, Oct. 2002. doi: 10.1109/IEMBS.2002.1134388.
- Shen et al. [2011] T.-W. D. Shen, W. J. Tompkins, and Y. H. Hu. Implementation of a one-lead ECG human identification system on a normal population. Journal of Engineering and Computer Innovations, 2(1):12–21, Jan. 2011. ISSN 2141-6508. doi: 10.5897/JECI.9000009.
- Shrikumar et al. [2017] A. Shrikumar, P. Greenside, and A. Kundaje. Learning Important Features through Propagating Activation Differences. In International Conference on Machine Learning (ICML), pages 3145–3153, Sydney, Australia, Aug. 2017. doi: 10.5555/3305890.3306006.
- Shu et al. [2018] L. Shu, J. Xie, M. Yang, Z. Li, Z. Li, D. Liao, X. Xu, and X. Yang. A review of emotion recognition using physiological signals. Sensors, 18(7):2074, 2018. ISSN 1424-8220. doi: 10.3390/s18072074.
- Silva et al. [2013] H. P. Silva, A. Fred, A. Lourenço, and A. K. Jain. Finger ECG signal for user authentication: Usability and performance. In IEEE International Conference on Biometrics: Theory, Applications and Systems (BTAS), pages 1–8, Arlington, VA, USA, Sep. 2013. doi: 10.1109/BTAS.2013.6712689.
- Silva et al. [2014] H. P. Silva, A. Lourenço, A. Fred, N. Raposo, and M. Aires-de-Sousa. Check Your Biosignals Here: A new dataset for off-the-person ECG biometrics. Computer Methods and Programs in Biomedicine, 113(2):503–514, 2014. ISSN 0169-2607. doi: 10.1016/j.cmpb.2013.11.017.
- Silva et al. [2020a] I. S. Silva, J. R. Barbosa, R. D. de Sousa, I. F. B. de Souza, R. de Aguiar Hortegal, and C. D. M. Regis. Comparison of spatial temporal representations of the vectorcardiogram using digital image processing. Journal of Electrocardiology, 59:164–170, Mar. 2020a. ISSN 0022-0736. doi: 10.1016/j.jelectrocard.2020.02.013.
- Silva et al. [2018] W. Silva, J. R. Pinto, and J. S. Cardoso. A uniform performance index for ordinal classification with imbalanced classes. In International Joint Conference on Neural Networks (IJCNN), Rio de Janeiro, Brazil, 2018. doi: 10.1109/IJCNN.2018.8489327.
- Silva et al. [2019] W. Silva, K. Fernandes, and J. S. Cardoso. How to produce complementary explanations using an ensemble model. In International Joint Conference on Neural Networks (IJCNN), Budapest, Hungary, July 2019. doi: 10.1109/IJCNN.2019.8852409.
- Silva et al. [2020b] W. Silva, A. Poellinger, J. S. Cardoso, and M. Reyes. Interpretability-guided content-based medical image retrieval. In International Conference on Medical Image Computing and Computer-Assisted Intervention (MICCAI), pages 305–314, Lima, Peru, Oct. 2020b. doi: 10.1007/978-3-030-59710-8_30.
- Silveira et al. [2019] C. S. Silveira, J. S. Cardoso, A. L. Lourenço, and C. Ahlström. Importance of subject-dependent classification and imbalanced distributions in driver sleepiness detection in realistic conditions. IET Intelligent Transport Systems, 13(2):347–355, 2019. ISSN 1751-956X. doi: 10.1049/iet-its.2018.5284.
- Sim et al. [2007] T. Sim, S. Zhang, R. Janakiraman, and S. Kumar. Continuous Verification Using Multimodal Biometrics. IEEE Transactions on Pattern Analysis and Machine Intelligence, 29(4):687–700, Apr. 2007. ISSN 0162-8828. doi: 10.1109/TPAMI.2007.1010.
- Simonyan et al. [2014] K. Simonyan, A. Vedaldi, and A. Zisserman. Deep Inside Convolutional Networks: Visualising Image Classification Models and Saliency Maps. In International Conference on Learning Representations Workshops (ICLR), Banff, AB, Canada, Apr. 2014. URL https://arxiv.org/pdf/1312.6034.pdf.
- Sindhwani et al. [2005] V. Sindhwani, P. Niyogi, M. Belkin, and S. Keerthi. Linear Manifold Regularization for Large Scale Semi-supervised Learning. In ICML Workshop on Learning with Partially Classified Training Data, page 4, Bonn, Germany, Aug. 2005. URL https://vikas.sindhwani.org/linMR.pdf.
- Singh et al. [2015] B. Singh, P. Singh, and S. Budhiraja. Various Approaches to Minimise Noises in ECG Signal: A Survey. In International Conference on Advanced Computing Communication Technologies (ACCT), pages 131–137, Haryana, India, Feb. 2015. doi: 10.1109/ACCT.2015.87.
- Singh [2021] P. Singh. Aadhaar and data privacy: biometric identification and anxieties of recognition in India. Information, Communication & Society, 24(7):978–993, 2021. ISSN 1369-118X. doi: 10.1080/1369118X.2019.1668459.
- Singh and Singh [2012] Y. Singh and S. Singh. Evaluation of Electrocardiogram for Biometric Authentication. Journal of Information Security, 3(1):39–48, Jan. 2012. ISSN 2153-1234. doi: 10.4236/jis.2012.31005.
- Sirovich and Kirby [1987] L. Sirovich and M. Kirby. Low-dimensional procedure for the characterization of human faces. Journal of the Optical Society of America A, 4(3):519–524, Mar. 1987. ISSN 1084-7529. doi: 10.1364/JOSAA.4.000519.
- Smith et al. [2021] G. H. Smith, D. J. Van den Heever, and W. Swart. The reconstruction of a 12-lead electrocardiogram from a reduced lead set using a focus time-delay neural network. Acta Cardiologica Sinica, 37(1):47, Jan. 2021. ISSN 1011-6842. doi: 10.6515/ACS.202101_37(1).20200712A.
- Sohn et al. [2020] J. Sohn, S. Yang, J. Lee, Y. Ku, and H. C. Kim. Reconstruction of 12-Lead Electrocardiogram from a Three-Lead Patch-Type Device Using a LSTM Network. Sensors, 20(11):3278, June 2020. ISSN 1424-8220. doi: 10.3390/s20113278.
- Song et al. [2019] L. Song, D. Gong, Z. Li, C. Liu, and W. Liu. Occlusion robust face recognition based on mask learning with pairwise differential siamese network. In IEEE/CVF International Conference on Computer Vision (ICCV), pages 773–782, Seoul, South Korea, Oct. 2019. doi: 10.1109/ICCV.2019.00086.
- Souders et al. [2020] D. J. Souders, N. Charness, N. A. Roque, and H. Pham. Aging: Older Adults’ Driving Behavior Using Longitudinal and Lateral Warning Systems. Human Factors, 62(2):229–248, July 2020. ISSN 0018-7208. doi: 10.1177/0018720819864510.
- Srivastava et al. [2014] N. Srivastava, G. Hinton, A. Krizhevsky, I. Sutskever, and R. Salakhutdinov. Dropout: A simple way to prevent neural networks from overfitting. Journal of Machine Learning Research, 15:1929–1958, 2014. ISSN 1533-7928. URL https://jmlr.org/papers/v15/srivastava14a.html.
- Srivastva et al. [2021] R. Srivastva, A. Singh, and Y. N. Singh. PlexNet: A fast and robust ECG biometric system for human recognition. Information Sciences, 558:208–228, 2021. ISSN 0020-0255. doi: 10.1016/j.ins.2021.01.001.
- Sufi et al. [2010] F. Sufi, I. Khalil, and J. Hu. ECG-Based Authentication. In P. Stavroulakis and M. Stamp, editors, Handbook of Information and Communication Security, pages 309–331. Springer Berlin Heidelberg, Berlin, Heidelberg, 2010. ISBN 978-3-642-04117-4. doi: 10.1007/978-3-642-04117-4_17.
- Sufi et al. [2011] F. Sufi, I. Khalil, and I. Habib. Cardioids-based faster authentication and diagnosis of remote cardiovascular patients. Security and Communication Networks, 4(11):1351–1368, 2011. ISSN 1939-0122. doi: 10.1002/sec.262.
- Sun et al. [2016] B. Sun, Q. Wei, L. Li, Q. Xu, J. He, and L. Yu. LSTM for Dynamic Emotion and Group Emotion Recognition in the Wild. In ACM International Conference on Multimodal Interaction (ICMI), pages 451–457, Tokyo, Japan, Oct. 2016. doi: 10.1145/2993148.2997640.
- Sun et al. [2018] X. Sun, P. Wu, and S. C. Hoi. Face detection using deep learning: An improved faster RCNN approach. Neurocomputing, 299:42–50, 2018. ISSN 0925-2312. doi: 10.1016/j.neucom.2018.03.030.
- Sun et al. [2014] Y. Sun, X. Wang, and X. Tang. Deep learning face representation from predicting 10,000 classes. In IEEE Conference on Computer Vision and Pattern Recognition (CVPR), pages 1891–1898, Washington, DC, USA, 2014. doi: 10.1109/CVPR.2014.244.
- Sutcu et al. [2005] Y. Sutcu, H. T. Sencar, and N. Memon. A secure biometric authentication scheme based on robust hashing. In Workshop on Multimedia and Security, pages 111–116, New York, NY, USA, Aug. 2005. doi: 10.1145/1073170.1073191.
- Syris Technology Corporation [2004] Syris Technology Corporation. Technical Document About FAR, FRR and EER, 2004. URL http://ftp.syris.com/SYRIS_ACS_DVD-ROM/UserGuideManual/Reader/SYRDF5-S2MS%20&%20SYRDF6-PMS/About%20FAR_FRR_EER.pdf.
- Szegedy et al. [2017] C. Szegedy, S. Ioffe, V. Vanhoucke, and A. Alemi. Inception-v4, Inception-ResNet and the Impact of Residual Connections on Learning. In AAAI Conference on Artificial Intelligence (AAAI), pages 4278–4284, San Francisco, CA, USA, Feb. 2017. doi: 10.5555/3298023.3298188.
- Taddei et al. [1992] A. Taddei, G. Distante, M. Emdin, P. Pisani, G. B. Moody, C. Zeelenberg, and C. Marchesi. The European ST-T Database: standard for evaluating systems for the analysis of ST-T changes in ambulatory electrocardiography. European Heart Journal, 13(9):1164–1172, Sep. 1992. ISSN 0195-668X. doi: 10.1093/oxfordjournals.eurheartj.a060332.
- Tai et al. [2021] Y.-S. Tai, Y.-T. Chen, and A. A.-Y. Wu. Scalable NPairLoss-Based Deep-ECG for ECG Verification. In International Conference on Artificial Intelligence Applications and Innovations (AIAI), pages 57–68, Crete, Greece, June 2021. doi: 10.1007/978-3-030-79150-6_5.
- Taigman et al. [2014] Y. Taigman, M. Yang, M. Ranzato, and L. Wolf. DeepFace: Closing the Gap to Human-Level Performance in Face Verification. In IEEE Conference on Computer Vision and Pattern Recognition (CVPR), pages 1701–1708, Columbus, OH, USA, June 2014. doi: 10.1109/CVPR.2014.220.
- Talreja et al. [2017] V. Talreja, M. C. Valenti, and N. M. Nasrabadi. Multibiometric secure system based on deep learning. IEEE Global Conference on Signal and Information Processing (GlobalSIP), pages 298–302, Nov. 2017. doi: 10.1109/GlobalSIP.2017.8308652.
- Tan et al. [2017] L. Tan, K. Zhang, K. Wang, X. Zeng, X. Peng, and Y. Qiao. Group Emotion Recognition with Individual Facial Emotion CNNs and Global Image Based CNNs. In ACM International Conference on Multimodal Interaction (ICMI), pages 549–552, Glasgow, UK, Nov. 2017. doi: 10.1145/3136755.3143008.
- Tan and Perkowski [2017] R. Tan and M. Perkowski. Toward Improving Electrocardiogram (ECG) Biometric Verification using Mobile Sensors: A Two-Stage Classifier Approach. Sensors, 17(2):410, 2017. ISSN 1424-8220. doi: 10.3390/s17020410.
- Tarek et al. [2016] M. Tarek, O. Ouda, and T. Hamza. Robust cancellable biometrics scheme based on neural networks. IET Biometrics, 5(3):220–228, Sep. 2016. doi: 10.1049/iet-bmt.2015.0045.
- Tate [2009] P. Tate. Seeley’s Principles of Anatomy and Physiology. McGraw-Hill, New York, NY, second edition, 2009. ISBN 978–0–07–337819–0.
- Tawfik et al. [2010] M. M. Tawfik, H. Selim, and T. Kamal. Human identification using time normalized QT signal and the QRS complex of the ECG. In International Symposium on Communication Systems Networks and Digital Signal Processing (CSNDSP), pages 755–759, Newcastle Upon Tyne, UK, July 2010. doi: 10.1109/CSNDSP16145.2010.5580317.
- Teoh et al. [2004] A. Teoh, D. Ngo, and A. Goh. Biohashing: two factor authentication featuring fingerprint data and tokenised random number. Pattern Recognition, 37(11):2245–2255, Nov. 2004. ISSN 0031-3203. doi: 10.1016/j.patcog.2004.04.011.
- Thentu et al. [2021] S. Thentu, R. Cordeiro, Y. Park, and N. Karimian. ECG biometric using 2D Deep Convolutional Neural Network. In IEEE International Conference on Consumer Electronics (ICCE), pages 1–6, Las Vegas, NV, USA, Jan. 2021. doi: 10.1109/ICCE50685.2021.9427616.
- Tirado-Martin and Sanchez-Reillo [2021] P. Tirado-Martin and R. Sanchez-Reillo. BioECG: Improving ECG Biometrics with Deep Learning and Enhanced Datasets. Applied Sciences, 11(13):5880, 2021. ISSN 2076-3417. doi: 10.3390/app11135880.
- Tirado-Martin et al. [2020] P. Tirado-Martin, J. Liu-Jimenez, J. Sanchez-Casanova, and R. Sanchez-Reillo. QRS Differentiation to Improve ECG Biometrics under Different Physical Scenarios Using Multilayer Perceptron. Applied Sciences, 10(19):6896, 2020. ISSN 2076-3417. doi: 10.3390/app10196896.
- Tishby and Zaslavsky [2015] N. Tishby and N. Zaslavsky. Deep learning and the information bottleneck principle. In IEEE Information Theory Workshop (ITW), pages 1–5, Jerusalem, Israel, Apr. 2015. doi: 10.1109/ITW.2015.7133169.
- Tomašić et al. [2013] I. Tomašić, S. Frljak, and R. Trobec. Estimating the universal positions of wireless body electrodes for measuring cardiac electrical activity. IEEE Transactions on Biomedical Engineering, 60(12):3368–3374, Aug. 2013. ISSN 0018-9294. doi: 10.1109/TBME.2013.2276291.
- Trahanias [1993] P. E. Trahanias. An approach to QRS complex detection using mathematical morphology. IEEE Transactions on Biomedical Engineering, 40(2):201–205, Feb. 1993. ISSN 0018-9294. doi: 10.1109/10.212060.
- Trinh et al. [2019] T. H. Trinh, M. Luong, and Q. V. Le. Selfie: Self-supervised pretraining for image embedding. arXiv, 2019. URL https://arxiv.org/pdf/1906.02940.
- Trobec and Tomašić [2011] R. Trobec and I. Tomašić. Synthesis of the 12-lead electrocardiogram from differential leads. IEEE Transactions on Information Technology in Biomedicine, 15(4):615–621, July 2011. ISSN 1089-7771. doi: 10.1109/TITB.2011.2159236.
- Tung et al. [2017] H.-Y. F. Tung, H.-W. Tung, E. Yumer, and K. Fragkiadaki. Self-supervised Learning of Motion Capture. In International Conference on Neural Information Processing Systems (NIPS), pages 5242–5252, Long Beach, CA, USA, Dec. 2017. doi: 10.5555/3295222.3295276.
- Um et al. [2017] T. T. Um, F. M. J. Pfister, D. Pischler, S. Endo, M. Lang, S. Hirche, U. Fietzek, and D. Kulić. Data Augmentation of Wearable Sensor Data for Parkinson’s Disease Monitoring using Convolutional Neural Networks. In ACM International Conference on Multimodal Interaction (ICMI), pages 216–220, Glasgow, UK, Nov. 2017. doi: 10.1145/3136755.3136817.
- van Oosterom et al. [2000] A. van Oosterom, R. Hoekema, and G. Uijen. Geometrical factors affecting the interindividual variability of the ECG and the VCG. Journal of Electrocardiology, 33:219–227, 2000. ISSN 0022-0736. doi: 10.1054/jelc.2000.20356.
- Viola and Jones [2001] P. Viola and M. Jones. Rapid object detection using a boosted cascade of simple features. In IEEE Computer Society Conference on Computer Vision and Pattern Recognition (CVPR), Kauai, HI, USA, Dec. 2001. doi: 10.1109/CVPR.2001.990517.
- Wagner et al. [2020a] P. Wagner, N. Strodthoff, R. Bousseljot, W. Samek, and T. Schaeffter. PTB-XL, a large publicly available electrocardiography dataset (version 1.0.1), Physionet, 2020a. URL https://doi.org/10.13026/x4td-x982.
- Wagner et al. [2020b] P. Wagner, N. Strodthoff, R.-D. Bousseljot, D. Kreiseler, F. I. Lunze, W. Samek, and T. Schaeffter. PTB-XL, a large publicly available electrocardiography dataset. Scientific Data, 7(1), 2020b. ISSN 2052-4463. doi: 10.1038/s41597-020-0495-6.
- Wahabi et al. [2014] S. Wahabi, S. Pouryayevali, S. Hari, and D. Hatzinakos. On Evaluating ECG Biometric Systems: Session-Dependence and Body Posture. IEEE Transactions on Information Forensics and Security, 9(11):2002–2013, Nov. 2014. ISSN 1556-6013. doi: 10.1109/TIFS.2014.2360430.
- Waili et al. [2016a] T. Waili, R. M. Nor, A. W. B. A. Rahman, K. A. Sidek, and A. A. Ibrahim. Electrocardiogram Identification: Use a Simple Set of Features in QRS Complex to Identify Individuals. In International Conference on Computing and Information Technology (IC2IT), pages 139–148, Khon Kaen, Thailand, July 2016a. doi: 10.1007/978-3-319-40415-8_14.
- Waili et al. [2016b] T. Waili, R. M. Nor, H. Yaacob, K. Sidek, and A. W. A. Rahman. A Hasty Approach to ECG Person Identification. In International Conference on Computer and Communication Engineering (ICCCE), pages 267–271, Kuala Lumpur, Malaysia, July 2016b. doi: 10.1109/ICCCE.2016.65.
- Wang et al. [2018] F. Wang, L. Chen, C. Li, S. Huang, Y. Chen, C. Qian, and C. C. Loy. The Devil of Face Recognition Is in the Noise. In European Conference on Computer Vision (ECCV), pages 780–795, Munich, Germany, Sep. 2018. doi: 10.1007/978-3-030-01240-3_47.
- Wang et al. [2013] J. Wang, M. She, S. Nahavandi, and A. Kouzani. Human Identification From ECG Signals Via Sparse Representation of Local Segments. IEEE Signal Processing Letters, 20(10):937–940, Oct. 2013. ISSN 1070-9908. doi: 10.1109/LSP.2013.2267593.
- Wang et al. [2020a] K. Wang, G. Yang, Y. Huang, and Y. Yin. Multi-scale differential feature for ECG biometrics with collective matrix factorization. Pattern Recognition, 102:107211, 2020a. ISSN 0031-3203. doi: 10.1016/j.patcog.2020.107211.
- Wang et al. [2021] K. Wang, G. Yang, L. Yang, Y. Huang, and Y. Yin. STERLING: Towards Effective ECG Biometric Recognition. In IEEE International Joint Conference on Biometrics (IJCB), pages 1–8, Shenzhen, China, Aug. 2021. doi: 10.1109/IJCB52358.2021.9484360.
- Wang and Deng [2021] M. Wang and W. Deng. Deep face recognition: A survey. Neurocomputing, 429:215–244, 2021. ISSN 0925-2312. doi: 10.1016/j.neucom.2020.10.081.
- Wang et al. [2019] W. Wang, F. Seraj, N. Meratnia, and P. J. M. Havinga. Privacy-Aware Environmental Sound Classification for Indoor Human Activity Recognition. In ACM International Conference on Pervasive Technologies Related to Assistive Environments (PETRA), pages 36–44, Rhodes, Greece, June 2019. doi: 10.1145/3316782.3321521.
- Wang et al. [2022] Y.-C. Wang, C.-Y. Wang, and S.-H. Lai. Disentangled Representation with Dual-stage Feature Learning for Face Anti-spoofing. In IEEE/CVF Winter Conference on Applications of Computer Vision (WACV), pages 1955–1964, Waikoloa, HI, USA, Jan. 2022. doi: 10.1109/WACV51458.2022.00130.
- Wang et al. [2020b] Z. Wang, Z. Yu, C. Zhao, X. Zhu, Y. Qin, Q. Zhou, F. Zhou, and Z. Lei. Deep spatial gradient and temporal depth learning for face anti-spoofing. In IEEE/CVF Conference on Computer Vision and Pattern Recognition (CVPR), pages 5042–5051, Seattle, WA, USA, June 2020b. doi: 10.1109/CVPR42600.2020.00509.
- Wei et al. [2017] Q. Wei, Y. Zhao, Q. Xu, L. Li, J. He, L. Yu, and B. Sun. A new deep-learning framework for group emotion recognition. In ACM International Conference on Multimodal Interaction (ICMI), pages 587–592, Glasgow, UK, Nov. 2017. doi: 10.1145/3136755.3143014.
- Wieclaw et al. [2017] L. Wieclaw, Y. Khoma, P. Fałat, D. Sabodashko, and V. Herasymenko. Biometrie identification from raw ECG signal using deep learning techniques. In IEEE International Conference on Intelligent Data Acquisition and Advanced Computing Systems: Technology and Applications (IDAACS), pages 129–133, Bucharest, Romania, Sep. 2017. doi: 10.1109/IDAACS.2017.8095063.
- Williford et al. [2020] J. R. Williford, B. B. May, and J. Byrne. Explainable face recognition. In European Conference on Computer Vision (ECCV), pages 248–263, Glasgow, UK, Aug. 2020. doi: 10.1007/978-3-030-58621-8_15.
- Wiskott et al. [1997] L. Wiskott, J.-M. Fellous, N. Kruger, and C. von der Malsburg. Face recognition by elastic bunch graph matching. In International Conference on Image Processing (ICIP), pages 129–132, Santa Barbara, CA, USA, Oct. 1997. doi: 10.1109/ICIP.1997.647401.
- Wolf et al. [2011] L. Wolf, T. Hassner, and I. Maoz. Face recognition in unconstrained videos with matched background similarity. In IEEE Conference on Computer Vision and Pattern Recognition (CVPR), pages 529–534, Colorado Springs, CO, USA, June 2011. doi: 10.1109/CVPR.2011.5995566.
- Wolfram Language and System Documentation Center [2010] Wolfram Language and System Documentation Center. Normalized square euclidean distance, 2010. URL http://reference.wolfram.com/language/ref/NormalizedSquaredEuclideanDistance.html.
- Wu et al. [2018] B. Wu, G. Yang, L. Yang, and Y. Yin. Robust ECG Biometrics Using Two-Stage Model. In International Conference on Pattern Recognition (ICPR), pages 1062–1067, Beijing, China, Aug. 2018. doi: 10.1109/ICPR.2018.8545285.
- Wübbeler et al. [2007] G. Wübbeler, M. Stavridis, D. Kreiseler, R.-D. Bousseljot, and C. Elster. Verification of humans using the electrocardiogram. Pattern Recognition Letters, 28(10):1172–1175, 2007. ISSN 0167-8655. doi: 10.1016/j.patrec.2007.01.014.
- Xavier [2022] M. S. Xavier. Inside Out: Fusing ECG and Face Information to Recognise Emotions. Master’s thesis, Universidade do Porto, Portugal, 2022. URL https://hdl.handle.net/10216/143759.
- Xiong and AbdAlmageed [2018] F. Xiong and W. AbdAlmageed. Unknown presentation attack detection with face RGB images. In IEEE International Conference on Biometrics Theory, Applications and Systems (BTAS), pages 1–9, Redondo Beach, CA, USA, Oct. 2018. doi: 10.1109/BTAS.2018.8698574.
- Xu et al. [2011] Y. Xu, A. Zhong, J. Yang, and D. Zhang. Bimodal biometrics based on a representation and recognition approach. Optical Engineering, 50(3):037202, Mar. 2011. ISSN 0091-3286. doi: 10.1117/1.3554740.
- Xu et al. [2022] Y. Xu, K. Raja, and M. Pedersen. Supervised contrastive learning for generalizable and explainable deepfakes detection. In IEEE/CVF Winter Conference on Applications of Computer Vision Workshops (WACVW), pages 379–389, Waikoloa, HI, USA, Jan. 2022. doi: 10.1109/WACVW54805.2022.00044.
- Yager and Dunstone [2010] N. Yager and T. Dunstone. The Biometric Menagerie. IEEE Transactions on Pattern Analysis and Machine Intelligence, 32(2):220–230, Feb. 2010. ISSN 0162-8828. doi: 10.1109/TPAMI.2008.291.
- Yang et al. [2016] S. Yang, P. Luo, C. C. Loy, and X. Tang. WIDER FACE: A Face Detection Benchmark. In IEEE Conference on Computer Vision and Pattern Recognition (CVPR), pages 5525–5533, Las Vegas, NV, USA, June 2016. doi: 10.1109/CVPR.2016.596.
- Yang et al. [2019] X. Yang, W. Luo, L. Bao, Y. Gao, D. Gong, S. Zheng, Z. Li, and W. Liu. Face Anti-Spoofing: Model Matters, so Does Data. In IEEE/CVF Conference on Computer Vision and Pattern Recognition (CVPR), pages 3507–3516, Long Beach, CA, USA, June 2019. doi: 10.1109/CVPR.2019.00362.
- Yathav et al. [2017] J. Yathav, A. Bailur, A. K. Goyal, and Abhinav. miBEAT Based Continuous and Robust Biometric Identification System for On-the-Go Applications. In International Conference on Communication and Networks (ComNet), pages 269–275, Ahmedabad, India, Feb. 2017. doi: 10.1007/978-981-10-2750-5_28.
- Ye et al. [2010] C. Ye, M. T. Coimbra, and B. V. K. V. Kumar. Investigation of human identification using two-lead Electrocardiogram (ECG) signals. In IEEE International Conference on Biometrics: Theory Applications and Systems (BTAS), pages 1–8, Washington, DC, USA, Sep. 2010. doi: 10.1109/BTAS.2010.5634478.
- Yin et al. [2019] B. Yin, L. Tran, H. Li, X. Shen, and X. Liu. Towards interpretable face recognition. In IEEE/CVF International Conference on Computer Vision (ICCV), pages 9348–9357, Seoul, South Korea, Oct. 2019. doi: 10.1109/ICCV.2019.00944.
- Yoshida et al. [2012] Y. Yoshida, X. Zhu, W. Chen, and D. Wei. Evaluation of synthesized electrocardiogram on additional leads based on clinical data. In IEEE International Conference on Virtual Environments, Human-Computer Interfaces and Measurement Systems (VECIMS), pages 65–68, Tianjin, China, July 2012. doi: 10.1109/VECIMS.2012.6273186.
- Yu et al. [2020] Z. Yu, C. Zhao, Z. Wang, Y. Qin, Z. Su, X. Li, F. Zhou, and G. Zhao. Searching central difference convolutional networks for face anti-spoofing. In IEEE/CVF Conference on Computer Vision and Pattern Recognition (CVPR), pages 5295–5305, Seattle, WA, USA, June 2020. doi: 10.1109/CVPR42600.2020.00534.
- Zafeiriou et al. [2015] S. Zafeiriou, C. Zhang, and Z. Zhang. A survey on face detection in the wild: Past, present and future. Computer Vision and Image Understanding, 138:1–24, 2015. ISSN 1077-3142. doi: 10.1016/j.cviu.2015.03.015.
- Zaghouani et al. [2017] E. K. Zaghouani, A. Benzina, and R. Attia. ECG based authentication for e-healthcare systems: Towards a secured ECG features transmission. In International Wireless Communications and Mobile Computing Conference (IWCMC), pages 1777–1783, Valencia, Spain, June 2017. doi: 10.1109/IWCMC.2017.7986553.
- Zeiler and Fergus [2014] M. D. Zeiler and R. Fergus. Visualizing and understanding convolutional networks. In European Conference on Computer Vision (ECCV), pages 818–833, Zürich, Switzerland, Sep. 2014. doi: 10.1007/978-3-319-10590-1_53.
- Zha et al. [2009] Z. Zha, T. Mei, J. Wang, Z. Wang, and X. Hua. Graph-based semi-supervised learning with multiple labels. Journal of Visual Communication and Image Representation, 20(2):97–103, 2009. ISSN 1047-3203. doi: 10.1016/j.jvcir.2008.11.009.
- Zhang et al. [2010] B. Zhang, L. Zhang, D. Zhang, and L. Shen. Directional binary code with application to PolyU near-infrared face database. Pattern Recognition Letters, 31(14):2337–2344, 2010. ISSN 0167-8655. doi: 10.1016/j.patrec.2010.07.006.
- Zhang et al. [2019a] F. Zhang, X. Fan, G. Ai, J. Song, Y. Qin, and J. Wu. Accurate face detection for high performance. arXiv, 2019a. URL https://arxiv.org/pdf/1905.01585.pdf.
- Zhang et al. [2016] K. Zhang, Z. Zhang, Z. Li, and Y. Qiao. Joint Face Detection and Alignment Using Multitask Cascaded Convolutional Networks. IEEE Signal Processing Letters, 23(10):1499–1503, Aug. 2016. ISSN 1070-9908. doi: 10.1109/LSP.2016.2603342.
- Zhang et al. [2017a] Q. Zhang, D. Zhou, and X. Zeng. HeartID: A Multiresolution Convolutional Neural Network for ECG-Based Biometric Human Identification in Smart Health Applications. IEEE Access, 5:11805–11816, 2017a. ISSN 2169-3536. doi: 10.1109/ACCESS.2017.2707460.
- Zhang et al. [2017b] Q. Zhang, D. Zhou, and X. Zeng. Pulseprint: Single-arm-ECG biometric human identification using deep learning. In IEEE Annual Ubiquitous Computing, Electronics and Mobile Communication Conference (UEMCON), pages 452–456, New York, NY, USA, Oct. 2017b. doi: 10.1109/UEMCON.2017.8249111.
- Zhang et al. [2018] R. Zhang, P. Isola, A. A. Efros, E. Shechtman, and O. Wang. The unreasonable effectiveness of deep features as a perceptual metric. In IEEE Conference on Computer Vision and Pattern Recognition (CVPR), pages 586–595, Salt Lake City, UT, USA, June 2018. doi: 10.1109/CVPR.2018.00068.
- Zhang et al. [2017] S. Zhang, X. Zhu, Z. Lei, H. Shi, X. Wang, and S. Z. Li. S3FD: Single Shot Scale-Invariant Face Detector. In IEEE International Conference on Computer Vision (ICCV), pages 192–201, Venice, Italy, Oct. 2017. doi: 10.1109/ICCV.2017.30.
- Zhang et al. [2019b] Y. Zhang, Z. Xiao, Z. Guo, and Z. Wang. ECG-based personal recognition using a convolutional neural network. Pattern Recognition Letters, 125:668–676, 2019b. ISSN 0167-8655. doi: 10.1016/j.patrec.2019.07.009.
- Zhang et al. [2019c] Y. Zhang, Z. Zhao, C. Guo, J. Huang, and K. Xu. ECG Biometrics Method Based on Convolutional Neural Network and Transfer Learning. In International Conference on Machine Learning and Cybernetics (ICMLC), pages 1–7, Kobe, Japan, July 2019c. doi: 10.1109/ICMLC48188.2019.8949218.
- Zhang et al. [2021] Y. Zhang, Z. Zhao, Y. Deng, X. Zhang, and Y. Zhang. Heart biometrics based on ECG signal by sparse coding and bidirectional long short-term memory. Multimedia Tools and Applications, 80(20):30417–30438, Aug. 2021. ISSN 1380-7501. doi: 10.1007/s11042-020-09608-9.
- Zhang and Wei [2006] Z. Zhang and D. Wei. A New ECG Identification Method Using Bayes’ Theorem. In IEEE Region 10 Conference (TENCON), pages 1–4, Hong Kong, China, Nov. 2006. doi: 10.1109/TENCON.2006.344146.
- Zhao et al. [2013] Z. Zhao, L. Yang, D. Chen, and Y. Luo. A Human ECG Identification System Based on Ensemble Empirical Mode Decomposition. Sensors, 13(5):6832–6864, 2013. ISSN 1424-8220. doi: 10.3390/s130506832.
- Zhou et al. [2016] B. Zhou, A. Khosla, A. Lapedriza, A. Oliva, and A. Torralba. Learning Deep Features for Discriminative Localization. In IEEE Conference on Computer Vision and Pattern Recognition (CVPR), pages 2921–2929, Las Vegas, NV, USA, June 2016. doi: 10.1109/CVPR.2016.319.
- Zhou et al. [2014] X. Zhou, Y. Lu, M. Chen, S. D. Bao, and F. Miao. A method of ECG template extraction for biometrics applications. In Annual International Conference of the IEEE Engineering in Medicine and Biology Society, pages 602–605, Chicago, IL, USA, Aug. 2014. doi: 10.1109/EMBC.2014.6943663.
- Zhu [2006] X. Zhu. Semi-Supervised Learning Literature Survey. University of Wisconsin-Madison, USA, 2006. URL https://pages.cs.wisc.edu/~jerryzhu/pub/ssl_survey.pdf.
- Zhu et al. [2003a] X. Zhu, Z. Ghahramani, and J. Lafferty. Semi-Supervised Learning Using Gaussian Fields and Harmonic Functions. In International Conference on Machine Learning (ICML), pages 912–919, Washington, DC, USA, Aug. 2003a. doi: 10.5555/3041838.3041953.
- Zhu et al. [2003b] X. Zhu, K. Yoshida, W. Yamanobe, Y. Yamamoto, W. Chen, and D. Wei. Conversion of the ambulatory ECG to the standard 12-lead ECG: a preliminary study. In IEEE EMBS Asian-Pacific Conference on Biomedical Engineering, pages 48–49, Kyoto, Japan, Oct. 2003b. doi: 10.1109/APBME.2003.1302577.