Chiral organic molecular structures supported by multilayer surfaces
Abstract
We study numerically the dynamics of acetanilide (ACN) molecules placed on a flat surface of a multilayer hexagonal boron nitride structure. We demonstrate that the ACN molecules, being achiral in three dimensions, become chiral after being placed on the substrate. Homochirality of the ACN molecules leads to stable secondary structures stabilized by hydrogen bonds between peptide groups of the molecules. Numerical simulations of systems of such molecules reveal that the structure of the resulting hydrogen-bond chains depends on the isomeric composition of the molecules. If all molecules are homochiral (i.e. only one isomer is present), they form secondary structures (chains of hydrogen bonds in the shapes of arcs, circles, and spirals). If the molecules at the substrate form a racemic mixture, then no regular secondary structures appear, and only curvilinear chains of hydrogen bonds of random shapes can emerge. A hydrogen-bond chain can form a straight zigzag only if it has an alternation of isomers. Such chains can create two-dimensional (2D) regular lattices, or 2D crystals. The melting scenarios of such 2D crystals depend on density of its coverage of the substrate. At 25% coverage, melting occurs continuously in a certain temperature interval. For a complete coverage, melting occurs at K due to a shift of 11% of all molecules into the second layer of the substrate.
I Introduction
Two-dimensional (2D) materials such as graphene (G) and hexagonal boron nitride (h-BN) have attracted a lot of attention due to their unique electronic Novoselov2004 ; Neto2009 ; Koren2016 and mechanical Meyer2007 ; Lee2008 ; Falin2017 ; Han2020 properties. Currently, heterogeneous layered materials of such 2D materials, which can exhibit various novel physical properties compared to their homogeneous counterparts, became a special focus of such studies Leven2013 ; Geim2013 ; Novoselov2016 . For example, the use of hybrid G/h-BN structures allows to achieve some desired electronic properties Woods2014 ; Slotman2015 and also reduce significantly friction between the layers Mandelli2017 . In general, such multilayer heterostructures are stabilized by van der Waals (vdW) interactions between atoms of the neighboring layers.
The concept of vdW heterostructures can be extended to the integration of 2D materials with molecular structures of different dimensions, such as D/2D heterostructures, where stands for the dimension (, 1, or 3) Jariwala2017 , describing flat molecules (), polymer chains (), or three-dimensional molecular objects ().
For molecules and molecular chains with benzol rings, flat layers of G and h-BN are strong adsorbents Ershova2010 ; Gordeev2013 ; Wang2014 ; Castro2014 ; Zhou2015 . Theoretical studies reveal that molecules adsorbed on G and h-BN surfaces through non-covalent interactions can modify the properties of the surface as solid-liquid, solid-air, or solid-vacuum interfaces Georgakilas2012 ; Georgakilas2016 ; Thakkar2022 . A strong stacking interaction with a flat substrate allows such molecules residing on a surface creating stable 2D supra-molecular systems, as shown in the characteristic example of Fig. 1
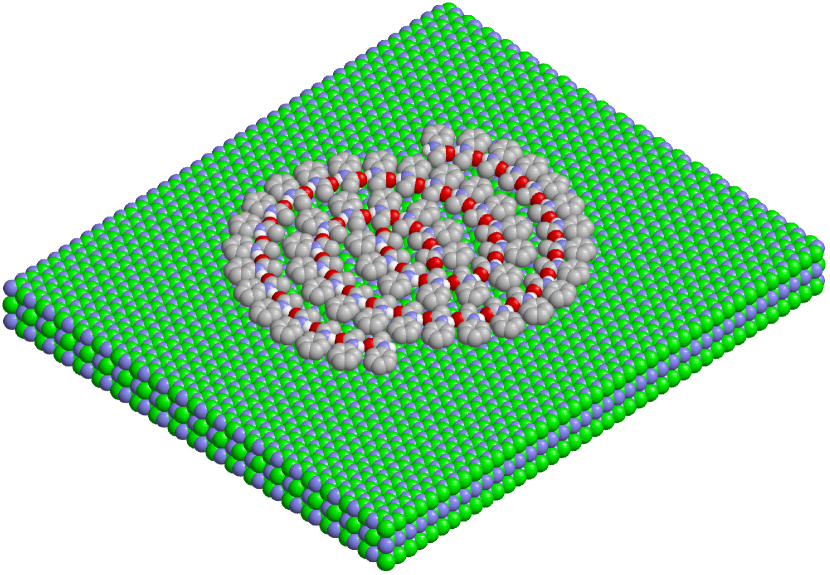
By now, the behavior of multifunctional organic molecules placed on ideal metal surfaces has been studied in detail Barlow2003 . Such organometallic systems may exhibit a variety of different structures induced by the substrate. In many cases, complex organic molecules (such as carboxylic acids, amino acids, anhydrides, and ring systems) become self-organized on metal surfaces creating ordered super-structures stabilized by inter-molecular interactions. Chirality is of a particular interest that can appear for initially achiral metal surfaces by adsorbing organic molecules Cao2016 . Similar behavior is expected for organic molecules adsorbed on flat surfaces of G and h-BN molecular structures. In this paper, we study numerically the formation of supra-molecular complexes by acetanilide molecules placed on the surface of a multilayer h-BN sheet, see Fig. 1, serving as an introductory figure explaining our problem and results discussed below.
For poly-cyclic aromatic hydrocarbons (for molecules of benzol C6H6, naphthalene C10H8, pyrene C16H10,…), graphene is a strong adsorbent Ershova2010 ; Wang2014 ; Zhou2015 ; Bahn2014 . The interaction of graphene with such molecules often causes specific reactions that can be used in new types of sensors Schedin2007 ; Shao2010 . Non-covalent functionalization of the graphene surface can significantly expand its potential range of applications Georgakilas2012 ; Georgakilas2016 . It has been shown experimentally Bahn2014 ; Zhen2018 that benzol and pyrene molecules adsorbed on graphene form densely packed monolayers.
For acetanilide (ACN, C6H5NHCOCH3) and paracetamol (PCM, C6H4OHNHCOCH3) molecules, graphene and hexagonal boron nitride are also strong adsorbents. Due to possible medical applications, much attention has been paid to modeling the adsorption of PCM molecules, which is a strong analgesic, on h-BN sheets and nanotubes Castro2014 ; Iranmanesh2019 . It has been shown in Kang2010 that functionalized graphene can be used as a highly sensitive paracetamol detection sensor.
An example of a 1D/2D heterostructure is a graphene sheet with adsorbed Kevlar chains, kevlar-functionalized graphene Lian2014 . The presence of planar C6H4 benzol rings and NHCO peptide groups in the polymer chain [–C6H4–NHCO–]∞ provides a strong non-covalent (vdW) interaction of the chain with G and h-BN sheets. Such chains on the surface of sheets G and h-BN will lie parallel to the surface and form chains of hydrogen bonds between each other HNCOHNCO.
Such 3D/2D heterostructures can form thin metal layers on the G and h-BN surfaces. In particular, numerical modeling suggests that aluminum can form stable two-layer structures on the G surface Kumar2017 .
It has been shown in Refs. Roth2005 ; Pint2006 ; Becker2006 ; Chen2008 ; Connolly2008 ; Yang2008 ; Roth2016 ; Piskorz2019 ; Fang2019 ; Zhang2021 that n-alkanes (linear polymer chains CH3(CH2)lCH3 with internal units ) form a dense ordered monolayer of parallel linear chains on the graphite (graphene) surface. Interest in alkanes is due to the fact that they belong to the simplest families of polymer molecules, which members of which differ only in their length. Placing linear polymer chains on a flat graphite surface causes them to self-assemble into 2D crystals. The self-assembly mechanism depends on the chain length, temperature, and the level of coverage of the substrate with chains Chen2008 ; Piskorz2019 .
Adsorption by the surface of a long single-chain polyethylene molecule leads to its two-dimensional crystallization – it passes from the form of a three-dimensional globule into the form of a parallel folded linear chain lying in the plane parallel to the substrate surface Yang2011 ; Gulde2016 ; Liu2018 .
Thus, the flat surfaces of the G and h-BN substrates create a 2D platform for flat molecules adsorbed on them (for poly-cyclic aromatic hydrocarbons, for ACN and PCM molecules, Kevlar chains, …) and linear polymer molecules. At low temperatures, the molecules move along the sheet, remaining parallel to its surface. They interact with each other and form two-dimensional supra-molecular structures. Such molecular adsorbents are convenient systems for studying phase transitions caused by freedom restrictions.
To date, only phase transitions in monolayers of n-alkanes have been well studied Roth2005 ; Pint2006a ; Yang2006 ; Wexler2009 ; Zhang2021 . Modeling and experimental studies show that a monolayer always undergoes a transition from a solid-crystalline 2D phase to a liquid phase (the transition occurs at a temperature significantly lower than the desorption temperature of molecules). The melting scenario depends on the polymer chain length. The melting temperature increases monotonically with chain length, so for pentane, heptane and nonane (, 5, 7) the melting temperature is , 178 and 255K Pint2006a . A characteristic feature associated with the adsorption of molecules is the continuity of melting of a 2D crystal – melting occurs in the temperature interval. Thus, for the longest synthesized monodisperse alkane C390H782 (), continuous melting occurs at K Zhang2021 .
Despite the large number of theoretical and experimental works on phase transitions in adsorbed monolayers of alkanes and their derivatives, as far as we know, there are no works on modeling phase transitions in adsorbed monolayers of ACN, PCM, and Kevlar (para-aramid) molecules. A detailed description of adsorption simulation methods is given in Pykal2016 . Unlike alkanes, the 2D structures of these molecules adsorbed on a flat surface are associated with the presence of chains of hydrogen bonds. Molecules including amide and hydroxyl groups can create 2D lattices and extended hydrogen chains.
We notice that the ACN molecules are often considered as a model system with chains of hydrogen bonds between HNCO peptide groups. Acetanilide crystallizes into an orthorhombic structure with ribbons of molecules linked by hydrogen bonds Johnson1995 . The chains of hydrogen bonds that stabilize the crystal structure are very similar to the chains that stabilize the alpha-helices and beta-sheets of proteins. Therefore, ACN was used as a model for modeling the energy transfer of vibrations of peptide groups along hydrogen bond chains in proteins Careri1984 ; Scott1992 ; Cruzeiro2013 .
Living matter, unlike non-living matter, has chiral purity: all proteins consist of left-handed amino acids, while DNA and RNA are built on right-handed ribose. In experiments on abiogenic synthesis, left and right isomers of sugars and proteins are formed in equal proportions. It is believed that if you try to build proteins from such a mixture, they will not be able to fold into a stable form and therefore will not work as enzymes. In three dimensions, the need for chiral purity to form stable protein structures requires complex analysis. The situation is dramatically simplified if we move from three-dimensional space to two-dimensional. Such a transition can be made if flat molecules are placed on a flat molecular sheet of graphene or hexagonal boron nitride (h-BN). Such a nonvalent modification of the sheet surface actually creates a 2D world for the flat molecules placed on it. At low temperatures, the molecules move along the sheet all the time remaining parallel to its surface. On the surface, they can form complex two-dimensional structures.
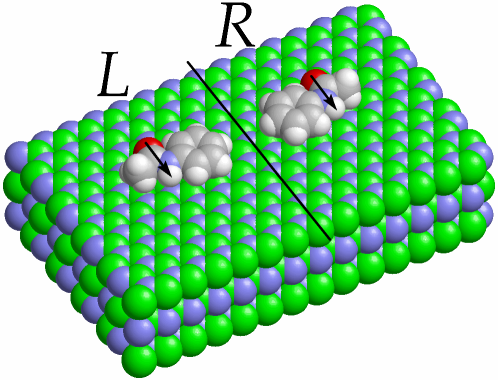
An ACN molecule that is achiral in 3D becomes chiral after being placed on a flat substrate (the chirality depends on which side it lays on the surface of the sheet) – see Fig. 2. It will be shown that the homochirality of ACN molecules leads to the appearance on the surface of the sheet of stable secondary structures stabilized by hydrogen bonds: cyclic and spiral chains and complexes of them. Modeling the formation of such structures will make it possible to demonstrate the necessity of homochirality (chiral purity) of biomolecules for the formation of stable secondary molecular structures from them.
As a flat substrate, we consider a surface of a multilayer h-BN structure, and for molecules we consider acetanilide (ACN) C6H5NHCOCH3, as shown in Figs. 1 and 2. The presence of a planar benzol ring C6H5 and a planar peptide group (PG) HNCO leads to large interaction energy of the molecule with the substrate, eV. Molecules can create chains of hydrogen bonds between their peptide groups OCNHOCNHOCNH. Such chains of hydrogen bonds stabilize the secondary structures of the protein molecules.
The paper is organized as follows. In the next section, we describe our model. Section III is devoted to the study of secondary structures of the ACN molecules placed on a flat substrate. Self-assembly of such structures is simulated numerically in Sec. IV. Then, in Sec. V we analyze melting of 2D crystals. Section VI concludes the paper.
II Model
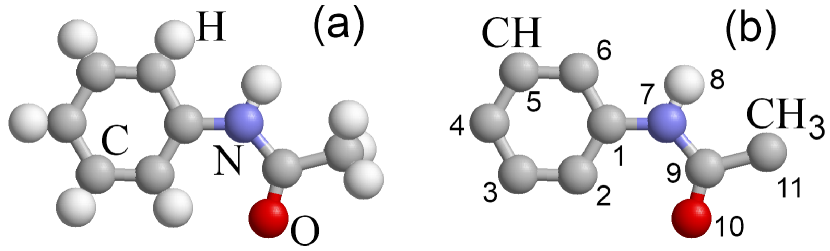
For modeling of the dynamics of a system of the ACN molecules, we will use the united-atoms approximation. Let us consider the molecular groups CH and CH3 as united atoms whose centers coincide with the centers of carbon atoms. In this approximation, the ACN molecule is described as a system of 11 united atoms – see Fig. 3. The values of the masses of the united atoms are shown in the table 1.
To model a ACN molecule, we use the force field in which distinct potentials describe the deformation of valence bonds and valence, torsion and dihedral angles, and non-valence atomic interacts Cornell1995 . In this model, the deformation energy of the valence bonds C–CH, CH–CH, C–N, N–H, C=O and C–CH3 is described by the harmonic potential:
| (1) |
where and are current and equilibrium bond lengths, is the bond stiffness. The values of potential parameters for various valence bonds are presented in Table 2.
| X | C | CH | N | H | C | O | CH3 |
|---|---|---|---|---|---|---|---|
| 1 | 2,3,4,5,6 | 7 | 8 | 9 | 10 | 11 | |
| () | 12 | 13 | 14 | 1 | 12 | 16 | 15 |
| (meV) | 4.284 | 4.284 | 4.080 | 0.434 | 4.284 | 6.344 | 4.284 |
| (Å) | 1.861 | 1.861 | 1.899 | 0.621 | 1.861 | 1.711 | 1.861 |
| () | 0.066 | 0 | -0.463 | 0.286 | 0.580 | -0.504 | 0.035 |
| (meV) | 61.5 | 87.3 | 47.7 | 31.3 | 61.5 | 42.8 | 87.3 |
| (Å) | 3.52 | 3.44 | 3.43 | 3.08 | 3.52 | 3.36 | 3.44 |
| X—Y | C–CH, CH–CH | C–N | N–H | C=O | C–CH3 |
|---|---|---|---|---|---|
| (N/m) | 469 | 427 | 434 | 570 | 317 |
| (Å) | 1.39 | 1.405 | 1.007 | 1.222 | 1.505 |
| X–Y–Z | C–C–C | C–C–N | C–N–H | C–N–C | N–C–O | N–C–C | O–C–C |
|---|---|---|---|---|---|---|---|
| (eV) | 3.643 | 3.823 | 2.781 | 4.888 | 4.932 | 3.758 | 4.625 |
| (∘) | 120 | 117 | 118 | 128 | 123 | 116 | 120 |
| X–Y–Z–W | C–C–C–C | C–C–C–N | C–C–N–H | C–C–N–C | C–N–C–O | C–N–C–CH3 |
|---|---|---|---|---|---|---|
| (eV) | 0.63 | 0.63 | 0.21 | 0.21 | 0.42 | 0.42 |
| -1 | 1 | -1 | -1 | -1 | 1 | |
| 1 | 1 | 2 | 2 | 1 | 1 |
Energies of the deformation of the valence angles X–Y–Z are described by the potential
| (2) |
where the cosine of the valence angle is defined as , with the vectors , and bond lengths , , the vectors , , specify the coordinates of the atoms forming the valence angle , is the value of equilibrium valence angle. The values of potential parameters used for various valence angles are presented in Table 3.
Deformation of dihedral angles are described by the potential
| (3) |
where , with the vectors , . The values of potential parameters used for various dihedral angles are presented in Table 4.
For pairs of atoms Xi, ( are the numbers of atoms in the molecule) participating in the formation of the dihedral angle Xi–Y–Z–Xj, their non-valence interaction is also taken into account described by the Lennard-Jones (LJ) potential
| (4) |
with halved interaction energy , where is current distance between interacting atoms, equilibrium distance . The LJ interaction of an oxygen atom () with two combined atoms CH () was also taken into account with interaction energy and equilibrium distance . Parameter values and are shown in Table 1.
The interaction of two ACN molecules is described by the potential
| (5) |
where the 33-dimensional vector () defines the coordinates of atoms of the -th ACN (vector specifies the coordinates of the -th atom of the -th molecule), distance between atoms . Here energy , equilibrium distances , is the electric charge of -th atom (), coefficient eVÅ/. The values of the parameters , and are shown in Table 1. All values of parameters of interaction potentials (1), (2), (3) and (5) are obtained from force field AMBER Cornell1995 .
The van der Waals interactions of the atoms of the ACN molecule with flat substrate are described by the LJ potential
| (6) |
where is the distance from -th atom to the outer surface of the substrate, which is plane . Potential in Eq. (6) is the interaction energy of -th atom as a function of the distance to the substrate. This energy was found numerically for different substrates Savin2019 ; Savin2021 . The calculations showed that interaction energy with substrate can be described with a high accuracy by LJ potential (6) with power . Potential has the minimum ( is the binding energy of the -th atom with substrate). For the surface of the h-BN crystal , . The values of the parameters , , , are given in the table 1. The 10-layer fragment of h-BN crystal was used to find values of this parameters. The interaction energy of an atom with a substrate was found as the sum of all LJ potentials (4) with parameters from the force field UFF Rappe1992 .
Thus, the Hamiltonian of a system of ACN molecules located on the flat surface of h-BN crystal has the form
| (7) |
where the first term specifies the kinetic and the second – potential energy of the system
| (8) |
Here the vector specifies the coordinates of the atoms of -th ACN molecule, is the diagonal matrix of atom masses of the molecule, and are deformation energy and energy of interaction with the substrate of -th molecule, is the interaction energy of and molecules.
III Secondary structures of ACN molecules on a flat substrate
The ACN molecule is achiral, but it becomes chiral when placed on a flat substrate. Depending on which side it lies on the substrate, it can be either right (when the benzol ring is located to the right of the dipole moment vector of the peptide group ) or left (the benzol ring is located to the left). Two mirror-symmetrical isomers of the molecule are shown in Fig. 2. To transfer a molecule from one isomer to another, it must be partially torn off the substrate and be placed on the substrate with its other side. All this requires overcoming the energy barrier eV. The total energy of interaction with the h-BN substrate (desorption energy) eV. Therefore, the spontaneous transition of the ACN molecule lying on the substrate from the L to the R form and vice versa is possible only at temperatures K. At lower temperatures, the molecule will always stay on the substrate, adjoining it with the same side, i.e. without changing the isomer type.
To find the stationary state of the system of ACN molecules lying on a flat h-BN substrate, it is necessary to find the state of the system with a minimum potential energy
| (9) |
The minimization problem (9) is solved numerically by the conjugate gradient method. Choosing the starting point of the minimization procedure, one can obtain all the main stationary states of the molecular system.
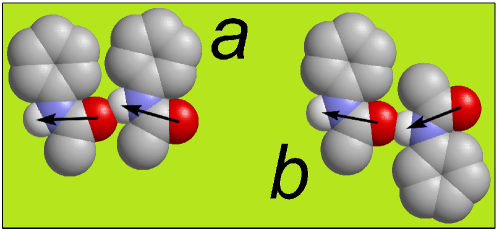
Peptide groups of neighboring molecules can form hydrogen bonds, creating dimers – see Fig. 4. The numerical solution of the problem (9) shows that when molecules are located on a flat substrate, two types of dimers are possible: dimers of molecules of the same and different chirality. If a dimer is formed by identical isomers, then its binding energy is slightly higher: the hydrogen bond energy for RR and LL isomers is eV, and for RL and LR isomers eV. This is due to the fact that in this case the benzol rings C6H5 of the molecules are on the same side and they make a larger contribution to the interaction energy. The hydrogen bond angle also depends on the chirality of the dimer molecules. For dimer molecules of the same chirality, the angle between the dipole moments of the peptide groups forming a hydrogen bond is , and for molecules of different chirality .
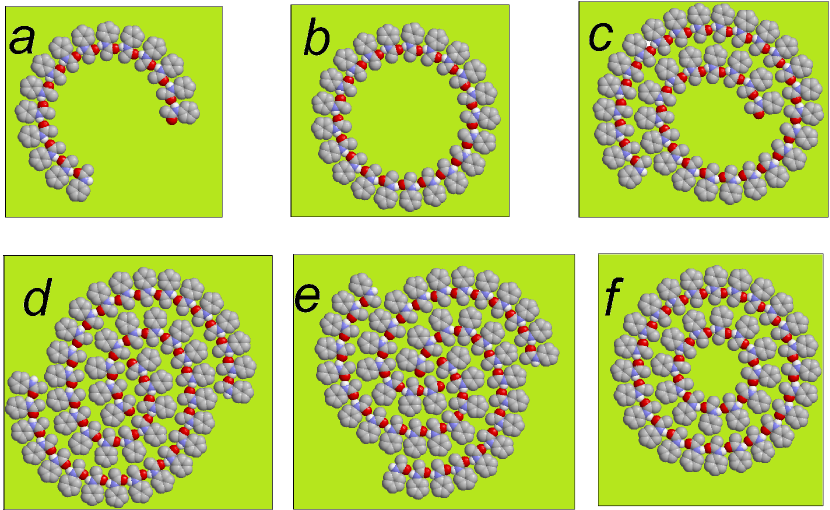
Chains of hydrogen bonds of molecules of the same chirality will always have benzol rings on one (outer) side, so they will twist in the opposite (inner) direction and have approximately the same curvature. On a plane, circular arcs, circles, and spirals have such properties. The solution of the problem (9) has shown that on a flat substrate molecules of the same chirality form stable shape structures with little changing curvature: arcs, spirals, circles – see Fig. 1 and 5. Left isomers form structures with a twist to the right, right – to the left.
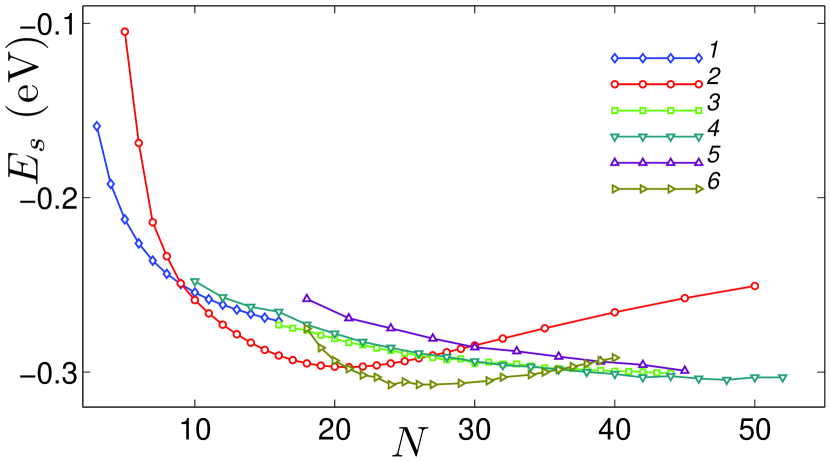
Hydrogen bond chains of ACN molecules of the same chirality form circular arcs of the same radius. The step of such a chain (the distance between the oxygen atoms of neighboring peptide groups) is Å, the angle between neighboring links is , the radius of curvature by oxygen atoms is Å – see Fig. 5 (a). The specific energy of the chain decreases monotonically with the growth of the number of molecules – see Fig. 6. When the number of links is , the arcs cease to be stable; they either close and form circular chains, or touch their ends and form flat spirals – see Fig. 5 (b), (c).
Stable cyclic chains can be formed from molecules of the same chirality. The dependence of the specific energy of the cyclic chain on the number of its links is shown in Fig. 6. As can be seen from the figure, the most energetically favorable are cyclic chains of , 21, 22 links. Such chains form ring structures with inner , 28.8, 30.5 and outer radii , 41.9, 43.6 Å.
The dependence for a one-beam spiral actually continues the dependence for an arc (see Fig. 6, curves 1 and 3). Two-beam and three-beam spirals are bound states of arc structures. The specific energy of helical structures decreases monotonically with an increase in the number of molecules. For , helical structures are more energy efficient than ring structures (this is due to their denser structure).
The most energy-efficient are nested structures of two circles with the number of atoms , 15+27, 17+29 (the first number in the sum corresponds the number of atoms in the inner circle, the second – in the outer circle) – see Fig. 6, curve 6.
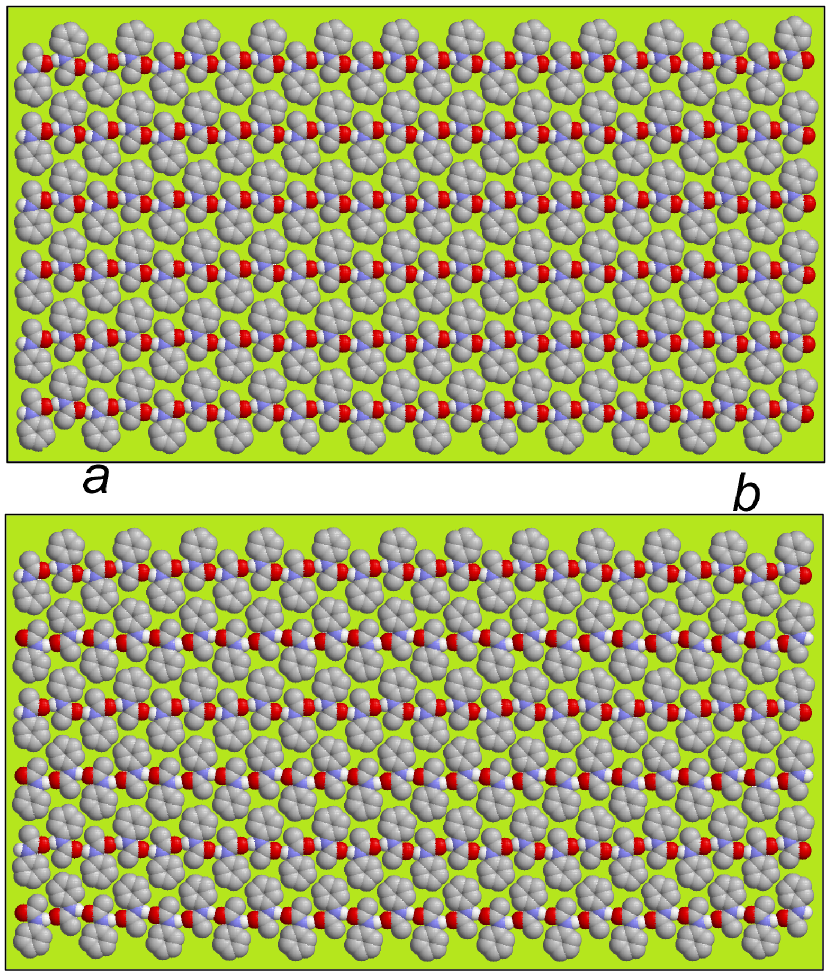
If the chain of hydrogen bonds consists of a random sequence of isomers, then it will look like an irregular broken line. The chain has the shape of a straight zigzag only if there is a strict alternation of L and R isomers. In this case, the zigzag step (the distance between the oxygen atoms of neighboring molecules) is Å, the zigzag angle is . Such chains on a flat substrate surface can form two-dimensional regular lattices (2D crystals) with parallel and antiparallel packing of neighboring chains – see Fig. 7. With parallel packing, the crystal periods are Å, Å, the specific energy is eV. With antiparallel packing, periods are Å, Å, energy is eV.
IV Self-assembly of molecular structures
Let us simulate the self-organization of the molecular structures of ACN molecules on the flat surface of the h-BN crystal. To do this, we take a square periodic cell of size nm2 on the surface of the substrate and randomly place ACN molecules into it. Then we immerse this molecular system in a Langevin thermostat of temperature and numerically simulate the dynamics of the system during the time ns. To do this, we numerically integrate the system of Langevin equations
| (10) |
where is the friction coefficient, is 33-dimensional vector of normally distributed random Langevin forces with the following correlations:
Here is mass of -th atom of ACN molecule, is Boltzmann constant, is temperature of the Langevin thermostat (temperature of the substrate), numbers , , .
The parameter characterizes the intensity of energy exchange between the molecular system and the thermostat. Simulation of the dynamics of ACN molecules on an h-BN sheet, taking into account the mobility of the sheet atoms, makes it possible to estimate the relaxation time ps. For the convenience of numerical integration, we will use a smaller value ps. This makes it possible to significantly reduce the time of numerical integration, which is sufficient to obtain reliable average values. After the dynamics of the molecular system reaches the steady state, we will find the time averages of the system energy and the number of hydrogen bonds . We assume that two ACN molecules form a hydrogen bond if their interaction energy is greater than half of the hydrogen bond energy: eV.
The state of the system can be conveniently characterized by its dimensionless heat capacity
| (11) |
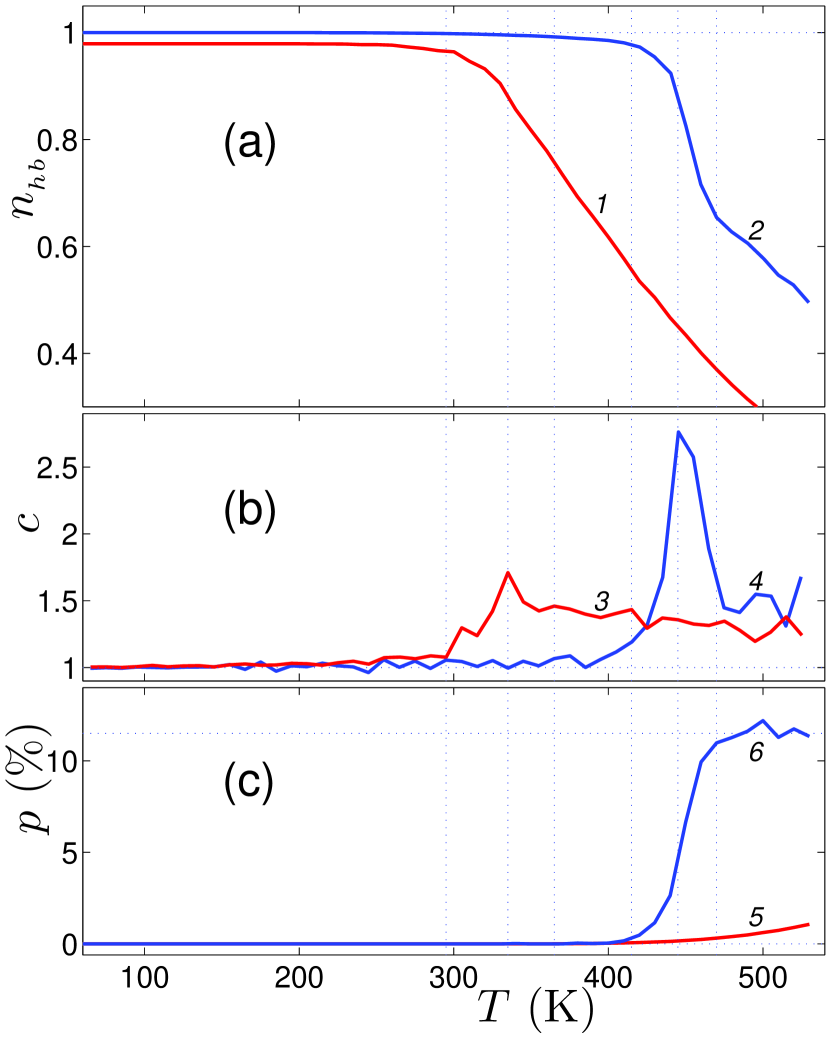
and the normalized number of hydrogen bonds . The dependence of these quantities on temperature is shown in Fig. 8.
Numerical simulation shows the existence of three characteristic temperature values . At K the molecules on a flat substrate form a stable system of chains of hydrogen bonds. Here, almost every molecule participates in the formation of one hydrogen bond (number ). The dimensionless heat capacity of the system is . At K, a slight decrease in the number of bonds and a monotonous increase in heat capacity begin to occur – the process of melting of hydrogen bond chains begins. At a temperature , the number of hydrogen bonds decreases in proportion to the increase in temperature, and the heat capacity reaches a constant value . Here we have a melt of short chains of hydrogen bonds (the average length of the chains decreases proportionally to the increase in temperature). At K, individual molecules can already be detached from the substrate – desorption of molecules begins.
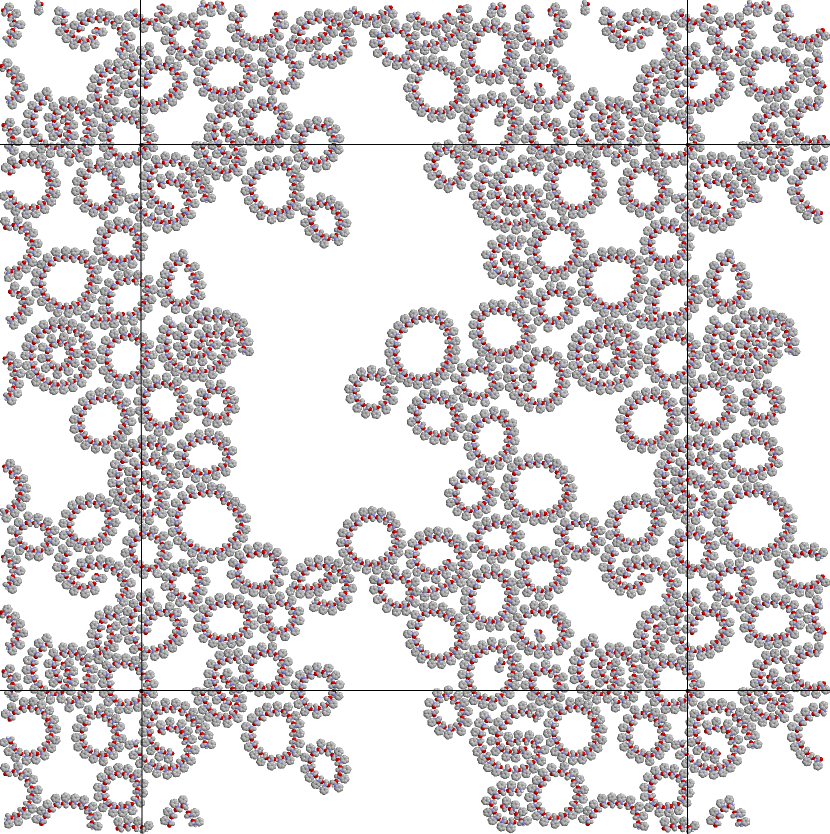
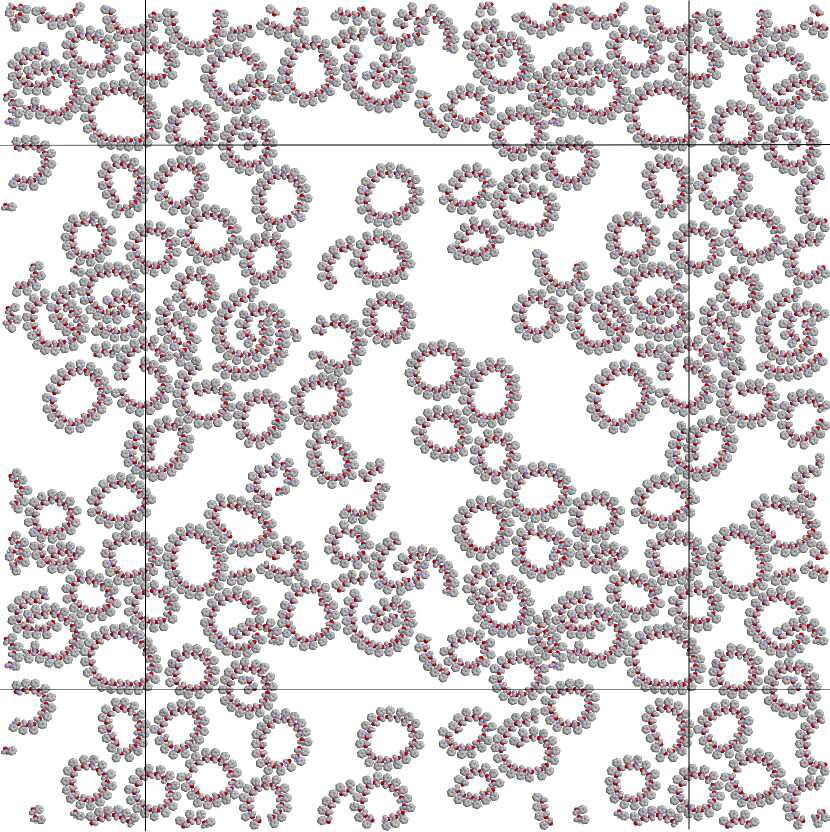
The structure of the resulting system of hydrogen bond chains depends on the isomeric composition of the molecules. If all molecules are homochiral (only one isomer is present), then secondary structures form on the surface of the substrate. These structures are circular and spiral hydrogen bond chains – see Figs. 9 and 10. The substrate surface become optically active, the left isomers form chains with a right twist, and the right ones with a left twist. As can be seen from Fig. 9 for K on a flat substrate all possible circular secondary structures (arcs, circles, spirals) are formed (Fig. 5). An increase in temperature leads, first of all, to the destruction of spiral structures. As a result, the number of cyclic chains of average radius increases since they are the most stable – see Fig. 10.
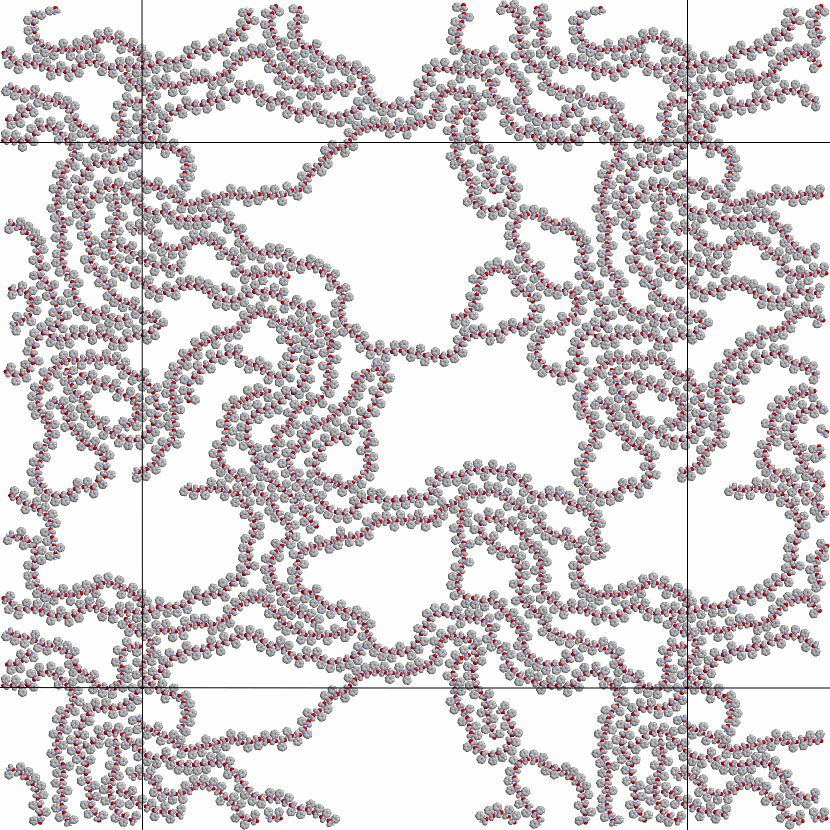
If the isomers of molecules are taken randomly, we get their racemic mixture. In this case, no secondary structures are formed. There are only curvilinear chains of random shape – see Fig. 11.
V Melting of 2D crystals
To simulate the dynamics of 2D crystals of ACN molecules on a flat h-BN substrate, consider a crystal formed by 22 linear chains of hydrogen bonds of 48 molecules (total number of molecules ). A crystal with parallel chain packing has dimensions of nm2. We place the crystal in the center of the calculated periodic cell size nm2. In this case, the chains of hydrogen bonds located parallel to the axis are closed, and the first chain begins to come into contact with the last one – the 2D crystal form a dense packing on the substrate that has no edges and has normalized number of hydrogen bonds (the number of hydrogen bonds is equal to the number of molecules). To simulate a rectangular crystal with edges (square crystallite), we take a periodic computational cell of size nm2. In this case, the 2D crystal (crystallite) covers only 25% substrate surface, the chains of hydrogen bonds are not closed, the normalized number of hydrogen bonds is .
Then we numerically integrate the system of equations of motion (10) with the initial condition corresponding to the stationary state of the crystal. At different thermostat temperatures, we find the average values of the system energy , the normalized number of hydrogen bonds , and the fraction of molecules that left the substrate from the first layer (the fraction of molecules located on the substrate at distance Å). Next, using the formula (11), we find the temperature dependence of the heat capacity of the molecular system .
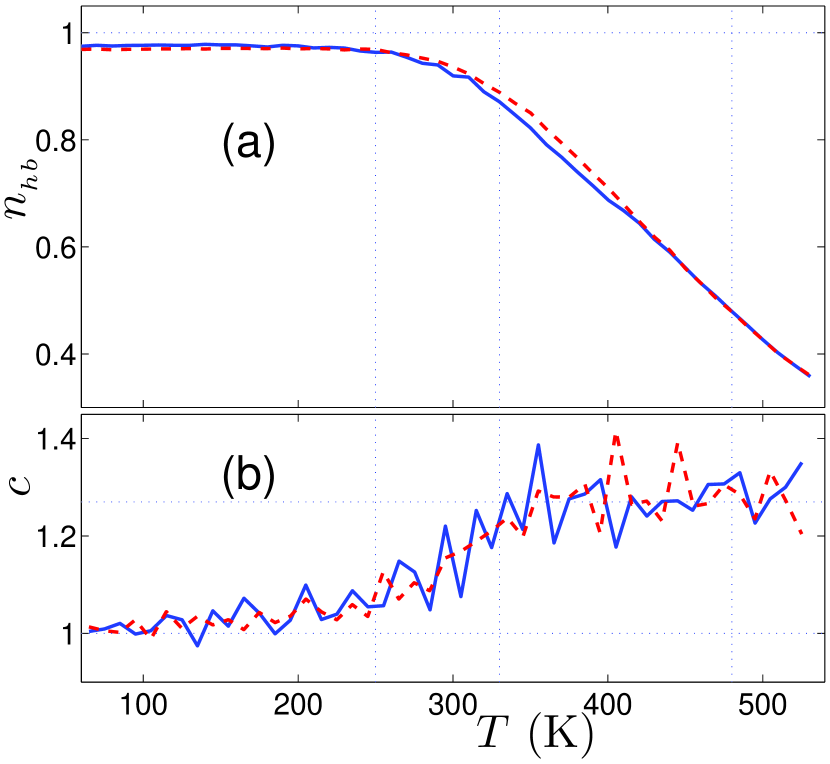
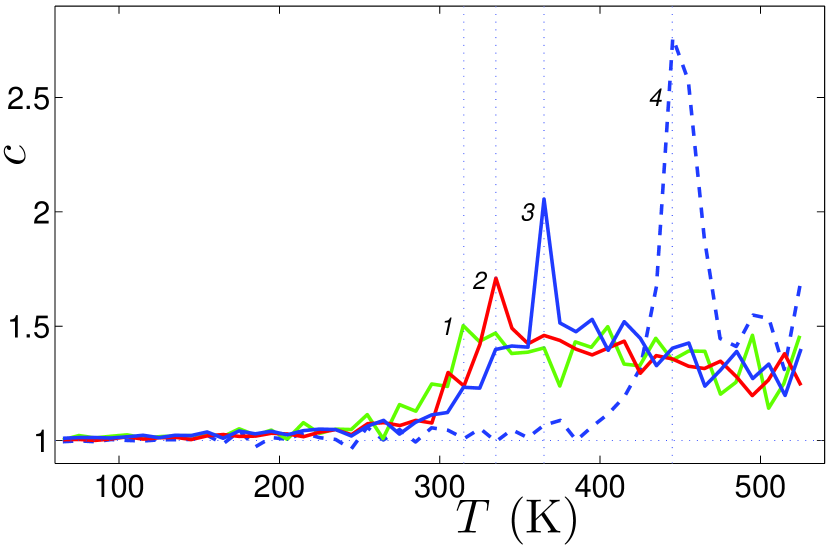
The dependence of , , and on the thermostat temperature (on the substrate temperature) is shown in Fig. 12. As can be seen from the figure, at 25% coverage of the substrate, the square crystallite begins to melt at a temperature of K. At , the crystal structure is preserved, the number of bonds, heat capacity, and density of the first layer of the substrate coating practically do not change with increasing temperature: , , . Crystallite melting occurs in the temperature range where the upper temperature is K. Here, a slight decrease in the number of bonds and an increase in heat capacity begin to occur. The heat capacity reaches its maximum value at the temperature K. In the temperature interval , an increasing destruction of the edges of the initial crystallite occurs. The ends of the chains peel off from the central part of the crystallite, then break off and go to the free part of the substrate. As a result of this ”continuous” melting, the crystallite transforms into a melt consisting of short chains of hydrogen bonds, uniformly covering the entire substrate.
For , the number of hydrogen bonds decreases in proportion to the increase in temperature, while the heat capacity remains almost constant: . It can be concluded that a complete transition of the molecular system from a low-energy and low-entropy crystalline state to a high-energy and high-entropy liquid state has taken place. As a result of this transition, the substrate is uniformly covered with a ”solution” of short chains of hydrogen bonds. The chain lengths decreases monotonically with increasing temperature (on the Fig. 12 (a) this manifests itself in a monotonous decrease in the number of bonds). All molecules remain directly adjacent to the substrate (), insignificant desorption is observed only at K – see Fig. 12 (c).
With 100% coverage of the substrate, due to the absence of edges in the crystal, its melting occurs at higher temperatures and happens according to a different scenario. Here melting also occurs ”continuously” in the temperature interval , where , K. The peak of the heat capacity at K becomes more pronounced. Melting occurs due to the expulsion of some molecules from the first layer to the second, which manifests itself in a monotonous increase in the fraction of displaced molecules at – see Fig. 12 (c). As a result, the density of the first layer during melting decreases by 11%, and after melting a dense melt of molecules is formed on the substrate, in which 11% of the molecules are located on the second layer from the substrate.
Conventionally, the temperature value , at which the heat capacity has reached its maximum value, can be considered as the melting temperature of a 2D crystal. However melting occurs not discretely, but continuously in the temperature interval . The value is in the center of this interval.
To study the dependence of the melting temperature on the crystallite size, we analyze numerically the melting of 2D square crystallite of and 2376 ACN molecules placed on a flat substrate with periodic computational cell of size and nm2. Our results show that melting occurs continuously for all crystallite sizes. When the crystallite size is increased, the melting interval shifts to the right and, in the limit, coincides with the melting temperature interval of a 2D crystal with 100% coverage of the substrate, as shown in Fig. 13.
Let us note that the continuum melting scenario also takes place for 2D n-alkane crystals lying on a flat surface of graphite Zhang2021 . This allows us to conclude that the quasi-continuous melting scenario is a characteristic feature of 2D systems of molecules adsorbed by a flat surface.
VI Conclusion
Our numerical simulations of the dynamics of the system of acetanilide molecules have revealed that the structures achiral in three-dimensional space become chiral when being placed on a flat substrate: Depending on the side it touches the substrate, the molecule has two isomers L and R. The homochirality of the molecules leads to the appearance of stable secondary structures stabilized by hydrogen bonds on a flat substrate in the form of arc, cyclic, and helical chains of hydrogen bonds and their complexes.
Hydrogen-bond chains of molecules of the same chirality form circular arcs of the same radius. When the number of molecules in the chain is , the arcs becomes unstable, they either collapse into circles, or touch their ends and form flat spirals. In addition to single-beam spirals, two- and three-beam spirals may exist being bound states of arc chains.
Stable cyclic chains can be formed from molecules of the same chirality. The most energetically favorable are cyclic chains of 20, 21 and 22 links. The structures of two circles with the number of atoms , , (where the first number of the sum is the number of atoms in the inner circle, and the second number is the number of atoms in the outer circle) are more energy efficient.
If the chain of hydrogen bonds consists of a random sequence of isomers, it look like an irregular broken line. A chain can take the form of a rectilinear zigzag only if there is a strict alternation of the L and R isomers. Such chains can form regular two-dimensional crystals with parallel and antiparallel packing of the adjacent chains.
Simulation of the dynamics of a system of molecules shows that the homochirality of molecules(the presence of only one isomer) leads to the appearance of stable secondary structures on the surface of the substrate, i.e. to the appearance of chains of hydrogen bonds in the form of arcs, circles and spirals. As a result, the substrate surface becomes optically active, the left isomers form chains with a right twist, and the right ones form chain with a left twist. At temperature K, all possible secondary structures are formed on the substrate. An increase in temperature leads, first of all, to the disintegration of spiral structures. As a result, the number of more stable circular chains increases.
If the molecules on the substrate form a racemic mixture, no regular secondary structures are formed, so only curvilinear chains of hydrogen bonds of random shape can appear. Thus, our results demonstrate the importance of homochirality (chiral purity) of biomolecules for the formation of stable secondary molecular structures.
Numerical simulations of the dynamics of a 2D crystal of the ACN molecules shows that the scenario of crystal melting depends on the density of its coverage of the substrate.
At 25% coverage of the substrate the melting occurs ”continuously” in the temperature interval from the edges of the initial crystallite (for crystallite of 1056 ACN molecules temperatures , K). The ends of the chains peel off from the central part of the crystallite, then break off and go to the free part of the substrate. As a result, the crystallite transforms into a melt consisting of short chains of hydrogen bonds, uniformly covering the entire substrate. When the size of the crystallite is increased, the melting interval shifts to the right and, in the limit, will coincides with the melting temperature interval of infinite crystal with 100% coverage of the substrate.
For 100% coverage of the substrate with no crystal edges, the melting occurs at higher temperatures K by a shift of some molecules from the first to the second layer in the substrate. As a result, the density of the first layer during melting decreases by 11%, and after melting, 11% of the molecules move to the second layer formed on the substrate.
A continual melting scenario (the presence of a melting temperature interval)has also been found in 2D n-alkane crystals lying on a flat surface of graphite Zhang2021 . All this leads us to conclusion that the quasi-continuous melting scenario is a characteristic feature of 2D systems of molecules adsorbed by a flat surface.
ACKNOWLEDGMENTS
AVS acknowledges the use of the computational facilities provided by the Interdepartmental Supercomputer Center of the Russian Academy of Science. YSK acknowledges a support from the Australian Research Council (grant DP210101292) and the Strategic Fund of the Australian National University.
References
- (1) K. S. Novoselov, A. K. Geim, S. V. Morozov, D. Jiang, Y. Zhang, S. V. Dubonos, I. V. Grigorieva and A. A. Firsov. Electric Field Effect in Atomically Thin Carbon Films. Science 306 (5696), 666-669 (2004).
- (2) A. H. Castro Neto, F. Guinea, N. M. R. Peres, K. S. Novoselov and A. K. Geim. The electronic properties of graphene. Rev. Mod. Phys. 81, 109-162 (2009).
- (3) E. Koren, I. Leven, E. Lortscher, A. Knoll, O. Hod and U. Duerig. Coherent commensurate electronic states at the interface between misoriented graphene layers. Nature Nanotech. 11, 752-757 (2016).
- (4) J. C. Meyer, A. K. Geim, M. Katsnelson, K. Novoselov, T. Booth and S. Roth. The structure of suspended graphene sheets. Nature 446, 60-63 (2007).
- (5) C. Lee, X. Wei, J. W. Kysar and J. Hone. Measurement of the Elastic Properties and Intrinsic Strength of Monolayer Graphene. Science 321, 385-388 (2008).
- (6) A. Falin, Q. Cai, E. J. G. Santos, D. Scullion, D. Qian, R. Zhang, Z. Yang, S. Huang, K. Watanabe, T. Taniguchi, M. R. Barnett, Y. Chen, R. S. Ruoff and L. H. Li. Mechanical properties of atomically thin boron nitride and the role of interlayer interactions. Nat. Commun. 8, 15815 (2017).
- (7) E. Han, J. Yu, E. Annevelink, J. Son, D. A. Kang, K. Watanabe, T. Taniguchi, E. Ertekin, P. Y. Huang and A. M. van der Zande. Ultrasoft slip-mediated bending in few-layer graphene. Nature Materials 19, 305-309 (2020).
- (8) I. Leven, D. Krepel, O. Shemesh, and O. Hod. Robust Superlubricity in Graphene/h-BN Heterojunctions. J. Phys. Chem. Lett. 4, 115-120 (2013).
- (9) A. Geim and I. Grigorieva. Van der Waals heterostructures. Nature 499, 419-425 (2013).
- (10) K. S. Novoselov, A. Mishchenko, A. Carvalho and A. H. Castro Neto. 2D materials and van der Waals heterostructures. Science 353 (6298), 461 (2016).
- (11) C. R. Woods, L. Britnell, A. Eckmann, R. S. Ma, J. C. Lu, H. M. Guo, X. Lin, G. L. Yu, Y. Cao, R. V. Gorbachev, A. V. Kretinin, J. Park, L. A. Ponomarenko, M. I. Katsnelson, Y. N. Gornostyrev, K. Watanabe, T. Taniguchi, C. Casiraghi, H. J. Gao, A. K. Geim and K. S. Novoselov. Commensurate-incommensurate transition in graphene on hexagonal boron nitride. Nature Phys. 10, 451-456 (2014).
- (12) G. J. Slotman, M. M. van Wijk, P. L. Zhao, A. Fasolino, M. I. Katsnelson and S. Yuan. Effect of Structural Relaxation on the Electronic Structure of Graphene on Hexagonal Boron Nitride. Phys. Rev. Lett. 115, 186801 (2015).
- (13) D. Mandelli, I. Leven, O. Hod and M. Urbakh. Sliding friction of graphene/hexagonal-boron nitride heterojunctions: a route to robust superlubricity. Sci. Rep. 7 (1), 10851 (2017).
- (14) D. Jariwala, T. J. Marks and M. C. Hersam. Mixed-dimensional van der Waals heterostructures. Nature Mater 16, 170-181 (2017).
- (15) O. V. Ershova, T. C. Lillestolen and E. Bichoutskaia. Study of polycyclic aromatic hydrocarbons adsorbed on graphene using density functional theory with empirical dispersion correction. Phys. Chem. Chem. Phys., 12, 6483-6491 (2010).
- (16) E. G. Gordeev, M. V. Polynski and V. P. Ananikov. Fast and accurate computational modeling of adsorption on graphene: a dispersion interaction challenge. Phys. Chem. Chem. Phys., 15, 18815-18821 (2013).
- (17) J. Wang, Z. Chen and B. Chen. Adsorption of polycyclic aromatic hydrocarbons by graphene and graphene oxide nanosheets. Environ. Sci. Technol., 48, 4817-4825 (2014).
- (18) M. Castro and E. Chigo-Anota. BN and BN oxide nanosheets based nanosensor for Paracetamol adsorption: A Density Functional investigation. Mex. J. Mat. Sci. Eng., 1, 21-29 (2014).
- (19) P. P. Zhou and R. Q. Zhang. Physisorption of benzene derivatives on graphene: critical roles of steric and stereoelectronic effects of the substituent. Phys. Chem. Chem. Phys., 17, 12185-12193 (2015).
- (20) V. Georgakilas, M. Otyepka, A. B. Bourlinos, V. Chandra, N. Kim, K. C. Kemp, P. Hobza, R. Zboril and K. S. Kim. Functionalization of Graphene: Covalent and Non-Covalent Approaches, Derivatives and Applications. Chem. Rev., 112, 6156-6214 (2012).
- (21) V. Georgakilas, J. N. Tiwari, K. C. Kemp, J. A. Perman, A. B. Bourlinos, K. S. Kim, and R. Zboril. Noncovalent Functionalization of Graphene and Graphene Oxide for Energy Materials, Biosensing, Catalytic, and Biomedical Applications. Chem. Rev., 116, 5464-5519 (2016).
- (22) R. Thakkar, S. Gajaweera and J. Comer. Organic contaminants and atmospheric nitrogen at the graphene-water interface: a simulation study. Nanoscale Adv., 4, 1741 (2022).
- (23) S. M. Barlow, R. Raval. Complex organic molecules at metal surfaces: bonding, organisation and chirality. Surface Science Reports, 50, 201-341 (2003).
- (24) H. Cao, M.-P. Van Den Eede, G. Koeckelberghs, K. S. Mali and S. De Feyter. Direct observation of the influence of chirality on the microstructure of regioregular poly- (3-alkylthiophene)s at the liquid/solid interface. Chem. Commun., 53, 153-156 (2017).
- (25) E. Bahn, H. Hedgeland, A. P. Jardine, P. F. Henry, T. C. Hansen and P. Fouquet. The structure of deuterated benzene films adsorbed on the graphite (0001) basal plane: what happens below and above the monolayer coverage? Phys. Chem. Chem. Phys., 16, 22116 (2014).
- (26) F. Schedin, A. K. Geim, S. V. Morozov, E. W. Hill, P. Blake, M. I. Katsnelson, K. S. Novoselov. Detection of individual gas molecules adsorbed on graphene. Nat. Mater., 6, 652-655 (2007).
- (27) Y. Shao, J. Wang, H. Wu, J. Liu, I. a. Aksay and Y. Lin. Graphene Based Electrochemical Sensors and Biosensors: A Review. Electroanalysis, 22, 1027-1036 (2010).
- (28) X. V. Zhen, E. G. Swanson, J. T. Nelson, Y. Zhang, Q. Su, S. J. Koester, and P. Buhlmann. Noncovalent Monolayer Modification of Graphene Using Pyrene and Cyclodextrin Receptors for Chemical Sensing. ACS Appl. Nano Mater. 1, 2718-2726 (2018).
- (29) Z. Iranmanesh-Zarandy and M. Dehestani. Molecular Dynamics Simulation of Paracetamol Drug Adsorption on Boron Nitride Nanotube: Effects of Temperature, Nanotube Length, Diameter, and Chirality. ChemistrySelect, 4, 7866 -7873 (2019).
- (30) X. Kang, J. Wang, H. Wu, J. Liu, I. A. Aksay, Y. Lin. A graphene-based electrochemical sensor for sensitive detection of paracetamol. Talanta, 81, 754-759 (2010).
- (31) M. Lian, J. Fan, Z. Shi, H. Li, J. Yin. Kevlar-functionalized graphene nanoribbon for polymer reinforcement. Polymer, 55(10), 2578-2587 (2014).
- (32) S. Kumar. Graphene Engendered 2-D Structural Morphology of Aluminium Atoms: Molecular Dynamics Simulation study. Materials Chemistry and Physics, 202, 329-339 (2017).
- (33) M. W. Roth, C. L. Pint and C. Wexler. Phase transitions in hexane monolayers physisorbed onto graphite. Phys. Rev. B, 71, 155427 (2005).
- (34) Cary L. Pint, M. W. Roth and C. Wexler. Behavior of hexane on graphite at near-monolayer densities: Molecular dynamics study. Phys. Rev. B, 73, 085422 (2006).
- (35) K. E. Becker. Accelerated molecular dynamics simulation of the thermal desorption of n-alkanes from the basal plane of graphite. J. Chem. Phys. 125, 184706 (2006).
- (36) Q. Chen, H.-J. Yan, C.-J. Yan, G.-B. Pan, L.-J. Wan, G.-Y. Wen, D.-Q. Zhang. STM investigation of the dependence of alkane and alkane (C18H38, C19H40) derivatives self-assembly on molecular chemical structure on HOPG surface. Surface Science, 602 1256-1266 (2008).
- (37) M. J. Connolly, M. W. Roth, P. A. Gray, and C. Wexler. Explicit Hydrogen Molecular Dynamics Simulations of Hexane Deposited onto Graphite at Various Coverages. Langmuir, 24(7), 3228-3234 (2008).
- (38) T. Yang, S. Berber, J.-F. Liu, G. P. Miller and D. Tomanek. Self-assembly of long chain alkanes and their derivatives on graphite. J. Chem. Phes., 128, 124709 (2008).
- (39) M. W. Roth, L. Firlej, B. Kuchta, M. J. Connolly, E. Maldonado, and C. Wexler. Simulation and Characterization of Tetracosane on Graphite: Molecular Dynamics Beyond the Monolayer. J. Phys. Chem. C, 120(2), 984-994 (2016).
- (40) T. K. Piskorz, C. Gobbo, S. J. Marrink, S. De Feyter, A. H. de Vries, and J. H. van Esch. Nucleation Mechanisms of Self-Assembled Physisorbed Monolayers on Graphite. J. Phys. Chem. C 123(28), 17510-17520 (2019).
- (41) L. Y. Fang, Y. Hua, Z. Z. Meng, Z. Hui. Molecular dynamics simulations on the orientation of n-alkanes with different lengths on graphene. Surface Science, 690, 121468 (2019).
- (42) R. Zhang, W. S. Fall, K. W. Hall, G. A. Gehring, X. Zeng, G. Ungar. Quasi-continuous melting of model polymer monolayers prompts reinterpretation of polymer melting. Nat. Commun., 12, 1710 (2021).
- (43) H. Yang, X. J. Zhao, and M. Sun. Induced crystallization of single-chain polyethylene on a graphite surface: Molecular dynamics simulation. Phys. Rev. E, 84, 011803 (2011).
- (44) M. Gulde, A. N. Rissanou, V. Harmandaris, M. Müller, S. Schäfer, and C. Ropers. Dynamics and Structure of Monolayer Polymer Crystallites on Graphene. Nano Lett. 16(11), 6994-7000 (2016).
- (45) Y. F. Liu, H. Yang, H. Zhang. Molecular dynamics simulation of the folding of single alkane chains with different lengths on single-walled carbon nanotubes and graphene. Journal of Molecular Modeling, 24, 140 (2018).
- (46) C. L. Pint. Different melting behavior in pentane and heptane monolayers on graphite: Molecular dynamics simulations. Phys. Rev. B, 73, 045415 (2006).
- (47) H.Yang, Z.-S. Li, Z.-Y. Lu, C.-C. Sun. Molecular dynamics simulations study on the melting process of n-heptane layer(s) adsorbed on the graphite (0 0 1) surface. Surface Science, 600(6), 1213-1220 (2006).
- (48) C. Wexler, L. Firlej, B. Kuchta, and M. W. Roth. Melting of Hexane Monolayers Adsorbed on Graphite: The Role of Domains and Defect Formation. Langmuir, 25(12), 6596-6598 (2009).
- (49) M. Pykal, P. Jurecka, F. Karlicky, and M. Otyepka. Modelling of Graphene Functionalization. Phys. Chem. Chem. Phys., 18, 6351-6372 (2016).
- (50) S. W. Johnson, J. Eckert, M. Barthes, R. K. McMullan, and M. Muller. Crystal Structure of Acetanilide at 15 and 295 K by Neutron Diffraction. Lack of Evidence for Proton Transfer along the N-H…O Hydrogen Bond. J. Phys. Chem. 99(44), 16253-16260 (1995).
- (51) G. Careri, U. Buontempo, F. Galluzzi, A. C. Scott, E. Gratton, and E. Shyamsunder. Spectroscopic evidence for Davydov-like solitons in acetanilide. Phys. Rev. B 30, 4689 (1984).
- (52) A. Scott. Davydov’s soliton. Physics Reports 217(1), 1-67 (1992).
- (53) L. Cruzeiro, H. Freedman. The temperature dependent amide I band of crystalline acetanilide. Physics Letters A 377, 1593-1596 (2013).
- (54) L. Cruzeiro. The Amide I Band of Crystalline Acetanilide: Old Data Under New Light. In: Archilla, J., Jimenez, N., Sanchez-Morcillo, V., Garcia-Raffi, L. (eds) Quodons in Mica. Springer Series in Materials Science, 221, Springer, Cham. (2015) https://doi.org/10.1007/978-3-319-21045-2_17
- (55) W. D. Cornell, W. P. Cieplak, C. I. Bayly, I. R. Gould, K. M. Merz, D. M. Ferguson, D. C. Spellmeyer, T. Fox, J. W. Caldwell, P. A. Kollman. A second generation force field for the simulation of proteins, nucleic acids, and organic molecules, J. Am. Chem. Soc. 117(19) 5179-5197 (1995).
- (56) A. V. Savin, E. A. Korznikova, and S. V. Dmitriev. Dynamics of surface graphene ripplocations on a flat graphite substrate. Phys. Rev. B 99, 235411 (2019).
- (57) A. V. Savin. Eigenmodes and resonance vibrations of graphene nanomembranes. Phys. Rev. B, 103, 195435 (2021).
- (58) A. K. Rappe, C. J. Casewit, K. S. Colwell, W. A. Goddard III, and W. M. Skiff. UFF, a Full Periodic Table Force Field for Molecular Dynamics Simulations., J. Am. Chem. Soc. 114(25), 10024-10035 (1992).