Single electron-spin-resonance detection by microwave photon counting
Electron spin resonance (ESR) spectroscopy is the method of choice for characterizing paramagnetic impurities, with applications ranging from chemistry to quantum computing schweiger_principles_2001 , but it gives access only to ensemble-averaged quantities due to its limited signal-to-noise ratio. Single-electron-spin sensitivity has however been reached using spin-dependent photoluminescence wrachtrup_optical_1993 ; gruber_scanning_1997 ; raha_optical_2020 , transport measurements elzerman_single-shot_2004 ; vincent_electronic_2012 ; pla_single-atom_2012 ; thiele_electrically_2014 , and scanning-probe techniques rugar_single_2004 ; baumann_electron_2015 ; grinolds_subnanometre_2014 . These methods are system-specific or sensitive only in a small detection volume, so that practical single spin detection remains an open challenge. Here, we demonstrate single electron magnetic resonance by spin fluorescence detection albertinale_detecting_2021 , using a microwave photon counter at cryogenic temperatures lescanne_irreversible_2020 . We detect individual paramagnetic erbium ions in a scheelite crystal coupled to a high-quality factor planar superconducting resonator to enhance their radiative decay rate, with a signal-to-noise ratio of in one second integration time. The fluorescence signal shows anti-bunching, proving that it comes from individual emitters. Coherence times up to ms are measured, limited by the spin radiative lifetime. The method has the potential to apply to arbitrary paramagnetic species with long enough non-radiative relaxation time, and allows single-spin detection in a volume as large as the resonator magnetic mode volume ( in the present experiment), orders of magnitude larger than other single-spin detection techniques. As such, it may find applications in magnetic resonance and quantum computing.
In ESR spectroscopy, the linewidth of an ensemble of paramagnetic centers is usually dominated by the frequency shifts that each center undergoes under the action of its local environment. This inhomogeneous broadening can reach large values (up to several GHz) and imposes a limitation to the achievable spectral resolution schweiger_principles_2001 . One radical way to overcome the inhomogeneous broadening is to perform ESR spectroscopy on individual paramagnetic centers, thus gaining several orders of magnitude in spectral resolution since single spin linewidths are typically in the kHz-MHz range gruber_scanning_1997 ; pla_single-atom_2012 ; muhonen_storing_2014 . Besides the interest for magnetic resonance spectroscopy, single spin addressing is also a necessity for most spin-based quantum computing applications.
Practical single-electron-spin-resonance should enable the detection and spectroscopy of a wide range of paramagnetic centers buried in an insulating matrix, with a sufficiently large detection volume and signal-to-noise ratio. So far, none of the approaches that achieve single-spin detection satisfy all of these requirements. Optically Detected Magnetic Resonance (ODMR) can detect individual paramagnetic centers only when suitable energy levels and cycling optical transitions are present wrachtrup_optical_1993 ; gruber_scanning_1997 ; raha_optical_2020 . ODMR-detected individual NV centers can be used to measure the spectrum of neighboring single electron spins in ambient conditions grinolds_subnanometre_2014 ; shi_single-protein_2015 ; shi_single-dna_2018 , but the detection volume is limited to by the dependence of the dipolar interaction, which makes the detection of spins far outside of the diamond host challenging. Spin-dependent transport can detect individual spins when a spin-to-charge conversion pathway is present elzerman_single-shot_2004 ; vincent_electronic_2012 ; pla_single-atom_2012 ; thiele_electrically_2014 ; baumann_electron_2015 , but this is lacking in most paramagnetic centers. Single electron-spin imaging was also achieved using Magnetic Resonance Force Microscopy rugar_single_2004 , but spectroscopy has not yet been demonstrated with this platform.
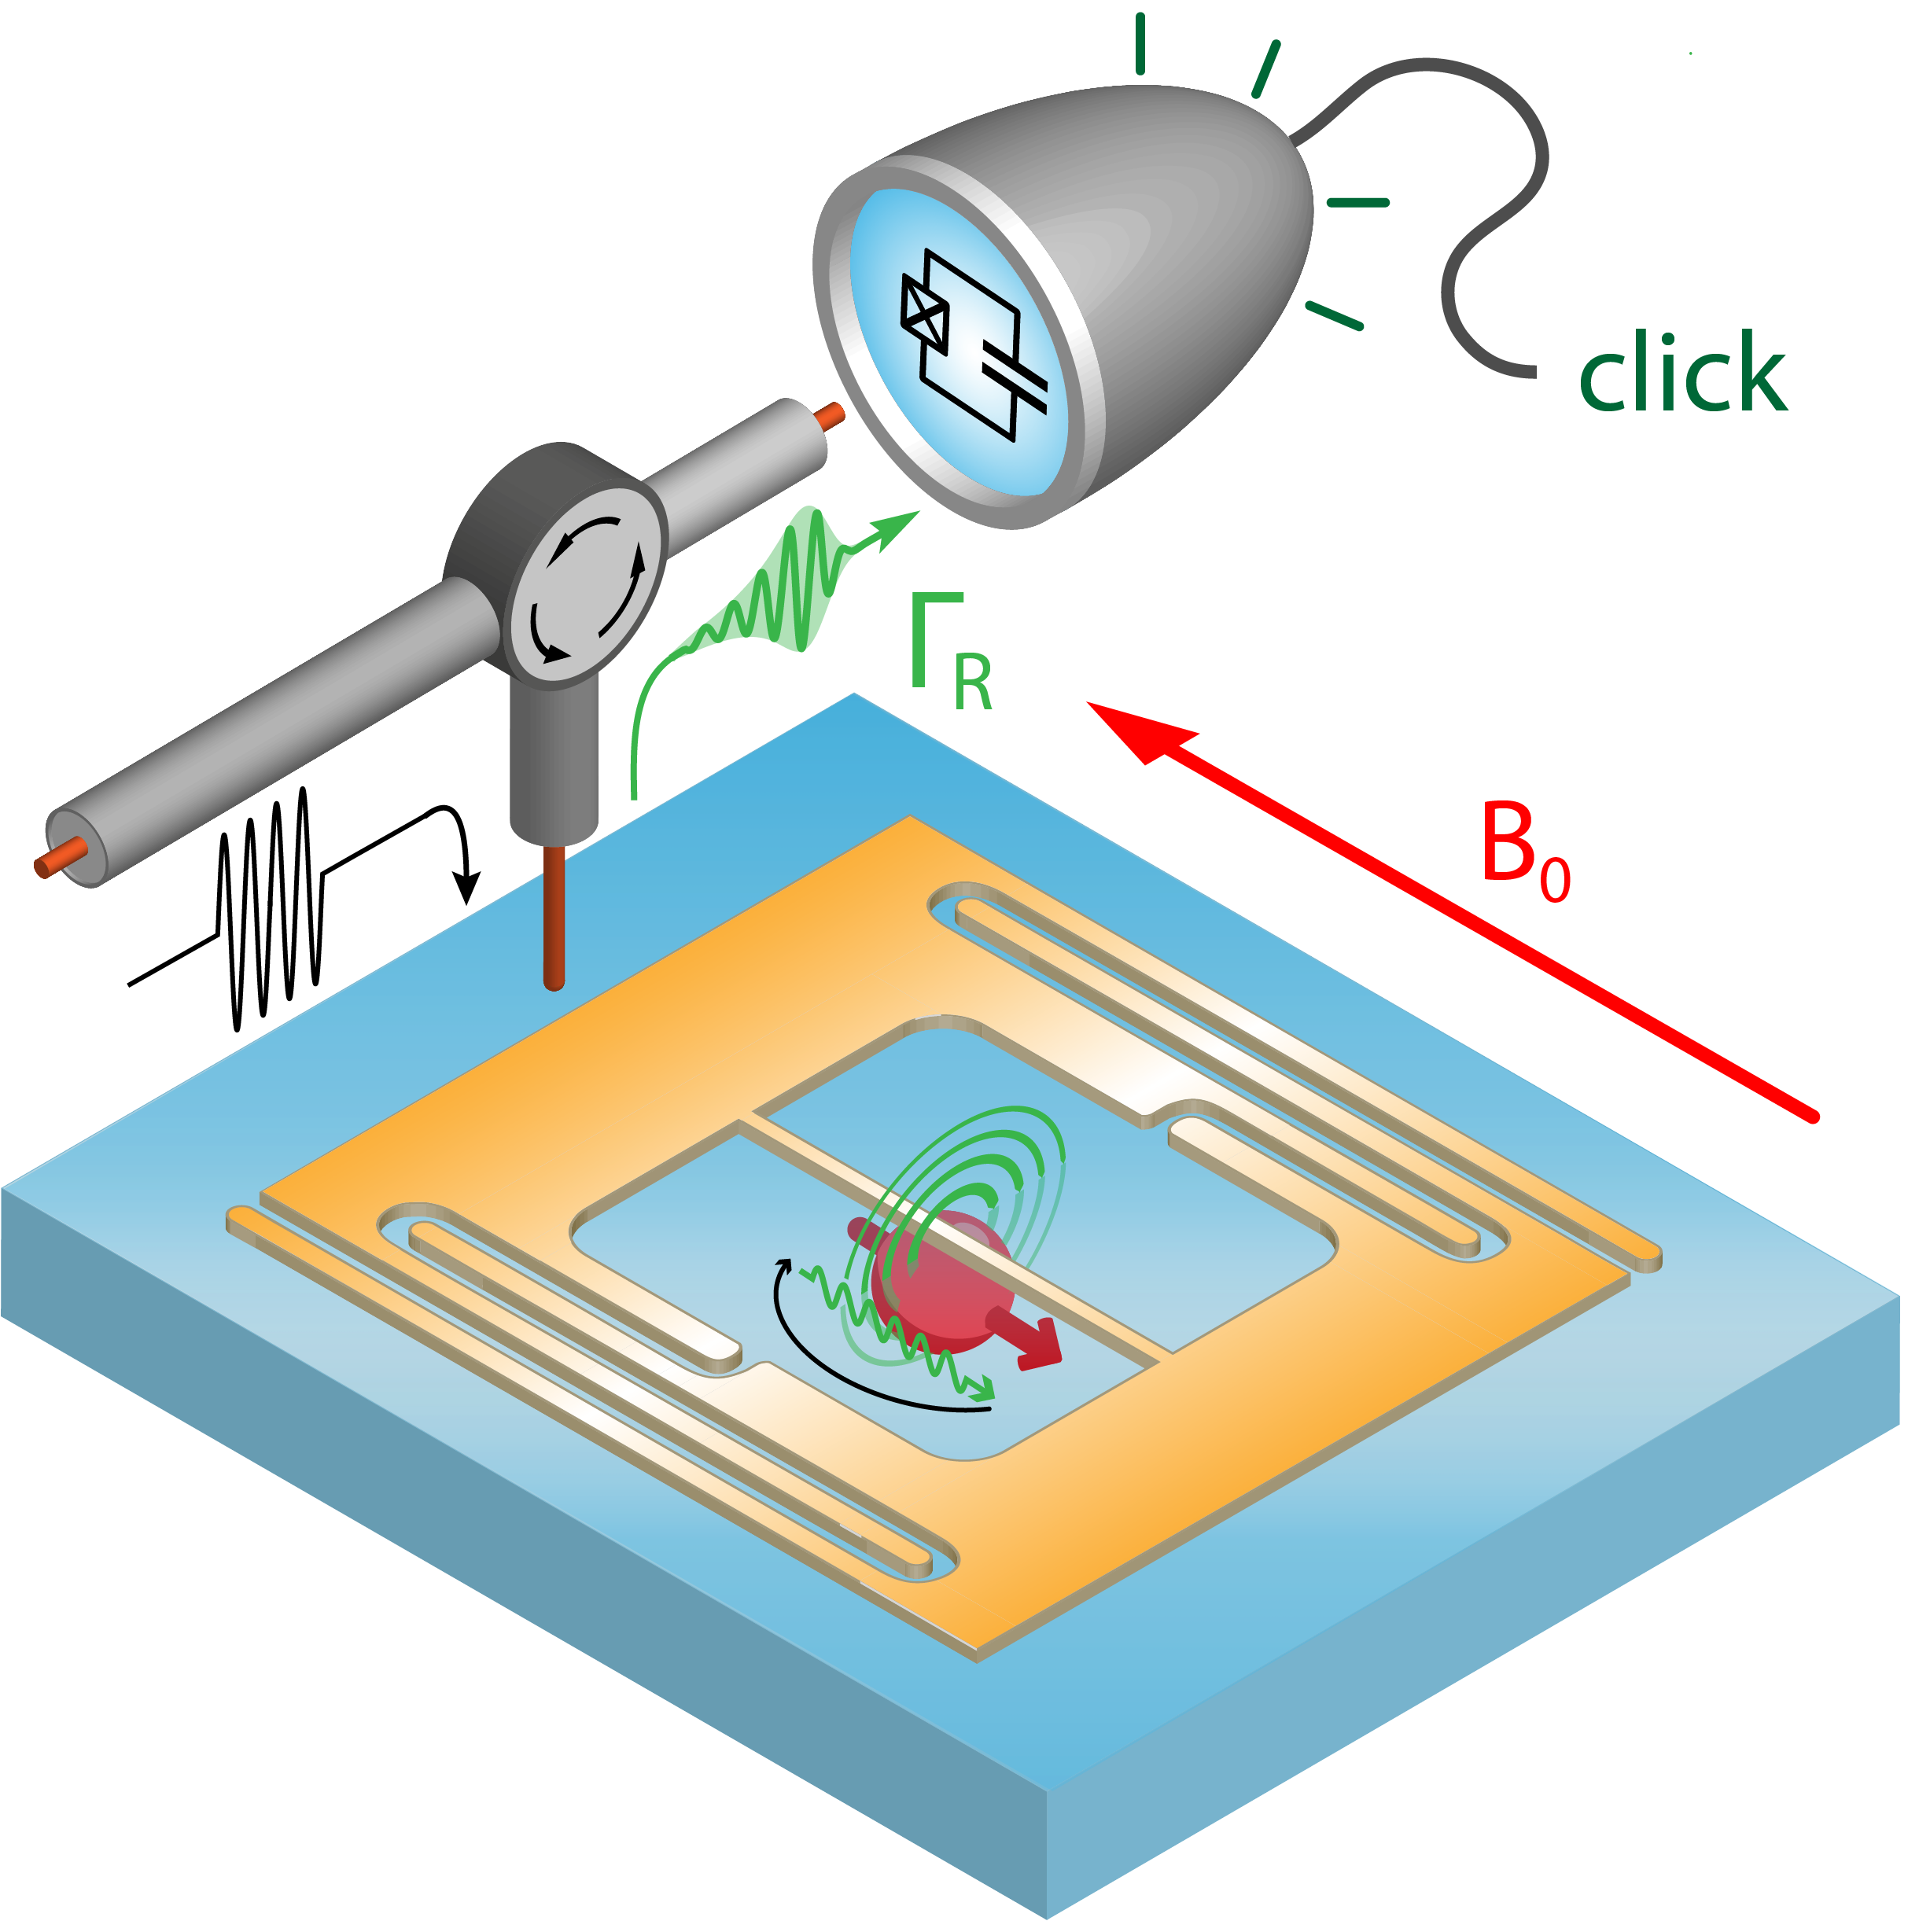
Here, we perform single electron spin resonance spectroscopy by transposing fluorescence detection, a well-established method to detect individual emitters in the optical domain at room-temperature, to microwave frequencies and millikelvin temperatures. In optical fluorescence, an emitter is excited by a short light pulse, and detected by counting the emitted photons during the radiative relaxation orrit_single_1990 ; gruber_scanning_1997 . Similarly, we excite a spin by a short microwave pulse, and detect it by counting the microwave photons it emits when returning to its ground state. Spin relaxation by spontaneous emission of microwave photons is exceedingly slow in free space; we thus enhance its rate resonantly by coupling the spin to a high-quality-factor superconducting microwave resonator of frequency bienfait_controlling_2016 , and we detect the fluorescence photon with a single-microwave-photon detector (SMPD) based on a superconducting qubit (see Fig. 1 for a schematic description). The maximum signal-to-noise ratio (SNR) reached by this method with a one second integration time scales as , where is the average number of counts generated by the radiative decay of one spin, and the SMPD dark count rate (see Methods). It is noteworthy that this SNR is only limited by technical imperfections and has no upper bound for an ideal experiment where and , in contrast with earlier proposals and experiments of circuit-QED-enhanced magnetic resonance where the SNR is ultimately limited by vacuum microwave fluctuations kubo_electron_2012 ; bienfait_reaching_2016 ; haikka_proposal_2017 ; eichler_electron_2017 ; budoyo_electron_2018 ; budoyo_electron_2020 ; ranjan_electron_2020 . In a recent experiment demonstrating the detection of impurity spins by microwave fluorescence, this single-spin SNR was albertinale_detecting_2021 , thus insufficient for single-spin detection. Here, we reach a single-spin SNR of by improving the resonator design, the SMPD performance, and by using spins with a larger gyromagnetic ratio. Our method could be applicable to a broad class of paramagnetic impurities and offers a detection volume that can be large ( in the present experiment). It is therefore promising for operational single electron spin resonance at cryogenic temperatures.
We demonstrate this method with rare-earth ions in a crystal, specifically ions in a scheelite crystal of , which has tetragonal symmetry around its -axis. The crystal used in the experiment was grown undoped, but has a residual erbium concentration ppb (see Methods), which corresponds to a average distance between neighboring ions. At low temperatures, only the ground state Kramers doublet of is populated; it behaves as an effective spin with frequency , where is the applied magnetic field and the ion gyromagnetic tensor. The ensemble-averaged gyromagnetic tensor determines the center of the ensemble resonance line ; it is diagonal in the tetragonal frame, with elements GHz/T, and GHz/T antipin_a._paramagnetic_1968 . Due to inhomogeneous broadening however, each individual ion has a gyromagnetic tensor (with ) that slightly deviates from mims_broadening_1966 .
The planar resonator is patterned on top of the crystal, out of a superconducting niobium thin-film. The heart of the device is a -wide, -long wire, which acts as a lumped inductance, shunted by a finger capacitor (see Fig. 1 and Methods) that sets the resonance frequency GHz. The wire ( direction) is oriented approximately along the crystal -axis, and the magnetic field is applied along the sample surface ( plane), at a small adjustable angle with respect to (see Methods). The resonator is coupled to a transmission line for exciting the spins and collecting their fluorescence, at a rate , whereas the total resonator damping rate also includes internal losses . A circulator routes the excitation pulses from the input line towards the sample, and the reflected pulses together with the subsequent spin fluorescence signal towards the input of a transmon-qubit-based SMPD. This detector is similar to the ones described in lescanne_irreversible_2020 ; albertinale_detecting_2021 , but has a much lower dark count rate (see Methods).
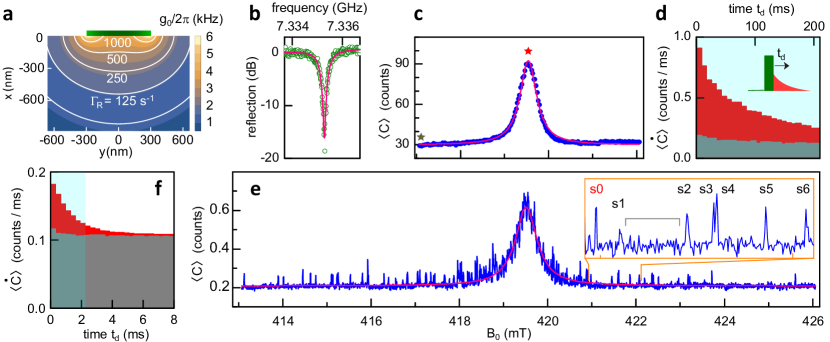
By coupling to the resonator, a spin at frequency and position demonstrates a Purcell-enhanced radiative relaxation rate that depends on its detuning to the resonator and on the magnetic field vacuum fluctuations through the spin-resonator coupling strength bienfait_controlling_2016 . To a good approximation, does not depend on the position along the wire and is orthogonal to the latter, so that the coupling strength can be re-written as . The map is shown in Fig. 2a for our resonator design, and shows that is larger than kHz, and thus is larger than , for spins located below the wire at a depth smaller than , corresponding to a volume of . This implies that , and therefore suggests that single-spin sensitivity may be reached over this whole volume.
The properties of the fluorescence signal, which is the sum of the contributions of all the spins excited by the pulse, strongly depend on the excitation power. We first record the spectrum of the resonance with a high input power ( dBm), thus exciting many weakly coupled ions that have low . The average count rate as a function of time following the pulse shows an excess compared to the dark count level (see Fig. 2d) and decays non-exponentially over a time scale of ms. We plot the average number of counts integrated over ms as a function of magnetic field applied along the direction in Fig. 2c. A smooth, approximately Lorentzian, peak is observed at mT, close to , proving it is the spin resonance. Its inhomogeneous Full-Width-Half-Maximum linewidth mT corresponds to a MHz-wide distribution.
We then record the line with dB lower excitation power while simultaneously reducing the integration time to ms, thus exciting and detecting only the most strongly coupled and fastest relaxing spins. The integrated count now shows qualitatively different behavior and appears as a sum of narrow, unevenly distributed peaks, with typical amplitude excess count over the noise floor (see Fig.2e). The fluorescence curve when tuned to one of these peaks shows an exponential decay (see Fig. 2f), with a time constant of ms. These features suggest that each peak corresponds to the microwave fluorescence signal originating from a single ion spin; analogous to the optical fluorescence spectrum of a collection of individual solid-state emitters orrit_single_1990 ; kindem_control_2020 ; dibos_atomic_2018 . Note that while we observe a large fluorescence signal at the centre of the inhomogeneous absorption line, some individual peaks are still found far from the centre; a common observation in low-density spectra of optical emitters, and a natural consequence of the random nature of inhomogeneous broadening. This is also possibly supplemented in our particular device by the strain imparted by the thermal contractions of the metallic wire on the substrate just below pla_strain-induced_2018 ; ranjan_spatially-resolved_2021 .
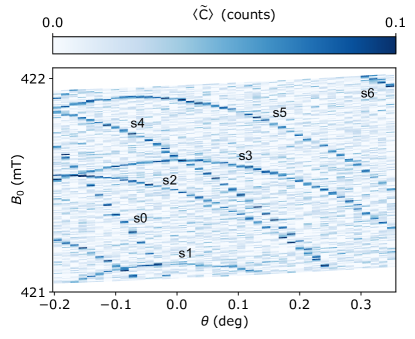
To demonstrate the stability and reproducibility of the peaks, we perform a two-dimensional magnetic field scan by recording a background-corrected average number of counts (see Methods), named hereafter, as a function of and (see Fig. 3). Eight different spin peaks are resolved, and their spectrum is readily followed in magnetic field. It appears that each ion has its own gyromagnetic tensor , close to but with different values for the principal axes and also a symmetry axis that can slightly deviate from the -axis, vividly illustrating the concept of inhomogeneous broadening. The lines are so narrow that each ion could, in principle, be determined to better than accuracy (using a suitably calibrated magnetic field). Because the deviation of the gyromagnetic tensor from the ensemble-averaged is due to the local electrostatic and strain environment, its accurate measurement can also be turned into a sensitive way to probe it (as done with NV centers in diamond in particular broadway_microscopic_2019 ). Note that our measurements also call for a better modeling of the response of rare-earth ion spins to applied electric or strain fields.
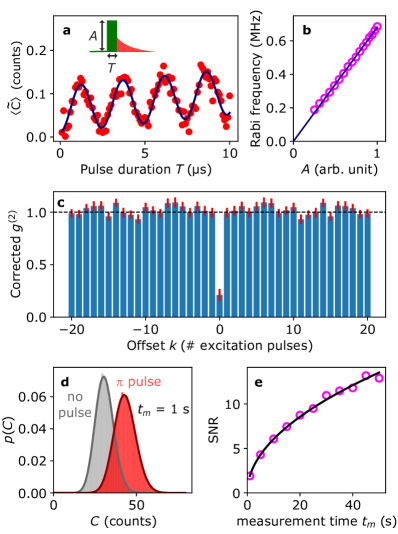
We now select one of the peaks () and bring further proof of its single-spin nature. We first measure the excess counts as a function of the microwave pulse duration, and observe sinusoidal oscillations with a frequency that depends linearly on the pulse amplitude (see Fig. 4a and b), as expected for the Rabi oscillation of a single spin. Superposed on these oscillations is a gradual increase in counts, which we attribute to heating of the bath of defects that are responsible for the resonator internal losses upon microwave excitation, as observed in albertinale_detecting_2021 (see Methods). We then use the SMPD to measure the photon statistics of the fluorescence signal and reveal its single emitter nature. For this task, we acquire a large number of fluorescence traces following a pulse, label them by index , and compute the dark-count-corrected intensity-intensity correlation function between traces whose index differs by (see Methods). For emitters, should be equal to ; in particular, should be equal to for a single-emitter since it can emit only one photon in each sequence. We measure , and for (see Fig. 4c), thus showing clear anti-bunching in each sequence, whereas the emission from different sequences is uncorrelated. The non-zero value of may be due to heating; in any case, the fact that its value is well below further suggests that the spectral peak under study is a single microwave photon emitter, in the form of an individual electron-spin.
We use the same dataset to quantify the single-spin SNR for a certain measurement time . For that, we sum the counts obtained over sequences played during a time window, integrated over the first ms following the excitation pulse, yielding the number of counts . Figure 4d shows the count probability histogram for s, with and without pulses applied. Both histograms are well reproduced by a Poissonian distribution (see Fig. 4d). The single-spin SNR defined as has a value of . Here, is the difference between the mean number of counts and the half-width of the distribution with pulse applied. A comparison with the expected SNR requires measuring the overall efficiency , which we find to be equal to by integrating the fluorescence signal after the pulse with subtracted background. This value of results from the SMPD finite efficiency, resonator internal losses, and microwave losses in-between the spin resonator and the SMPD (see Methods). We deduce an optimal theoretical SNR of (see Methods), close to our measured value. We also verify that the SNR scales as the square root of the measurement time up to at least 1 minute (see Fig. 4e), indicative of good measurement stability.
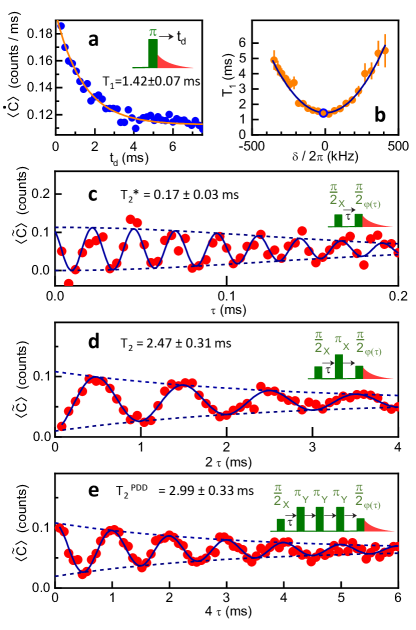
The ability to address individual spins with microwaves opens the way to using them as spin qubits for quantum computing, and it is thus interesting to characterize their coherence properties. The longitudinal relaxation time is obtained simply from the fluorescence curve decay; we select a spin () with ms (see Fig. 5a) at resonance (). We then measure the free-induction-decay time using a Ramsey sequence , with the relative inter-pulse phase , where MHz. The excess count shows oscillations at frequency , damped with an approximately Gaussian shape and a characteristic relaxation time , corresponding to a kHz single-spin linewidth (see Fig. 5c). We use the Ramsey sequence to accurately measure , making it possible to determine the dependence of the spin longitudinal relaxation time on (Fig. 5b). It is seen to increase with quadratically, in agreement with the expected dependence bienfait_controlling_2016 ; a fit yields a coupling constant kHz (see Fig. 5b). This confirms that non-radiative relaxation is negligible in our measurements (see Methods), and that for the most strongly coupled spins.
The Hahn echo coherence time is measured by applying the sequence billaud_microwave_2022 , with . An oscillation at frequency is observed in , exponentially relaxing with a characteristic time ms. This is close to the radiative decay limit , indicating that the pure dephasing echo contribution is ms, in line with measurements on ensembles of electron spins le_dantec_twenty-three-millisecond_nodate . This dephasing can be suppressed further by a 3--pulse Periodic Dynamical Decoupling sequence, yielding a transverse relaxation time ms, which is equal to to the accuracy of the measurement. These coherence times were also measured on a set of five electron spins; varies strongly among these ions (between and ), whereas and are consistently close to (see Methods). The variation of coherence time among different spins can be explained by the varying nuclear spin or paramagnetic environment of each ion, and also possibly their degree of exposure to surface magnetic noise given their approximate depth of nm according to Fig. 2 myers_probing_2014 ; ranjan_spatially-resolved_2021 . It is also noteworthy that the coherence times measured here are on par with the longest reported for individual electron spins in solid-state muhonen_storing_2014 , in a platform which gives access to several tens of these spin qubits by simply tuning the magnetic field.
We now discuss the significance of our results for practical single electron spin resonance spectroscopy. One particularly interesting aspect of our method is its applicability to a broad range of paramagnetic species, provided their radiative relaxation rate can be enhanced up to or higher by the Purcell effect, and their non-radiative relaxation rate is smaller than . Note that no requirement on the coherence time applies, as the fluorescence signal is entirely incoherent. Indeed, many paramagnetic impurities have non-radiative relaxation rates in the range of at K castle_resonance_1965 ; gayda_temperature_1979 ; zhou_electron_1999 , and thus also likely at millikelvin temperatures. Although reaching the desired radiative relaxation rate of was made easier in this work by the large transverse -factor of in , this large relaxation rate was also demonstrated for donor spins in silicon with -factors of only , using a similar resonator geometry but with a narrower and shorter wire ranjan_electron_2020 . Whereas in our experiment the spins are located in the sample supporting the resonator, it is also possible to deposit a small volume of a spin-containing insulating material, such as a powder or micro-crystal, onto a pre-fabricated resonator device. Such an approach could be suitable for measuring individual rare-earth-ion-containing molecules vincent_electronic_2012 , nanocrystals casabone_dynamic_2021 , or proteins whose active center contains a transition-metal-ion coremans_w-band_1994 ; doorslaer_strength_2007 . Based on the detection volume demonstrated here using , we extrapolate that a detection volume would be achievable for an electron-spin with a g-factor of two, under the same experimental conditions. All these metrics could be improved with better SMPD performance, in particular reduced dark count rates, highlighting a strong motivation for the continued development of SMPD devices.
In conclusion, we report spectroscopic measurements of single rare-earth-ion electron spins by detecting their microwave fluorescence, gaining four orders of magnitude in spectral resolution by resolving the ensemble inhomogeneous linewidth. In our experiment, tens of individual spins with coherence times in excess of 1 millisecond are interfaced with the same microwave resonator, which opens new perspectives for hybrid quantum computing. Because of its broad applicability, large detection volume, and spectroscopic capability, our detection method comes close to practical single electron spin resonance at cryogenic temperatures, and may thus open new applications in ESR spectroscopy.
Acknowledgements
We acknowledge technical support from P. Sénat, D. Duet, P.-F. Orfila and S. Delprat, and are grateful for fruitful discussions within the Quantronics group. We acknowledge support from the Agence Nationale de la Recherche (ANR) through the Chaire Industrielle NASNIQ under contract ANR-17-CHIN-0001 cofunded by Atos, and through the MIRESPIN (ANR-19-CE47-0011) and DARKWADOR (ANR-19-CE47-0004) projects. We acknowledge support of the Région Ile-de-France through the DIM SIRTEQ (REIMIC project), from CEA through the DRF-Impulsion porgram (grant RPENANO), from the AIDAS virtual joint laboratory, and from the France 2030 plan under the ANR-22-PETQ-0003 grant. This project has received funding from the European Union Horizon 2020 research and innovation program under ERC-2021-STG grant agreement no. 101042315 (INGENIOUS) and Marie Sklodowska-Curie grant agreement no. 792727 (SMERC). Z.W. acknowledges financial support from the Sherbrooke Quantum Institute, from the International Doctoral Action of Paris-Saclay IDEX, and from the IRL-Quantum Frontiers Lab. S.B. thanks the support of the CNRS research infrastructure INFRANALYTICS (FR 2054). We acknowledge IARPA and Lincoln Labs for providing the Josephson Traveling-Wave Parametric Amplifier.
Author contributions
A.F. and P.G. grew the crystal, which M.L.D., Z.W. and S.B. characterized through CW and pulse EPR measurements. Z.W., D.V., P.B., E.F. designed the spin resonator. Z.W. fabricated the spin resonator. L.B., E.F. designed the SMPD. L.B. fabricated the SMPD. M.R. designed and installed the magnetic field stabilization. Z.W., L.B., E.F. took the measurements. Z.W., P.B., E.F. analyzed the data. Z.W., P.B., D.V., E.F. wrote the article, with contributions from all the authors. P.B. and E.F. supervised the project.
References
- (1) Schweiger, A. & Jeschke, G. Principles of pulse electron paramagnetic resonance (Oxford University Press, 2001).
- (2) Wrachtrup, J., Von Borczyskowski, C., Bernard, J., Orritt, M. & Brown, R. Optical detection of magnetic resonance in a single molecule. Nature 363, 244–245 (1993).
- (3) Gruber, A. et al. Scanning Confocal Optical Microscopy and Magnetic Resonance on Single Defect Centers. Science 276, 2012–2014 (1997).
- (4) Raha, M. et al. Optical quantum nondemolition measurement of a single rare earth ion qubit. Nature Communications 11, 1605 (2020). URL https://www.nature.com/articles/s41467-020-15138-7.
- (5) Elzerman, J. M. et al. Single-shot read-out of an individual electron spin in a quantum dot. Nature 430, 431–435 (2004). URL https://www.nature.com/articles/nature02693.
- (6) Vincent, R., Klyatskaya, S., Ruben, M., Wernsdorfer, W. & Balestro, F. Electronic read-out of a single nuclear spin using a molecular spin transistor. Nature 488, 357–360 (2012). URL https://www.nature.com/articles/nature11341. Number: 7411 Publisher: Nature Publishing Group.
- (7) Pla, J. J. et al. A single-atom electron spin qubit in silicon. Nature 489, 541–545 (2012). URL https://www.nature.com/articles/nature11449.
- (8) Thiele, S. et al. Electrically driven nuclear spin resonance in single-molecule magnets. Science 344, 1135–1138 (2014). URL https://www.science.org/doi/full/10.1126/science.1249802. Publisher: American Association for the Advancement of Science.
- (9) Rugar, D., Budakian, R., Mamin, H. & Chui, B. Single spin detection by magnetic resonance force microscopy. Nature 430, 329–332 (2004).
- (10) Baumann, S. et al. Electron paramagnetic resonance of individual atoms on a surface. Science 350, 417–420 (2015).
- (11) Grinolds, M. et al. Subnanometre resolution in three-dimensional magnetic resonance imaging of individual dark spins. Nature nanotechnology 9, 279–284 (2014).
- (12) Albertinale, E. et al. Detecting spins by their fluorescence with a microwave photon counter. Nature 600, 434–438 (2021). URL https://www.nature.com/articles/s41586-021-04076-z.
- (13) Lescanne, R. et al. Irreversible Qubit-Photon Coupling for the Detection of Itinerant Microwave Photons. Physical Review X 10, 021038 (2020). URL https://link.aps.org/doi/10.1103/PhysRevX.10.021038.
- (14) Muhonen, J. T. et al. Storing quantum information for 30 seconds in a nanoelectronic device. Nature Nanotechnology 9, 986–991 (2014). URL http://www.nature.com/doifinder/10.1038/nnano.2014.211.
- (15) Shi, F. et al. Single-protein spin resonance spectroscopy under ambient conditions. Science 347, 1135–1138 (2015). URL https://www.science.org/doi/full/10.1126/science.aaa2253.
- (16) Shi, F. et al. Single-DNA electron spin resonance spectroscopy in aqueous solutions. Nature Methods 15, 697–699 (2018). URL https://www.nature.com/articles/s41592-018-0084-1.
- (17) Orrit, M. & Bernard, J. Single pentacene molecules detected by fluorescence excitation in a p-terphenyl crystal. Physical Review Letters 65, 2716–2719 (1990). URL https://link.aps.org/doi/10.1103/PhysRevLett.65.2716.
- (18) Bienfait, A. et al. Controlling Spin Relaxation with a Cavity. Nature 531, 74 – 77 (2016).
- (19) Kubo, Y. et al. Electron spin resonance detected by a superconducting qubit. Phys. Rev. B 86, 064514 (2012).
- (20) Bienfait, A. et al. Reaching the quantum limit of sensitivity in electron spin resonance. Nature Nanotechnology 11, 253–257 (2016). URL https://www.nature.com/articles/nnano.2015.282.
- (21) Haikka, P., Kubo, Y., Bienfait, A., Bertet, P. & Moelmer, K. Proposal for detecting a single electron spin in a microwave resonator. Phys. Rev. A 95, 022306 (2017).
- (22) Eichler, C., Sigillito, A., Lyon, S. & Petta, J. Electron Spin Resonance at the Level of 10^4 Spins Using Low Impedance Superconducting Resonators. Physical Review Letters 118, 037701 (2017). URL https://link.aps.org/doi/10.1103/PhysRevLett.118.037701.
- (23) Budoyo, R. P. et al. Electron paramagnetic resonance spectroscopy of Er3+:YSO using a Josephson bifurcation amplifier: Observation of hyperfine and quadrupole structures. Physical Review Materials 2, 011403 (2018). URL https://link.aps.org/doi/10.1103/PhysRevMaterials.2.011403.
- (24) Budoyo, R. P., Kakuyanagi, K., Toida, H., Matsuzaki, Y. & Saito, S. Electron spin resonance with up to 20 spin sensitivity measured using a superconducting flux qubit. Applied Physics Letters 116, 194001 (2020). URL https://aip.scitation.org/doi/10.1063/1.5144722. Publisher: American Institute of Physics.
- (25) Ranjan, V. et al. Electron spin resonance spectroscopy with femtoliter detection volume. Applied Physics Letters 116, 184002 (2020). URL https://aip.scitation.org/doi/10.1063/5.0004322. Publisher: American Institute of Physics.
- (26) Antipin, A., Katyshev, A., Kurkin, I. & Shekun, L. Paramagnetic resonance and spin-lattice relaxation of Er3+ and Tb3+ ions in CaWO4 crystal lattice. Sov. Phys. Solid State 10, 468 (1968).
- (27) Mims, W. B. & Gillen, R. Broadening of Paramagnetic-Resonance Lines by Internal Electric Fields. Physical Review 148, 438–443 (1966). URL https://link.aps.org/doi/10.1103/PhysRev.148.438.
- (28) Kindem, J. M. et al. Control and single-shot readout of an ion embedded in a nanophotonic cavity. Nature 580, 201–204 (2020). URL https://www.nature.com/articles/s41586-020-2160-9.
- (29) Dibos, A., Raha, M., Phenicie, C. & Thompson, J. Atomic Source of Single Photons in the Telecom Band. Physical Review Letters 120, 243601 (2018). URL https://link.aps.org/doi/10.1103/PhysRevLett.120.243601.
- (30) Pla, J. et al. Strain-Induced Spin-Resonance Shifts in Silicon Devices. Physical Review Applied 9, 044014 (2018). URL https://link.aps.org/doi/10.1103/PhysRevApplied.9.044014.
- (31) Ranjan, V. et al. Spatially-resolved decoherence of donor spins in silicon strained by a metallic electrode. arXiv:2101.04391 [cond-mat, physics:quant-ph] (2021). URL http://arxiv.org/abs/2101.04391. ArXiv: 2101.04391.
- (32) Broadway, D. A. et al. Microscopic Imaging of the Stress Tensor in Diamond Using in Situ Quantum Sensors. Nano Letters 19, 4543–4550 (2019). URL https://doi.org/10.1021/acs.nanolett.9b01402.
- (33) Billaud, E. et al. Microwave fluorescence detection of spin echoes (2022). URL https://arxiv.org/abs/2208.13586. Publisher: arXiv Version Number: 1.
- (34) Le Dantec, M. et al. Twenty-three-millisecond electron spin coherence of erbium ions in a natural-abundance crystal. Science Advances 7, eabj9786. URL https://www.science.org/doi/10.1126/sciadv.abj9786.
- (35) Myers, B. et al. Probing Surface Noise with Depth-Calibrated Spins in Diamond. Physical Review Letters 113, 027602 (2014). URL https://link.aps.org/doi/10.1103/PhysRevLett.113.027602.
- (36) Castle, J. G. & Feldman, D. W. Resonance Modes at Defects in Crystalline Quartz. Physical Review 137, A671–A673 (1965). URL https://link.aps.org/doi/10.1103/PhysRev.137.A671.
- (37) Gayda, J.-P. et al. Temperature dependence of the electronic spin-lattice relaxation time in a 2-iron-2-sulfur protein. Biochimica et Biophysica Acta (BBA) - Protein Structure 581, 15–26 (1979). URL http://www.sciencedirect.com/science/article/pii/0005279579902162.
- (38) Zhou, Y., Bowler, B. E., Eaton, G. R. & Eaton, S. S. Electron Spin Lattice Relaxation Rates for S = 12 Molecular Species in Glassy Matrices or Magnetically Dilute Solids at Temperatures between 10 and 300 K. Journal of Magnetic Resonance 139, 165–174 (1999). URL http://www.sciencedirect.com/science/article/pii/S1090780799917639.
- (39) Casabone, B. et al. Dynamic control of Purcell enhanced emission of erbium ions in nanoparticles. Nature Communications 12, 3570 (2021). URL https://www.nature.com/articles/s41467-021-23632-9.
- (40) Coremans, J. W. A. et al. A W-Band Electron Paramagnetic Resonance Study of a Single Crystal of Azurin. Journal of the American Chemical Society 116, 3097–3101 (1994). URL https://doi.org/10.1021/ja00086a044.
- (41) Doorslaer, S. V. & Vinck, E. The strength of EPR and ENDOR techniques in revealing structure-function relationships in metalloproteins. Physical Chemistry Chemical Physics 9, 4620–4638 (2007). URL https://pubs.rsc.org/en/content/articlelanding/2007/cp/b701568b.