Graph Contrastive Learning for Multi-Omics Data
Abstract
Advancements in technologies related to working with omics data require novel computation methods to fully leverage information and help develop a better understanding of human diseases. This paper studies the effects of introducing graph contrastive learning to help leverage graph structure and information to produce better representations for downstream classification tasks for multi-omics datasets. We present a learnining framework named Multi-Omics Graph Contrastive Learner(MOGCL) which outperforms several aproaches for integrating multi-omics data for supervised learning tasks. We show that pre-training graph models with a contrastive methodology along with fine-tuning it in a supervised manner is an efficient strategy for multi-omics data classification.
Keywords Graph Contrastive Learning Graph Neural Networks Multi-Omics
1 Introduction
Omics, referring to a field of study in biological sciences that ends with -omics, aims at the collective characterization and quantification of pools of biological molecules that translate into the structure, function, and dynamics of an organism or organisms. The use of high throughput biomedical research methods has increased substantially over the past few years such as Whole Genome Sequencing(WGS), RNA sequencing(RNA-seq), chromosome conformation capture (Hi-C) and liquid chromatography coupled with mass spectrometry [1, 2]. It is particularly helpful to integrate data from different molecular sources such as microRNA(miRNA),mRNA and DNA methylation to provide insight into the classification and processes of different diseases. Integration of multi-omics data requires efficient computational methods which are capable of correctly modelling and interpreting these relationships. Whilst each omics technology can present only a part of the true biological complexity integrating data from multiple omics technologies can help provide a more universal picture which can help improve results for classification tasks [3, 4, 5, 6, 7, 8, 9].
Several different methodologies have been proposed to help integrate multi-omics data for classification tasks. Generally, different omics data have often been concatenated together or have been subject to ensemble learning where prediction for each omics type is ensembled together [10, 11]. The recent emergence of Graph Neural Networks(GNNs) as an efficient deep learning methodology to model complex systems has prompted researchers to study its effects when paired with multi-omics data [12, 13]. Graph contrastive learning is a learning paradigm where data-data pairs are utilised to perform discrimination between positive and negative pairs of graph data. Contrastive learning can be used as an effective pre-training strategy for training graphical models on supervised learning tasks. This paper describes a framework named MOGCL which constructs graphs from multi-omics data and utilises contrastive learning as a pre-training strategy to aid downstream classification tasks. We compare our results on benchmark datasets with several different machine-learning methodologies. MOGCL performs better on several metrics such as Area Under the ROC Curve(AUC), Accuracy and F1 score etc.
2 Literature Review
2.1 Machine learning for multi-omics data
A significant number of methods have been studied to integrate multi-omics data for various tasks. A large number of methods focus on the semi-supervised integration of multi-omics data without utilising the information from ground truth labels present in the dataset [14, 15, 16, 17]. Most self-supervised methods focus on assigning clusters to different omics groups present in the dataset. With the rapid advancements of biotechnology and the detailed curation of datasets, more labelled samples of phenotypes or traits are being made available for research. This has led to the development of supervised learning models which perform better on multi-omics datasets [18, 19, 20, 21, 22]. Kernel methods are powerful machine learning models which operate on a higher dimensional space where linear interpolations can be found between the given data points. Kernel methods are often used as classical machine learning models for analysing and classifying multi-omics. Support Vector Machines(SVM) [23] and partial least squares [24] are examples of classical machine learning approaches for multi-omics data. Currently, deep learning approaches are commonly adopted for multi-omics integration for various tasks. Islam et al. [25] propose an approach which utilises a convolutional neural network to learn important features for multiple omics types and finally concatenate them to predict breast cancer subtypes. An approach using stacked Sparse Autoencoders (SAE) was proposed by Xu et al. [26] where representations are produced for each type of omics data using autoencoders which are then fed to a deep flexible neural forest for predicting cancer subtypes.
2.2 Graph based learning approaches
Graphs are complex data structures which are used to model many complex phenomena in the real world. Graph Neural Networks (GNN) deal with applying deep learning to graphical data structures. GNNs have several applications such as combinatorial optimizations, neural machine translation, protein-protein interactions, drug discovery [27, 28, 29, 30, 31, 32, 33, 34]. Recently graph-based approaches have been used for multi-omics integration. Wang et al. [35] proposed a methodology to convert multi-omics data to graphs and a model named MOGONET consisting of convolutional network (GCN) layers [36] to produce refined representations for a downstream classification task on multiple multi-omics datasets whilst also identifying important biomarkers. Xiao et al. [37] proposed a model named MOGCN for different cancer sub-type classification tasks based on multi-omics data. Graph contrastive learning is an example of a self-supervised training methodology where different graph augmentations are utilised to exploit both structural information and information about features of the dataset to produce better representations. Some common training strategies are pre-training followed by fine-tuning [38] and joint learning [39]. Zhu et al. [40] proposed a framework titled deep GRAph Contrastive rEpresentation learning (GRACE) which specifically generates two graph views by corruption and attempts to learn node representations by maximizing the agreement of node representations in these two views.
3 Methodology
3.1 Datasets
We demonstrate the effectiveness of MOGCL by applying our model on two benchmark datasets namely ROSMAP [41] which describes information for patients with Alzheimer’s Disease (AD) concerning a normal control group (NC) and BRCA which contains data for breast invasive carcinoma (BRCA) PAM50 subtype classification. The omics data used were namely were DNA methylation data (meth), miRNA expression data (miRNA) and mRNA expression data (mRNA). Details about the datasets are further described in table 1.
| Dataset Name | Labels |
|
|
|||||
|---|---|---|---|---|---|---|---|---|
| ROSMAP | NC: 169, AD: 182 | 55,889, 23,788, 309 | 200, 200, 200 | |||||
| BRCA |
|
20,531, 20,106, 503 | 1000, 1000, 503 |
3.2 Contrusting graphs from multi-omics data
In this section, we describe the methodology of converting multi-omics data to a graphical structure which can then be leveraged by powerful graph neural network models for further processing. Our task can be defined as defining graphs = where V, E represent vertices and edges of the graph respectively. We utilise the feature matrices we obtain after preprocessing each type of omics data. The feature matrix for each omics type is represented as where for the ROSMAP dataset d is 200 for each of the omics types and n is 351. Similarly for the BRCA dataset n is 875 and d ranges from 1000 for mRNA and meth data to 503 for miRNA data. The nodes V of graph G represent the users from which the omics data is collected. We construct an adjacency matrix to represent G with each element in the adjacency matrix representing a node. We denote a weighted edge from node i to node j of the graph as the element present at the ith row and jth column of A. Such an adjacency matrix is constructed for each type of omics data respectively. A pairwise distance matrix is constructed for data for the points of the particular omics dataset using cosine similarity [42] as the distance metric. The distance between node i and node j is denoted by . A parameter k is introduced which represents the number of edges to be formed per node. An adjacency parameter is then chosen by selecting the value from a sorted array of pairwise distances between all data points. Edges E is then selected on the criteria of the distance between data points being smaller than the adjacency parameter. This ensures that the number of edges per node is k. A weight of is assigned to the edge from node i to node j if belongs to the set of selected edges. An adjacency matrix is prepared for each of the omics types present in the respective dataset by following the methodology described above.
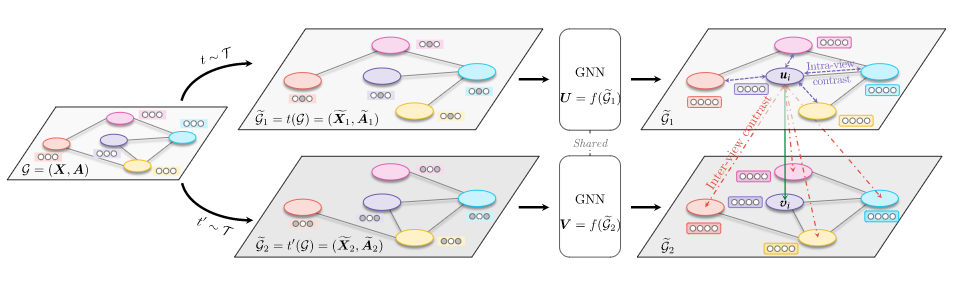
3.3 Graph constrative learning
In this section, we describe our training methodology which utilises graph contrastive learning. We use GRACE [40] which serves as our self-supervision model. Our contrastive learning methodology consists of two stages namely i) data augmentation and ii) contrastive learning. Augmentation functions such as removing random edges and feature masking are used to create augmented views of a graph. For augmenting edges, we randomly remove a portion of edges from the original graph. We sample a random masking matrix . Where the elements of R are drawn from a Bernoulli distribution where pr is the probability of each edge is removed. We choose pr to be 0.4 for our study. The resulting adjacency matrix can be given as . For augmenting features we randomly mask the dimensions of a feature vector by replacing them with zeros. We sample random feature vectors to construct a matrix according to a Bernoulli distribution having a similar size as feature matrix X. The augmented feature matrix can then be represented by . We use a GCN [36] model as an encoder model which helps represent the augmented views of a given graph and denote it with f. Let and be the representations generated after processing two graphs with our shared encoder model. We aim to maximise the agreement between similar nodes in the latent space and minimise the agreement between the rest of the contrasting nodes. To achieve this we make use of the Normalized Temperature-scaled Cross Entropy Loss (NT-Xent) [43]. NT-Xent loss is given by eq 1.
| (1) |
where and represent the feature vector from the feature matrix U and V respectively. represents a temperature parameter. is a similarity function given in equation 2.
| (2) |
where c(.,.) is the cosine similarity function and n(.) represents any non-linear function such as ReLU [44] or LeakyReLU [45] etc. We finally optimise the weights of the shared encoder model on the NT-Xent loss.
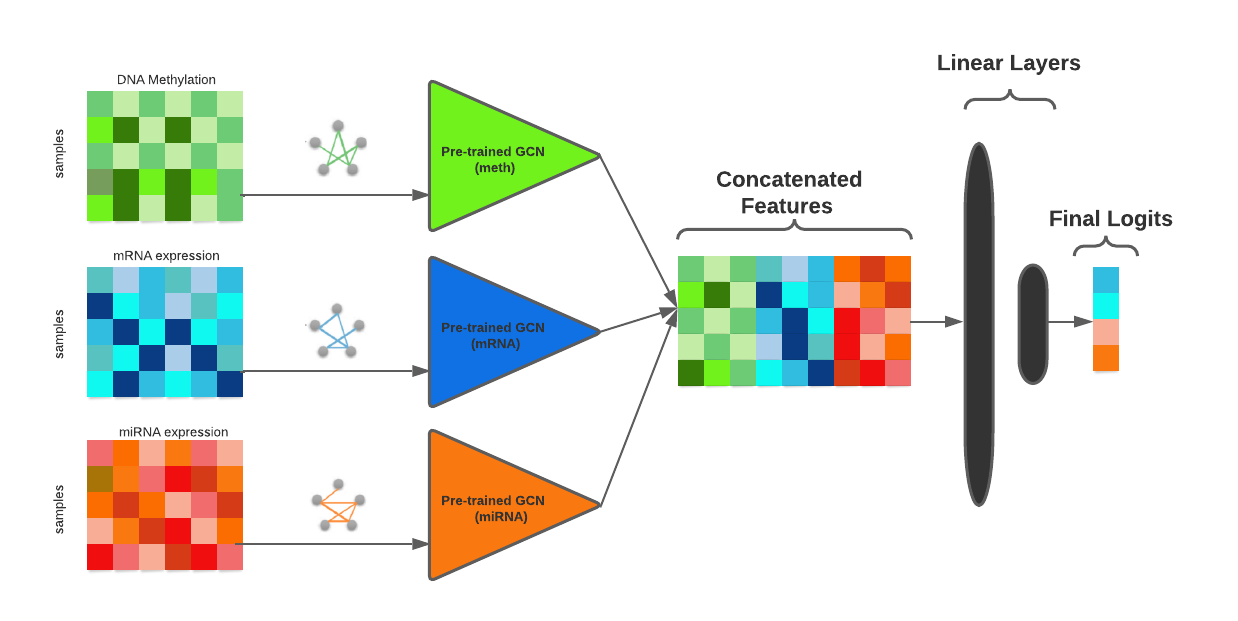
The GCN encoder is further trained in a supervised manner using labels from the given dataset. The encoder model was trained for a downstream classification task using pre-training followed by fine-tuning. In pre-training, we first fully train an encoder model for each omics type in an unsupervised manner. We later fine-tune the models using label information from the given dataset. Let be the pre-trained GCN encoder. We utilise linear layers in conjunction with concatenated features produced from the encoder models to produce predicted label . We use the Cross-Entropy Loss to calculate the loss for predicted labels and true labels and finally optimise our encoder model on this loss.
3.4 Experiments
In this section we describe the experiments we perform to evaluate our MOGCL framework. We first produce graphs for each omics type in our datasets and train a separate encoder model for each one respectively. We finally concatenate the features produced by each encoder model and train the encoder model in a pre-training followed by fine-tuning methodology. We compare our classification results to the ones described in [35] to evaluate the efficiency of introducing a contrastive learning methodology for the given classification task. Performance of all permutations of encoder models is calculated by conducting runs with random weight initialisations for each permutation. We measure the performance of our model on metrics such as accuracy, f1-score and AUC for the ROSMAP dataset and use accuracy,f1-weighted score and f1-macro score to evaluate the BRCA dataset. We use PyTorch-geometric [46], PyGCL [47] and pytorch-lightning[48] for conducting our experiments. Adam [49] optimizer with a learning rate of 0.0001 is utilised for all our experiments. We use a two-layered GCN as our encoder model which is used in graph contrastive learning. We further use two linear layers in conjunction with our encoder model to perform fine-tuning with the given true labels. We compress all feature vectors to a 100-dimensional latent space for all our experiments. We try to visualise the effects of our pretraining strategy by visualising the feature vectors before and after processing them with our encoder models for each omics type. t-SNE [50] was utilised to compress feature vectors to a two-dimensional space in order to produce visualisations.
4 Results and Discussion
The results for the classification task for ROSMAP and BRCA datasets are displayed in table 2 and table 3 respectively.
| Method | Accuracy | F1 | AUC |
|---|---|---|---|
| KNN | 0.657 ± 0.036 | 0.671 ± 0.044 | 0.709 ± 0.045 |
| SVM | 0.770 ± 0.024 | 0.778 ± 0.016 | 0.770 ± 0.026 |
| Lasso | 0.694 ± 0.037 | 0.730 ± 0.033 | 0.770 ± 0.035 |
| RF | 0.726 ± 0.029 | 0.734 ± 0.021 | 0.811 ± 0.019 |
| XGBoost | 0.760 ± 0.046 | 0.772 ± 0.045 | 0.837 ± 0.030 |
| NN | 0.755 ± 0.021 | 0.764 ± 0.021 | 0.827 ± 0.025 |
| GRridge | 0.760 ± 0.034 | 0.769 ± 0.029 | 0.841 ± 0.023 |
| block PLSDA | 0.742 ± 0.024 | 0.755 ± 0.023 | 0.830 ± 0.025 |
| block sPLSDA | 0.753 ± 0.033 | 0.764 ± 0.035 | 0.838 ± 0.021 |
| NN_NN | 0.766 ± 0.023 | 0.777 ± 0.019 | 0.819 ± 0.017 |
| NN_VCDN | 0.775 ± 0.026 | 0.790 ± 0.018 | 0.843 ± 0.021 |
| MOGONET_NN | 0.804 ± 0.016 | 0.808 ± 0.010 | 0.858 ± 0.024 |
| MOGCL (ours) | 0.818 ± 0.014 | 0.818 ± 0.014 | 0.866 ± 0.021 |
| Method | Accuracy | F1-Weighted | F1-Macro |
|---|---|---|---|
| KNN | 0.742 ± 0.024 | 0.730 ± 0.023 | 0.682 ± 0.025 |
| SVM | 0.729 ± 0.018 | 0.702 ± 0.015 | 0.640 ± 0.017 |
| Lasso | 0.732 ± 0.012 | 0.698 ± 0.015 | 0.642 ± 0.026 |
| RF | 0.754 ± 0.009 | 0.733 ± 0.010 | 0.649 ± 0.013 |
| XGBoost | 0.781 ± 0.008 | 0.764 ± 0.010 | 0.701 ± 0.017 |
| NN | 0.754 ± 0.028 | 0.740 ± 0.034 | 0.668 ± 0.047 |
| GRridge | 0.745 ± 0.016 | 0.726 ± 0.019 | 0.656 ± 0.025 |
| block PLSDA | 0.642 ± 0.009 | 0.534 ± 0.014 | 0.369 ± 0.017 |
| block sPLSDA | 0.639 ± 0.008 | 0.522 ± 0.016 | 0.351 ± 0.022 |
| NN_NN | 0.796 ± 0.012 | 0.784 ± 0.014 | 0.723 ± 0.018 |
| NN_VCDN | 0.792 ± 0.010 | 0.781 ± 0.006 | 0.721 ± 0.018 |
| MOGONET_NN | 0.805 ± 0.017 | 0.782 ± 0.030 | 0.737 ± 0.038 |
| MOGCL (ours) | 0.853 ± 0.005 | 0.851 ± 0.010 | 0.823 ± 0.006 |
The performance of MOGCL is compared with the following classification algorithms 1) K-nearest neighbour classifier (KNN). K-nearest neighbours are chosen from the training data to make label predictions during evaluation. 2) Support Vector Machine classifier (SVM). 3) Lasso which is L1-regularised linear regression. A unique model was trained to forecast each class’s probability in Lasso, and the class with the greatest foretasted probability was chosen as the final prediction of the model’s overall class label 4) Random Forest classifier (RF). 5) Extreme Gradient Boosting (XGBoost) is a distributed, scalable gradient-boosted decision tree (GBDT) machine learning framework. 6) Fully connected Neural Network (NN) classifier. loss for the fully connected NN was calculated by the cross-entropy loss. 7) Adaptive group-regularized ridge regression (GRridge). 8) block PLSDA mentioned in DIABLO [6]. block PLSDA performs latent Discriminant Analysis (LDA) to project multi-omics data to a latent space. To categorise a discrete outcome, block PLSDA integrates various omics data types measured on the same set of samples. 9) block sPLSDA. 10) MOGONET_NN. MOGONET_NN is architecturally similar to MOGCL but does not use a pre-training strategy. We achieve significant results by following our pre-training methodology as it performs better than the other models on all metrics used to measure the results. For the ROSMAP dataset MOGCL achieves an average accuracy of 0.818 in comparison to 0.804 achieved by MOGONET_NN. following this trend MOGCL achieves an F1-score and AUC of 0.818 and 0.866 as compared to 0.808 and 0.856 achieved by MOGONET_NN. For the BRCA dataset MOGCL achieves an accuracy of 0.853 as compared to 0.805 for MOGONET_NN. MOGCL receives an F1-weighted score of 0.851 and an F1-macro score of 0.823 as compared to 0.782 and 0.737 respectively for MOGONET_NN. This demonstrates that adopting a graph based semi-supervised learning strategy in addition to fine-tuning for a downstream task is an effective training strategy for training models on multi-omics datasets.
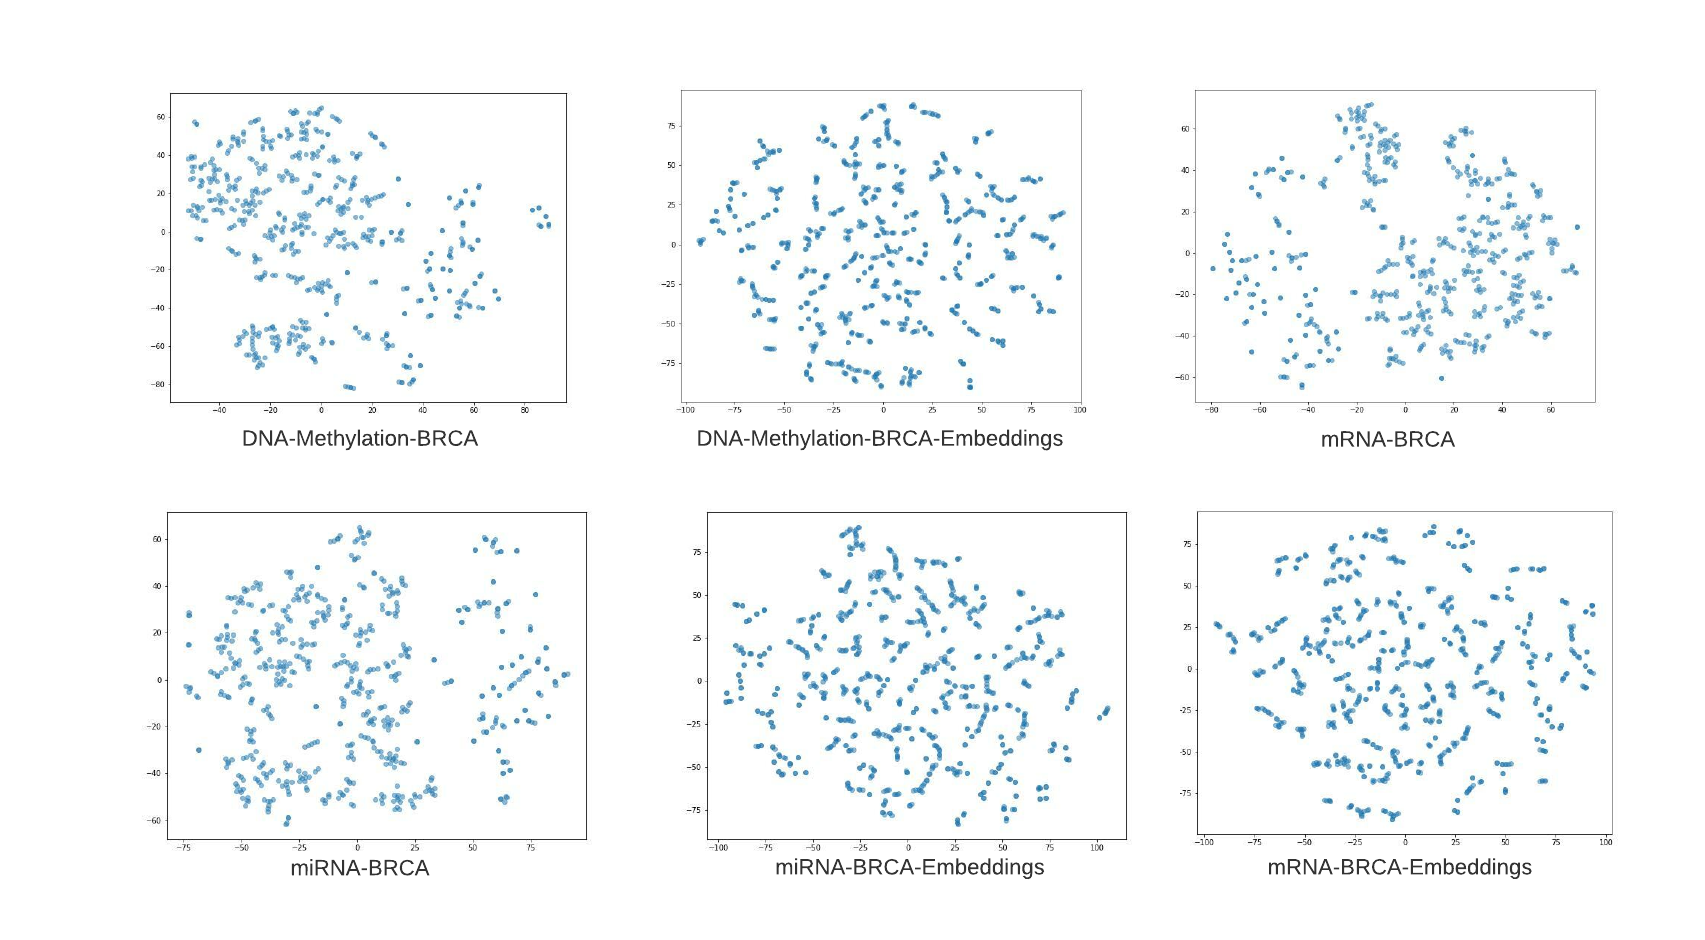
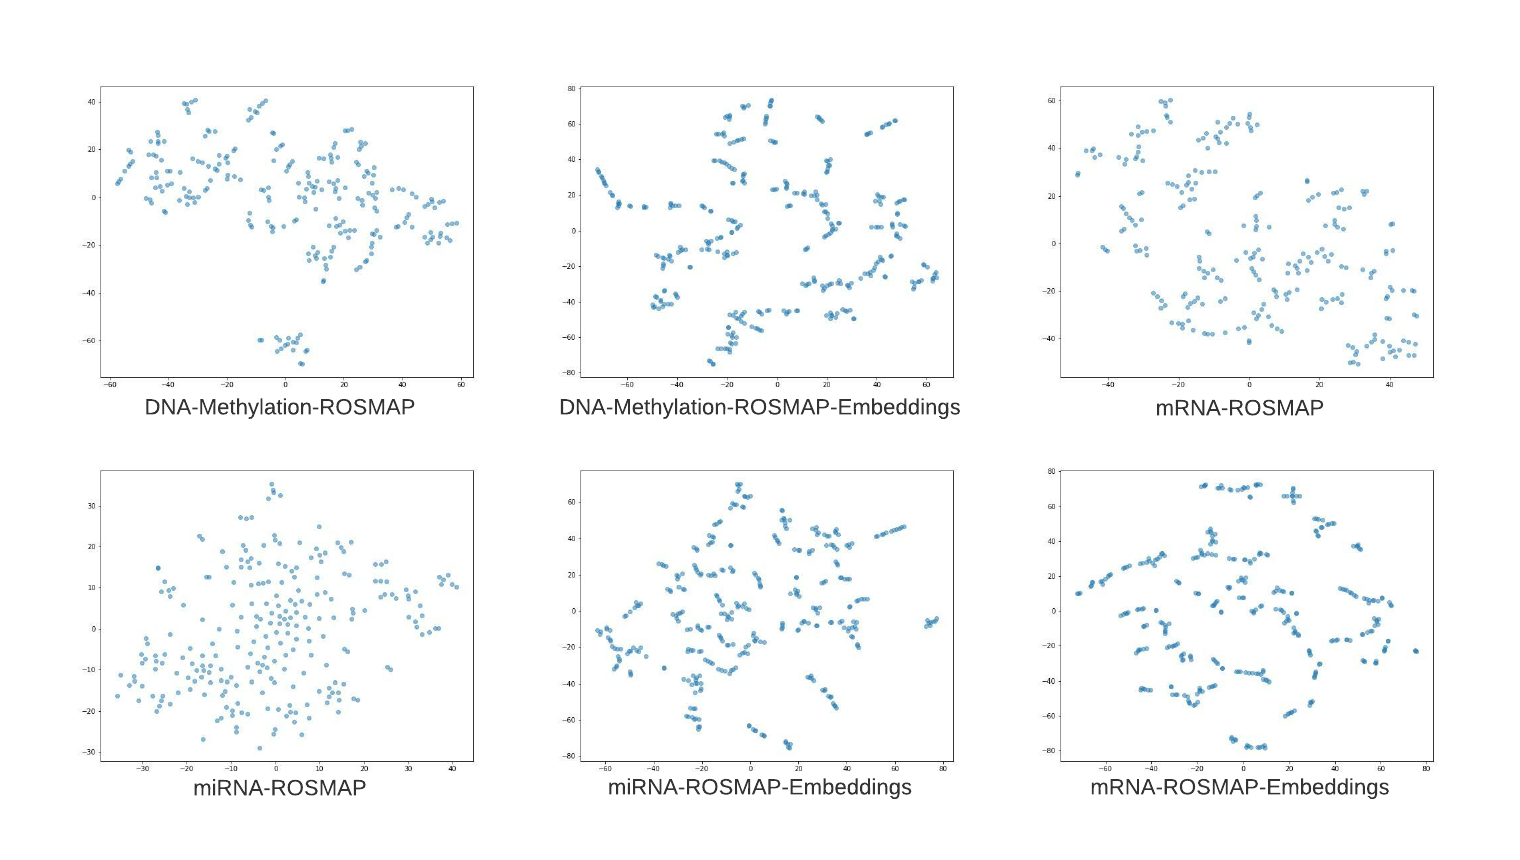
We demonstrate the effects of adopting a semi-supervised methodology of training by analysing 3 and 4. We visualise the feature matrices X by projecting data points into a two-dimensional plane by utilising t-SNE. Similarly, we map the feature vectors produced by the GCN encoders to a 2-dimensional space and compare the results. MOGCL tries to cluster embeddings in the absence of labels to create more structured representations during the pre-training phase. Better representation help during the fine-tuning phase which in turn helps produce better classification scores.
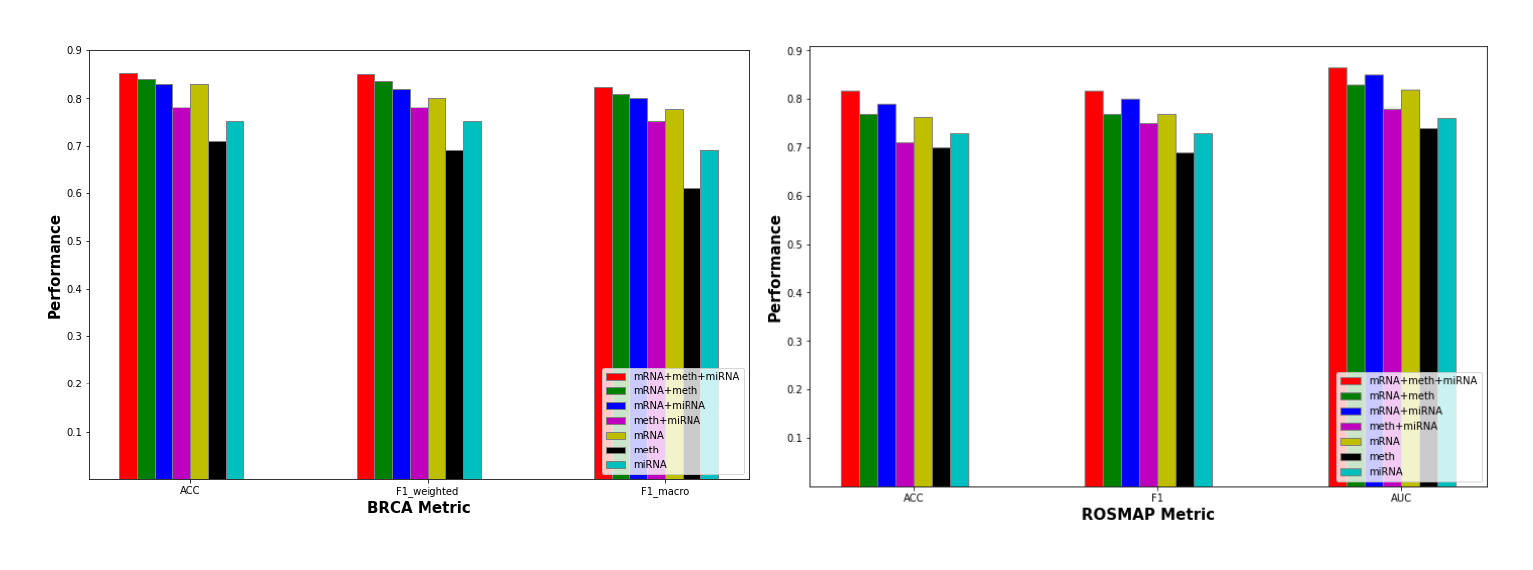
Figure 5 represents the performance of permutation of different omics types when processed by MOGCL. We pre-train three encoder models for all omics types in the study respectively. To calculate performance we select a permutation of these encoder models and train them using true labels in a supervised manner. MOGCL performs its best when fed information by concatenating all the omics types together for both the ROSMAP and BRCA datasets. For the BRCA dataset, a combination of mRNA and DNA-Methylation data provides the next best results however for the ROSMAP dataset a combination of mRNA and miRNA provides the next best set of results. For both the ROSMAP and BRCA datasets using only a single omics type provides the worst results. Using only DNA-Methylation data is the least useful option followed by miRNA and mRNA data across both BRCA and ROSMAP datasets.
5 Conclusion
This paper introduces a novel framework named MOGCL which introduces a graph contrastive learning methodology for multi-omics data classification. We first provide a comprehensive literature survey regarding work done in the field of machine learning relating to graph-based learning methods and multi-omics data. A method for constructing graphs from multi-omics data is discussed. We then describe our framework MOGCL which uses GRACE as a pre-training method followed by fine-tuning with true labels in a supervised setting. We discuss our results for the BRCA and ROSMAP datasets and show that our framework performs better than other baselines used for this study. The use of permutations of different omics types is discussed by analysing performance across different metrics. We discuss the effects of adopting a semi-supervised pre-training strategy by visualising the embeddings produced by our graph encoders. We finally conclude that adopting a pre-training methodology is an efficient way to train graphical models for classification problems involving multi-omics datasets. Future works could include experimenting with different contrastive learning methodologies to determine which one is the most efficient. Experiments can be conducted for different GNNs such as Graph Attention Networks (GAT) or Graph Isomorphism Networks (GIN) etc. to determine which one can serve as the best encoder for supervised learning on multi-omics datasets.
References
- [1] Angela P Fuentes-Pardo and Daniel E Ruzzante. Whole-genome sequencing approaches for conservation biology: Advantages, limitations and practical recommendations. Mol. Ecol., 26(20):5369–5406, October 2017.
- [2] Rui Chen and Michael Snyder. Promise of personalized omics to precision medicine. Wiley Interdiscip. Rev. Syst. Biol. Med., 5(1):73–82, January 2013.
- [3] Zhi Huang, Xiaohui Zhan, Shunian Xiang, Travis S. Johnson, Bryan Helm, Christina Y. Yu, Jie Zhang, Paul Salama, Maher Rizkalla, Zhi Han, and Kun Huang. Salmon: Survival analysis learning with multi-omics neural networks on breast cancer. Frontiers in Genetics, 10, 2019.
- [4] Sijia Huang, Kumardeep Chaudhary, and Lana X. Garmire. More is better: Recent progress in multi-omics data integration methods. Frontiers in Genetics, 8, 2017.
- [5] Sebastian Canzler, Jana Schor, Wibke Busch, Kristin Schubert, Ulrike E. Rolle-Kampczyk, Hervé Seitz, Hennicke Kamp, Martin von Bergen, Roland Buesen, and Jörg Hackermüller. Prospects and challenges of multi-omics data integration in toxicology. Archives of Toxicology, Feb 2020.
- [6] Amrit Singh, Casey P Shannon, Benoît Gautier, Florian Rohart, Michaël Vacher, Scott J Tebbutt, and Kim-Anh Lê Cao. DIABLO: an integrative approach for identifying key molecular drivers from multi-omics assays. Bioinformatics, 35(17):3055–3062, September 2019.
- [7] Mark A. van de Wiel, Tonje G. Lien, Wina Verlaat, Wessel N. van Wieringen, and Saskia M. Wilting. Better prediction by use of co-data: adaptive group-regularized ridge regression. Statistics in Medicine, 35(3):368–381, 2016.
- [8] Yingkun Zhu, Dengpan Bu, and Lu Ma. Integration of multiplied omics, a step forward in systematic dairy research. Metabolites, 12(3), 2022.
- [9] Indhupriya Subramanian, Srikant Verma, Shiva Kumar, Abhay Jere, and Krishanpal Anamika. Multi-omics data integration, interpretation, and its application. Bioinform. Biol. Insights, 14:1177932219899051, January 2020.
- [10] Olivier B. Poirion, Zheng Jing, Kumardeep Chaudhary, Sijia Huang, and Lana X. Garmire. Deepprog: an ensemble of deep-learning and machine-learning models for prognosis prediction using multi-omics data. Genome Medicine, 13(1):112, Jul 2021.
- [11] Shane O’Donnell, R. Ross, and Catherine Stanton. The progress of multi-omics technologies: Determining function in lactic acid bacteria using a systems level approach. Frontiers in Microbiology, 10:3084, 01 2020.
- [12] Chaoyi Yin, Yangkun Cao, Peishuo Sun, Hengyuan Zhang, Zhi Li, Ying Xu, and Huiyan Sun. Molecular subtyping of cancer based on robust graph neural network and multi-omics data integration. Front. Genet., 13:884028, May 2022.
- [13] Xiaohan Xing, Fan Yang, Hang Li, Jun Zhang, Yu Zhao, Mingxuan Gao, Junzhou Huang, and Jianhua Yao. An interpretable multi-level enhanced graph attention network for disease diagnosis with gene expression data. In 2021 IEEE International Conference on Bioinformatics and Biomedicine (BIBM), pages 556–561. IEEE, 2021.
- [14] Ziwang Huang, Hua Chai, Ruoqi Wang, Haitao Wang, Yuedong Yang, and Hejun Wu. Integration of patch features through self-supervised learning and transformer for survival analysis on whole slide images. In International Conference on Medical Image Computing and Computer-Assisted Intervention, pages 561–570. Springer, 2021.
- [15] Xiaoshuang Liu, Xian Xu, Xiao Xu, Xiang Li, and Guotong Xie. Representation learning for multi-omics data with heterogeneous gene regulatory network. In 2021 IEEE International Conference on Bioinformatics and Biomedicine (BIBM), pages 702–705, 2021.
- [16] Ronglai Shen, Adam B. Olshen, and Marc Ladanyi. Integrative clustering of multiple genomic data types using a joint latent variable model with application to breast and lung cancer subtype analysis. Bioinformatics, 25(22):2906–2912, 09 2009.
- [17] Giulia Tini, Luca Marchetti, Corrado Priami, and Marie-Pier Scott-Boyer. Multi-omics integration-a comparison of unsupervised clustering methodologies. Brief. Bioinform., 20(4):1269–1279, July 2019.
- [18] Lorin M. Towle-Miller, Jeffrey C. Miecznikowski, Fan Zhang, and David L. Tritchler. Sumo-fil: Supervised multi-omic filtering prior to performing network analysis. PLOS ONE, 16(8):1–20, 08 2021.
- [19] Otília Menyhárt and Balázs Győrffy. Multi-omics approaches in cancer research with applications in tumor subtyping, prognosis, and diagnosis. Computational and Structural Biotechnology Journal, 19:949–960, 2021.
- [20] Kaiwen Tan, Weixian Huang, Jinlong Hu, and Shoubin Dong. A multi-omics supervised autoencoder for pan-cancer clinical outcome endpoints prediction. BMC Medical Informatics and Decision Making, 20(3):129, Jul 2020.
- [21] Zak Costello and Hector Garcia Martin. A machine learning approach to predict metabolic pathway dynamics from time-series multiomics data. npj Systems Biology and Applications, 4(1):19, May 2018.
- [22] Milan Picard, Marie-Pier Scott-Boyer, Antoine Bodein, Olivier Périn, and Arnaud Droit. Integration strategies of multi-omics data for machine learning analysis. Computational and Structural Biotechnology Journal, 19:3735–3746, 2021.
- [23] SungHwan Kim, Jae-Hwan Jhong, JungJun Lee, and Ja-Yong Koo. Meta-analytic support vector machine for integrating multiple omics data. BioData Mining, 10(1):2, Jan 2017.
- [24] Candida S. Punla, https://orcid.org/ 0000-0002-1094-0018, cspunla@bpsu.edu.ph, Rosemarie C. Farro, https://orcid.org/0000-0002-3571-2716, rcfarro@bpsu.edu.ph, and Bataan Peninsula State University Dinalupihan, Bataan, Philippines. Are we there yet?: An analysis of the competencies of BEED graduates of BPSU-DC. International Multidisciplinary Research Journal, 4(3):50–59, September 2022.
- [25] Md Mohaiminul Islam, Shujun Huang, Rasif Ajwad, Chen Chi, Yang Wang, and Pingzhao Hu. An integrative deep learning framework for classifying molecular subtypes of breast cancer. Comput. Struct. Biotechnol. J., 18:2185–2199, August 2020.
- [26] Jing Xu, Peng Wu, Yuehui Chen, Qingfang Meng, Hussain Dawood, and Hassan Dawood. A hierarchical integration deep flexible neural forest framework for cancer subtype classification by integrating multi-omics data. BMC Bioinformatics, 20(1):527, Oct 2019.
- [27] Martin J. A. Schuetz, J. Kyle Brubaker, and Helmut G. Katzgraber. Combinatorial optimization with physics-inspired graph neural networks. Nature Machine Intelligence, 4(4):367–377, Apr 2022.
- [28] Yun Peng, Byron Choi, and Jianliang Xu. Graph learning for combinatorial optimization: a survey of state-of-the-art. Data Science and Engineering, 6(2):119–141, 2021.
- [29] Binh Nguyen, Long Nguyen, and Dien Dinh. Multi-level community-awareness graph neural networks for neural machine translation. In Proceedings of the 29th International Conference on Computational Linguistics, pages 5021–5028, Gyeongju, Republic of Korea, October 2022. International Committee on Computational Linguistics.
- [30] Xin Mei, Xiaoyan Cai, Libin Yang, and Nanxin Wang. Graph transformer networks based text representation. Neurocomputing, 463:91–100, 2021.
- [31] Elahe Nasiri, Kamal Berahmand, Mehrdad Rostami, and Mohammad Dabiri. A novel link prediction algorithm for protein-protein interaction networks by attributed graph embedding. Computers in Biology and Medicine, 137:104772, 2021.
- [32] Xinnan Dai, Fan Xu, Shike Wang, Piyushkumar A Mundra, and Jie Zheng. Pike-r2p: Protein–protein interaction network-based knowledge embedding with graph neural network for single-cell rna to protein prediction. BMC bioinformatics, 22(6):1–17, 2021.
- [33] Zhengyang Wang, Meng Liu, Youzhi Luo, Zhao Xu, Yaochen Xie, Limei Wang, Lei Cai, Qi Qi, Zhuoning Yuan, Tianbao Yang, et al. Advanced graph and sequence neural networks for molecular property prediction and drug discovery. Bioinformatics, 38(9):2579–2586, 2022.
- [34] Pietro Bongini, Monica Bianchini, and Franco Scarselli. Molecular generative graph neural networks for drug discovery. Neurocomputing, 450:242–252, 2021.
- [35] Tongxin Wang, Wei Shao, Zhi Huang, Haixu Tang, Jie Zhang, Zhengming Ding, and Kun Huang. Mogonet integrates multi-omics data using graph convolutional networks allowing patient classification and biomarker identification. Nature Communications, 12(1):3445, Jun 2021.
- [36] Thomas N. Kipf and Max Welling. Semi-supervised classification with graph convolutional networks, 2016.
- [37] Xiao Li, Jie Ma, Ling Leng, Mingfei Han, Mansheng Li, Fuchu He, and Yunping Zhu. Mogcn: A multi-omics integration method based on graph convolutional network for cancer subtype analysis. Frontiers in Genetics, 13, 2022.
- [38] Yuning You, Tianlong Chen, Yongduo Sui, Ting Chen, Zhangyang Wang, and Yang Shen. Graph contrastive learning with augmentations, 2020.
- [39] Han Zhao, Xu Yang, Zhenru Wang, Erkun Yang, and Cheng Deng. Graph debiased contrastive learning with joint representation clustering. In Zhi-Hua Zhou, editor, Proceedings of the Thirtieth International Joint Conference on Artificial Intelligence, IJCAI-21, pages 3434–3440. International Joint Conferences on Artificial Intelligence Organization, 8 2021. Main Track.
- [40] Yanqiao Zhu, Yichen Xu, Feng Yu, Qiang Liu, Shu Wu, and Liang Wang. Deep Graph Contrastive Representation Learning. In ICML Workshop on Graph Representation Learning and Beyond, 2020.
- [41] Philip L. De Jager, Yiyi Ma, Cristin McCabe, Jishu Xu, Badri N. Vardarajan, Daniel Felsky, Hans-Ulrich Klein, Charles C. White, Mette A. Peters, Ben Lodgson, Parham Nejad, Anna Tang, Lara M. Mangravite, Lei Yu, Chris Gaiteri, Sara Mostafavi, Julie A. Schneider, and David A. Bennett. A multi-omic atlas of the human frontal cortex for aging and alzheimer’s disease research. Scientific Data, 5(1):180142, Aug 2018.
- [42] Alfirna Rizqi Lahitani, Adhistya Erna Permanasari, and Noor Akhmad Setiawan. Cosine similarity to determine similarity measure: Study case in online essay assessment. In 2016 4th International Conference on Cyber and IT Service Management, pages 1–6, 2016.
- [43] Ting Chen, Simon Kornblith, Mohammad Norouzi, and Geoffrey Hinton. A simple framework for contrastive learning of visual representations, 2020.
- [44] Kunihiko Fukushima. Cognitron: A self-organizing multilayered neural network. Biol. Cybern., 20(3–4):121–136, sep 1975.
- [45] Bing Xu, Naiyan Wang, Tianqi Chen, and Mu Li. Empirical evaluation of rectified activations in convolutional network, 2015.
- [46] Matthias Fey and Jan E. Lenssen. Fast graph representation learning with PyTorch Geometric. In ICLR Workshop on Representation Learning on Graphs and Manifolds, 2019.
- [47] Yanqiao Zhu, Yichen Xu, Qiang Liu, and Shu Wu. An Empirical Study of Graph Contrastive Learning. arXiv.org, September 2021.
- [48] William Falcon et al. Pytorch lightning. GitHub. Note: https://github. com/PyTorchLightning/pytorch-lightning, 3(6), 2019.
- [49] Diederik P. Kingma and Jimmy Ba. Adam: A method for stochastic optimization. In Yoshua Bengio and Yann LeCun, editors, 3rd International Conference on Learning Representations, ICLR 2015, San Diego, CA, USA, May 7-9, 2015, Conference Track Proceedings, 2015.
- [50] Laurens van der Maaten and Geoffrey Hinton. Visualizing data using t-SNE. Journal of Machine Learning Research, 9:2579–2605, 2008.