The HH 24 Complex:
Jets, Multiple Star Formation, and Orphaned Protostars
Abstract
The HH 24 complex harbors five collimated jets emanating from a small protostellar multiple system. We have carried out a multi-wavelength study of the jets, their driving sources, and the cloud core hosting the embedded stellar system, based on data from the HST, Gemini, Subaru, APO 3.5m, VLA, and ALMA telescopes. The data show that the multiple system, SSV 63, contains at least 7 sources, ranging in mass from the hydrogen-burning limit to proto-Herbig Ae stars. The stars are in an unstable non-hierarchical configuration, and one member, a borderline brown dwarf, is moving away from the protostellar system with 25 km s-1, after being ejected 5,800 yr ago as an orphaned protostar. Five of the embedded sources are surrounded by small, possibly truncated, disks resolved at 1.3 mm with ALMA. Proper motions and radial velocities imply jet speeds of 200-300 km s-1. The two main HH 24 jets, E and C, form a bipolar jet system which traces the innermost portions of parsec-scale chains of Herbig-Haro and H2 shocks with a total extent of at least 3 parsec. H2CO and C18O observations show that the core has been churned and continuously fed by an infalling streamer. 13CO and 12CO trace compact, low-velocity, cavity walls carved by the jets and an ultra-compact molecular outflow from the most embedded object. Chaotic N-body dynamics likely will eject several more of these objects. The ejection of stars from their feeding zones sets their masses. Dynamical decay of non-hierarchical systems can thus be a major contributor to establishing the initial mass function.
1 INTRODUCTION
Evidence is mounting that stars rarely form in isolation as single objects, but rather as binaries or small multiple systems (e.g., Duchêne & Kraus 2013). Small multiple systems are produced through fragmentation of prestellar cores, as first studied by Hoyle (1953) and Larson (1972). In modern terms, the two principal pathways for fragmentation are turbulent fragmentation, which tends to operate on larger scales (e.g., Lee et al. 2019), and disk fragmentation, which operates on small scales in massive protostellar disks (e.g, Kratter & Matzner 2006). Most multiple systems form in non-hierarchical configurations, but soon undergo dynamical interactions. Over about a hundred crossing times such systems tend to rearrange into hierarchical configurations consisting of compact binaries and members that either are ejected into a distant bound orbit, or escape (e.g., Anosova 1986, Delgado-Donate et al. 2004). Half of all such escapes occur during the embedded phase, leading to the ejection and exposure of orphaned protostars, some of which did not have time to gain enough mass to become hydrogen burning stars (Reipurth & Clarke 2001, Reipurth et al. 2010). This competition between accretion and ejection was shown by Bate & Bonnell (2005) to be the key driver in shaping the initial mass function at all masses.
The reconfiguring of a non-hierarchical triple system occurs after a close triple approach, when three bodies can exchange energy and momentum. After an ejection the remaining binary has a high eccentricity, leading to disk-disk interactions during periastron passages, and a gradual inspiral of the binary. The periastron passages lead to disk disturbances and accretion events, with ensuing outflow. The stellar magnetohydrodynamic jet engines are thus force-fed, resulting in spectacular giant Herbig-Haro (HH) flows (Reipurth 2000).
Large-scale numerical simulations have offered insight into the formation of multiple systems and their dynamical interactions (Bate 2009, 2012). Such dynamical interactions can help to bind components into tighter binaries, but to produce the observed frequency of close binaries, dissipative interactions are needed, during which the presence of gas serves to transport angular momentum and dissipate energy in star-disk and disk-disk interactions. While any non-hierarchical system will eventually always evolve into a hierarchical configuration on dynamical grounds alone, the presence of gas plays an important role in the subsequent orbital evolution of the binary and its mass-ratio (Bate et al. 2002).
Evidently significant dynamical evolution is expected to occur during early stellar evolution, as borne out by observations. Early optical surveys of T Tauri stars showed an excess of companions relative to field stars (e.g., Reipurth & Zinnecker 1993, Leinert et al. 1993). This was further demonstrated with near-infrared observations of Class I protostars, which revealed not only an excess of companions, but also a bimodal distribution of the separation distribution function with a second peak at several thousand AU (Connelley et al. 2008a,b). This population of distant companions decreases for the more evolved Class I sources, suggesting that the companions dynamically evolve and become unbound. Most recently, ALMA and VLA observations of Class 0 and Class I sources have yielded insights into the high multiplicity of the youngest protostars (Tobin et al. 2016, 2018, 2022) and have confirmed the existence of the bimodal binary separation distribution.
For reviews of multiple systems and their dynamical evolution, see Reipurth et al. (2014) and Offner et al. (2022).
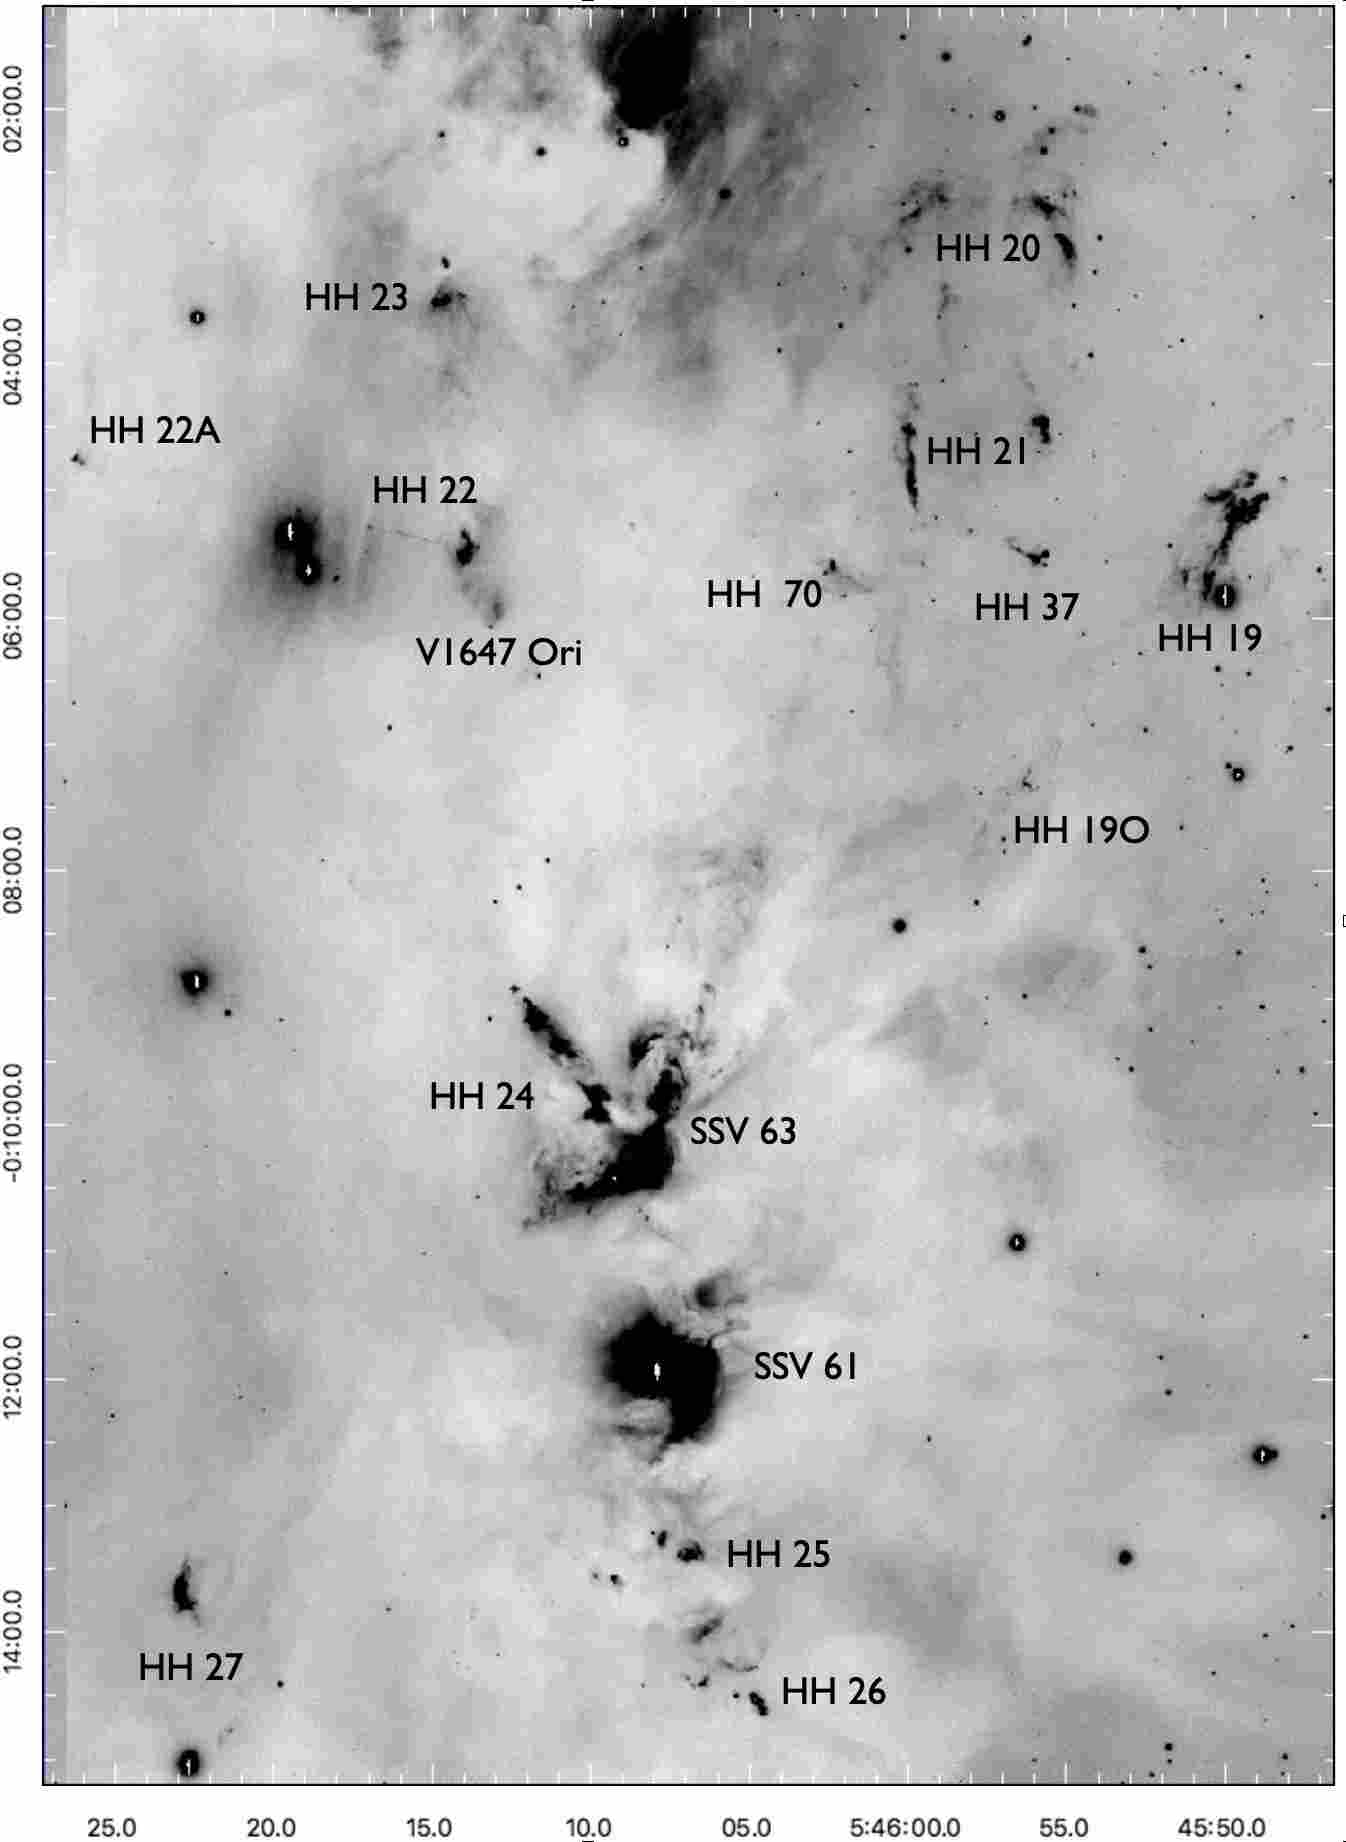
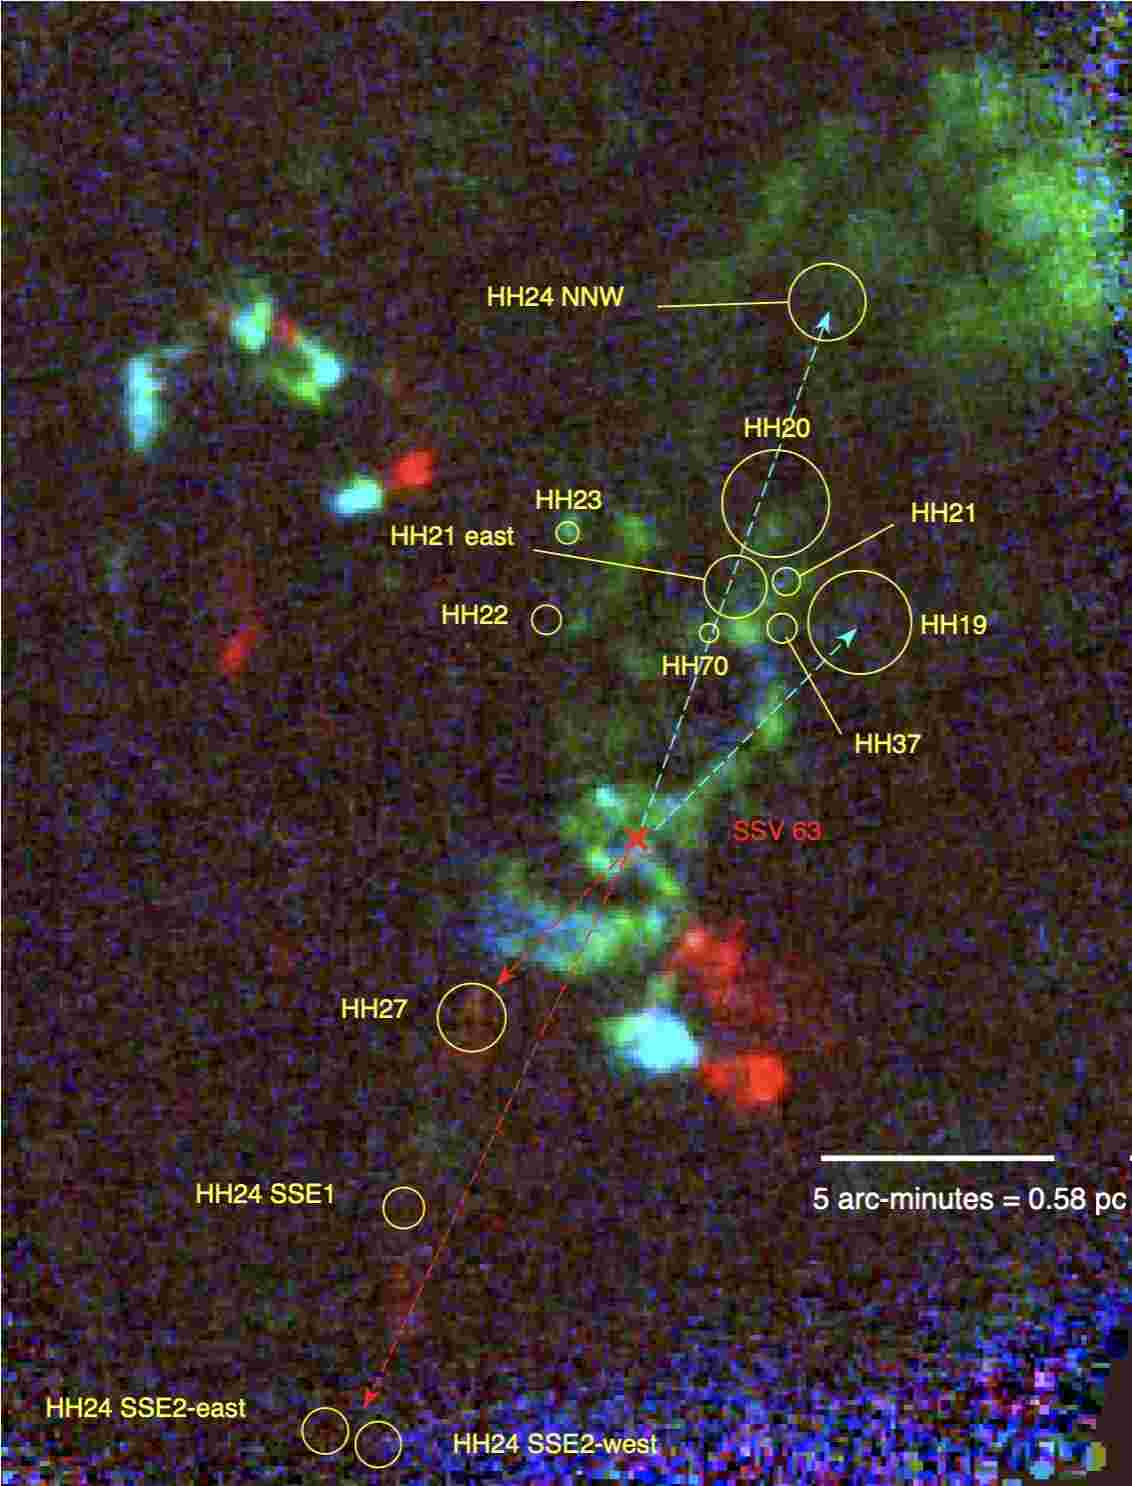
In this paper we present a detailed study of the HH 24 jet complex and the compact multiple system that drives these jets. This is a complex region of star formation, in which a small multiple system has formed within a cloud core and through dynamical interactions has triggered disk disturbances that have lead to massive accretion events and ensuing outflow activity. This has resulted in the highest concentration of finely collimated HH jets known. An overview of the region is shown in Figure 1 and some of the general properties of the outflows are given in Table 1.
The paper is organized as follows: In Section 2 we present a summary of key results obtained in previous studies, and in Section 3 a description of the observations obtained for this study. This is followed by an overview of the HH 24 complex in Section 4, and a summary of the properties of the multiple system in Section 5. Section 6 contains a discussion of the individual jets and shocks, and Section 7 presents an analysis of the neighboring protostar HH 24 MMS. The discovery of a low-mass runaway borderline brown dwarf that was ejected 5,800 yr ago from the multiple system is discussed in Section 8. After that the star formation efficiency is derived in Section 9. Details of our ALMA observations are presented in Section 10 and Section 11, where the individual disks and the large-scale cloud structures, respectively, are studied. Finally Section 12 and Section 13 contain a detailed discussion and a summary of our results.
| Jet | PA | Orient. | Giant Bow-Shocksa | Source |
|---|---|---|---|---|
| C | 333∘ | Blue | HH 20/21/37/70 | Ea |
| E | 149∘ | Red | Ea | |
| A | - | Red | Ea/HOPS317 | |
| G | 39∘ | Blue | NE | |
| J | 311∘ | Blueb | HH 19/27 | Wb |
| L | 38∘ | - | HOPS317 | |
| X | 143∘ | - | S(?) | |
| B | - | Blue | Wa |
Note. — a: Additional very distant bow shocks exist. b: Deduced from the blue-shift of HH 19.
2 PREVIOUS WORK
HH 24 is located in the L1630 cloud (aka Orion B), in a dense core that is part of a chain of north-south oriented cores detected in both millimeter line emission and sub-millimeter continuum (e.g., Gibb & Heaton 1993, Lis et al. 1999, Mitchell et al. 2001, Kirk et al. 2016a, Hsieh et al. 2021). The driving source of HH 24 was detected in a near-infrared survey by Strom et al. (1976). This source, SSV 63, was later found to be a multiple protostellar system. We here assume HH 24 and the L1630 cloud to be at a distance of 400 pc (e.g., Anthony-Twarog 1982), a distance supported by the more recent studies of Lombardi et al. (2011) [39812 pc], Kounkel et al. (2017) [38810 pc], and Zucker et al. (2019) [42321 pc]. For an overview of star formation in L1630, see the review by Gibb (2008).
The HH 24 complex was discovered by Herbig & Kuhi (1963) in their search for H emission stars in L1630111The first mention of HH 24 is in a letter from George Herbig to Jesse Greenstein dated August 9, 1952 in which Herbig speculates that the faint nebulous emission-line objects he found on his photographic plates of the HH 24 region might be similar to the recently discovered objects HH 1 and 2.. Subsequently HH 24 has been the subject of numerous studies, a selection of which are listed here. Schmidt & Miller (1979) and Scarrott et al. (1987) used polarimetric observations to infer that the HH 24 nebulosity is a mixture of emission from shocks and reflected light from embedded sources. HH 24 has been imaged optically by Herbig (1974), Strom et al. (1974a), Jones et al. (1987) and Mundt et al. (1991). Two of the knots in HH 24 were detected in H2 2.122 m emission by Davis et al. (1997). Optical or ultraviolet spectroscopy of various components in HH 24 has been presented by Strom et al. (1974), Brugel et al. (1981), Jones et al. (1987), Solf (1987), and Böhm et al. (1992). Some of the HH 24 jets are associated with distant bow shocks, as noted by Jones et al. (1987) and Eisloeffel & Mundt (1997).
For the following detailed discussion of the HH 24 complex, it is important to have clear definitions of the nomenclature of the multitude of shocks in the region. Unfortunately, the existing knot designations were developed over a number of years by many different researchers, and along the way a number of mistakes occurred, so that it is difficult to compare various studies. HH 24 was discovered by George Herbig, but besides the brief mention in Herbig & Kuhi (1964), he did not provide further information until his HH catalog appeared, in which he identified four components A,B,C,D (Herbig 1974). Simultaneously Strom et al. (1974a,b) labeled five knots A-E, but used E for knot D in Herbig’s notation, a knot that was later shown to be an H-strong reflection nebula. Schmidt & Miller (1979) adopted the Strom et al. (1974a,b) nomenclature. Solf (1987) added the label F, which simultaneously was labeled E by Jones et al. (1987), who also introduced more detailed designations of knots. In this paper we follow and extend the consistent designations by Herbig (1974), Jones et al. (1987), Mundt et al. (1991), and Eisloeffel & Mundt (1997).
3 OBSERVATIONS
3.1 HST WFC3
The HH 24 complex was observed with HST under program GO-13485 (PI: Reipurth) in an H (F656N) filter on UT 2014-03-10 with a total exposure time of 5578 sec, in a [Sii] (F673N) filter on UT 2014-02-26 for 5578 sec, in a [Feii] (F164N) filter on UT 2014-02-18 for two exposures of 3596 sec and 1798 sec. Parallel observations of HH 19 were made with ACS in H on UT 2014-03-10 for 5165 sec. Two years later, on UT 2016-02-03, a second-epoch [Feii] image of HH 24 was obtained under program GO-14344 with an exposure time of 5395 sec.
3.2 Subaru SuprimeCam images
The Subaru 8m telescope was used to observe HH 24 with SuprimeCam (field of view 34′ 27′ and scale 020/pxl) on UT 2006-01-05 using a [Sii] filter (N-A-L671, FWHM 130 Å, transmission 88%) with 512 min dithered exposures; the sky was clear and seeing varied between 0.51 and 0.70 arcsec. On UT 2006-01-06 HH 24 was observed using an H filter (N-A-L659, FWHM 99 Å, transmission 88%) with 512 min dithered exposures through intermittent light cirrus and seeing between 0.57 and 0.67 arcsec. The pixel scale was 0.20 arcsec/pxl. Second-epoch observations with 56 min were similarly acquired on UT 2015-12-17 in a [Sii] filter in seeing of 0.8-0.9 arcsec.
3.3 Gemini observations
Several observing runs were carried out at the Gemini-North Frederick C. Gillett 8m telescope. GMOS was used on 2010-03-13 and 2010-03-16 under program GN-2010A-Q-10 to obtain g, r, i, H, and [Sii] images and multi-slit spectra of the SSV 63 region. At the time of these observations GMOS had a 5.5’7.4’ field of view with 0.0727″ pixels. Three exposures of 60 sec were obtained through the broadband filters and three 5 min exposures in the narrowband filters. The R400 grating with a dispersion of 0.0673 nm/pxl was used for 6 exposures of 20 min using slitless spectroscopy. NIRI was used on 2009-12-26 and 2010-02-09 to obtain near-infrared images in the J, H, K’, H2, and [Feii] filters. Eighteen 30 sec exposures were obtained in the two narrowband filters and in nearby continuum filters, 9 25 sec exposures were obtained in the J-filter and 9 10 sec exposures in H and K’. Near-infrared spectroscopy was obtained with GNIRS under program GN-2013B-Q-77 in cross-dispersed SXD mode using the 32 l/mm grating and a 0.3 arcsec slit. Source Wb was observed on 2014-03-19 for 2400 sec in 0.87′′ seeing, and Ea on 2014-03-20 for 1200 sec in 0.62′′ seeing. Subsequently near-infrared imaging of SSV 63 using NIRI and Gemini’s adaptive optics module ALTAIR with a laser guide star was performed on 2013-12-15 in J, H, K’ filters.
3.4 Apache Point Observatory
Radial velocities of various knots and features in the HH 24 field were measured using the ARCES echelle spectrograph on the APO 3.5 meter telescope on UT 2018-11-19 and on UT 2021-02-27. ARCES captures the entire spectrum between 3200-10000 Å with a resolution (2.5 pixels) of about R32,000. The ARCES entrance aperture is a small slit 1.6′′ by 3.2′′ in extent on the sky. A one pixel interval near the H and red [Sii] doublet lines corresponds to a Doppler shift of 4 km s-1 per pixel. The ARCES spectrograph was also used to obtain spectra of the new knot in HH24 jet C on UT 2022-01-26. A set of five 300 second exposures was combined for the final spectrum.
All ARCES velocities reported here are referenced to the mean H radial velocity of the Orion Nebula in the vicinity of the Trapezium cluster which is assumed to have a heliocentric radial velocity of 21 km s-1, corresponding to Vlsr = +2 km s-1. This reference frame is within a few km s-1 of the radial velocity of the Orion B cloud in which HH 24 is embedded. The Orion Nebula is located within 5∘ of HH 24, making the relative correction between the observatory reference frame and heliocentric (or LSR) reference frame smaller than the errors in radial velocity determinations. The measurement errors in the spectral line profiles are dominated by the large observed line-widths and low signal-to-noise ratios and are estimated to be between 5 to 10 km s-1.
[Sii] images of the HH 24 outflow were obtained with a new [Sii] filter having a passband of 78 Angstroms and providing full illumination of the 8′ field of view of the ARCTIC CCD camera on UT 2021-12-01 with the APO 3.5 meter reflector. A dithered set of three to six 300 second exposures were acquired at four different pointings to cover the entire HH 24 outflow complex.
Near-infrared observations were obtained with the NICFPS camera on the APO 3.5 meter telescope on UT 2018-11-19, 2018-12-23, 2022-01-25, and 2022-01-27. The pixel scale of this instrument is 0.273′′ per pixel with a field of view 4.58′ on a side. Dithered images with 300 second exposures were obtained in the 2.122 m S(1) line of H2 using a narrow-band filter (FWHM=0.4% of the central wavelength) plus identical separate sky frames. Atmospheric seeing produced 1.2′′ FWHM stellar images.
3.5 VLT
An unpublished data set of images of SSV 63 in the Ks and L’ band obtained with NACO, the adaptive optics-assisted infrared imager and spectrograph at the Very Large Telescope (Lenzen et al., 2003, Rousset et al., 2003), was retrieved from the ESO Science Archive Facility together with its relevant calibration frames. The data set consists of 33 individual frames through the Ks filter obtained on the night of 20/21 December 2007, with a total exposure time of 30 minutes, and 82 images through the L’ filter obtained on the night of 31 December 2007 / 1 January 2008, with total exposure time of 41 minutes. The Ks- and L’-band images were flux calibrated using respectively the standard stars S252-D (Persson et al. 1998) and S842-E (Leggett et al. 2003). Data reduction was carried out using IRAF-based scripts.
3.6 ALMA
The Atacama Large Millimeter Array (ALMA) was used to observe molecular line and dust thermal continuum emission from the HH 24 region in the 1.3 mm region of the spectrum (ALMA Band 6). The observations, part of the Cycle 6 project 2018.1.01194 (PI: Reipurth), included one spectral configuration that allowed simultaneously observations of a 1.875 GHz-wide band of continuum emission, centered at 232.6 GHz, and the following spectral lines: 12CO(2-1), 13CO(2-1), C18O(2-1), H2CO(30,3-), and SiO(5-4). The (single) pointing of the ALMA 12 m array observations was centered at 05:46:08.35, -00:10:01.5 (2000), which was chosen to be able to cover, well within the 25″ Half-Power Beam Width (HPBW) of the primary beam at the observed frequency, the circumstellar environment of the previously known protostars in the HH 24 region.
The goal of the observations was to study the link between the small scale structure (i.e., disks), with sizes of about 50 to 100 AU, and the larger structures with scales of 1000 AU (e.g., circumstellar envelopes, outflows). As such, a range of baselines was needed to be sensitive to this range of scales and therefore the observations were done using two array configurations (named C43-3 and C43-6). The more compact configuration (C43-3) consisted of baselines ranging from about 15 to 500 m, while the more extended configuration (C43-6) contained baselines of up to approximately 3070 m. The angular resolution and maximum recoverable scale of the compact configuration was about 0.7″ and 7.5″, while for the extended configuration these were 0.12″ and 2″, respectively. The data from the C43-3 configuration were taken with three execution blocks, obtained in December 2018 and April 2019, while the three execution blocks with the C43-6 configuration were observed in September 2019.
| Map | Configurationsa | Beam Size | Beam P.A. | b | rmsc |
|---|---|---|---|---|---|
| [arcsec] | [deg E of N] | [km s-1] | [mJy beam-1] | ||
| Continuum | C43-3 + C43-6 | -87 | — | 0.038 | |
| C18O(2-1) | C43-3 + C43-6 | -70 | 0.2 | 1.4 | |
| 12CO(2-1) | C43-3 | 86 | 0.16 | 4.0 | |
| 13CO(2-1) | C43-3 | 87 | 0.08 | 5.5 | |
| C18O(2-1) | C43-3 | 87 | 0.08 | 4.5 | |
| H2CO(30,3-) | C43-3 | 87 | 0.17 | 2.8 |
Note. — aALMA configurations used to make map. bVelocity resolution of molecular line maps. crms per velocity channel at the quoted velocity resolution.
The Common Astronomy Software Application Package (CASA, McMullin et al. 2007) was used to reduce the data. Version 5.4 of the CASA pipeline was used to calibrate the raw visibility data taken in configuration C43-3, while version 5.6 was used for data taken in configuration C43-6. We combined the calibrated data from both configurations to study the dust continuum and C18O emission at small (disk) scales and used CASA version 5.7 for self-calibration of the continuum data and imaging. We iteratively performed phase-only self-calibration with a minimum solution interval of 10 s, and then applied the solution to both the continuum and C18O data. These were subsequently imaged using the tclean task in CASA, with the multi-scale deconvolver with scales of 0, 03, 07, and 21 for the continuum image and 0, 05, 11, 23, and 52 for the C18O line map (which approximately correspond to 0, 2, 5, and 10–20 times the beam sizes), and using Briggs weighting with robust parameters of and 0.5, respectively.
In order to study the gas structure and kinematics at larger scales (1000 AU) we used the 12CO, 13CO, C18O and H2CO line maps obtained with the C43-3 configuration. These were all imaged with version 5.4 of the CASA pipeline. Imaging of the visibility data was done using the tclean task in CASA with a robust parameter of -0.5. The continuum was subtracted from all the molecular line maps using the CASA task uvcontsub. Primary beam correction was applied to all maps, except for the high-resolution C18O map. The synthesized beam and rms noise of the resulting images are shown in Table 2.
3.7 VLA
The observations were part of our VLA project 19A-012, made with the NSF’s Karl G. Jansky Very Large Array (VLA) of NRAO222The National Radio Astronomy Observatory is a facility of the National Science Foundation operated under cooperative agreement by Associated Universities, Inc.. The observations were obtained in the A configuration, those at 44.0 GHz (Q band) on UT 2019-8-19 and those at 10.0 GHz (X band) on UT 2019-8-24. These are the deepest observations of the HH 24 region obtained to date in those bands. The flux and bandpass calibrator was J0542+4951 (=3C147) and the phase calibrator was J0552+0313. The digital correlator of the VLA was configured in spectral windows of 128 MHz width, each divided in 64 channels of spectral resolution of 2 MHz. The total bandwidths were 4.0 and 8.0 GHz for the X band and Q band observations, respectively. The data were processed and analyzed in the standard manner using the CASA package of NRAO and the pipeline provided for VLA333https://science.nrao.edu/facilities/vla/data-processing/pipeline observations. Maps were made using a robust weighting (Briggs 1995) of 2 in order to optimize the sensitivity at the expense of losing some angular resolution.
4 THE HH 24 JET COMPLEX
In the following we study in detail the complex structure of the HH 24 jet group, based on Gemini, Subaru, and HST images. We discuss all the individual jets in the HH 24 complex based on new ultradeep high spatial resolution groundbased images. These reveal numerous new previously unseen or unresolved knots, which allow a better understanding of the multiple flow structures in the HH 24 complex. We introduce a new flow, HH 24X, and extend current knot nomenclature for the principal jets C and E, see Section 3.
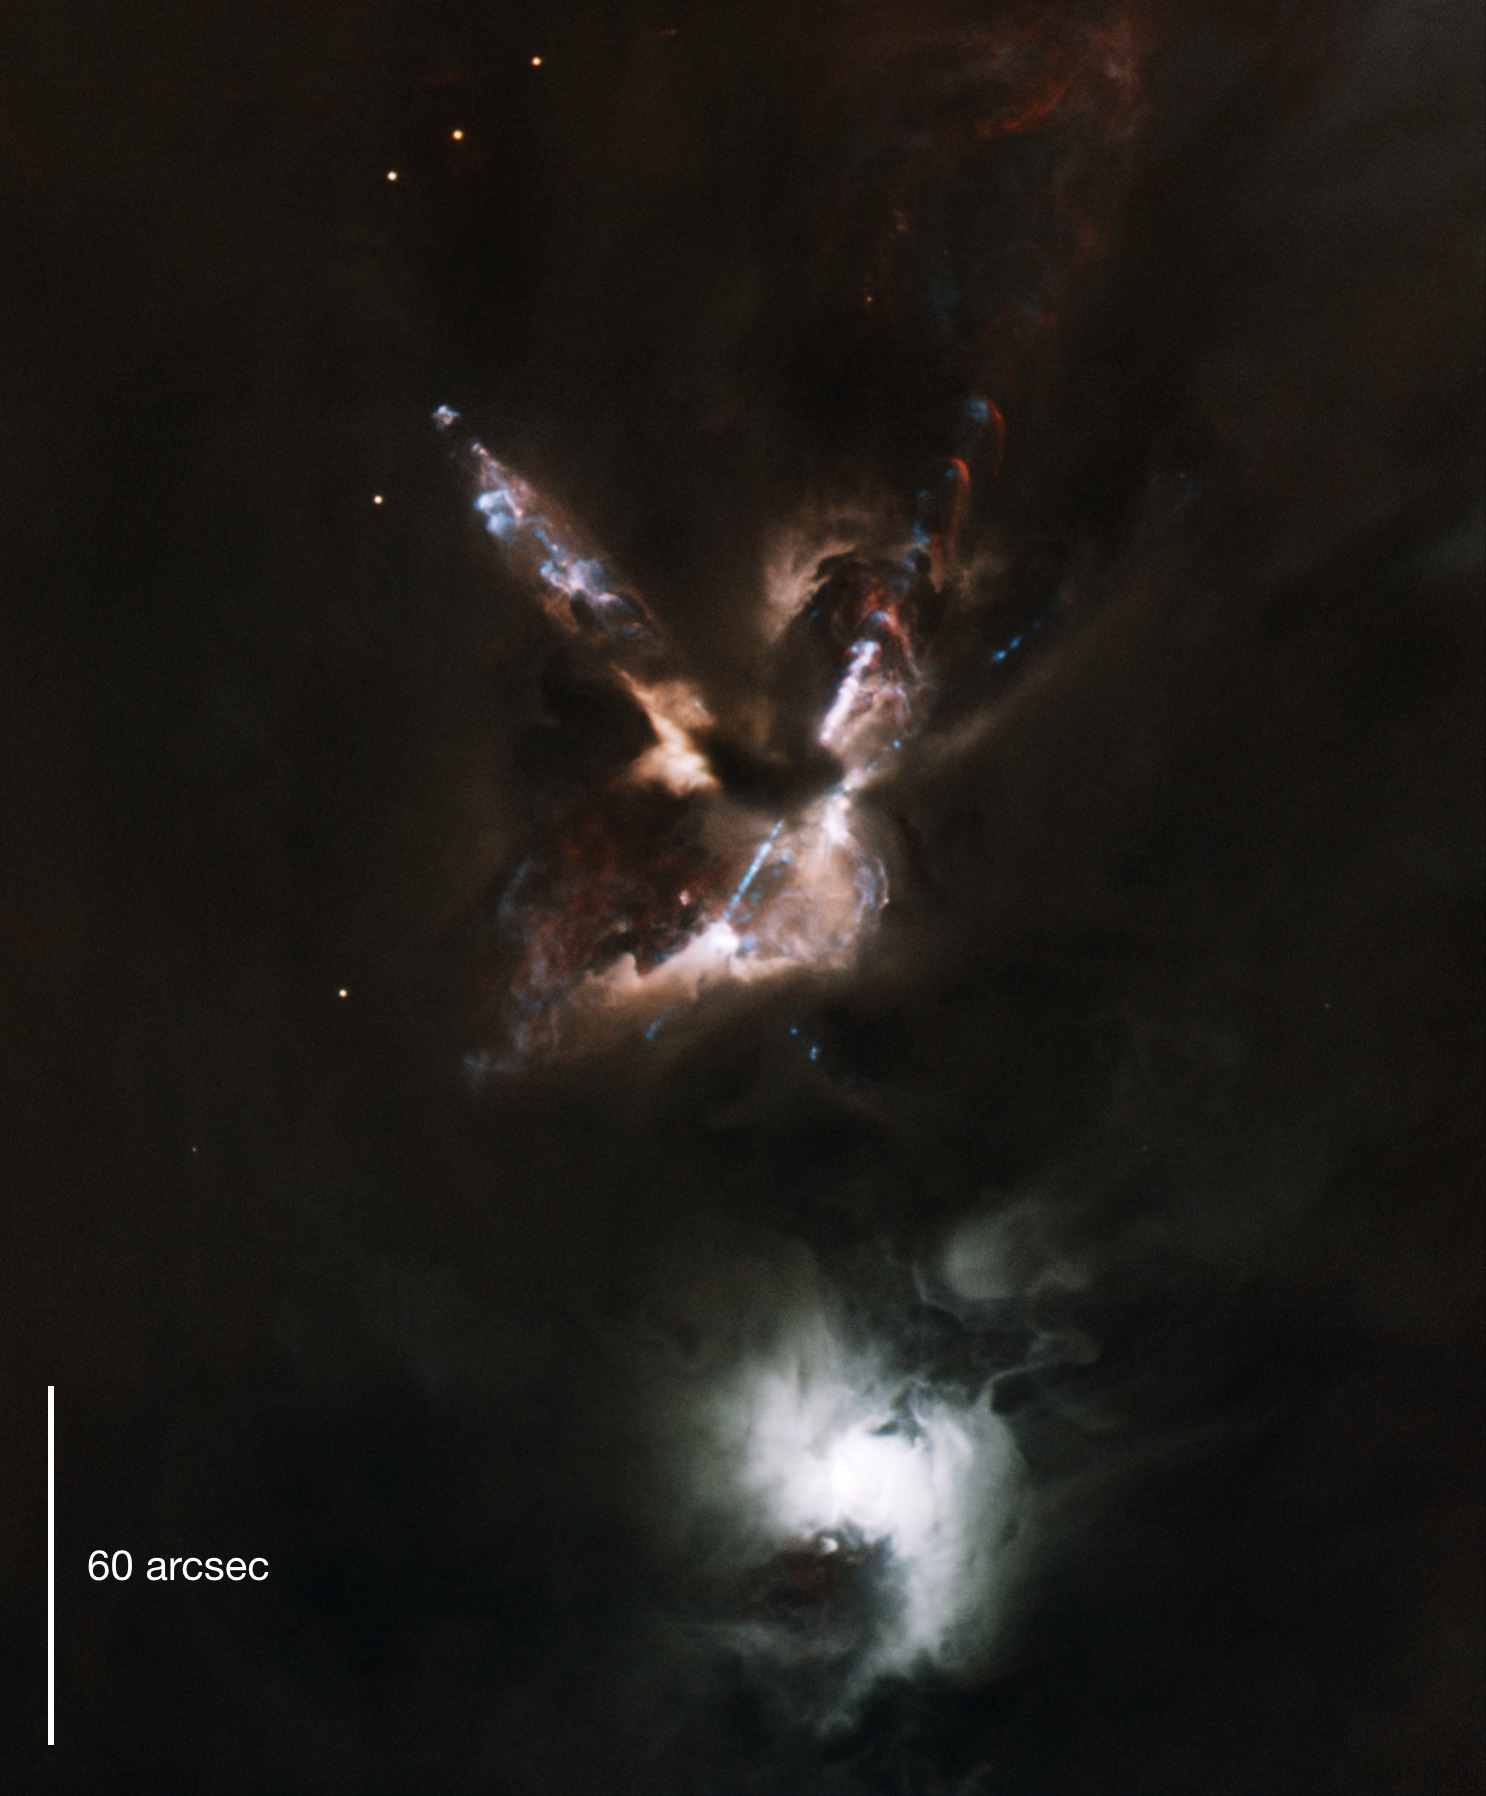
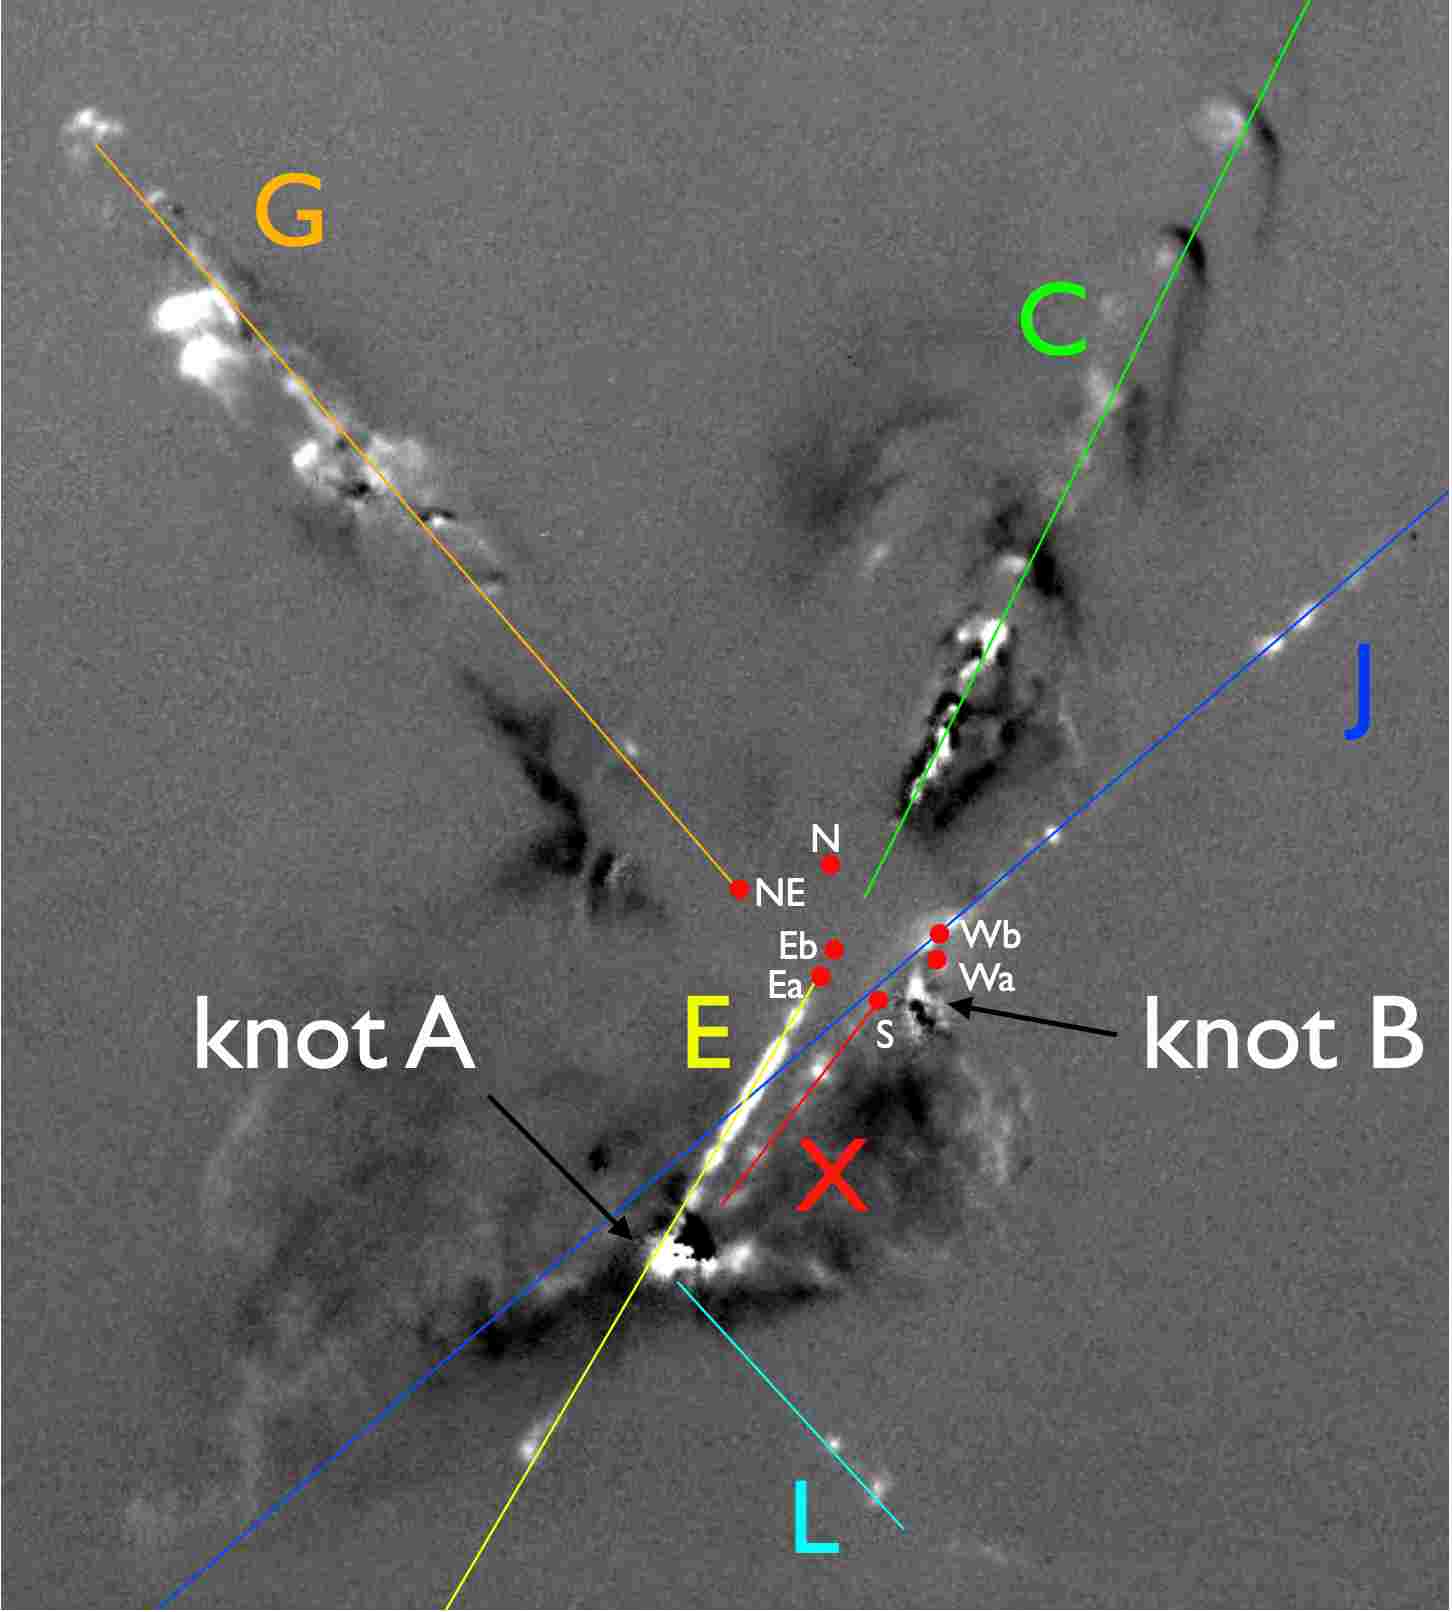
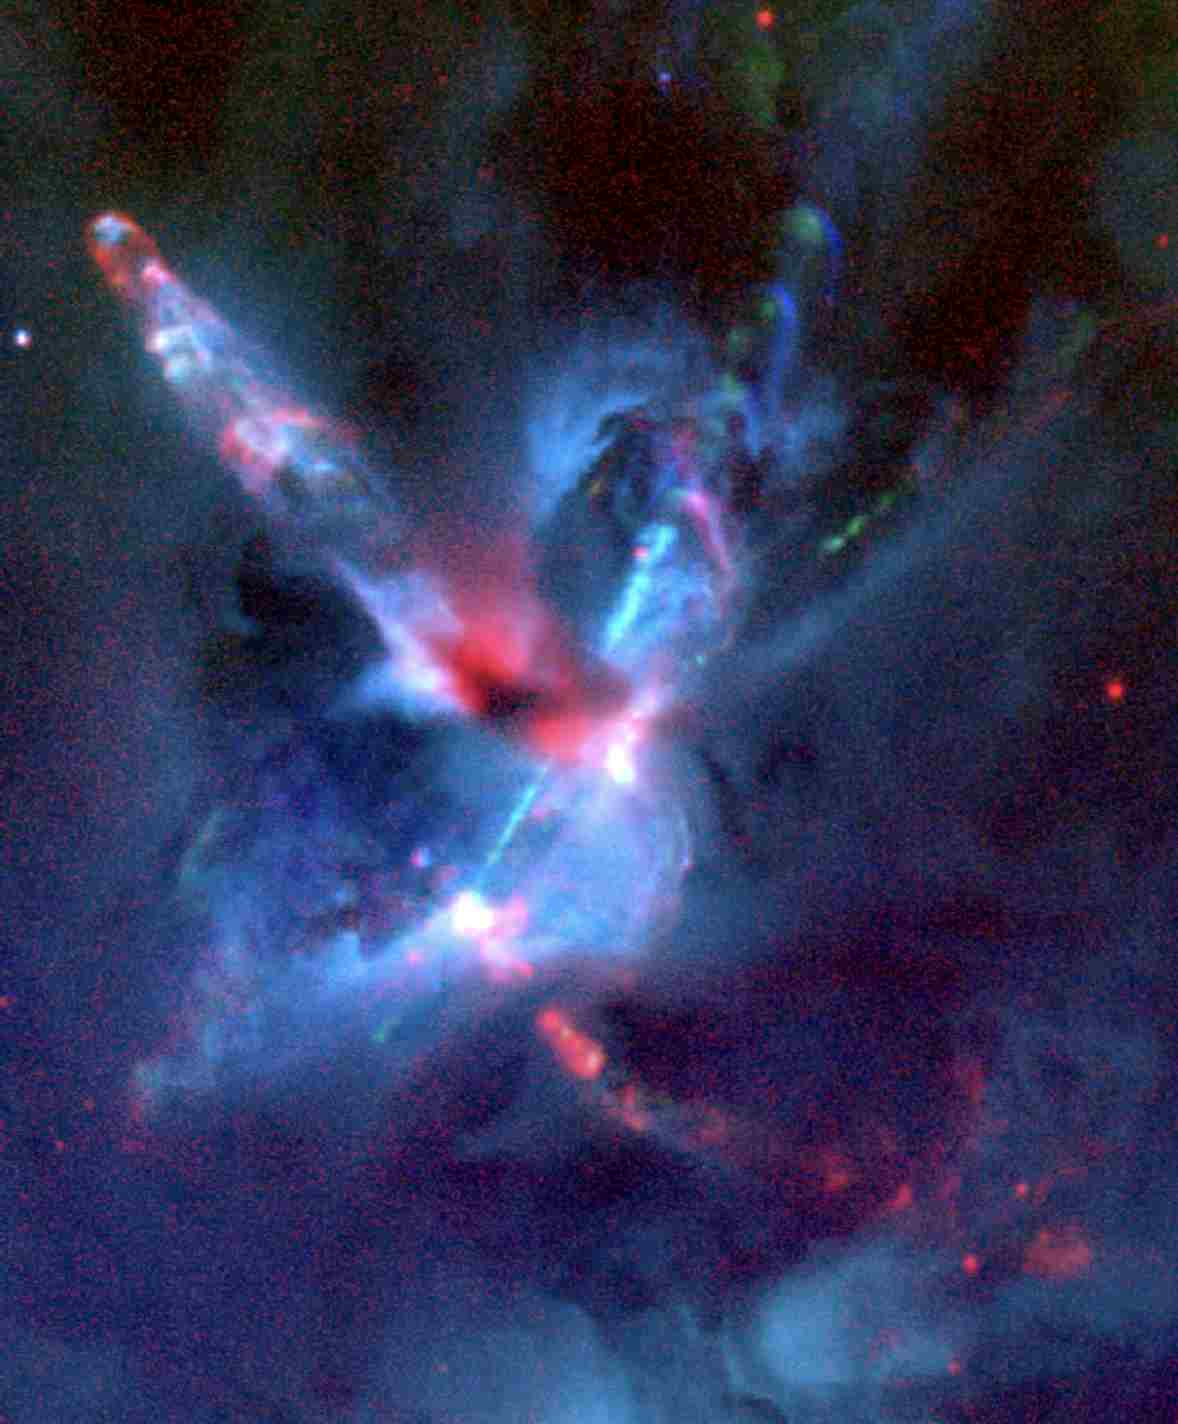
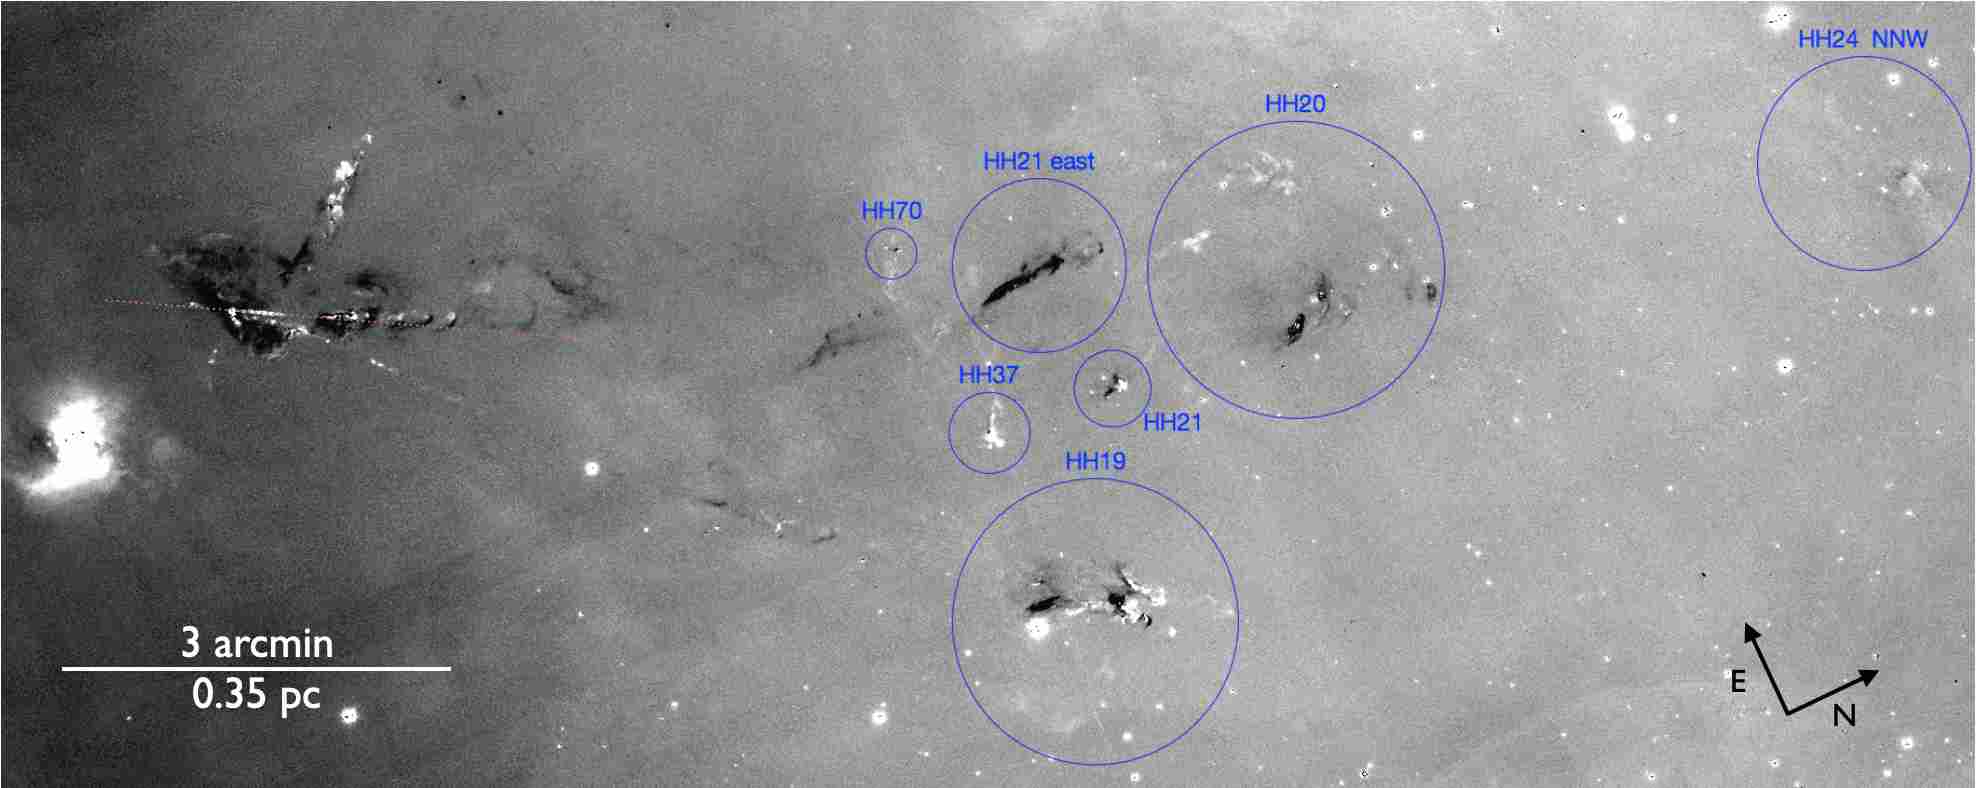
The environment of HH 24 in a 6′10′ field is shown in Figure 1, which is the sum of deep (1 hour) exposures in H and [Sii] obtained with SuprimeCam at the Subaru 8m telescope. HH 24 is located in a highly structured N-S oriented cloud filament studied at mm-wavelengths by, e.g., Lada et al. (1991), and in the sub-mm by, e.g., Kirk et al. (2016). Figure 2 shows more detail of the jets in an optical color-figure based on the broadband and narrowband Gemini images. The figure shows how the group of jets that constitute HH 24 is emanating from a dense cloud core and in the process is tearing apart the cloud environment. Figure 3 shows a difference image between H and [Sii] displayed such that H dominant regions are black and [Sii]-dominant regions are white. The figure is annotated with designations for the individual jets.
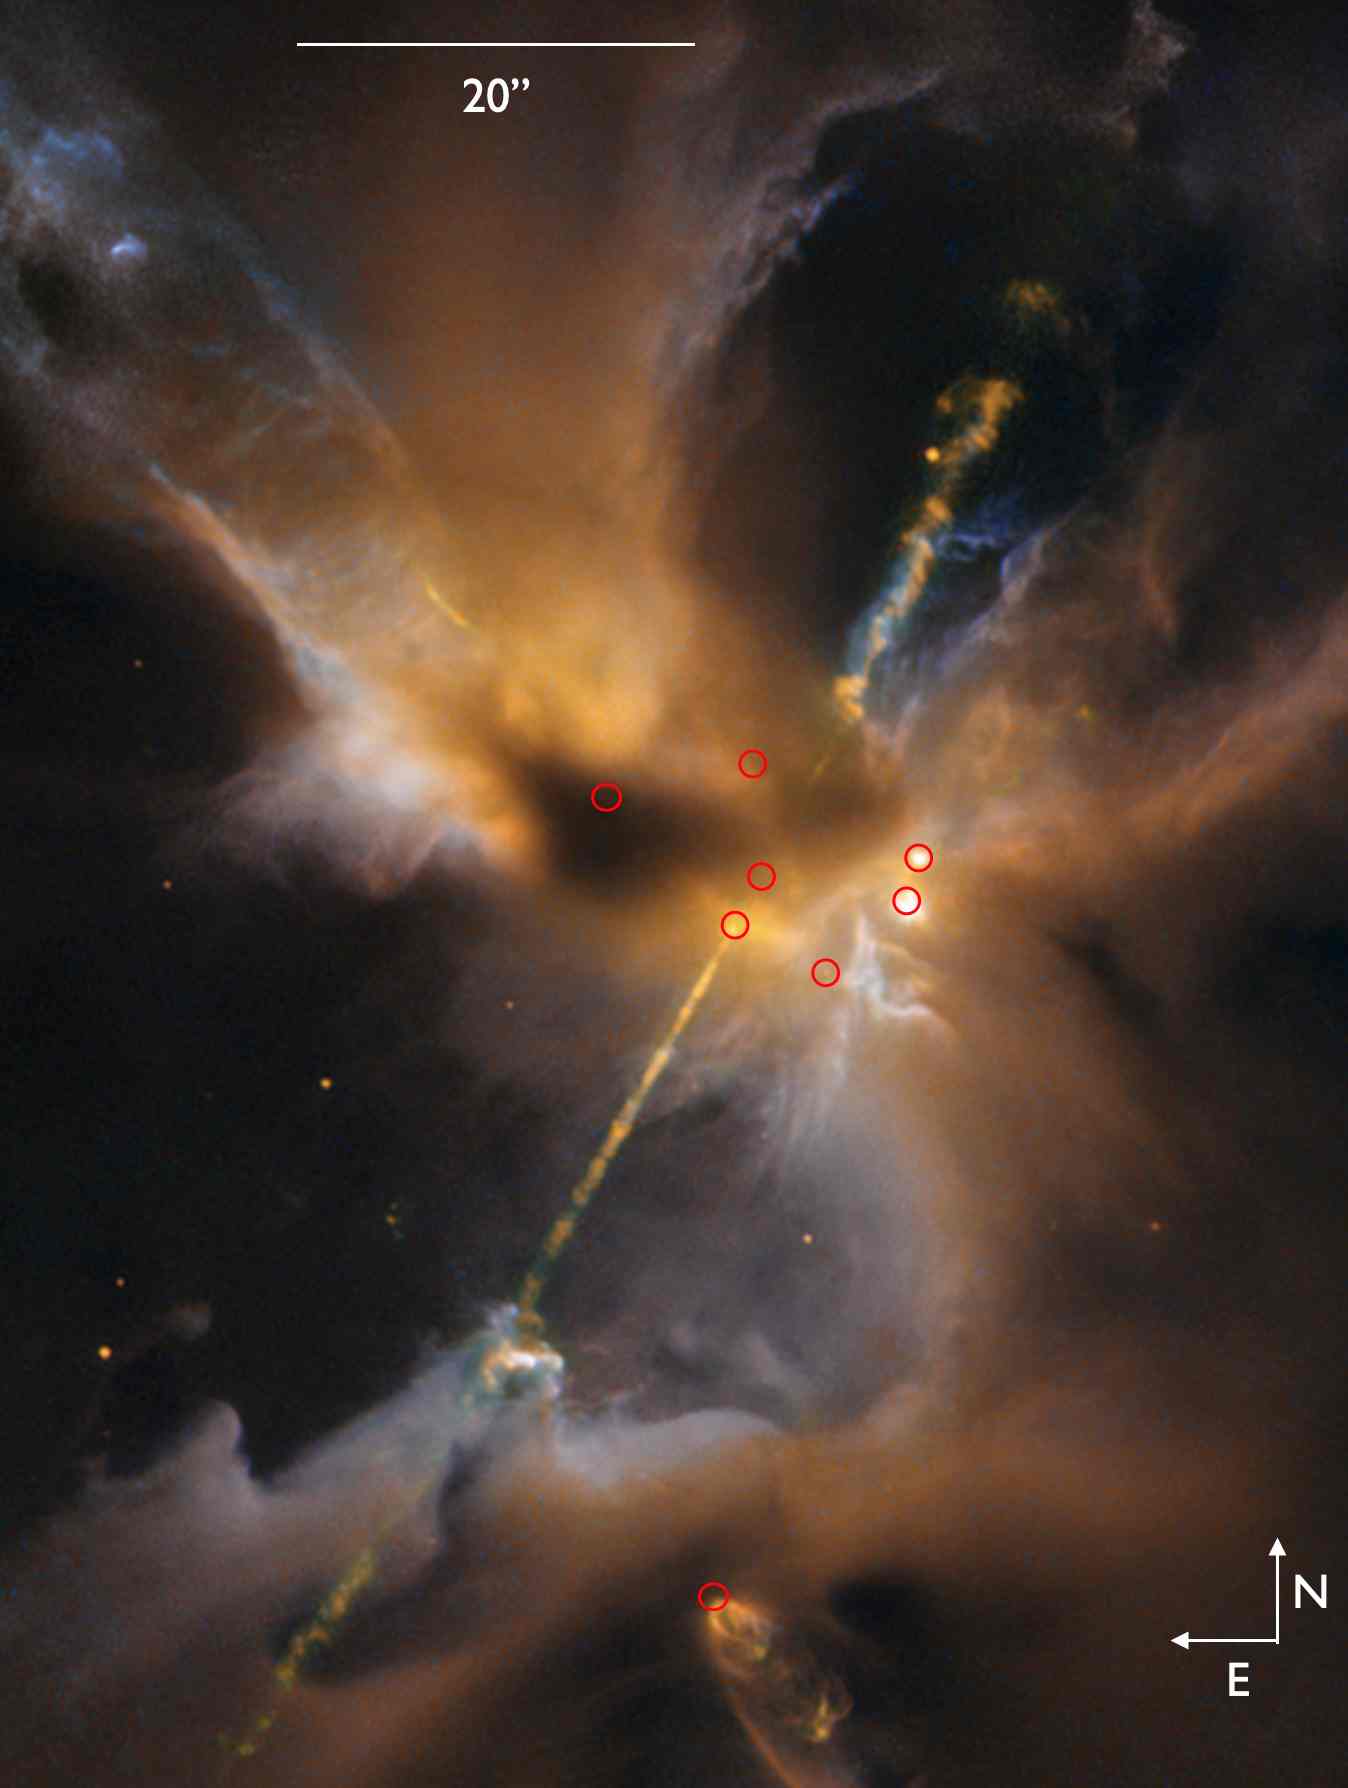
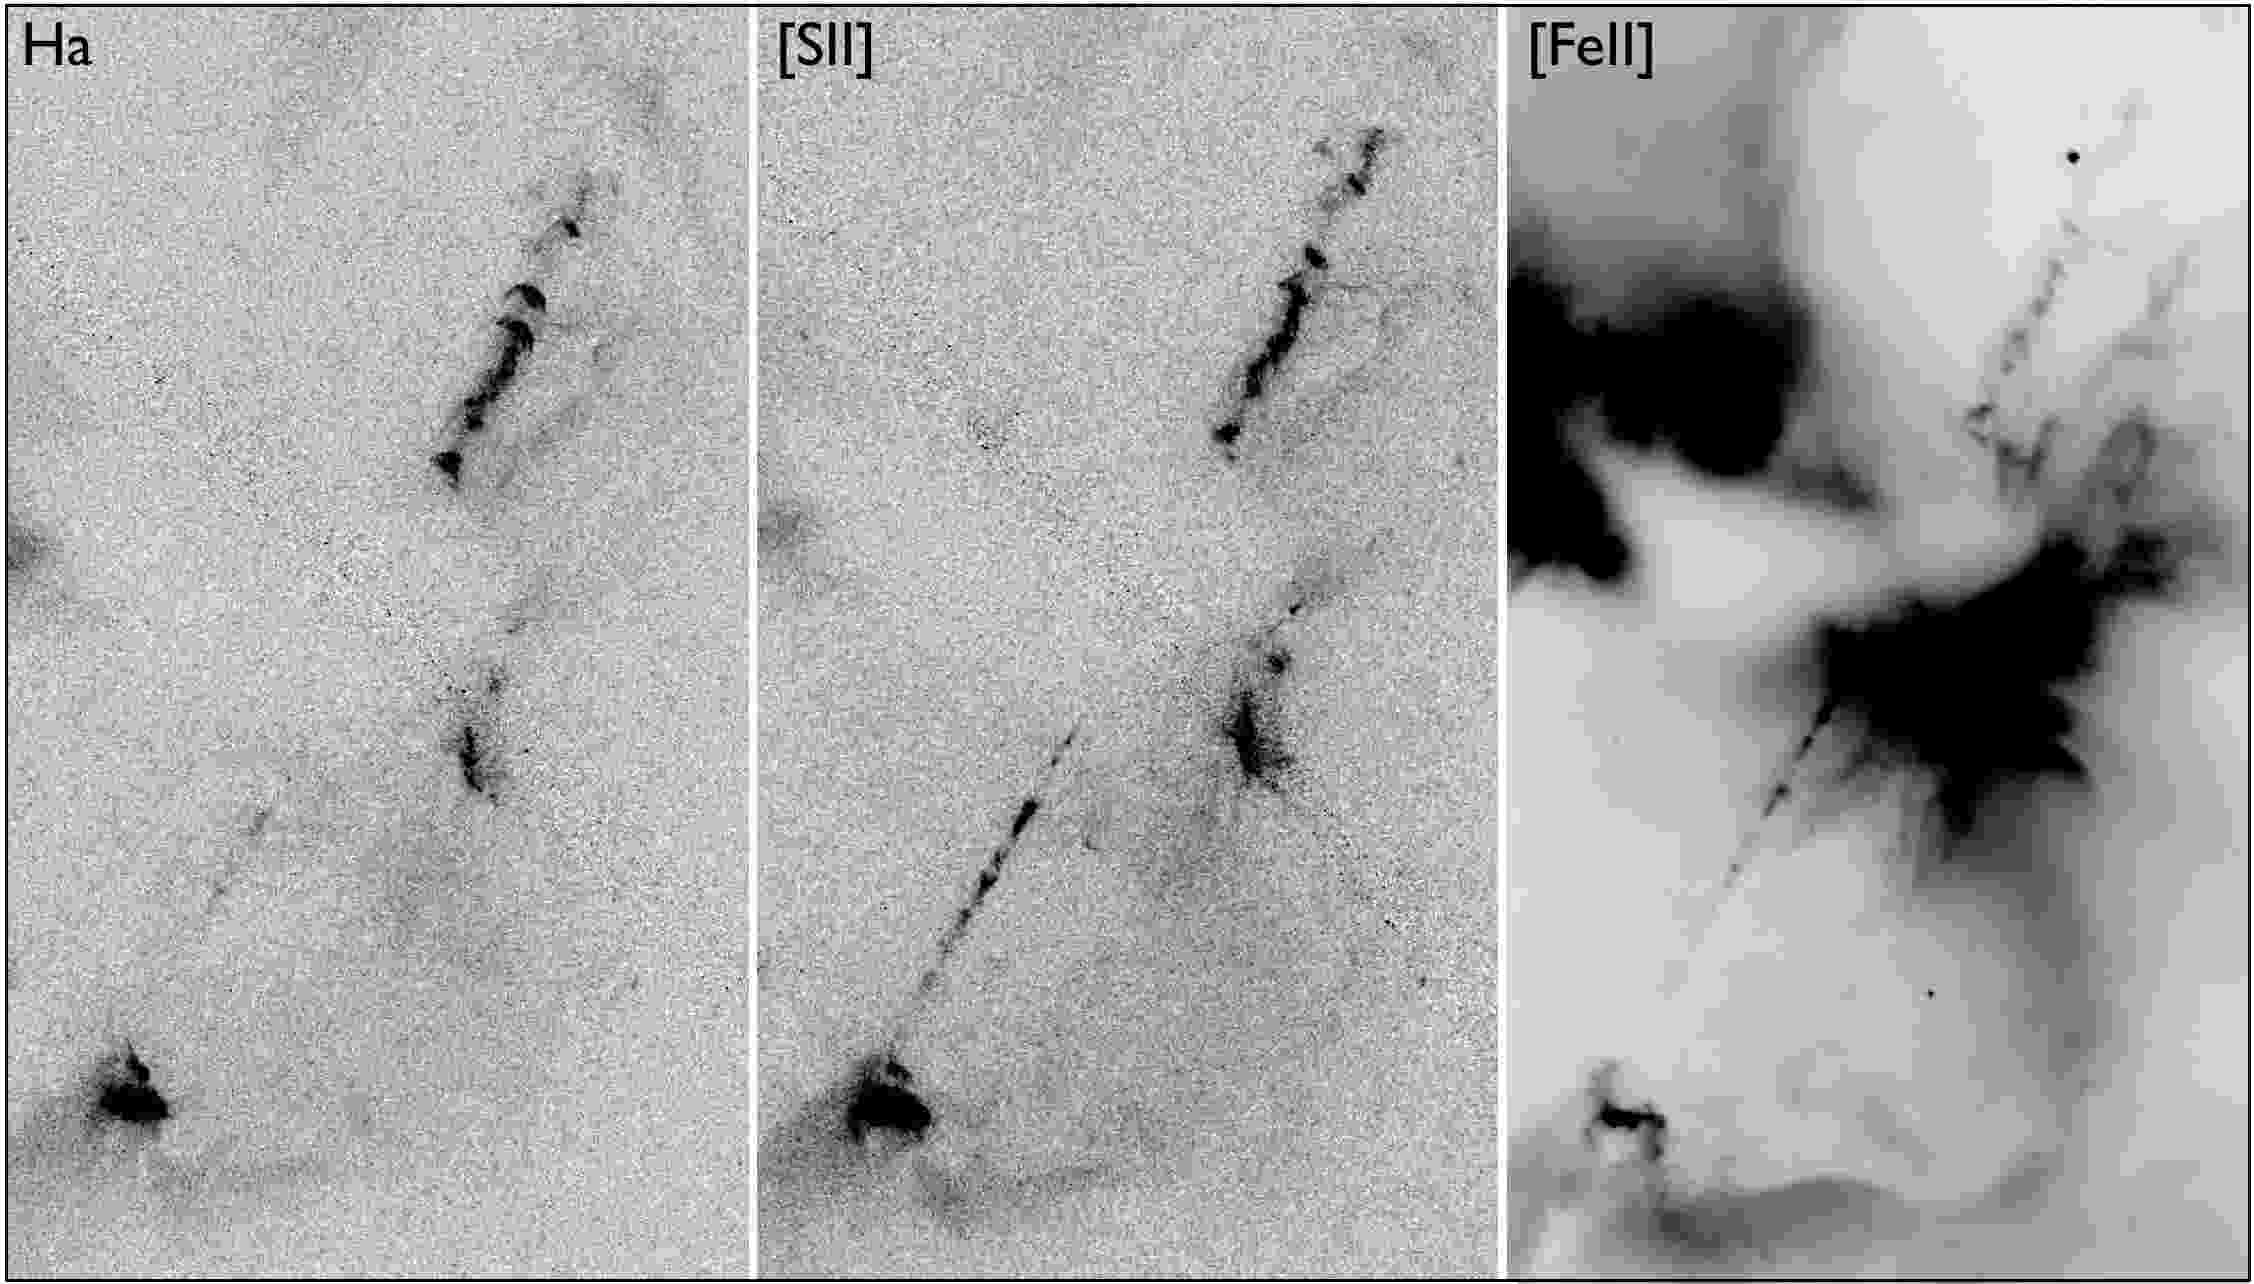
We have also obtained HST images using WFC3 with H, [Sii], and [Feii] filters, see Section 3 for full details. Figure 4 shows a color image based on our narrow-band filter HST images and archival broadband HST images, which provides a more detailed overview of the region. The individual narrow-band images of the E- and C-jets are shown in Figure 5. These images do not have the same field-of-view as the Subaru and Gemini images, but offer higher resolution. In Section 6 we discuss the properties of the HH 24 jet complex based on these and other data sets.
5 THE SSV 63 MULTIPLE SYSTEM
In this section we consider the multiple system that drives the cluster of jets discussed above, and we attempt to associate specific jets with individual sources.
Strom et al. (1976) detected a near-infrared source associated with HH 24 in a survey of L1630. It was subsequently detected in the 6 cm radio continuum (Bieging et al. 1984) and later at mid- and far-infrared wavelengths as IRAS 05436-0011 (Cohen & Schwartz 1987) and with Herschel as HOPS 387 (Furlan et al. 2016). SSV 63 was resolved as a binary source with 10′′ separation by Zealey et al. (1992) and Moneti & Reipurth (1995) and in the radio continuum by Bontemps et al. (1995). Subsequently, Davis et al. (1997) found that SSV 63W is itself a binary with a separation we measure as 1.95′′. Reipurth et al. (2002) found yet another source, SSV 63NE, further to the north-east at 3.6 cm, which was detected at mid-infrared wavelengths by Huelamo et al. (2007). In the same study, Huelamo et al. found a new source at mid-infrared wavelengths, labeled Eb, located about 2.6″ NNW of source E, henceforth Ea. Source Eb was also detected by Tobin et al. (2020) in their large-scale sub-mm and radio continuum survey of Orion protostars.
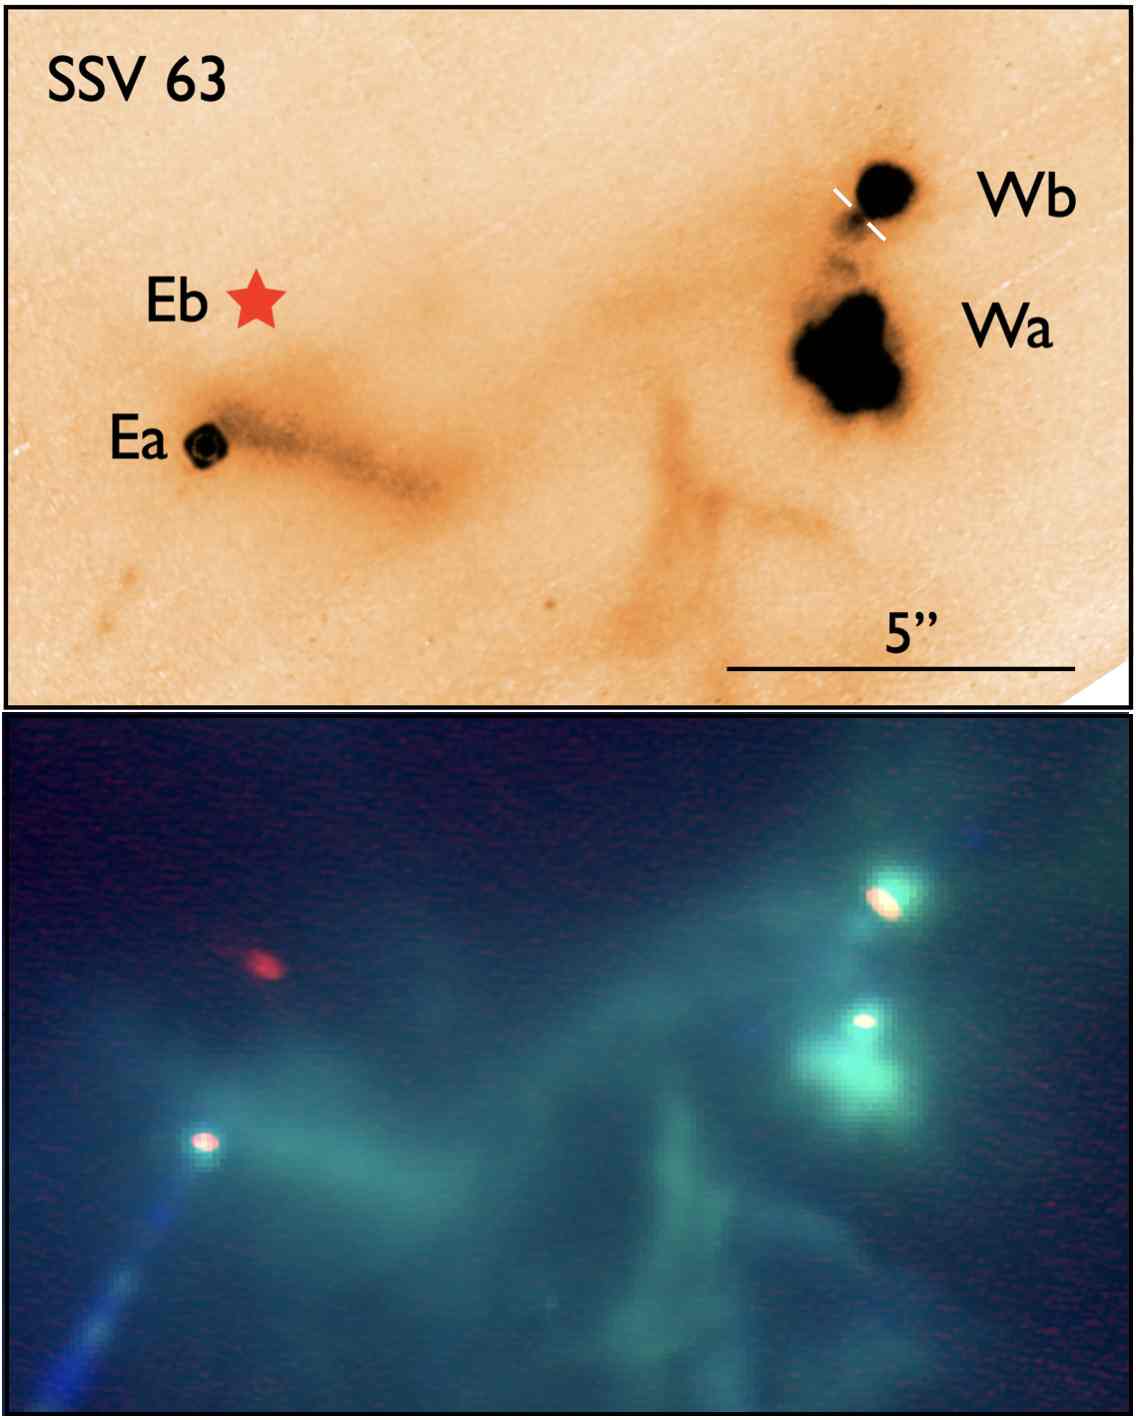
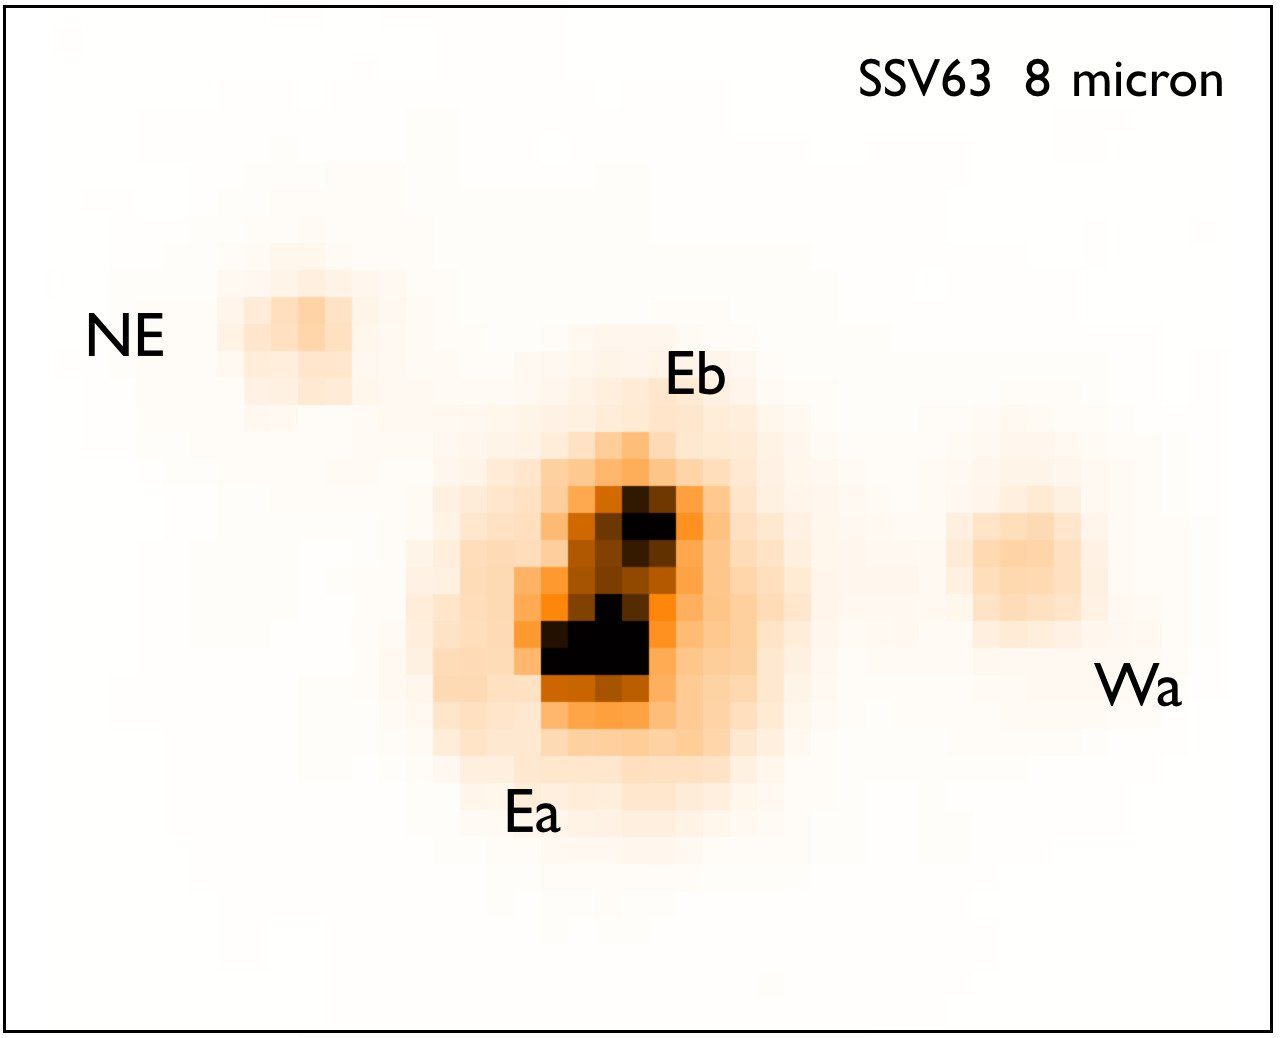
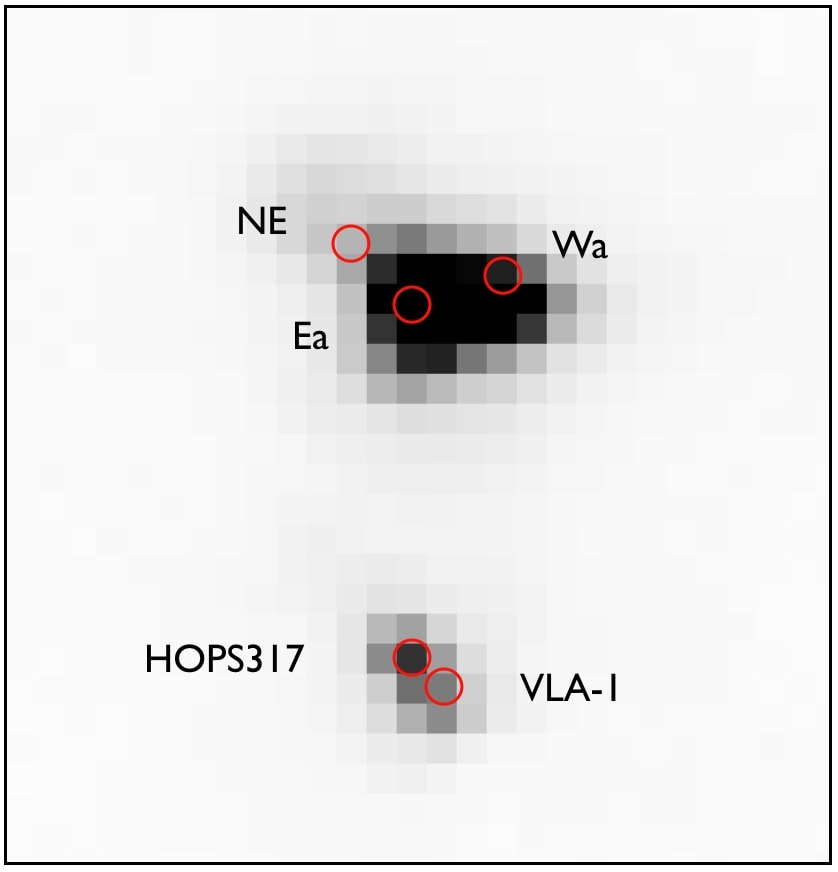
Figure 6 shows an archival H2 image obtained with NICMOS on HST (PI Muzerolle, Program 11205) which demonstrates that SSV 63 is a non-hierarchical quadruple system. Such systems are unstable and will eventually break apart. This is further discussed in Section 7. Source Eb appears prominently in a Spitzer 8 m image where it is well separated from Ea (Figure 7).
Properties of these and other sources are listed in Table 3. Additional photometry with adaptive optics is listed in Table 4.
| Object | J | H | K | W1 | I1 | I2 | W2 | I3 | I4 | W3 | W4 | M1 | ||
|---|---|---|---|---|---|---|---|---|---|---|---|---|---|---|
| 1.25 | 1.65 | 2.2 | 3.4 | 3.6 | 4.5 | 4.6 | 5.8 | 8 | 12 | 22 | 24 | |||
| IRS 1b | 05:46:07.77 | –00:09:38.3 | 13.12 | 12.60 | 11.59 | 11.09 | 10.76 | 9.81 | 8.33 | 4.47 | – | |||
| 0.04 | 0.01 | 0.01 | 0.03 | 0.01 | 0.01 | 0.05 | 0.07 | – | ||||||
| HH24-Wb | 05:46:07.84 | –00:09:59.3 | ||||||||||||
| HH24-Wa | 05:46:07.86 | –00:10:01.2 | 15.20 | 13.46 | 11.94 | 9.32 | 9.93 | 8.60 | 7.52 | 7.63 | 6.62 | 4.45 | 0.73 | 2.12 |
| 0.12 | 0.13 | 0.08 | 0.05 | 0.01 | 0.01 | 0.04 | 0.01 | 0.01 | 0.02 | 0.02 | 0.03 | |||
| HH24-S | 05:46:08.16 | –00:10:05.3 | ||||||||||||
| HH24-Eb | 05:46:08.40 | –00:10:00.6 | ||||||||||||
| HH24-Ea | 05:46:08.49 | –00:10:03.0 | 15.86 | 14.16 | 11.16 | 8.40 | 8.10 | 6.69 | 5.49 | 5.57 | 4.39 | 2.86 | –0.11 | 0.00 |
| – | .12 | .05 | 0.02 | 0.01 | 0.01 | 0.03 | 0.01 | 0.01 | 0.01 | 0.01 | 0.01 | |||
| HOPS 317 | 05:46:08.53 | –00:10:39.1 | 17.79 | 16.79 | 15.13 | 12.80 | 12.31 | 10.65 | 10.20 | 9.39 | 8.31 | 7.19 | 2.57 | 3.59 |
| – | – | .13 | 0.03 | 0.01 | 0.01 | 0.02 | 0.01 | 0.01 | 0.02 | 0.02 | ||||
| HH24-Nc | 05:46:08.46 | –00:09:54.8 | ||||||||||||
| HH24-NE | 05:46:08.92 | –00:09:56.1 | 11.63 | 9.33 | 7.87 | 6.97 | 3.40 | |||||||
| 0.04 | 0.01 | 0.01 | 0.01 | 0.07 | ||||||||||
| HH24-H1 | 05:46:11.34 | –00:07:55.1 | 17.61 | 15.86 | 15.15 | 13.85 | 13.10 | 12.72 | 11.83 | 8.06 | ||||
| .28 | .14 | .15 | 0.01 | 0.01 | 0.03 | 0.04 | 0.06 | |||||||
| HH24-H2 | 05:46:12.27 | –00:08:07.8 | 14.63 | 13.94 | 13.51 | 12.70 | 12.72 | 12.32 | 12.07 | 11.91 | 11.10 | 9.06 | 6.83 | 8.21 |
| .03 | .02 | .04 | 0.03 | 0.01 | 0.01 | 0.03 | 0.02 | 0.02 | 0.05 | 0.02 | 0.07 | |||
| HH24-H3 | 05:46:12.99 | –00:08:14.8 | 16.55 | 15.63 | 14.98 | 14.45 | 14.32 | 13.59 | 13.63 | 12.73 | 10.90 | 8.83 | 6.35 | 6.32 |
| .11 | .11 | .12 | 0.04 | 0.01 | 0.01 | 0.05 | 0.03 | 0.02 | 0.04 | 0.13 | 0.02 | |||
| HH24-H4 | 05:46:13.17 | –00:09:10.0 | 16.34 | 15.39 | 15.34 | 15.09 | 14.74 | 12.36 | 7.81 | |||||
| .10 | .09 | .16 | 0.04 | 0.06 | – | – | ||||||||
| IRS 2 | 05:46:13.47 | –00:08:56.2 | 18.68 | 15.95 | 13.54 | 12.25 | 11.71 | 11.04 | 10.94 | 10.55 | 9.53 | 8.49 | 6.00 | 5.72 |
| – | .15 | .04 | 0.02 | 0.01 | 0.01 | 0.02 | 0.01 | 0.01 | 0.03 | 0.06 | 0.02 | |||
| HH24-H5 | 05:46:13.58 | –00:10:34.0 | 16.66 | 16.08 | 15.69 | 15.09 | 14.88 | 12.38 | 8.86 | |||||
| .13 | .20 | .23 | 0.04 | 0.07 | – | – |
Note. — a Coordinates for HH24-Ea, -Wa, -NE, and MMS-VLA1 are 3.6 cm VLA astrometry from Reipurth et al. (2002), for HH24-N from ALMA (this paper), for MMS-HOPS317 from 2MASS, for IRS 1 from WISE, for IRS 2 from Spitzer I1-image, for SSV63-Eb from Spitzer I4-image, and for the rest they are from 2MASS. The Spitzer photometry is from Megeath et al. (2012). Note that a few sources that are close to brighter sources or surrounded by bright reflection nebulae can be seen in Spitzer images, but meaningful photometry cannot be extracted. b IRS 2 is not in the 2MASS catalog, even though it is optically visible, presumably due to confusion from its proximity to the knots in the C-jet. c HH24-N is a submm source only detected by ALMA.
| Star | Ks | L’ | |
|---|---|---|---|
| Wb | 16.5 | 12.340.04 | |
| Wa | 12.790.03 | 9.640.03 | |
| Eb | 16.5 | 9.190.03 | |
| Ea | 12.700.03 | 8.320.03 | |
| S | 16.160.22 | 13.670.06 | |
| NE | 16.5 | 11.210.03 |
Note. — These adaptive optics data from the ESO archive were obtained with NACO at the ESO VLT.
5.1 Near-IR Imaging and Spectroscopy
None of the three sources Wa, Wb, and Ea are visible at optical wavelengths, and at near-infrared wavelengths the dominant source is Wa. At longer wavelengths, the Ea and Eb sources are dominant. From their energy distributions, all the five main components of SSV 63 are likely Class I sources as determined by Furlan et al. (2016), who used near-, mid-, and far-infrared data to study the sources (under the designations HOPS 386 and HOPS 387). We note that Eb is highly obscured and detectable only at mid-infrared and longer wavelengths, so it is likely a borderline Class 0 source.
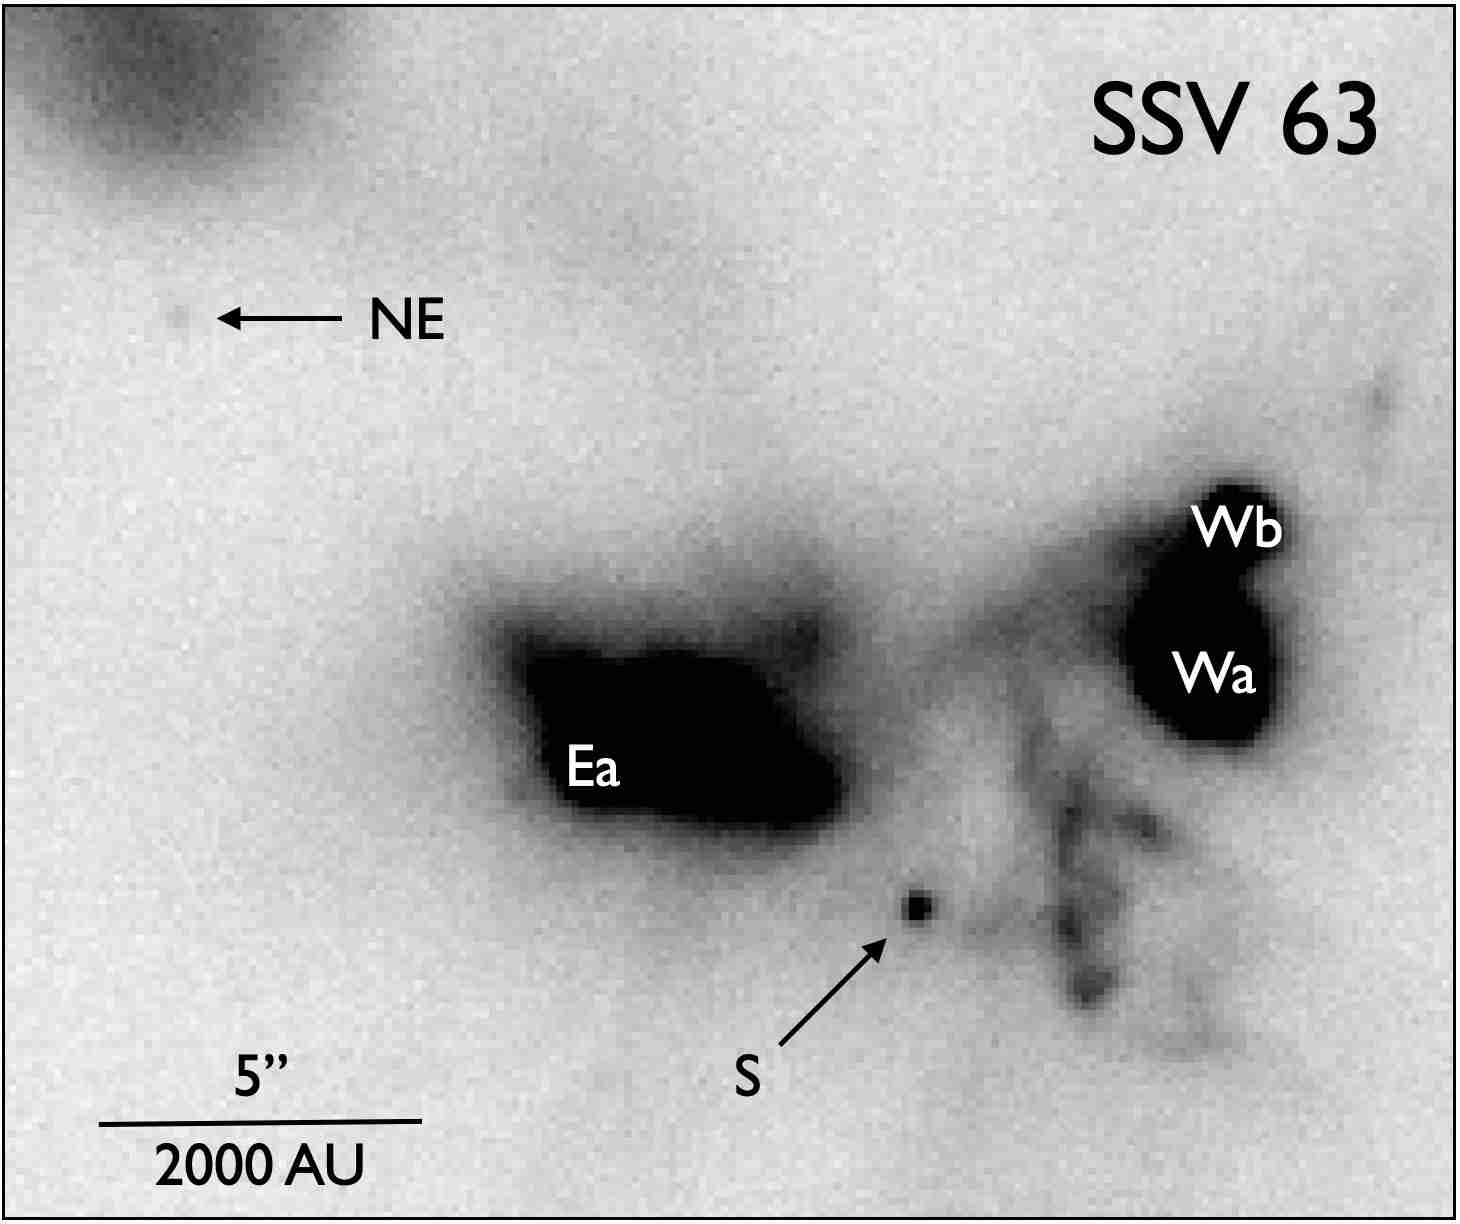
One additional source is found in the region on a deep K-band image from the Gemini-N 8m telescope. Figure 8 shows this image, with the new very faint source, marked S, identified. The source is midway between and slightly to the south of the prominent Wa and Ea sources. It is faint, with K16.2, and it is not detected at shorter wavelengths, most likely due to extinction. In the L’-band it is much brighter, L13.7, see Table 4. Since the source is not seen in Spitzer images it is unlikely to be as luminous as the other sources, nor to be a background red giant. Given its location towards a dense cloud core, we assume that the source is a deeply embedded very low-mass star or brown dwarf.
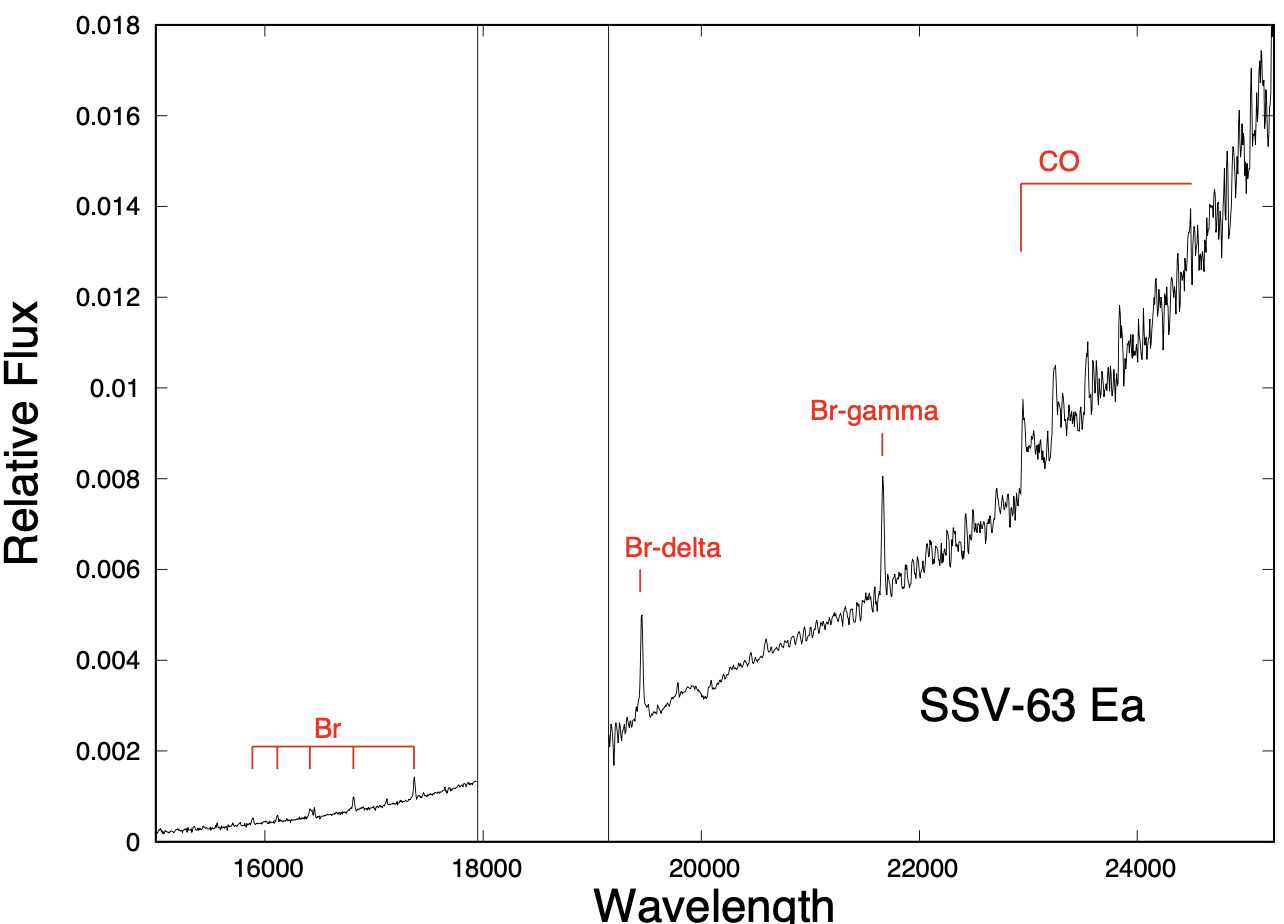
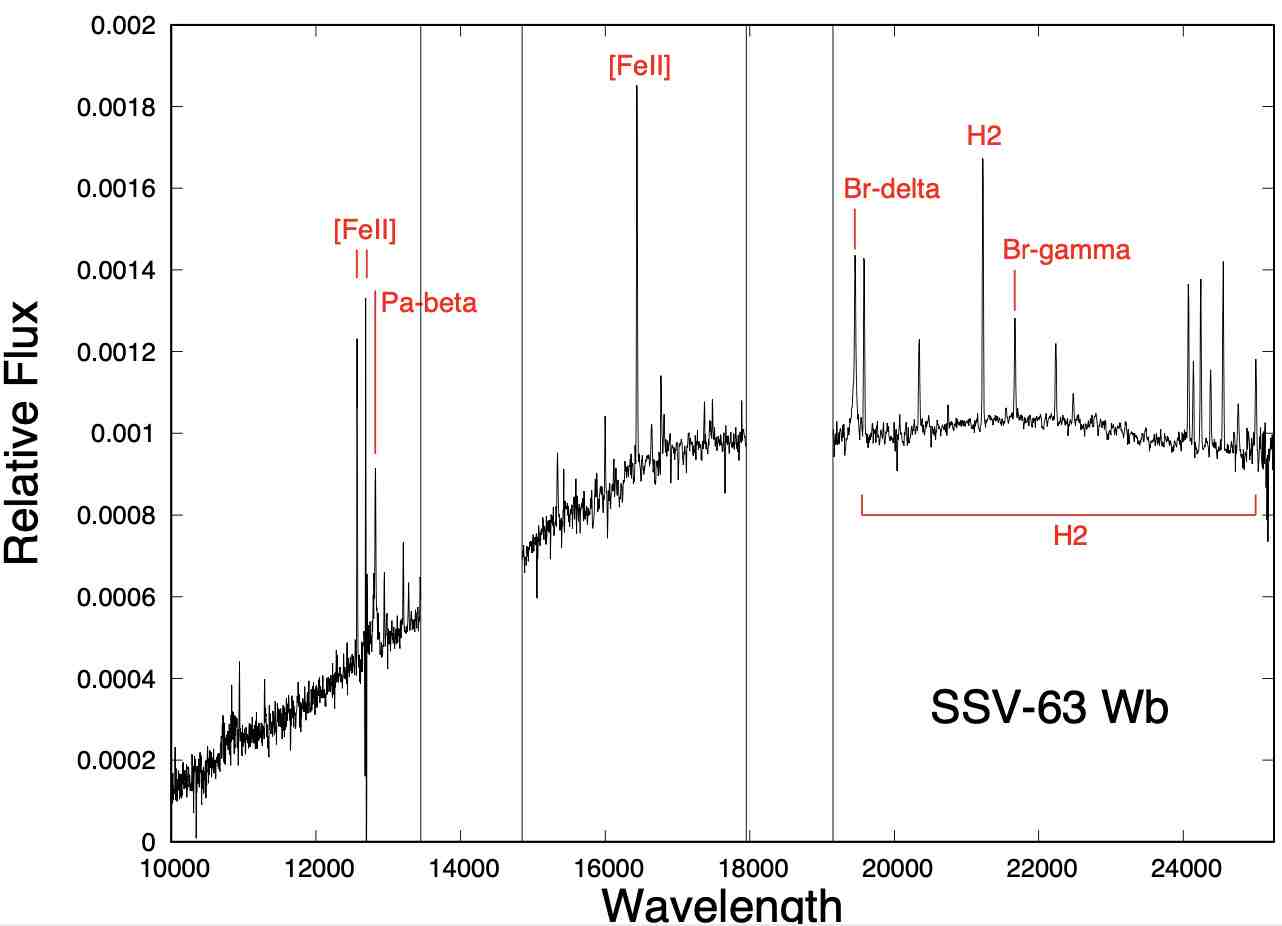
Figure 9 shows the Gemini/GNIRS spectra of SSV 63 Ea and Wb. Source Ea shows a steeply rising continuum devoid of absorption lines with the CO bands as well as the Bracket hydrogen series in emission. In contrast, source Wb is much less reddened but sufficiently veiled to wash out absorption features. Its spectrum displays prominently a forest of molecular and atomic lines, as well as lines of [Feii], indicative of a shocked outflow. A planned spectrum of Wa was weathered out, but Simon et al. (2004) have presented a K-band spectrum of this source which shows a red continuum with a prominent Br emission line and some weaker H2 lines.
5.2 Spitzer Imaging
Spitzer observed the L1630 cloud and Megeath et al. (2012) compiled a catalog of all young stellar objects in the region. SSV 63 Wa, Ea, and NE are detected in all bands, whereas Wb is only weakly seen at 3.6 m. As mentioned earlier, the Spitzer images reveal a new source, SSV 63 Eb, located just 2.8 arcsec (1100 AU) NNW of what is now labeled Ea. At 3.6 m, Eb is seen as an extension to Ea, increasing in brightness at longer wavelengths, and at 8 m it is nearly as bright as Ea. At 24 m the pair is blended, but it appears that Eb has become the dominant source.
5.3 VLA Observations
SSV 63 was detected in the 6 cm radio continuum by Bieging et al. (1984) and at 3.6 cm by Bontemps et al. (1995), who resolved the SSV 63 E-W binary. Reipurth et al. (2002) carried out a 3.6 cm study in the A-configuration which detected a new source, labeled SSV 63 NE. Most recently, Tobin et al. (2020) observed the SSV 63 region as part of the large VANDAM protostellar survey.444Tobin et al. (2020) use the following nomenclature for the 5 main sources in SSV 63: Ea = HOPS 386A, Eb = HOPS 386B, NE = HOPS 386C, Wb = HOPS 387A, Wa = HOPS 387B.
| X Banda | Q bandb | Spectral | |||||
|---|---|---|---|---|---|---|---|
| Source | S(Jy)d | S(Jy)d | Index | ||||
| Wb | 516 | 157860 | 2.30.1 | ||||
| Wa | 11911 | 37660 | 0.80.1 | ||||
| Ea | 2039 | 118190 | 1.20.1 | ||||
| Eb | 152 | … | … | 50 | 0.8 | ||
| NE | 836 | 31580 | 0.90.2 | ||||
| HH 24 MMS | 14115 | 10750120 | 2.90.1 | ||||
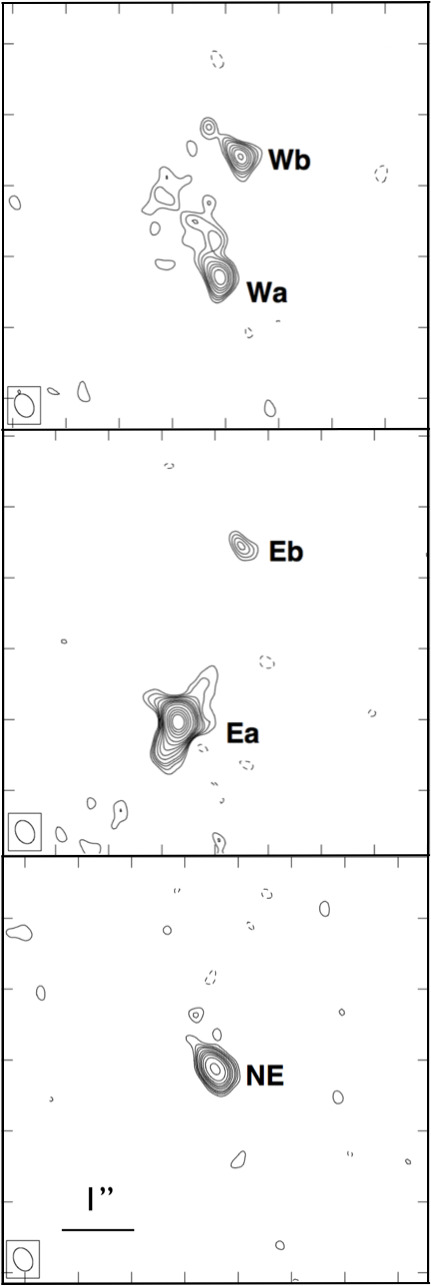
We have carried out a deep high-resolution study of SSV 63 with the JVLA in the X-band (3 cm, see Section 2 for details of the observations). The five dominant sources in the SSV 63 multiple system, Ea, Eb, Wa, Wb, and NE, are detected, and Table 5 lists the VLA coordinates and total flux density for each YSO. Source Ea is by far the brightest in the radio continuum. Extended structure is seen around the sources, see Figure 10. Noteworthy is what appears to be a faint companion to Wb at a separation of 0.6 arcsec and a position angle of 43∘ ( = 5:46:07.866, = –00:09:59.18). However, more observations are needed to confirm its stellar nature. Source Wa exhibits what appears to be an almost 2 arcsec long wiggling outflow towards the NNE. Alternatively the extended emission may be thermal emission from a ridge of dust. Source Ea displays a prominent bipolar radio continuum jet along the axis of jet E, with evidence for another weaker outflow perpendicular to the first, suggesting that source Ea is a close binary. A similar quadrupolar structure is seen around the prominent jet source HH 111 VLA-1 (Reipurth et al. 1999). There is also a weak extension from Source NE towards the HH 24 G flow, although it should be noted that the source extension in that direction almost coincides with the direction of the slightly elongated beam profile. Perhaps the more surprising result is that source Eb, which is so prominent in the mid-infrared, is the weakest of the sources.
5.4 ALMA Observations
We have observed the SSV 63 multiple system with ALMA in the 1.3 mm continuum, see Section 3. The sources Ea, Eb, Wa, Wb, and NE were all detected, and additionally a new source, here labeled N, was detected. Source S discussed in Section 5.1 was not detected. The ALMA observations of these sources are discussed in detail in Section 10.
5.5 X-ray Observations
SSV 63 has been observed several times at X-ray wavelengths. Ozawa et al. (1999) obtained a 30 ks exposure with ASCA, but were not able to fully resolve SSV 63 from the bright X-ray source SSV 61 (HBC 502) to the south (see Figure 2). Simon et al. (2004) used Chandra to resolve SSV 63 into Ea, Wa, and NE. The companion Wb was not detected. All three components have hard X-ray spectral indices. Spectral modeling of the brightest X-ray source, Wa, suggested a visible extinction of roughly 48 mag. However, they found that the depth of the 3.08 m ice band indicated only 10-20 mag of extinction. Principe et al (2014) did a very deep X-ray study of the L1630 region and also detected these three sources. In none of these X-ray studies was HH 24 MMS detected.
5.6 Reflection Nebulae
The HH 24 complex contains several bright reflection nebulae. The early polarization studies by Strom et al. (1974b), Schmidt & Miller (1979) and Scarrott et al. (1987) demonstrated that the source of illumination is associated with SSV 63, but the angular resolution was too low to identify any specific source. The principal reflection nebulosity, labeled knot D by Herbig (1974), is seen towards the base of the G-jet, see e.g., Figure 2. It is likely, at least in part, to originate from the NE source, which is obscured by a dense core of gas and dust (Figure 4). This is corroborated by comparing the optical H and [Sii] images with an infrared image, see Section 6.4.
These reflection nebulae are variable, as can be seen when comparing images from the two epochs of HST observations (Figure 11). Such variability of reflection nebulosity around a young star was first seen by Hubble (1917) and Knox-Shaw (1917) and can be caused by light escaping from a partly embedded source (e.g., Reipurth & Bally 1986, Dahm & Hillenbrand 2017). Such variations are shadowing effects from material moving close to the illuminating star (Graham & Phillips 1987). Additional compact reflection nebulae are located around the sources Ea/b and Wa/b (Figure 8).
5.7 Association of Jets and Sources
As discussed above, there are at least five sources in the SSV 63 multiple system, and together with source S and the additional companions suggested by the VLA observations as well as yet another component (source N) detected by ALMA (see Section 10), the system contains at least 7 components. We here attempt to sort out the connection between the multiple jets and the individual sources.
The most eye-catching of the many jets in HH 24 is the E/C pair. Jet E is evidently launched by source Ea, as clearly seen in the HST and VLA images (Figures 4 and 10). Jet C lies within just a few degrees of a line through jet E, and it is blueshifted whereas jet E is redshifted, and hence it would be reasonable to assume that they form one bipolar pair. However, the two jets have rather different morphologies, with jet E being perfectly collimated whereas jet C has an irregular and wobbling appearance. Also, with the discovery of the embedded source Eb on the line connecting jets E and C, there is a potential different source to drive jet C. However, our ALMA observations (Section 11) show that there is almost no high-velocity emission associated with Eb, and the little there is forms a stubby bipolar outflow along an axis inclined by roughly 20∘ to the axis of jet E. Moreover, the southeastern lobe of this microflow is blueshifted and the northwestern is redshifted, opposite to that of jets E and C. We conclude that source Eb is not related to the C-jet. This leaves open the question of why the E and C jets have such different morphologies. One possibility is that the C jet is forcing its way through the dense core in which the two sources Ea and Eb have formed, and through internal deflections in the core is losing an initial high collimation.
Jet G has an unusual structure, as discussed in Section 6.4. Despite its morphology it does have a well defined axis, and SSV63 NE lies precisely along this axis. Our VLA observations show that the source is elongated along this axis.
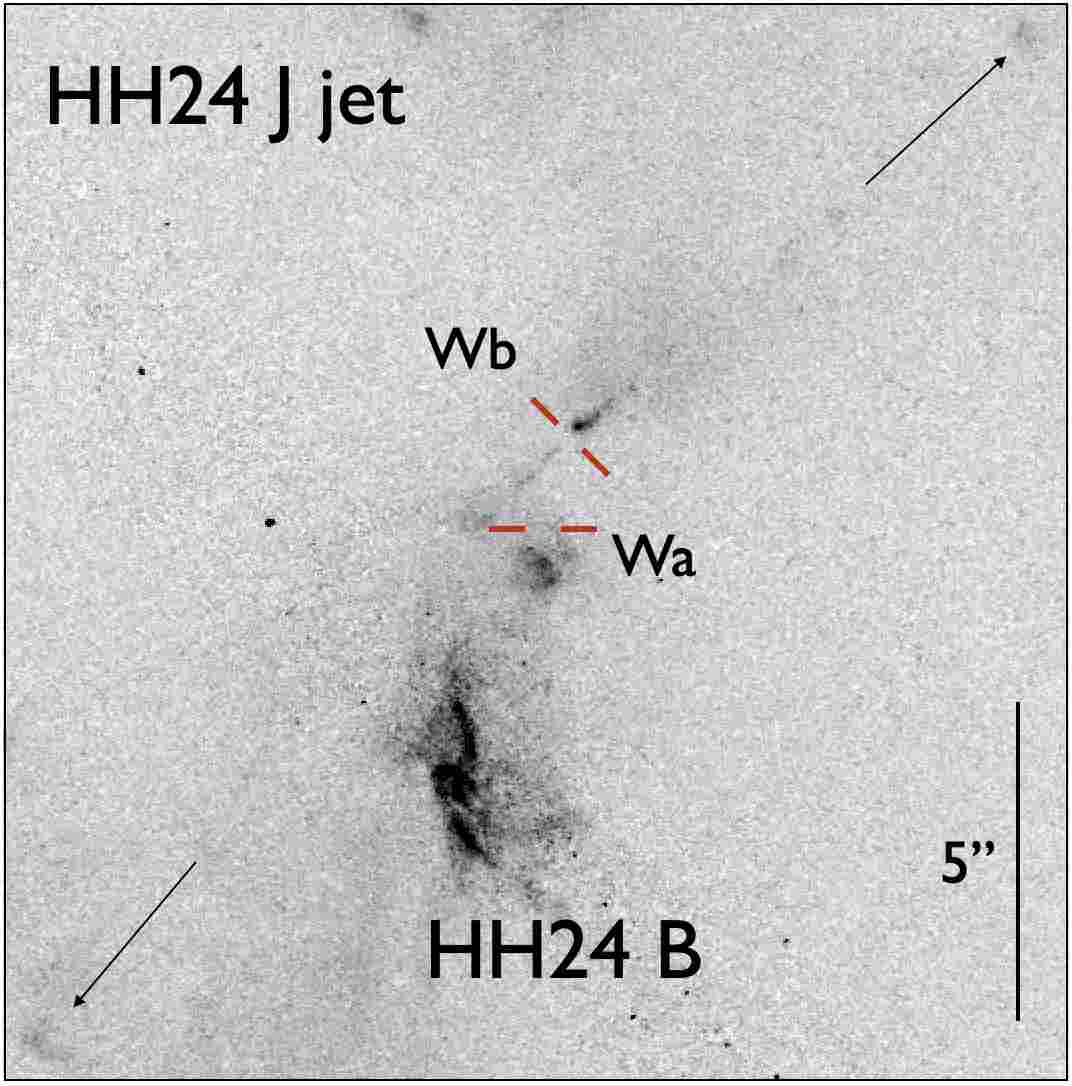
Jet J consists of a series of [Sii]-dominated knots located on a very well defined line that passes directly through the Wb source, which is likely the driving source. This alignment shows that jet J is not driven by the nearby bright source Wa. VLA observations suggest that Wb may be a binary with 0.6′′ separation, and either of the two sources could be driving the jet. There is a bit of emission just to the SE of Wb, the rest of the jet is only seen in the NW lobe. HH 19 is a distant bow shock driven by source Wb (Section 6.6). Figure 12 shows the inner region of jet J around the driving source. The precise location of the source derived from ALMA data reveals that the optical knot is not the driving source, but a compact reflection nebula mixed with shocked emission (see also Figure 6).
Jet X is an inconspicuous slightly wobbly chain of faint [Sii]-dominant knots (Figure 3). It points directly away from the very faint source S, which is likely a brown dwarf seen through significant extinction (see Section 5.1). An increasing number of outflows have been found from very young brown dwarfs, e.g., Riaz et al. (2017), Riaz & Bally (2021).
Jet L is not driven by any of the sources in the SSV 63 multiple system, but by the nearby source HOPS 317 or by the embedded Class 0 source HH 24 MMS further to the south. This is discussed in detail in Section 7.
In summary, the SSV 63 multiple system is found to consist of at least 7 sources: Ea, Eb, Wa, Wb, NE, S, and N within an ellipse of roughly 10″ 20″(4000 AU 8000 AU). Additionally the VLA observations suggest that Ea is an unresolved binary driving a quadrupolar jet, and Wb appears to have a faint companion. These sources are likely Class I sources, but the lack of near-infrared emission and X-ray emission from Eb and Wb suggest that they could be Class 0 sources. However, blending at longer wavelengths precludes a more precise classification. The very low luminosity of sources S and N suggest that they may be very low-mass stars or brown dwarfs.
6 INDIVIDUAL JETS AND SHOCKS
6.1 HH 24 Jet E
As is evident in Figure 4, jet E is the most prominent of the multiple jets in the HH 24 complex, and is remarkable for its highly collimated appearance. It is very weak in H and strong in [Sii], indicating a series of very weak shocks. The near-infrared [Feii] and H2 images at the Gemini-N telescope reveal that jet E is very bright in [Feii]. In contrast, jet E is not emitting in H2.
6.1.1 Structure and Excitation
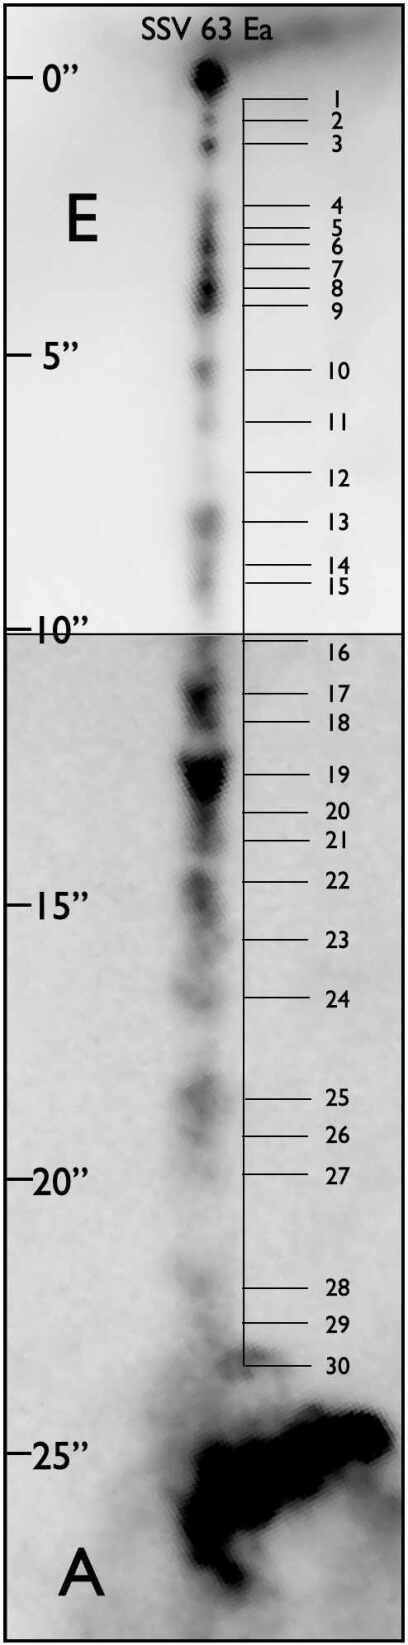
The perfect collimation of jet E is seen well in the new HST images, and is particularly evident in the [Feii] image in Figure 13. However, beyond the large shock A, the jet slightly shifts course towards the southeast, as if it was deflected by an angle of 5∘. The nature of shock A is further discussed in Section 6.2.
Figure 5 shows that the E-jet has a different appearance in the three filters transmitting H, [Sii], and [Feii]. Since H and [Sii] have similar wavelengths, they are affected similarly by extinction. Hence the ratio between the two relates to intrinsic properties of the shocks. H is much weaker, and it follows that jet E is a very low-excitation flow, and hence has low-velocity shocks. In contrast, the [Feii]/[Sii] ratio is heavily affected by extinction. Because the [Feii] 1.64 m and [Sii] 0.67 m lines have similar energies of 1.7 and 1.8 eV above ground, and Fei and Si atoms have comparable ionization potentials of 7.87 and 10.36 eV, respectively, it follows that the intensity ratio of the two transitions is a good indicator of extinction. Whereas jet E can be traced all the way to the source in [Feii], the first knot that is (barely) visible in the [Sii] image is E6. In projection this is 1000 AU from source Ea. But there is still some extinction out to a projected distance of about 3000 AU from Ea. From the bright knot E13 and outwards, the [Feii]/[Sii] ratio is essentially constant, indicating that the jet has broken out of the cloud core. This situation is very similar to the case of the HH 1 jet, which undergoes two abrupt steps in extinction at 1400 and 3000 AU (Reipurth et al. 2000). We discuss the cloud core in more detail in Section 11, and interpret the [Feii]/[Sii] ratio in Section 11.5.
6.1.2 Proper Motions and Radial Velocities
Our two HST images of the HH 24 complex in the [Feii] 1.644 m line are separated by 744 days. As is evident in Figure 11 the motion of the jets is readily visible, allowing us to measure the proper motions of the shocked outflows. We have used a code that convolves the images with wavelet functions of chosen width, see Raga et al. (2016b) for details. Jet E shows pronounced motion, as illustrated in Figure 14. The slight deviations of some vectors from the well defined direction of the jet are likely due to slight changes in the structure of the knots. Especially near the source, such deviations can have significant impact on the angles. The mean tangential velocity of the knots between the source and HH 24A is about 250 km s-1. This is comparable to other HH jets, e.g., the HH 1 jet has a proper motion of 280 km s-1 (Bally et al. 2002) and the HH 34 jet 190 km s-1 (Reipurth et al. 2002a).
In our medium-resolution spectroscopy of jet E with the Apache Point 3.5m telescope, the [Sii] 6717/6731 lines are the brightest and have heliocentric velocities from about +170 to 200 km s-1 with a peak around +170 to 180 km s-1. If the bulk radial motion is about +175 km s-1, and we adopt a proper motion of 250 km s-1, then it follows that jet E moves away from the observer at an angle of roughly 35∘ to the plane of the sky with a total space velocity of 300 km s-1.
6.1.3 Ejection Variability
The [Feii] emission along the HH 24E jet is divided into three main groups of peaks: one at distances , the second and the third from the outflow source. Figure 13 provides a detailed view of the jet, with individual knots numbered.
Selecting the points of highest intensity within each of the three groups, we obtain a mean separation between the groups of knots . Together with a mean proper motion velocity km s-1, this gives a timescale yr.
Similarly, if we take all of the intensity peaks in the top frame of Figure 13, we obtain a mean knot separation , which for km s-1 gives a timescale yr.
Conceivably, and could correspond to two modes of a quasi-periodic, time-dependent ejection variability. Also, the ejections could be non-periodic with a characteristic timescale of yr (corresponding to the timescale deduced including the fainter intensity peaks along the jet, see above), and with the brighter knots corresponding to mergers of the fainter knots. There is at least partial evidence that such knot mergers occur in the HH 34 jet (see Raga & Noriega-Crespo 2013), for which more detailed observations have been made.
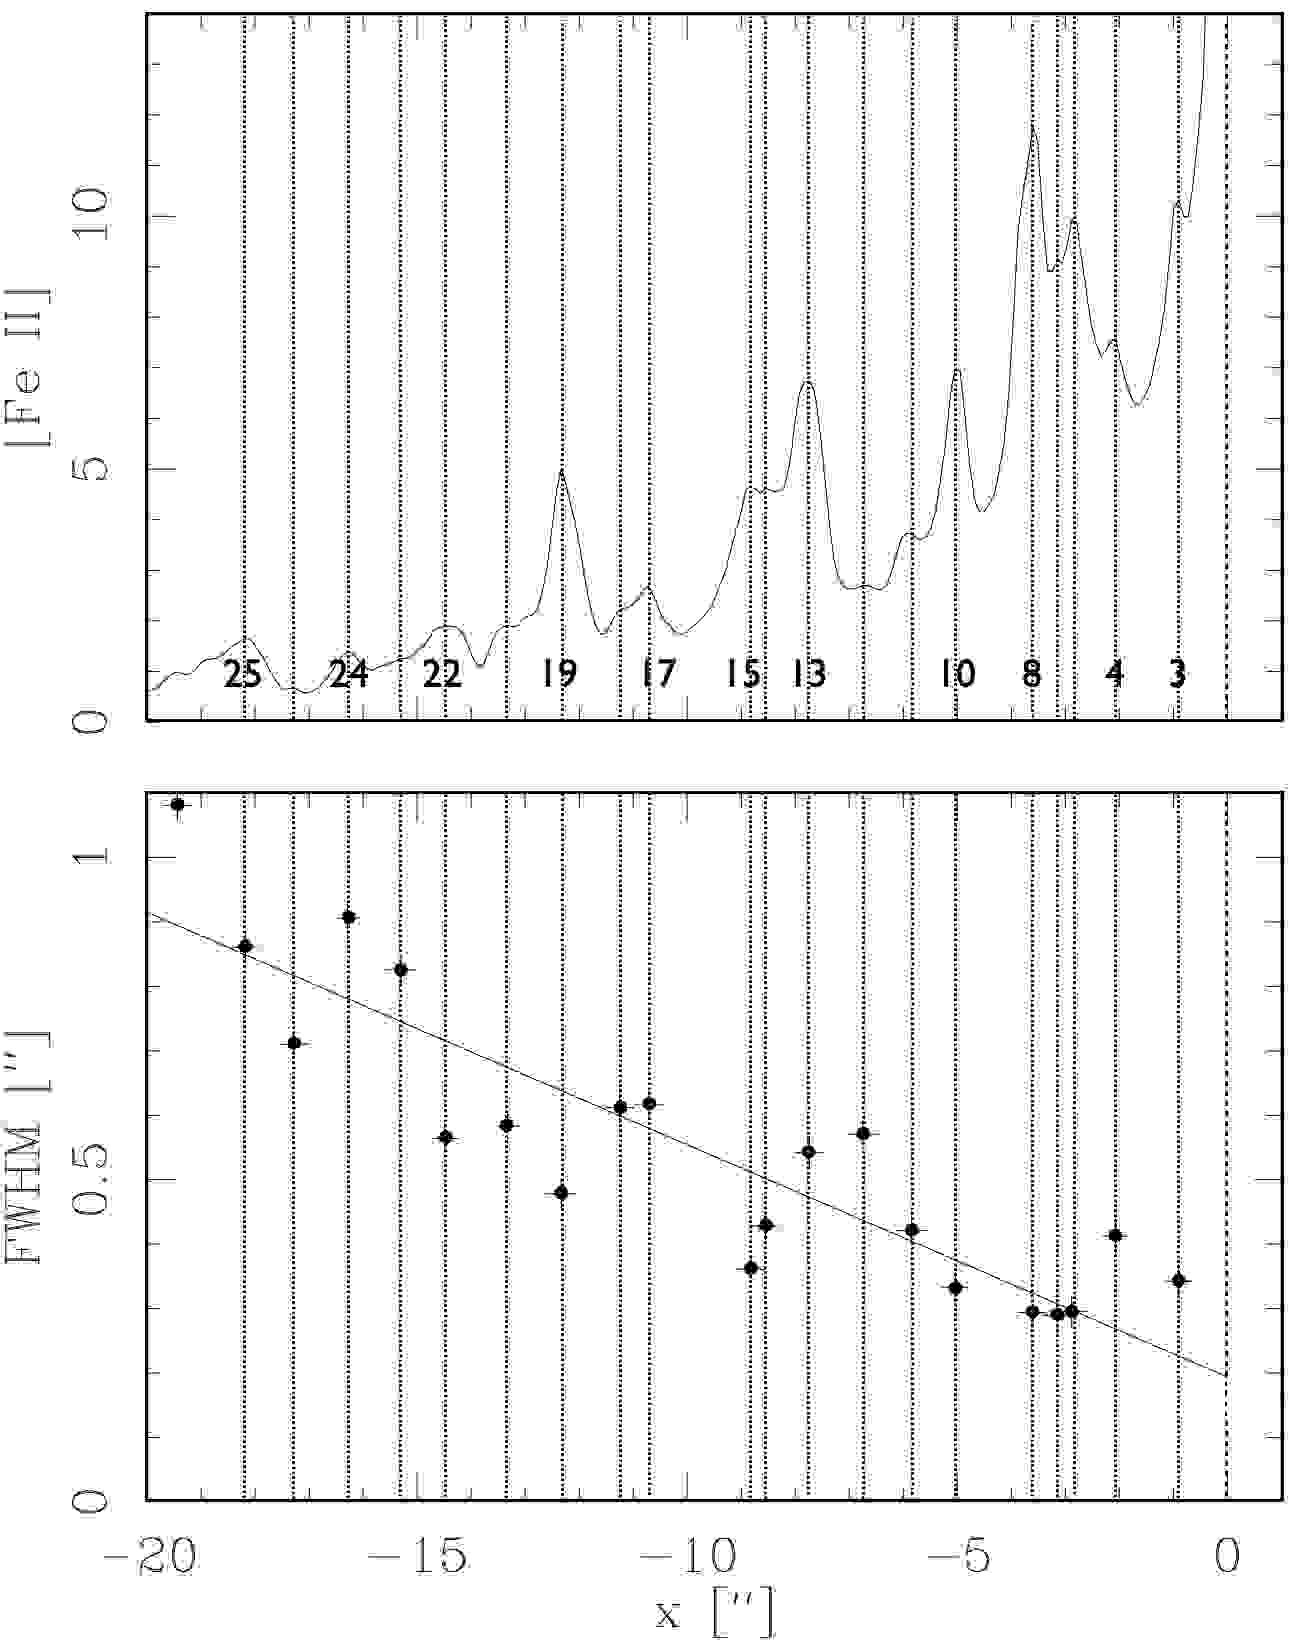
6.1.4 Jet Expansion
It has been found in several well collimated HH jets that the knots widen as they move away from the source, e.g., the HH 1 and HH 34 jets (Reipurth et al. 2000, 2002a). It is clear from Figure 13 that this is also the case for the HH 24E jet. The knots are well resolved in the HST images, and Figure 15 shows a gradual expansion of 0.7 arcsec in total width along the first 20 arcsec until it enters the complex region around the bright knot A. This corresponds to a full opening angle of the jet of 2.6∘, which is comparable to the opening angles measured for other jets (e.g., Erkal et al. 2021). A jet velocity of 300 km s-1 implies that a half-angle of 1.3° corresponds to knots spreading orthogonally to the jet axis with a velocity of 7 km s-1, comparable to the sound speed expected in the post-shock cooling layers where [Sii] emission originates. If the plasma is fully ionized ( 0.6), the temperature of this region is about 3,500 K. For mostly neutral gas ( 1.3) the temperature is 8000 K.
6.2 The HH 24A Shock
The two jets HH 24E and C are located in the interior of a pair of low-extinction cavities, north and south of the SSV 63 core, that are rendered visible in the near-infrared by scattered light (Figure 4). These cavities may have been excavated by the long-term action of the SSV 63 jets and outflows. Two pillars facing the SSV 63 region are located along the south wall of the southern cavity. The HH 24A shock is located 25″ (10,000 AU) south of SSV 63 Ea and about 2″ south of the tip of the largest pillar in the cloud wall at the southern end of jet E. It is the brightest shock in the HH 24 complex, and has long been assumed to be a working surface for the HH 24E jet, possibly interacting with the cloud.
Spectra of the brightest part of the HH 24A shock show peak velocities ranging from +30 to +40 km s-1, much less than the radial velocity of the HH 24E jet, and thus supporting the above picture that HH 24A is a shock driven into a stationary cloud. The [Sii] 6717/6731 ratio is 0.68, indicating an electron density of 2400 cm-3 for a temperature of 10,000 K (or 1800 at 5,000 K). Jones et al. (1987) present low-resolution spectra in which [Oiii] is detected, thus showing that at least some part of HH 24A has a high excitation, very different from the very low excitation of the HH 24E jet.
Jet E disappears at the pillar tip near the HH 24A shock, but re-appears about 8″ farther south, bent towards the east by about 5°. One possible interpretation is that jet E impacts the back-side of the pillar, and is deflected towards the east by the interaction.555It should be noted that the little jet X associated with source S (see Section 5.7) is pointing straight towards the deflected part of the HH 24E jet so, at least in principle, it cannot be excluded that this deflected part of the jet could have an origin different from source Ea. At right angles to jet E, HH 24A extends about 2″ farther west than the western edge of the jet (Figure 16-top). Figure 16-bottom shows an HST H-[Sii] difference image of HH 24A, which reveals a two-shock structure of the main body of HH 24A, with an H-strong part facing north and a southern side that is [Sii]-bright.
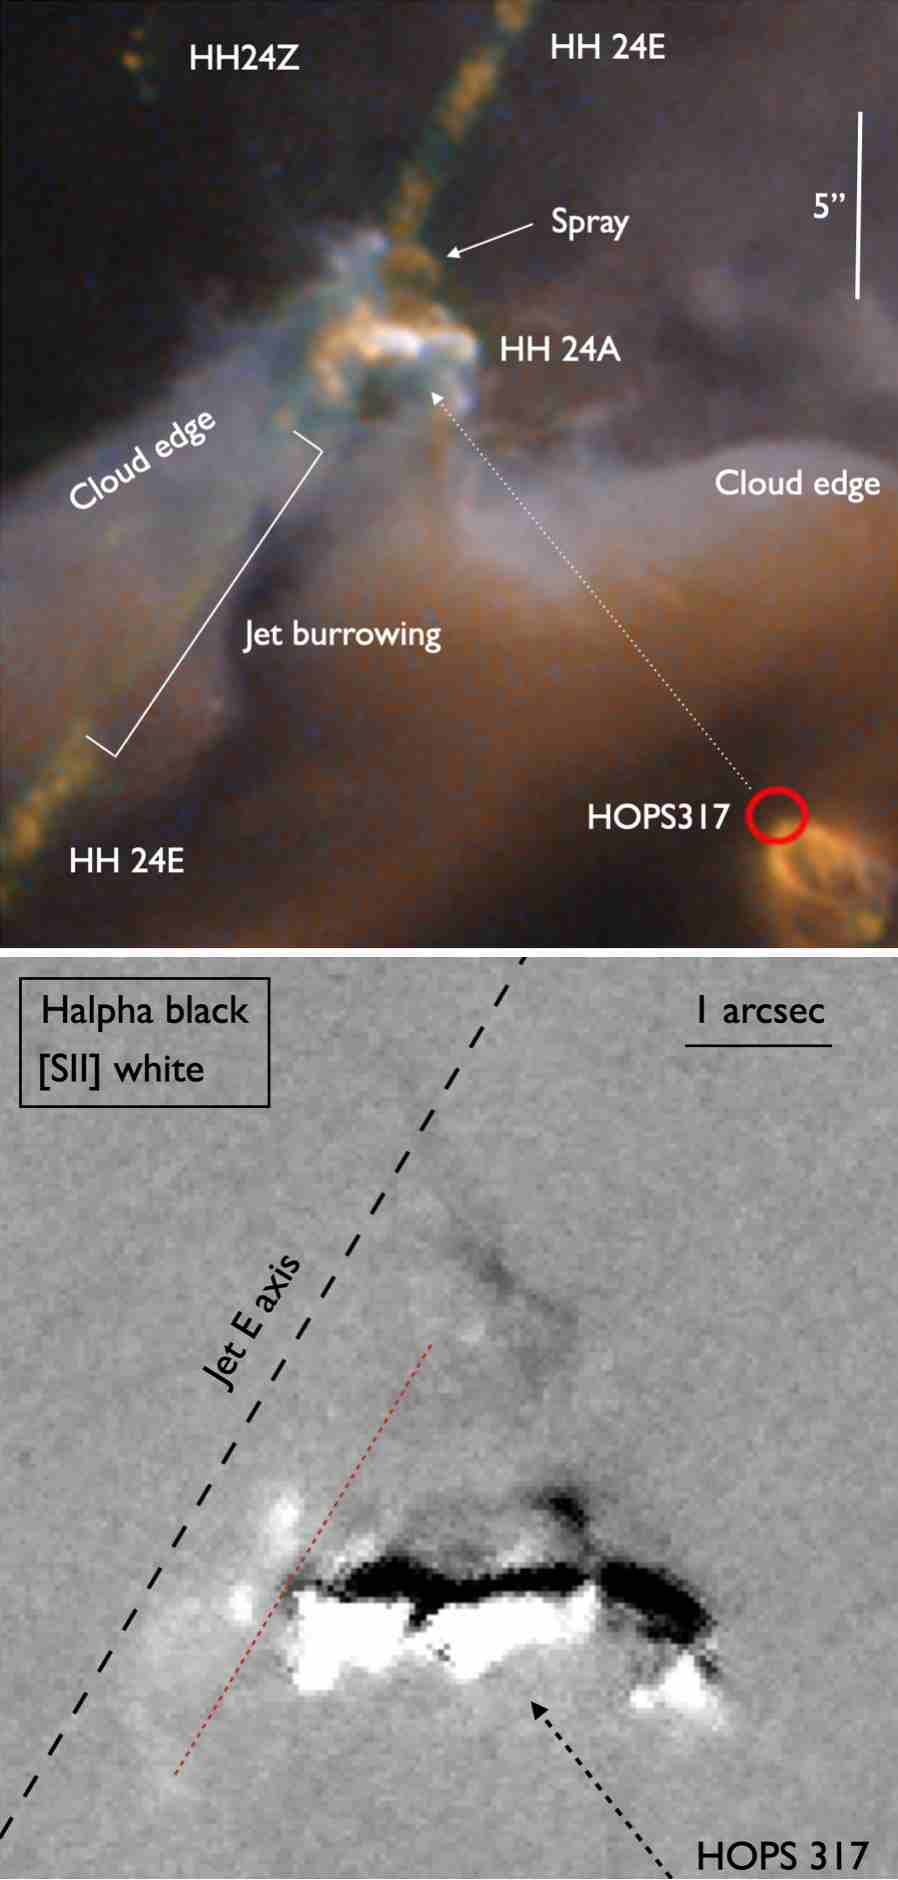
HH 24A is located only about 22′′ from the Class 0 source HH 24 MMS (see Section 7), and Bontemps et al. (1996) suggested that HH 24A may be a separate shock from a flow originating in this embedded source. HH 24 MMS is located just outside the lower right corner of Figure 16-top. That image shows a conical outflow cavity of another source, the Class 0 source HOPS 317, which is located even closer, only 17, to HH 24A. This reflection nebula is opening up towards the southwest, suggesting that the blueshifted lobe of outflow L is located southwest of this YSO. HH 24A, which is redshifted, is located along the expected counterflow direction of outflow L. A line from HOPS 317 to HH 24A is aligned with the outflow cavity of HOPS 317 as well as the molecular hydrogen outflow (HH 24L) extending SW from HOPS 317 (see Section 7). Figure 17 shows that this lobe of the L-counterflow also contains shock-excited 2.12 m H2 emission connecting HOPS 317 to HH 24A. In addition, to the NE of HH 24A a new faint shock, here called HH 24Z, is found (Figure 16-top), which could be part of the outflow driven by HOPS 317. It thus appears, on morphological grounds, that HH 24A might be a bow shock powered by HOPS 317.
Ideally, proper motions should resolve the issue of the origin of the HH 24A bow shock. Unfortunately, the 2-yr time interval between our two epochs of [Feii] HST images are not sufficient to show any motion reliably, but adding an archival wideband image including the [Feii] 1.64 m line does show some rather slow motions.
Figure 16-bottom shows two areas of HH 24A separated by a red dashed line. The [SII]-bright knots to the left of the line have motions towards the SSE with about 40-50 km s-1, roughly along the direction defined by jet E. They are slightly displaced from the axis of jet E, either because the jet has been disturbed by burrowing through the cloud, similar to jet C, or they may be shocks from a wider angle wind interacting with a flow cavity.
The central part of HH 24A to the right of the red line is essentially stationary, indicating that the shock is ramming into the cloud. The western wing may have a slow tangential motion of 20-3015 km s-1 approximately due west. HH 24A shows a classical two-shock structure, with an H-strong and a [Sii]-strong component. The dashed arrow shows the direction from the HOPS 317 source.
The data available do not allow a definite conclusion on the origin of HH 24A, it could originate from either source Ea or HOPS 317. If the gentle westward motion of the wesstern wing is real it would in both cases represent gas squirting sideways along the wing of the bow shock. If the bright part of the HH 24A shock comes from HOPS 317 then both flows from Ea and HOPS 317 interact with the pillar, but not necessarily with each other. The high-surface brightness of HH 24A and detection of [Oiii] suggests that it is interacting with the front side of the pillar while the cloud interaction with jet E occurs mainly within or on the back side of the pillar.
6.3 HH 24 Jet C
6.3.1 Structure and Excitation
Figure 18 shows the detailed structure of jet C as seen in the HST [Feii] image. Although it appears to be a counter-jet to jet E, it does not share the perfect collimation of jet E. Another puzzling fact is that while jet E can be traced directly back to the source even though it is red-shifted, in contrast jet C only becomes visible (in the 1.644 m [Feii] line) about 8.5 arcsec north of the source Ea (see below).
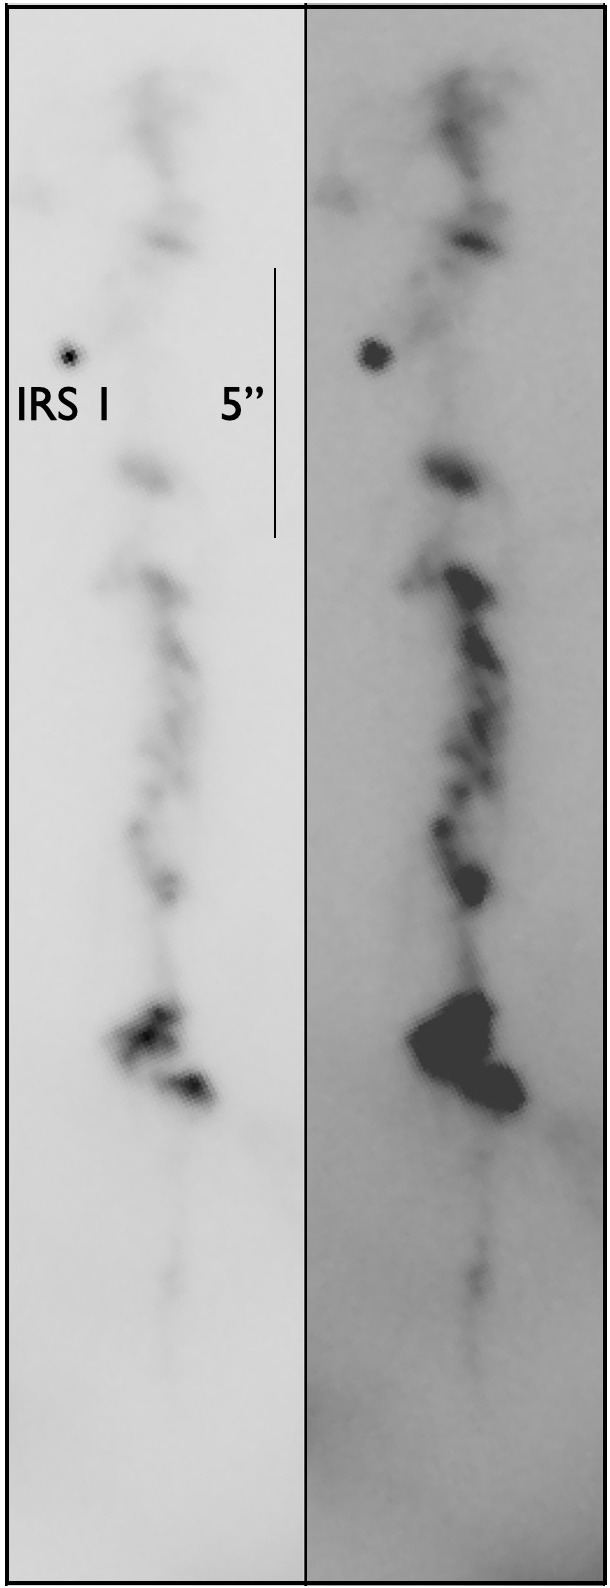
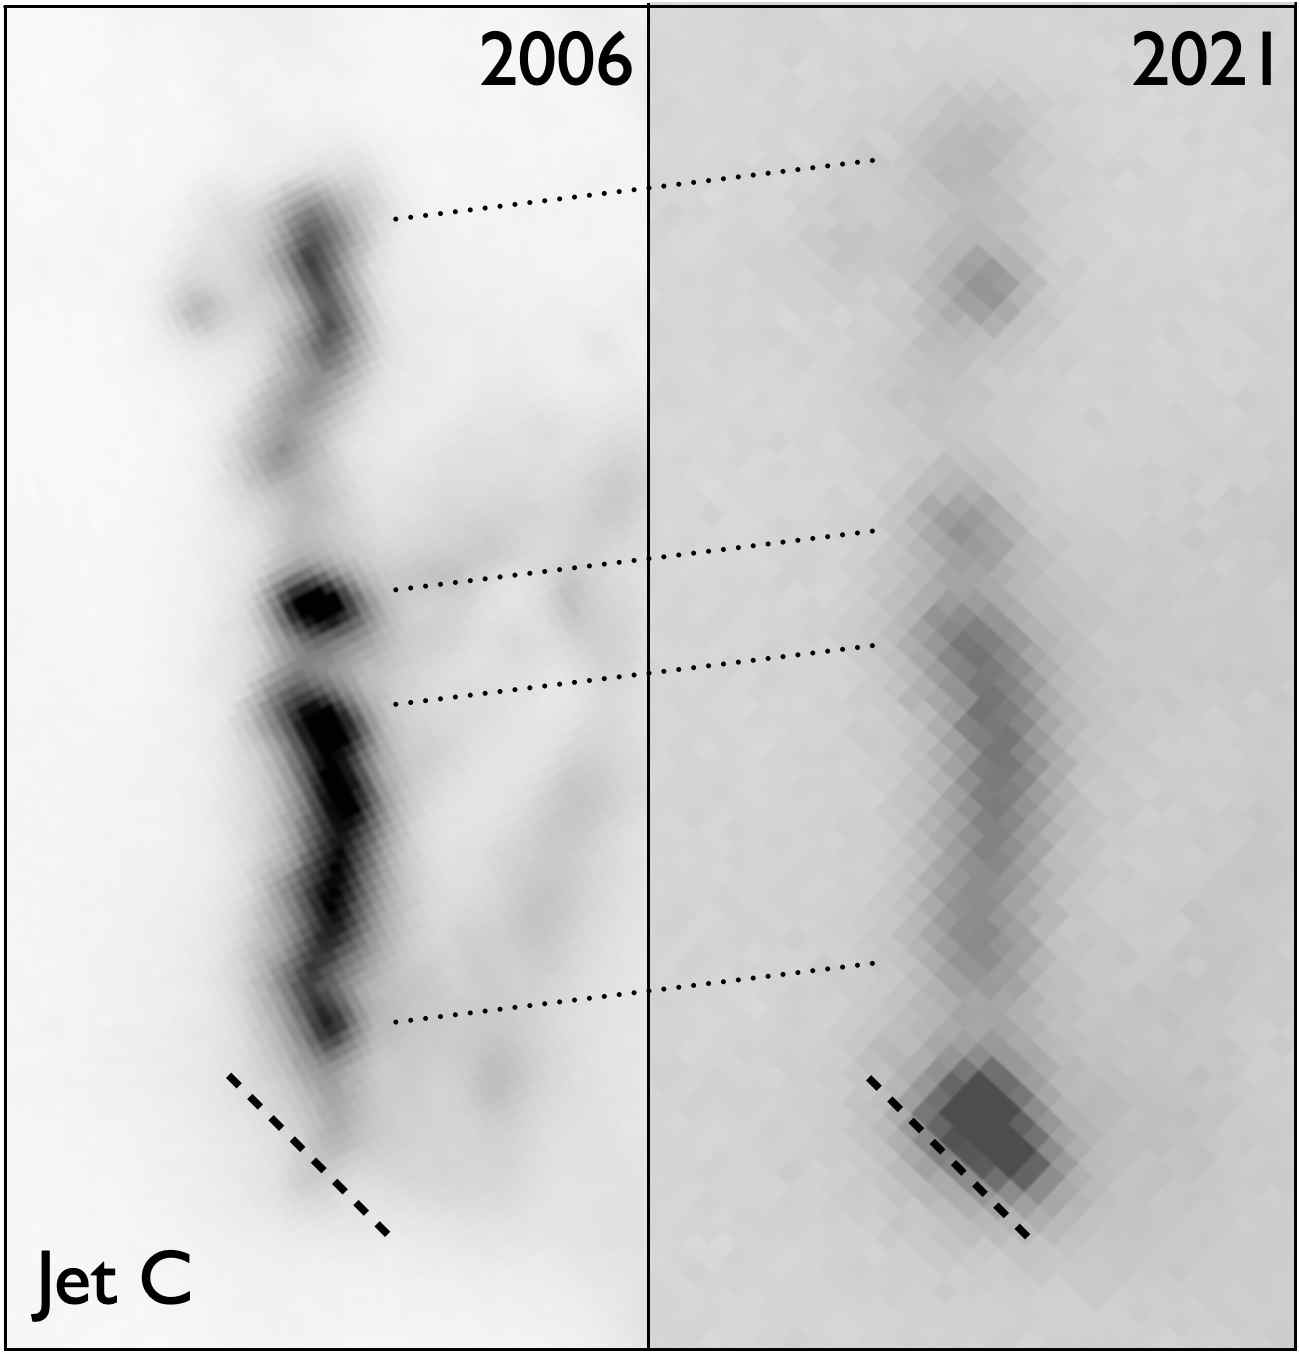
Figure 3 shows that near the outflow source, jet C is strong in [Sii] and is surrounded by H-strong shocks sitting on the ’shoulders’ of the individual knots that protrude to either side of the main jet axis, in a very similar fashion to what is seen in the equally wiggling HH 46/47 jet (Heathcote et al. 1996). These H arcs are deflection shocks or spur shocks, caused by knots glancing off the side of a mostly-evacuated cavity, and they are seen in several other prominent jets, like HH 1, 34, and 47 (Heathcote et al. 1996, Hartigan et al. 2005, 2011). Further out along the flow axis a series of bow shocks are seen, which show a clear double-shock structure, with an inner [Sii]-strong shock and an outer H-strong envelope. This is as expected from a heavy jet pushing through a tenuous ambient medium, either stationary or co-moving, which will produce a double-shock working surface, with a weak jet-shock and a stronger bow shock (Hartigan 1989, Reipurth & Heathcote 1992).
6.3.2 Proper Motions and Radial Velocities
Jones et al. (1987) measured the proper motion of part of the C-jet and derived a tangential velocity of about 320 km s-1 to the NNW away from SSV 63. Our proper motion study concurs with this result, indicating motion of about 300 km s-1 away from the Ea/Eb pair (Figure 14). Our spectra along the C-jet show blue-shifted emission across the velocity range -180 to -230 km s-1 with a peak radial velocity of -200 km s-1. If we adopt these two numbers, then we find that jet C is moving towards us at an angle to the plane of the sky of roughly 34∘. This is comparable to the angle of 35∘ for the redshifted jet E, and although these angles have uncertainties of at least several degrees, their similarity supports the interpretation that the two jets form one bipolar outflow.
Figure 19 shows two groundbased [Sii] images, one taken in 2006 at the Subaru telescope and a new taken in 2021 at the Apache Point Observatory. A new knot has appeared, emerging from behind a dense cloud edge. This new knot is also seen in the H and [Sii] images obtained with HST in 2014 (Figure 5), narrowing the interval during which it appeared to between 2006 and 2014. Our spectra yield a [Sii] ratio 6717/6731 of 0.63, indicating an electron density of 2300 - 3000 (T=10,000 K). The knot is blueshifted.
6.3.3 Origin of Jet C
Given that jets C and E are almost perfectly aligned with each other, and the fact that jet C is blueshifted while jet E is redshifted (Solf 1987) with the same angle to the plane of the sky, it appears evident that they form parts of a single bipolar outflow. However, as was discussed in Section 5, there are two sources between the two jets, Ea and Eb, so in principle the jets could arise from separate sources, which would make it easier to understand the curious difference in morphology of jets C and E. However, if jets C and E were driven by two separate sources, then we would expect that each source would also have a counterjet. Given the limited size of the SSV 63 cloud core, such counterjets should be readily visible. Also, the VLA observations of Ea clearly show a bipolar radio continuum jet along the common E/C jet axis. It thus seems well established that jets C and E form opposite sides of a bipolar outflow from source Ea. The slight mis-alignment of the C and E jets could be explained if source Ea moves towards the southwest through the SSV 63 cloud core with a speed of 2 km s-1, consistent with the expected motion of stars within the gravitational potential of the core. In this scenario, source Eb does not drive any jet. Our ALMA data shows that source Eb does drive an ultra-compact arcsecond-scale molecular flow along a northwest-southeast axis with the redshifted lobe oriented to the northwest (Section 11.2).
6.3.4 Wiggling of Jet C
As already mentioned, jet C shows pronounced wiggling, which might suggest that the source is either a binary or the jet is anchored in a precessing disk. Raga et al. (2009a) have made models of precessing accretion disks around a star in a binary system, and find that it leads to a reflection-symmetric spiraling outflow on small scales from the orbital motion together with a reflection-symmetric spiral on large scales due to the precessing disk.
On closer examination, however, this interpretation runs into difficulties. If we estimate the ratio between a typical extent of one of the wiggles (d10′′ or 4000 AU) and its sideways displacement (h1′′), together with the measured jet velocity vj = 250 km/s the orbiting jet model then yields an estimate for the orbital velocity:
vo =vj h/d = 25 km/s
Also, the orbital period is:
to = d/vj= 76 yr
corresponding to an orbital radius
ro = vo to / (2 ) = 64 AU
which is uncomfortably large.
For a binary with two stars of equal mass M in circular orbits, the mass of one of the two stars can be obtained as:
M = 2 vo2 ro/G = 180 M⊙
which clearly is unrealistic. No matter what tweaks are made to the above numbers the resulting mass is far too large. There are HH jets with a wiggling that is convincingly interpreted as the result of binary motion, but the wiggles here are more irregular and are spread over longer distances along the jet. This may be due to unknown density perturbations that accompany the velocity differences along the jet, and when material runs into itself new knots will come and go.
Another possible explanation for the difference in morphology of the E/C jet pair could be that, while source Ea is located at the edge of the cloud core and launching jet E unhindered, jet C is burrowing through the cloud core. Shear might excite Kelvin-Helmholtz instabilities along the cavity walls, and the jet could be slighly deflected by these ripples in a quasi-periodic fashion.
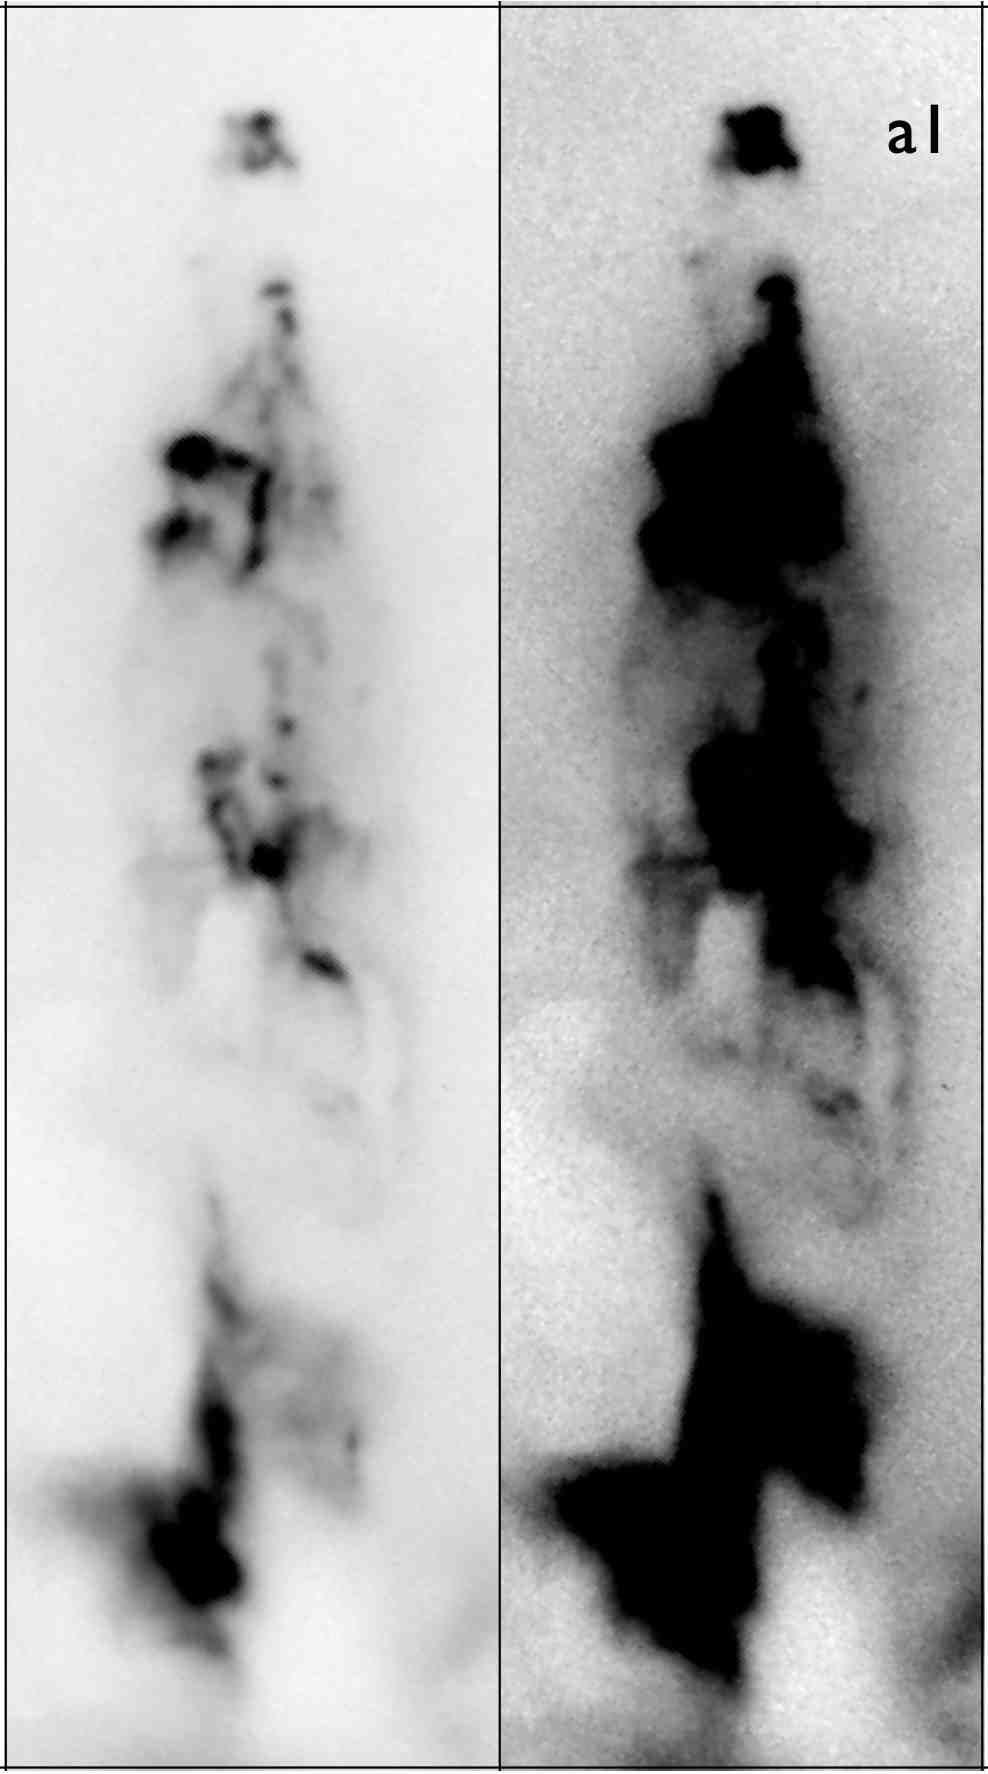
6.4 HH 24 Jet G
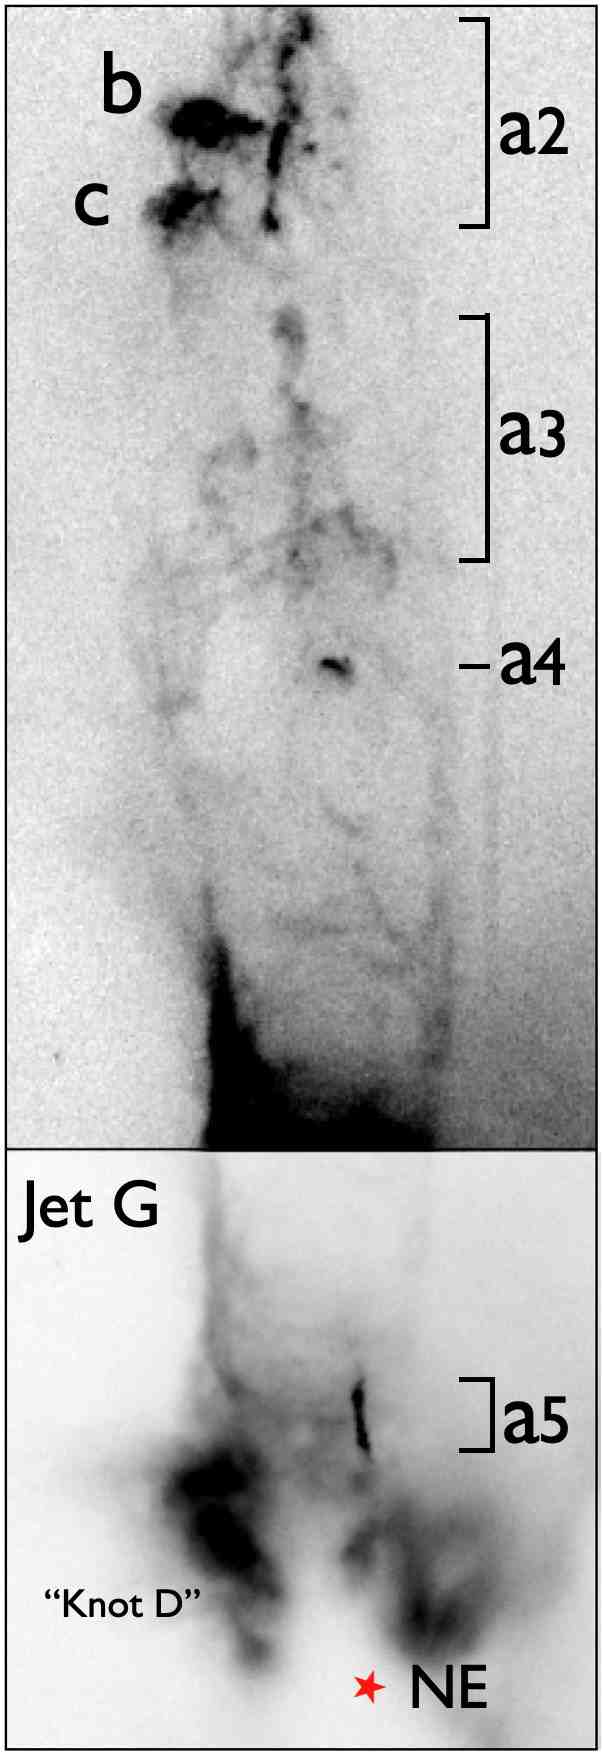
Jet G has an unusual morphology. Figure 20 shows two cuts of a deep image from the Subaru 8m telescope, which reveals four main features of the jet, (1) a central axis with fragments of a long collimated flow which we denote Ga1-a5 (see Figure 21), (2) an envelope surrounding the entire flow, (3) several knots that are off-center from the main axis, in particular the pair of knots labeled Gb and Gc in Figure 21, which shows a 1.644 m [Feii] HST image, and (4) a large bright and diffuse S-shaped region at the base of the jet, which corresponds to Herbig’s knot D.
Knot D was observed spectroscopically by Jones et al. (1987) who found that it is mainly a reflected continuum with H and H in emission. Polarimetry by Strom et al. (1974a,b), Schmidt & Miller (1979), and Scarrott (1987) suggested that SSV 63 is a likely source of the reflected light (see Section 5.6), but Jones et al. (1987) argued that another embedded source should exist on the axis of the G flow. Their proposed position is only 3 arcsec from the NE radio continuum source found later by Reipurth et al. (2002), and lying on the axis of the G outflow (see Figure 21).
The linear chain of knots denoted a1-a5 in Figure 21 includes a fragment (a5) of a jet near the source NE. While this appearance is similar to many other ill-defined jets, an unusual feature is the envelope that surrounds the jet, seen well in Figure 20. The distance from the tip of the jet to source NE is 75 arcsec, corresponding to 30,000 AU in projection. The width of the envelope at its widest is about 14 arcsec, corresponding to 5600 AU. Near its base, much of this envelope near its base is illuminated by light from source NE, and there appears to be several rings or corrugations in its lower part. Presumably this is an outflow cavity originating from source NE. The two brightest knots in Jet G are located off the axis of the Ga knot chain.
Unique among the HH 24 jets, jet G has a bright component of H2 emission, see Figure 17. The apex of jet G, labeled a1, is dominant in H2, and closer to the source, around a3, prominent wings of H2 indicate the presence of low-velocity shocks.
Jones et al. (1987) obtained long-slit spectroscopy of the central a1 - a5 knots, and found very high blueshifted heliocentric velocities of -130 to -140 km s-1. We have obtained spectra of the off-axis Gb-knot, and find a low velocity of 0 km s-1. Our proper motion measurements of the a-knots indicate motions of 100-200 km s-1, but the b and c off-axis-knots are stationary within the errors. They are both very bright in [Sii], indicating that they are low-excitation shocks. They seem to be oriented towards the north-east, and when tracing a line backwards one finds the near-IR YSO IRS 1 (see Section 8.2). However, the lack of measurable proper motions makes it impossible to establish a possible association with this source.
6.5 Other Jets
6.6 Parsec-scale Outflows
Many well-collimated HH jets are associated with distant bow shocks that can be more than one parsec from their driving sources. Such giant jets provide fossil records of the mass loss and accretion histories of their driving sources (Reipurth, Bally, and Devine 1997). The formation of these giant terminal working surfaces is discussed in Section 12.
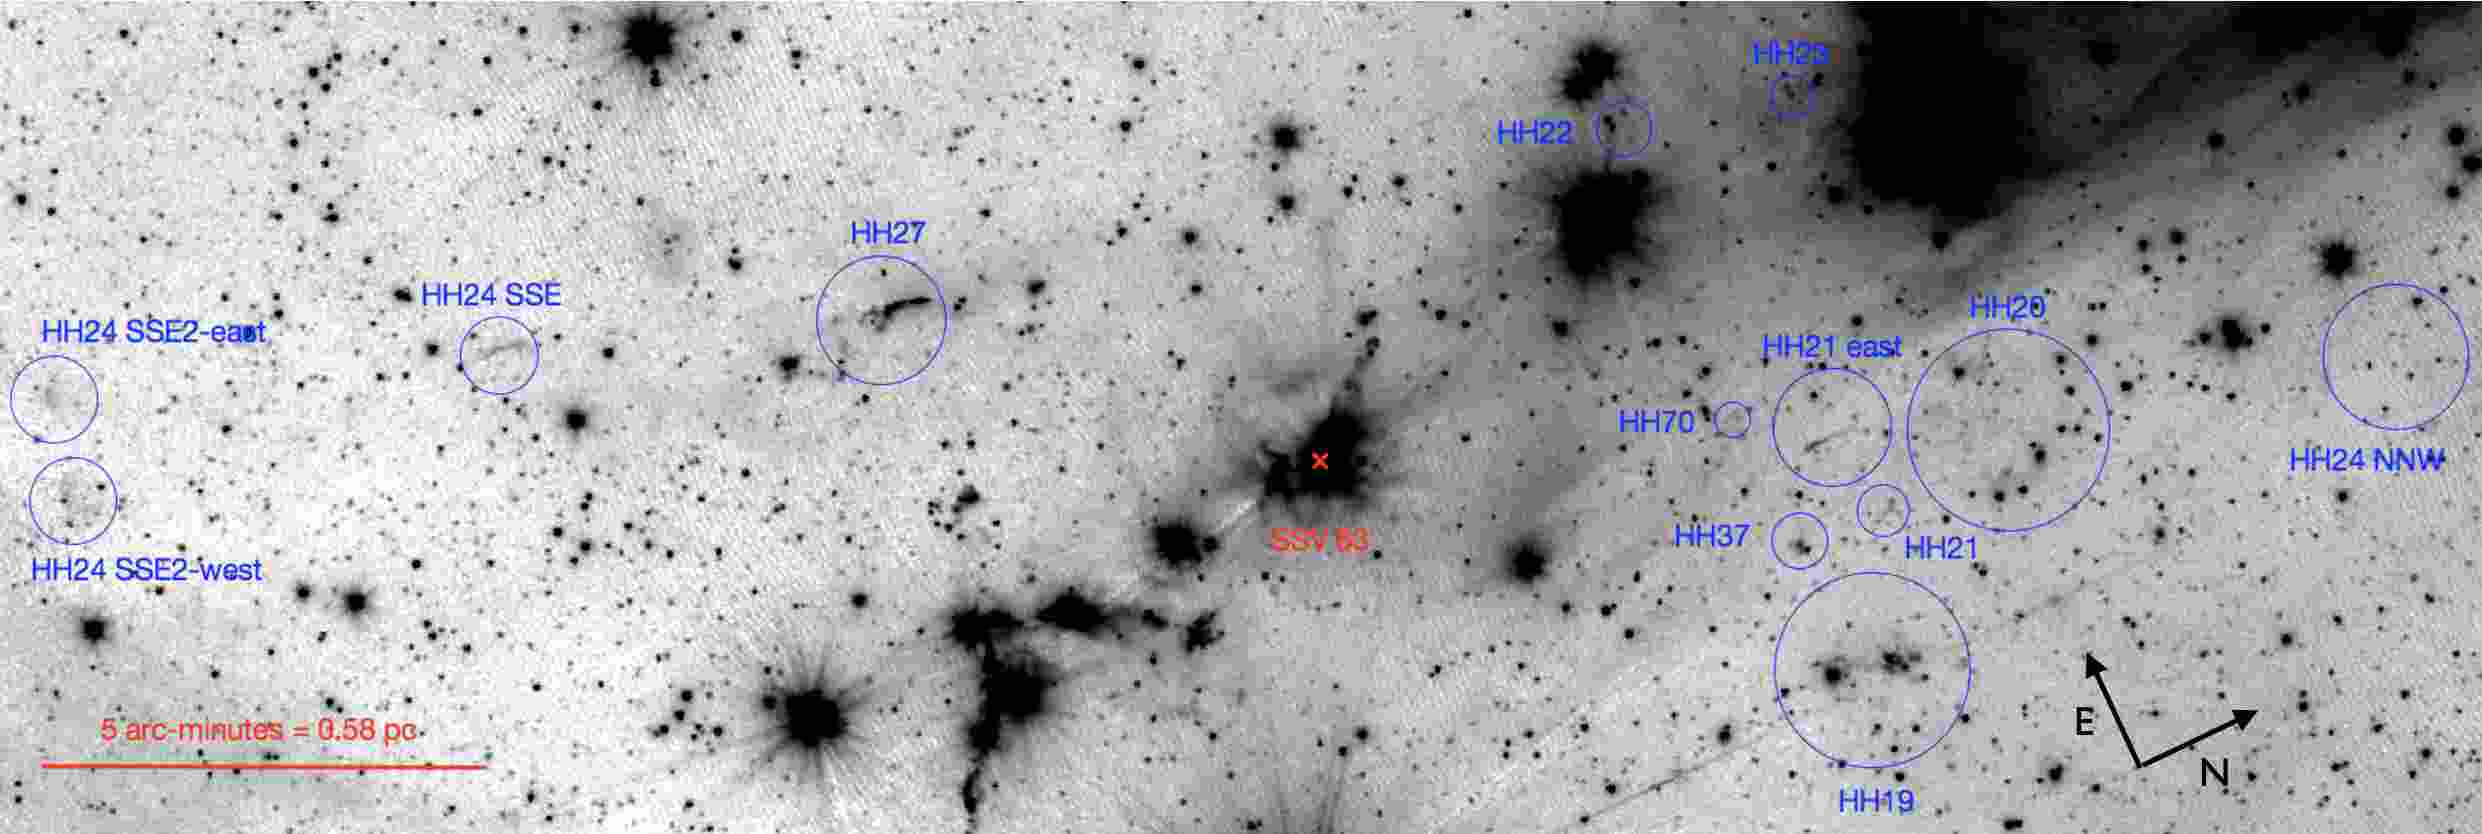
The HH 24 jet complex is not an exception to this. Several distant shocks, found by Herbig (1974, HH 19,20,21), Strom et al. (1986, HH 37), and Reipurth & Graham (1988, HH 70), are located to the north of the HH 24 complex (Figure 1). In their study of the HH objects in this region, Jones et al. (1987) recognized the probable relation of these objects to the HH 24 jets. Basic properties of the various distant components of these giant flows, known as well as new, are given in Table 6, and are discussed in more detail below.
6.6.1 HH 19
HH 19 is a bright and highly structured object, with the appearance of a large fractured bow shock (Figure 1). Between HH 19 and SSV 63 is a faint group of knots, labeled HH 19-O by Eisloeffel & Mundt (1997). The faint but well collimated jet J points within a few degrees towards HH 19. This jet is launched by source Wb, which is therefore also the likely driving source of HH 19. This identification was supported by the proper motion measurements of Jones et al. (1987), who found tangential velocity vectors of the HH 19 complex of 60-90 km s-1 directed away, to within a few degrees, from the SSV 63 multiple system. The distance of HH 19 from source Wb is 400 arcsec, corresponding to a projected distance of 0.77 pc.
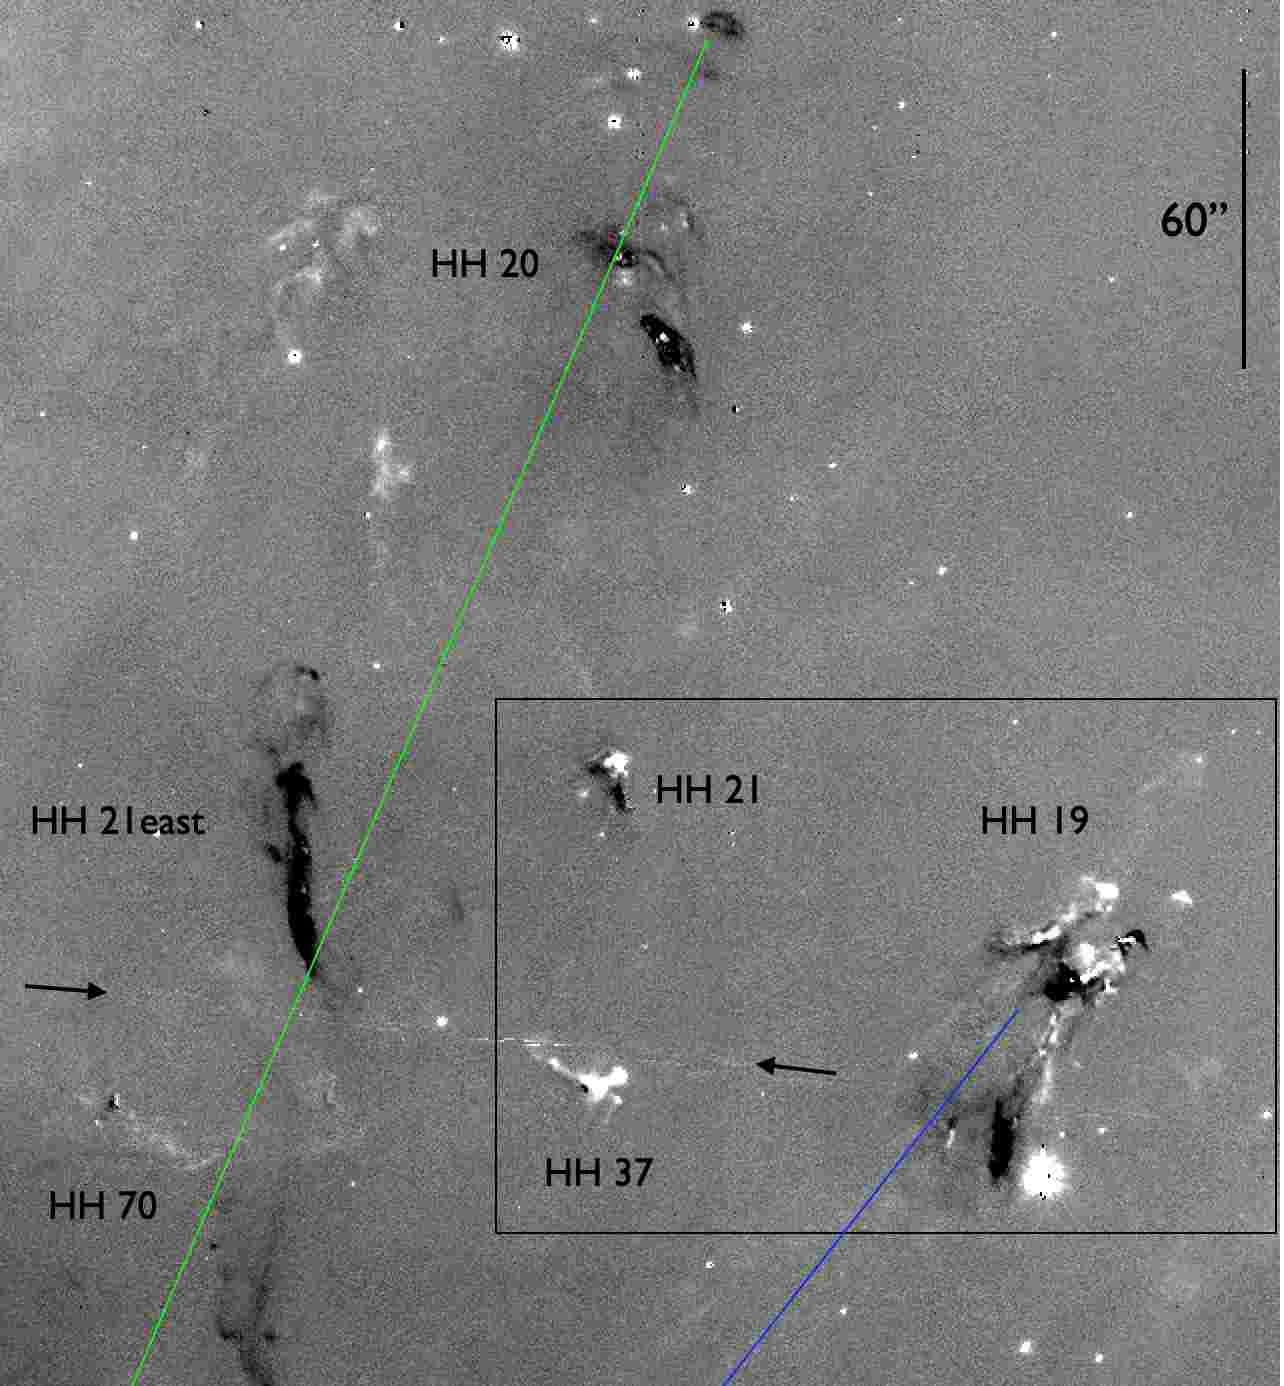
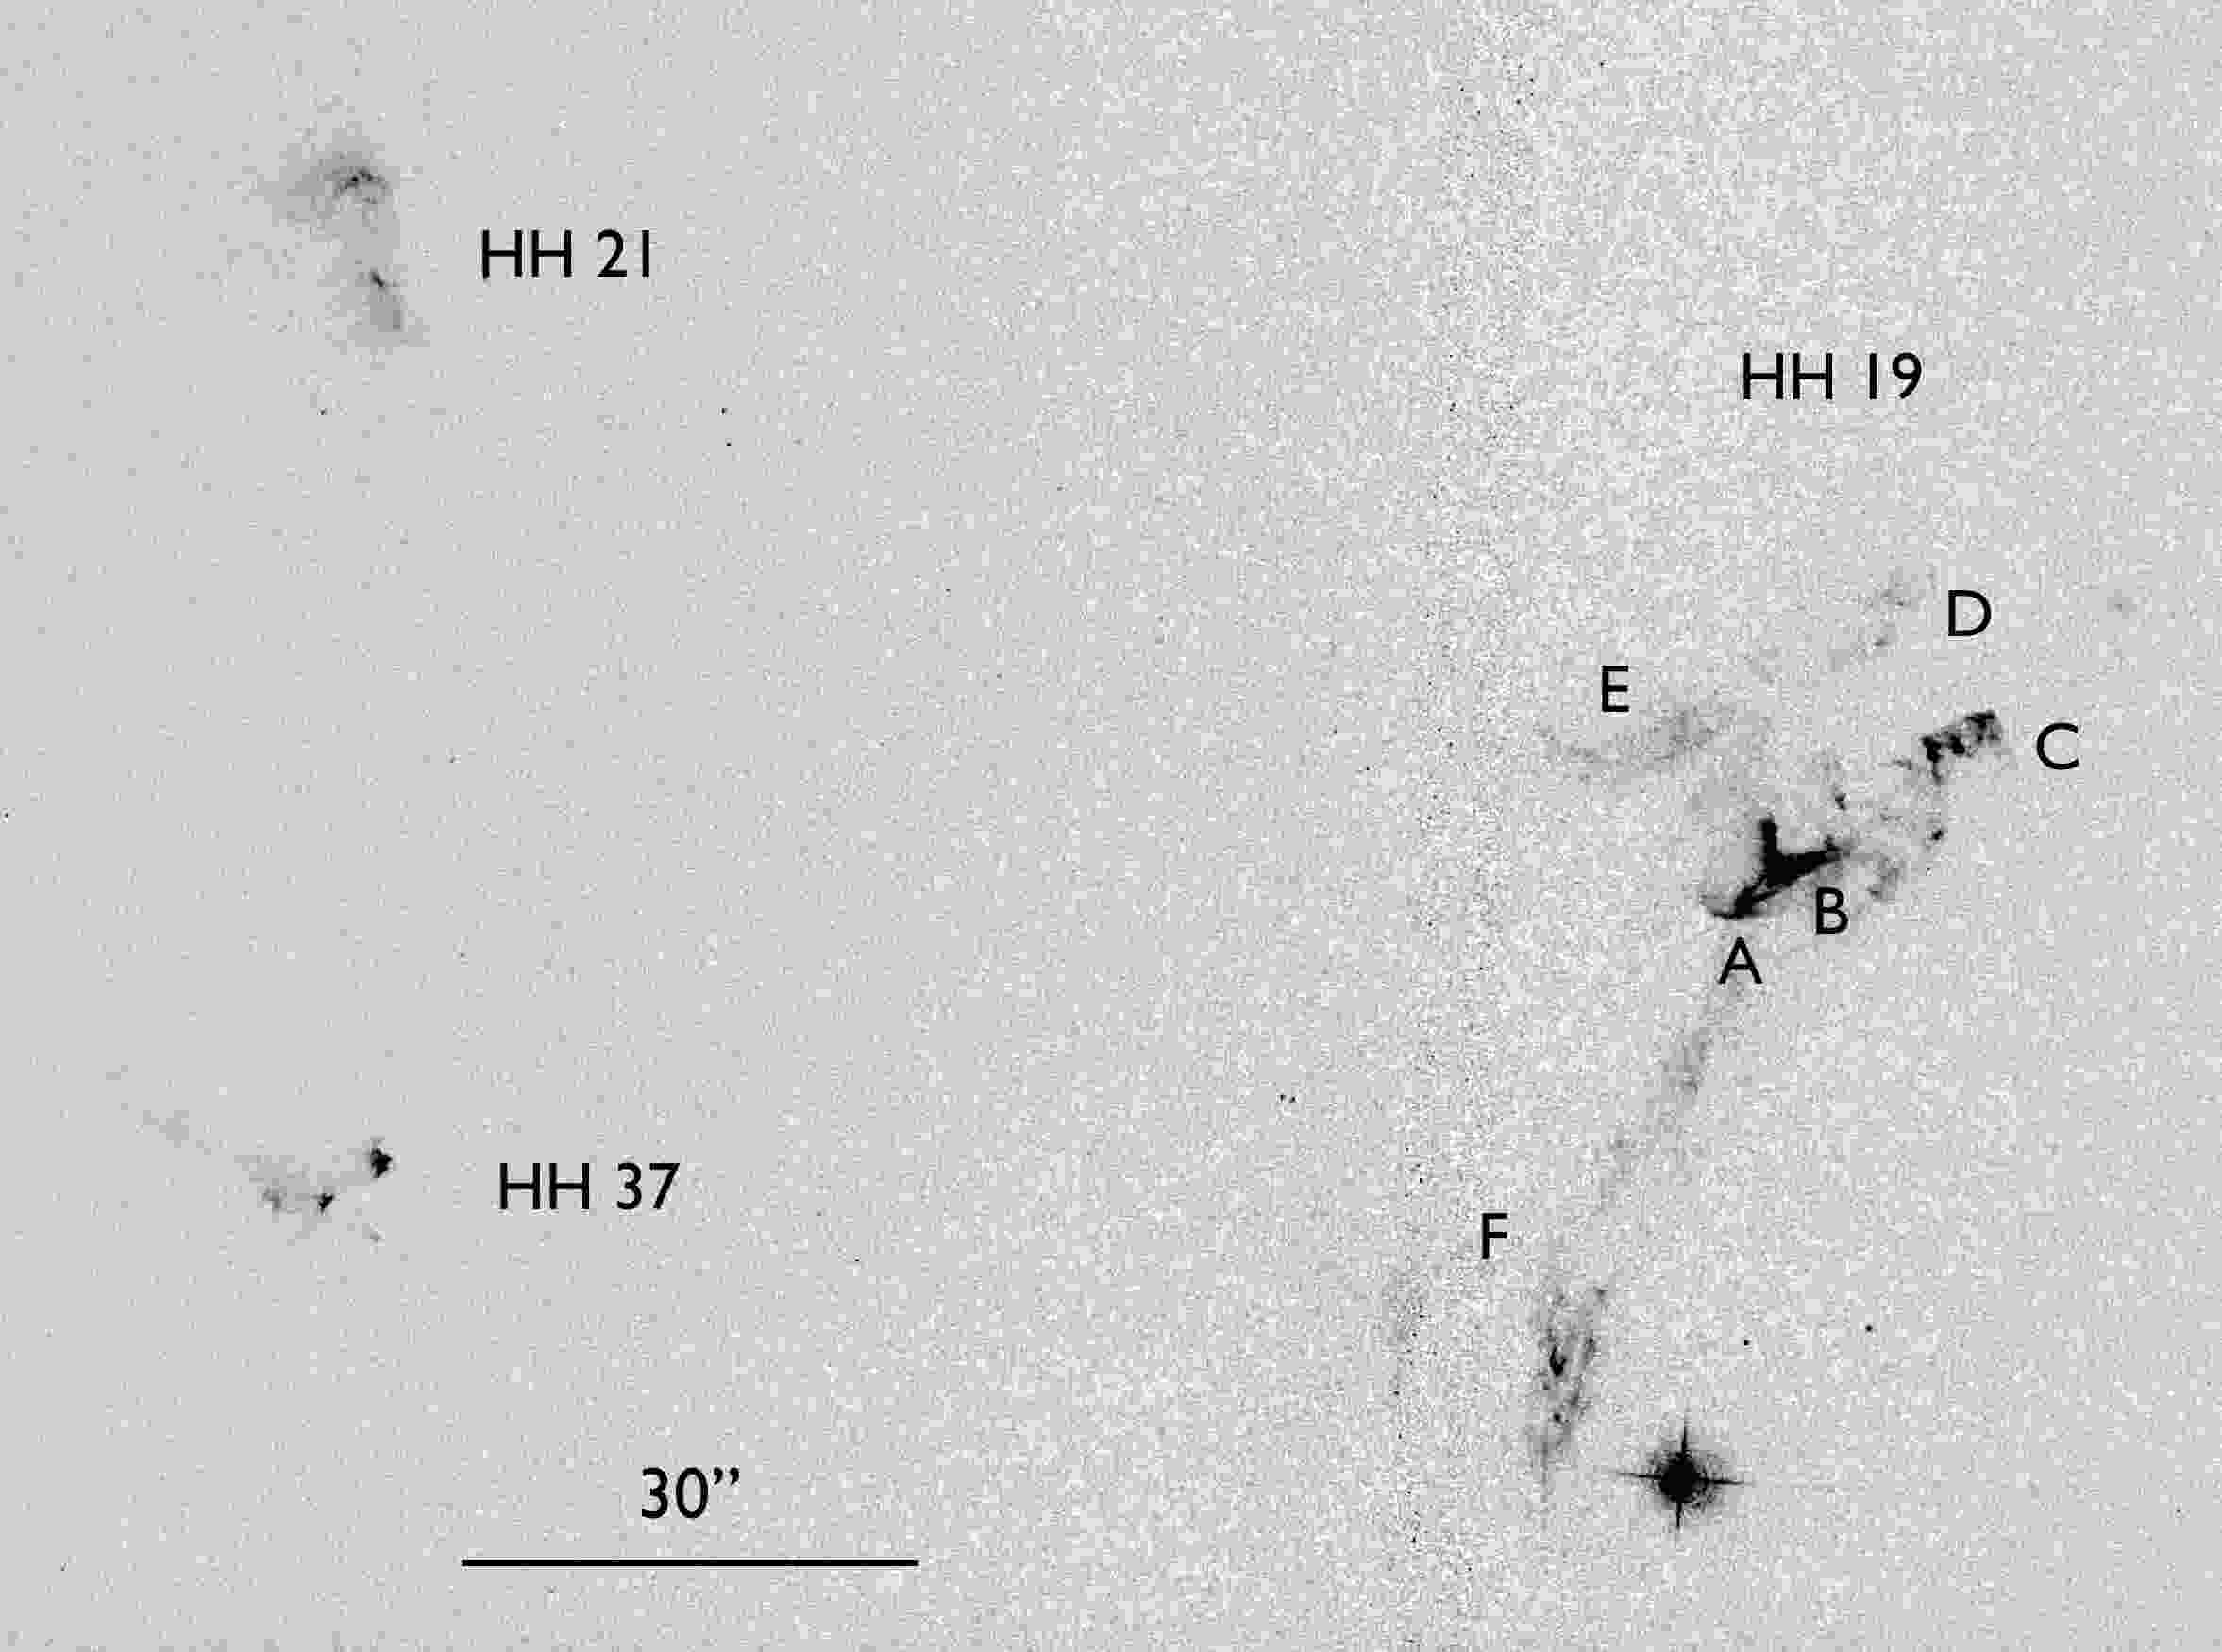
Figure 22 shows an H–[Sii] difference image including HH 19. While some HH working surfaces have clean morphologies, with H-strong bow shocks and weaker [Sii] jet shocks (e.g., HH 34, Reipurth & Heathcote 1992), HH 19’s highly fractured structure does not show such simple patterns. The complexity of the individual shocks in HH 19 is further illustrated in Figure 23, which shows an H image that was fortuitously obtained in parallel-mode with ACS while the HH 24 jets were imaged with WFC3. Some features appear to have forward facing bow-shapes, while others are backward facing. These latter structures tend to show little or no proper motion while the forward facing shocks exhibit the fastest motions. It seems that some ejecta associated with jet J are overrunning either stationary, or slowly moving, dense globules of material.
Our measurements indicate a mean tangential velocity of HH 19 around 100 km s-1 but with large internal variations, and directed straight away from the SSV 63 core along the axis of jet J. Assuming that this velocity is representative of the motion of HH 19 since it was launched, it indicates an age of 8,000 yr.
Our spectra show that HH 19 is blueshifted, as already noted by Jones et al. (1987), with velocities ranging from -100 to +29 km s-1 and with a peak around -15 to -20 km s-1 in the Orion reference frame. This suggests that the flow is moving close to the plane of the sky, at an angle of roughly 10∘.
6.6.2 HH 27
On the opposite side of source Wb, along the axis of the J-jet and at a distance of 320 arcsec (0.62 pc), is the bright compact HH object HH 27 (Figure 1). Based on this location, it appears highly likely that HH 19 and HH 27 form opposite working surfaces in a giant outflow with a combined projected extent of 1.4 pc. Whereas HH 19 is blueshifted, HH 27 is redshifted, showing a broad H line profile with a peak velocity in the Orion Nebula rest frame of about +32 km s-1. The 0.15 pc difference in extent of the blue- and red-shifted lobes may be related to HH 19 moving out of the L1630 cloud, whereas HH 27 may still be closely associated with the cloud. This is supported by Jones et al. (1987) who found HH 27 to be the highest extinction object in the region, with an Av3, based on measurements of Balmer decrements.
Despite the presence of bright, compact knots in HH 27, the absence of nearby reference stars means that only an upper bound on its tangential velocity of V60 km s-1 could be measured, a limit consistent with the object moving into a cloud.
6.6.3 Extensions of HH 24C
The shocks in the HH 24C jet grow fainter and wider as they move to the NNW of source Ea. Several working surfaces with H-bright bow shocks sitting as shoulders on [Sii]-rich jet shocks are evident in Figure 3. Beyond those, the flow appears as a very faint and diffuse filigreed bubble of shocks reaching as far as 140 arcsec (55,000 AU = 0.27 pc in projection) from source Ea (Figure 1). Such a structure may result from a wider outflow interacting with the surface of the L1630 cloud.
6.6.4 HH 20, 21, 37, 70, NNW
Further downstream there is what appears to be a giant fractured bow shock encompassing HH 20, 21, 37, and 70, see Figure 1. Our spectra show that HH 20 is blueshifted, with line profiles peaking at a velocity of about -120 km s-1, confirming the early work of Jones et al. (1987). The most distant shock in the HH 20 complex is 530 arcsec (1.02 pc in projection) from source Ea. We concur with Jones et al. (1987) and Eisloeffel & Mundt (1997) that these distant shocks are likely driven by SSV 63. The tangential velocities of the components of the HH 20 complex are on average around 130 km s-1, indicating a dynamical age of 6800 yr, again assuming a constant velocity over time. However, there is a large dispersion in motion among the various features. For HH 21, 37 and 70 the motions are so slow that no measurable proper motions could be determined. For HH 20, tangential velocities are in the range 50-100 km s-1. The north-south oriented filament, HH 21 east shows coherent motion towards the north with a speed larger than 100 km s-1. However, the northern-most knot exhibits apparent motion towards PA-24 . This may be due to fading of one part of the shock and brightening of another part towards the west.
We have obtained widefield images to the NNW and SSE of HH 24 in search of further shocks, and have identified several along the E/C jet axis. Figure 24 shows the sum of our deep H and [Sii] images with SuprimeCam where we identify yet another faint shock, dubbed HH24-NNW, along the E/C jet axis, at a distance of 750 arcsec, or 1.46 pc in projection. The object is too diffuse for proper motion to be measured.
While within 1′ of source Ea, knots in the jets C and E exhibit tangential motions of about 250 to 300 km s-1, the various HH objects located farther away from the SSV 63 core show a systematic decline of the proper motions with increasing distance from the SSV 63 core. This behavior is similar to what is observed in other parsec-scale protostellar outflows and indicates deceleration of the ejecta as they interact with slower moving or stationary media.
| Shock | 2000 | 2000 | Assoc. Jet | Source | Pos.Angle | Sep.[′′] | Length [pc]b |
|---|---|---|---|---|---|---|---|
| HH 19 | 5:45:49.6 | -00:05:11 | Jet J | Wb | 317 | 398 | 0.77 |
| HH 20 | 5:45:55.6 | -00:02:47 | Jet C | Ea | 336 | 477 | 0.92 |
| HH 21 | 5:45:55.7 | -00:04:27 | Jet C | Ea | 330 | 387 | 0.75 |
| HH 21east | 5:45:59.8 | -00:04:46 | Jet C | Ea | 338 | 343 | 0.67 |
| HH 27 | 5:46:22.9 | -00:13:44 | Jet J | Wb | 135 | 319 | 0.62 |
| HH 37 | 5:45:56.0 | -00:05:32 | Jet C | Ea | 325 | 330 | 0.64 |
| HH 70 | 5:46:02.3 | -00:05:36 | Jet C | Ea | 341 | 283 | 0.55 |
| HH 24 NNW | 5:45:51.3 | +00:01:41 | Jet C | Ea | 340 | 750 | 1.45 |
| HH 24 SSE | 5:46:28.6 | -00:17:53 | Jet E | Ea | 147 | 503 | 0.98 |
| HH 24 SSE2e | 5:46:35.3 | -00:22:47 | Jet E | Ea | 152 | 863 | 1.67 |
| HH 24 SSE2w | 5:46:31.0 | -00:23:04 | Jet E | Ea | 157 | 851 | 1.65 |
Note. — a: All objects are very extended; coordinates refer to bright features or the geometric center of an object. All objects were measured on optical images except HH 24 SSE2e and HH 24 SSE2w, which were measured on Spitzer IRAC2 images. b: Projected length.
6.6.5 HH 24 SSE, SSE2e, SSE2w
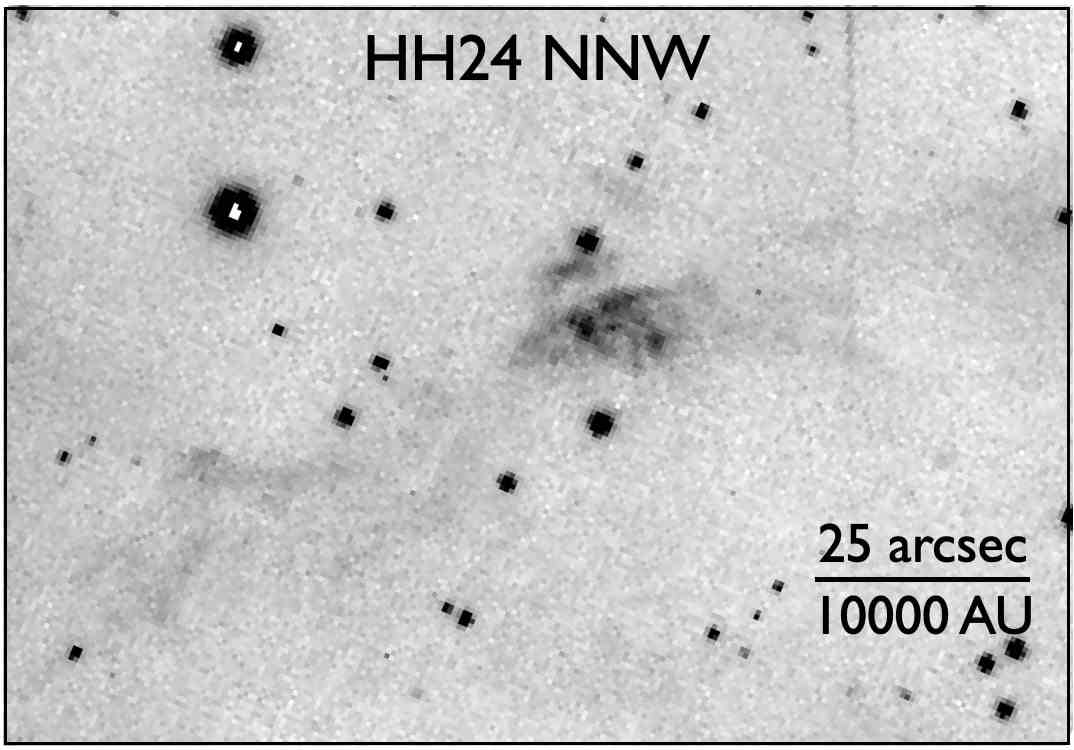
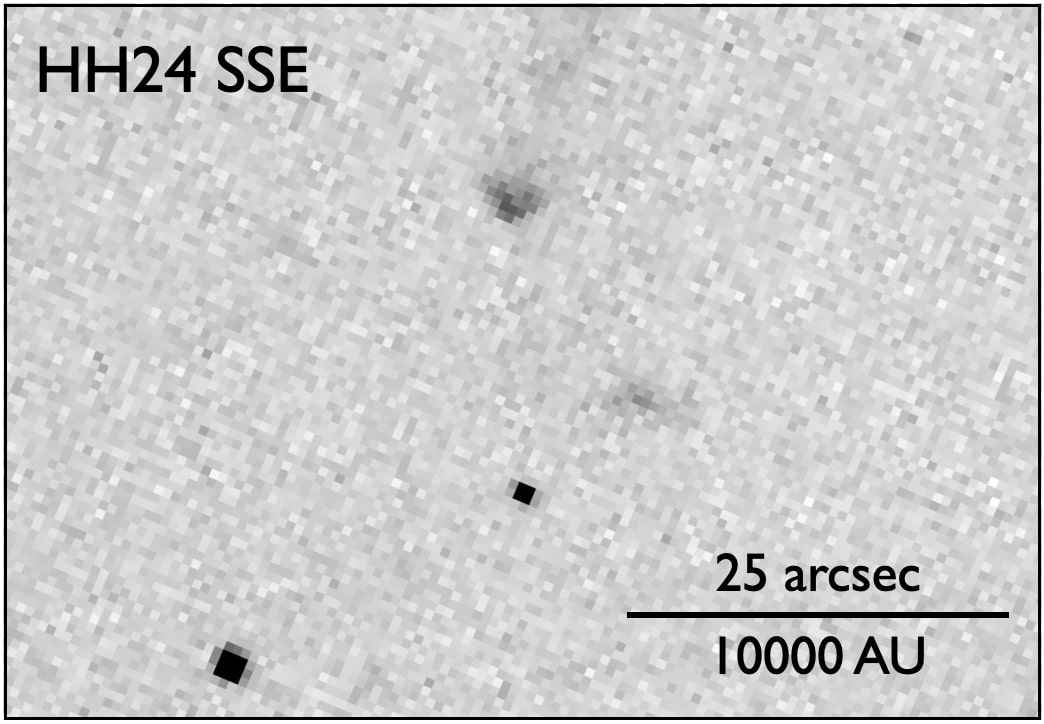
In the southern part of the HH 24 complex we have discovered three more distant knots, labeled SSE, SSE2e, and SSE2w. They are shown on Figure 25, which is a composite from Spitzer IRAC1 (3.6 m) and IRAC2 (4.5 m) images, where these distant shocks are more pronounced. The projected distance of SSE from source Ea is 0.98 pc, and from our optical images we determine a tangential motion of roughly 150 km s-1. Assuming a constant velocity the age of this knot is 8200 yr. The projected distance of the SSE2 pair from source Ea is 1.66 pc. Thus, the total extent of the HH 24 E/C flow is 3.1 pc, making it among the largest HH flows known. Figure 26 shows optical close-ups of the individual NNW and SSE shocks. The NNW shock has a very large extent of 40,000 AU, and is likely the northern terminal bow shock for the HH 24 E/C jet pair. In contrast, the SSE shock just consists of two knots, located well behind the two most distant shocks, SSE1 and 2, which likely together form the southern terminus of the E/C jet pair. We discuss how these multiple working surfaces have been formed in Section 12.
| Date | MJD | Instrument & Filter |
|---|---|---|
| 18 December 2001 | 52261 | CTIO 4m Mosaic H, [Sii] |
| 06 January 2006 | 53741 | Subaru Suprimecam H, [Sii] |
| 18 February 2014 | 56706 | HST WFC3/ACS [Feii], H , [Sii] |
| 03 February 2016 | 57421 | HST WFC3/ACS [Feii], H |
| 01 December 2021 | 59549 | APO ARCTIC [Sii] |
| R.A. & Dec. | PMa | Va | PA | Comments |
|---|---|---|---|---|
| (J2000) | (mas ) | (km s-1) | (deg.) | |
| 5:46:35.2 -0:22:43 | - | - | - | HH 24 SSE2-east. South terminus |
| 5:46:30.6 -0:23:06 | - | - | - | HH 24 SSE2-west. South terminus |
| 5:46:28.8 -0:18:05 | 61 | 156 | 115 | HH 24 SSE1 |
| 5:46:22.7 -0:13:43 | 30 | 60 | - | HH 27 |
| 5:45:56.2 -0:07:18 | 83 | 157 | -43 | jet J; faint bow |
| 5:45:49.6 -0:05:11 | 46 | 87 | -23 | jet J; HH 19 S |
| 5:45:49.1 -0:04:53 | 54 | 102 | -25 | jet J; HH 19 N. Northwest terminus |
| 5:45:69.0 -0:04:32 | 57 | 108 | -24 | HH 21east |
| 5:45:59.8 -0:05:02 | 49 | 93 | -3 | HH 21east E1 (H) |
| 5:45:59.8 -0:04:55 | 74 | 140 | -7 | HH 21east E2 (H) |
| 5:45:59.8 -0:04:31 | 131 | 248 | -5 | HH 21east E3 (H) |
| 5:45:69.0 -0:04:28 | 132 | 250 | -11 | HH 21east N-tip (H) |
| 5:45:55.7 -0:04:26 | 30 | 60 | - | HH 21 |
| 5:45:58.5 -0:03:22 | 55 | 104 | 9 | HH 20 S |
| 5:45:55.0 -0:03:02 | 92 | 175 | -16 | HH 20 NW1 |
| 5:45:55.6 -0:02:47 | 59 | 112 | -22 | HH 20 NW2 |
| 5:45:54.2 -0:02:01 | 73 | 139 | 0 | HH 20 N |
| 5:45:51.1 +0:01:42 | 30 | 60 | - | HH24 NNW. North terminus |
Note. — a: no motion detected is marked as –
6.6.6 Proper Motions of Distant Bow Shocks
We have three epochs of groundbased optical images spanning from 2001 to 2021 that cover parts of these parsec-scale shocks surrounding the HH 24 complex (see Table 7). Images obtained with the Blanco 4-meter telescope at CTIO in 2001, the Subaru 8-meter telescope in 2006, and the Apache Point Observatory (APO) 3.5-meter in 2021 were used for proper motion measurements of these distant HH objects. The time interval between the 2001 and 2021 images was 19.95 years
Table 8 lists the positions and proper motions of features measured on the 2001 Blanco 4m, the 2006 Subaru, and 2021 APO images. At a distance of 400 pc, a displacement of 1″ in a time interval of 19.95 years corresponds to a speed of 93.5 km s-1. The uncertainties of the tangential velocities vary from about 20 to as much as 60 km s-1 owing to the diffuse structure of some of the features, residual distortions in the images, and the lack of close-by field stars to use for image registration.
6.6.7 Parsec-scale CO Outflows
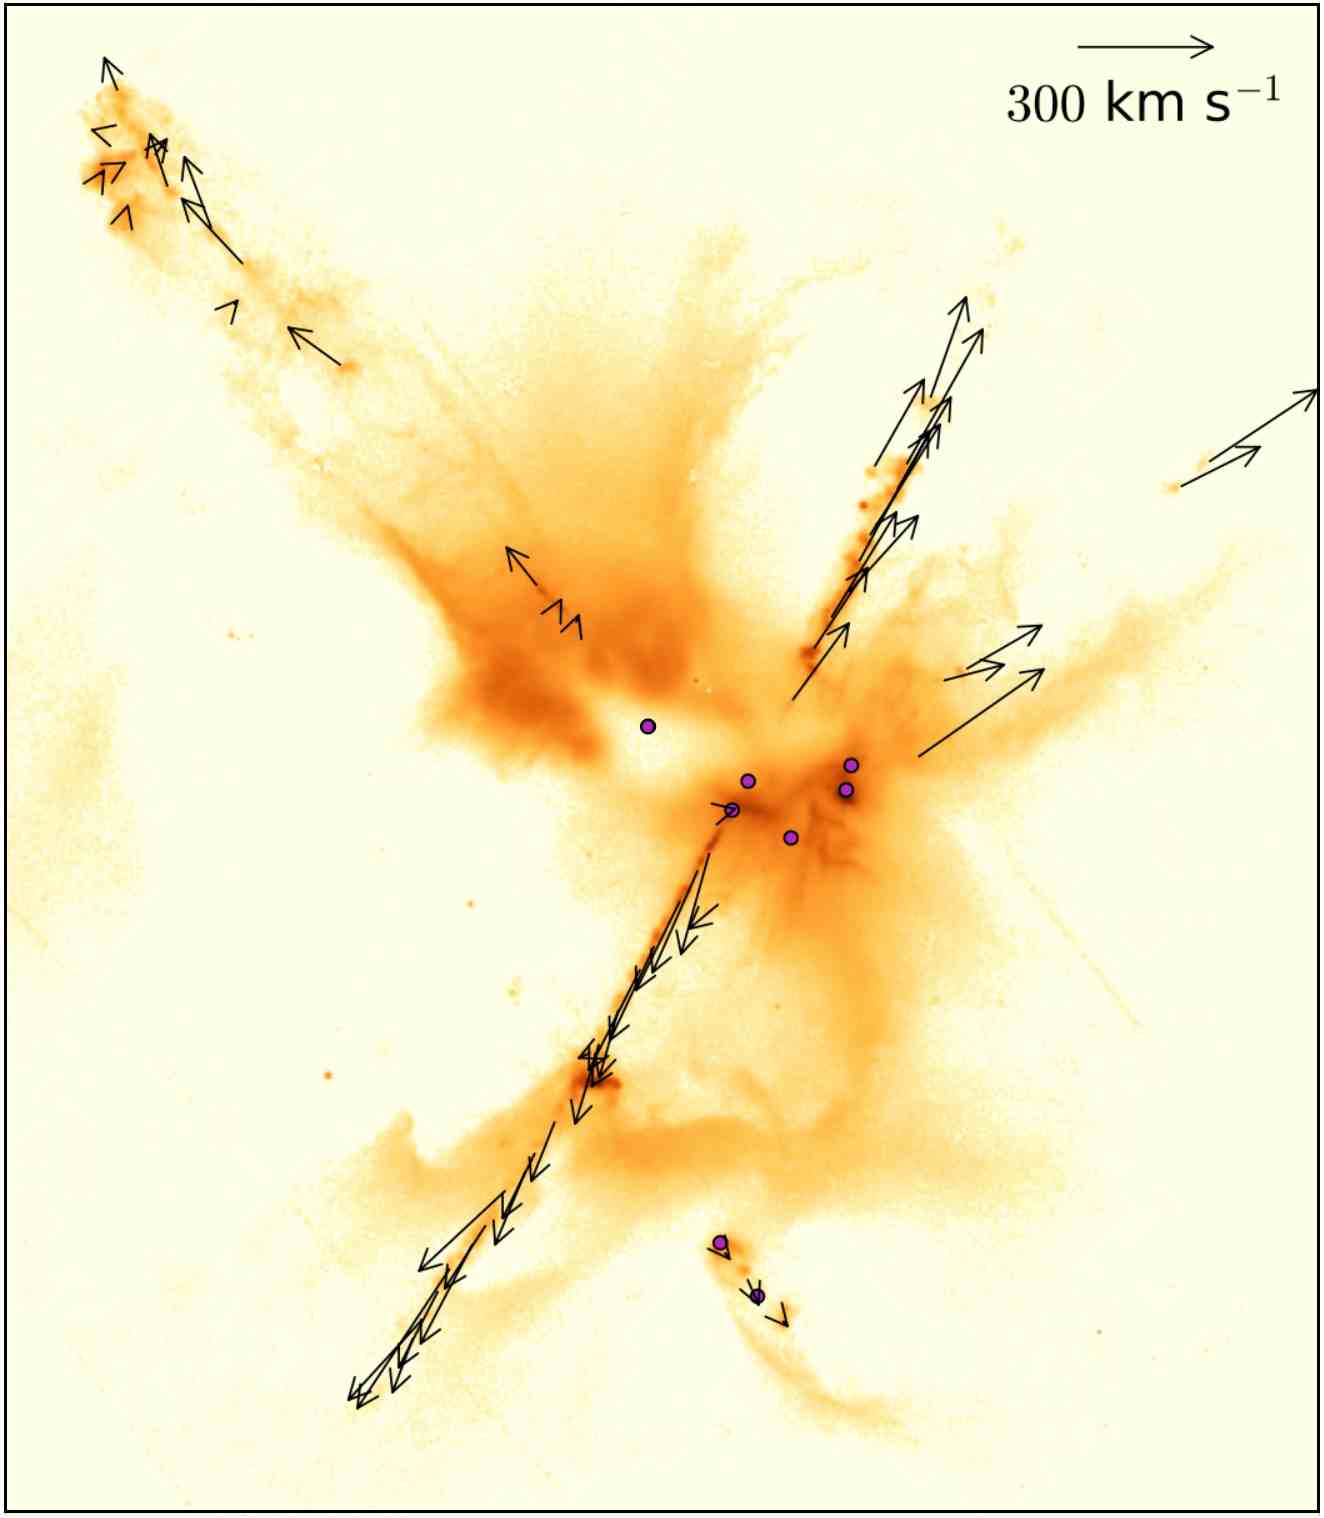
Stanke et al. (2022) have mapped the entire Orion B molecular cloud in the J=3-2 CO transition at 346 GHz with the APEX telescope (the ALCOHOLS survey). The beam size of this survey is 19″. Figure 27 shows ‘high-velocity’ CO emission in the vicinity of the SSV 63 cloud core. Towards NNW, there is a low-radial velocity counterpart to jet J, also blueshifted as the HH objects. We find that a clumpy, low velocity bubble appears to surround the various distant HH objects likely powered by jet C. Faint, redshifted emission is associated with the counterflows. The impact of the SSV 63 outflows on the Orion B cloud has been very significant, and not only in the immediate vicinity of the sources, where cavities have been blown out (Figure 4). A detailed analysis of these giant molecular outflows is, however, beyond the scope of this paper.
A number of smaller, and presumably younger bipolar outflows are also seen in this part of the Orion B cloud.
7 THE CLASS 0 SOURCE HH 24 MMS
Forty arcsec south of the SSV 63 complex lies a very bright submm source, HH 24 MMS, discovered at 1300 m by Chini et al. (1993). Bontemps et al. (1995) and Chandler et al. (1995) detected a VLA source towards HH 24 MMS at 3.6 cm and 7 mm, respectively, both in C/D configuration. Ward-Thompson et al. (1995) obtained an improved position at 350 m, showing that the VLA source is coincident with the submm source, and identified it as a deeply embedded Class 0 source. Reipurth et al. (2002b) detected the source at 3.6 cm with the VLA-A and provided a more accurate position for HH 24 MMS. Two additional nearby faint sources were detected with high-resolution VLA-C/D observations at 6.9 mm by Kang et al. (2008).
Near HH 24 MMS, Furlan et al. (2016) identified on Herschel images a cool source, HOPS 317, which was previously discovered with Spitzer and identified as the near-infrared source 2MASS-J05460852–0010390. They concluded that it is a Class 0 source with a total luminosity of 10.6 L⊙, a bolometric temperature of Tbol=47.5 K, and an extinction AV=41.5 mag. However, examination of the Herschel images show that HH 24 MMS and HOPS 317 are two separate sources, 5 arcsec apart. While the two sources are just resolved at 70 m, with HOPS 317 being the dominant source, at 160 m they are blended, see Figure 28. Hsieh et al. (2021) observed the region with ALMA and in addition to separating HOPS 317 and HH 24 MMS, they found a third source about 12″ to the northwest, which they dub HH24mms-NW (their Figure 3b). It could be that HH 24 MMS forms a small multiple system, possibly non-hierarchical, and if so unstable.
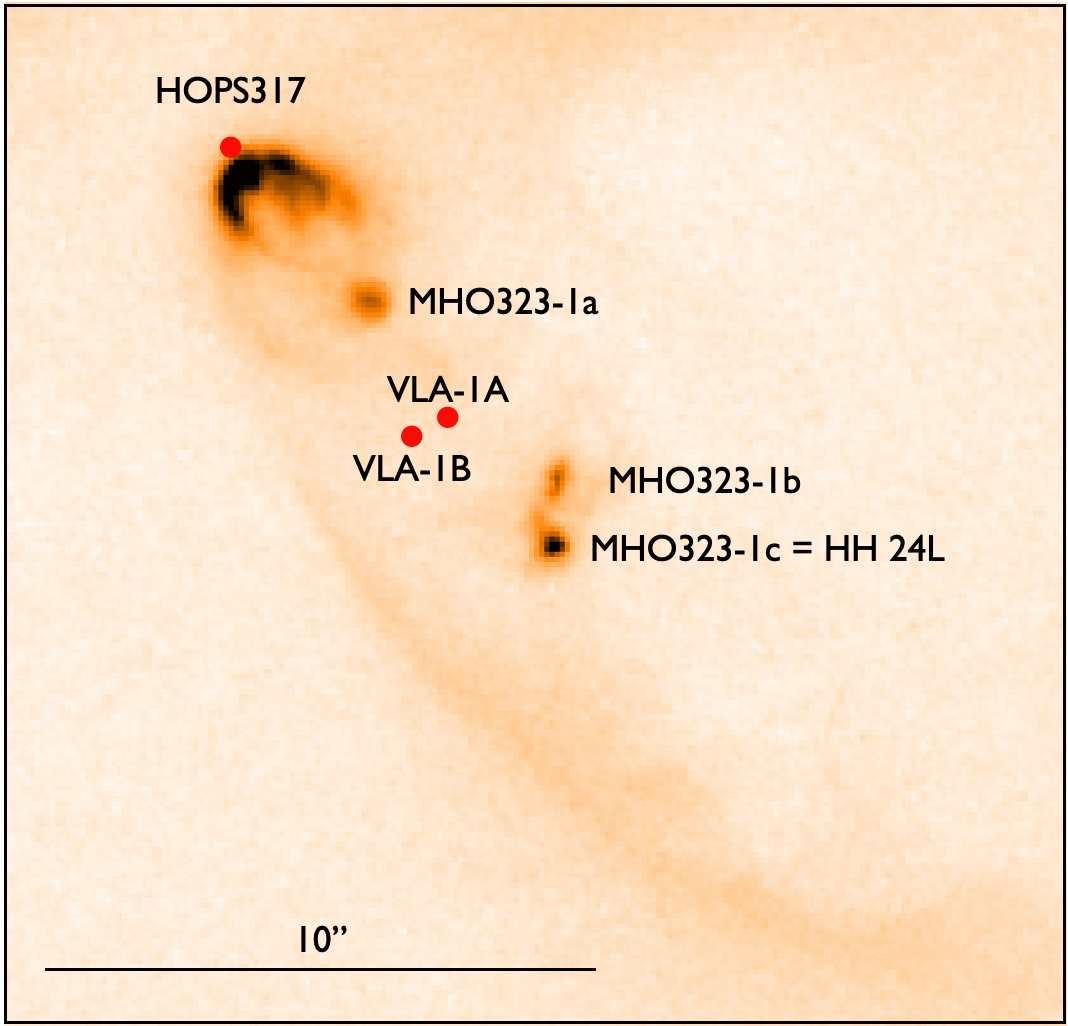
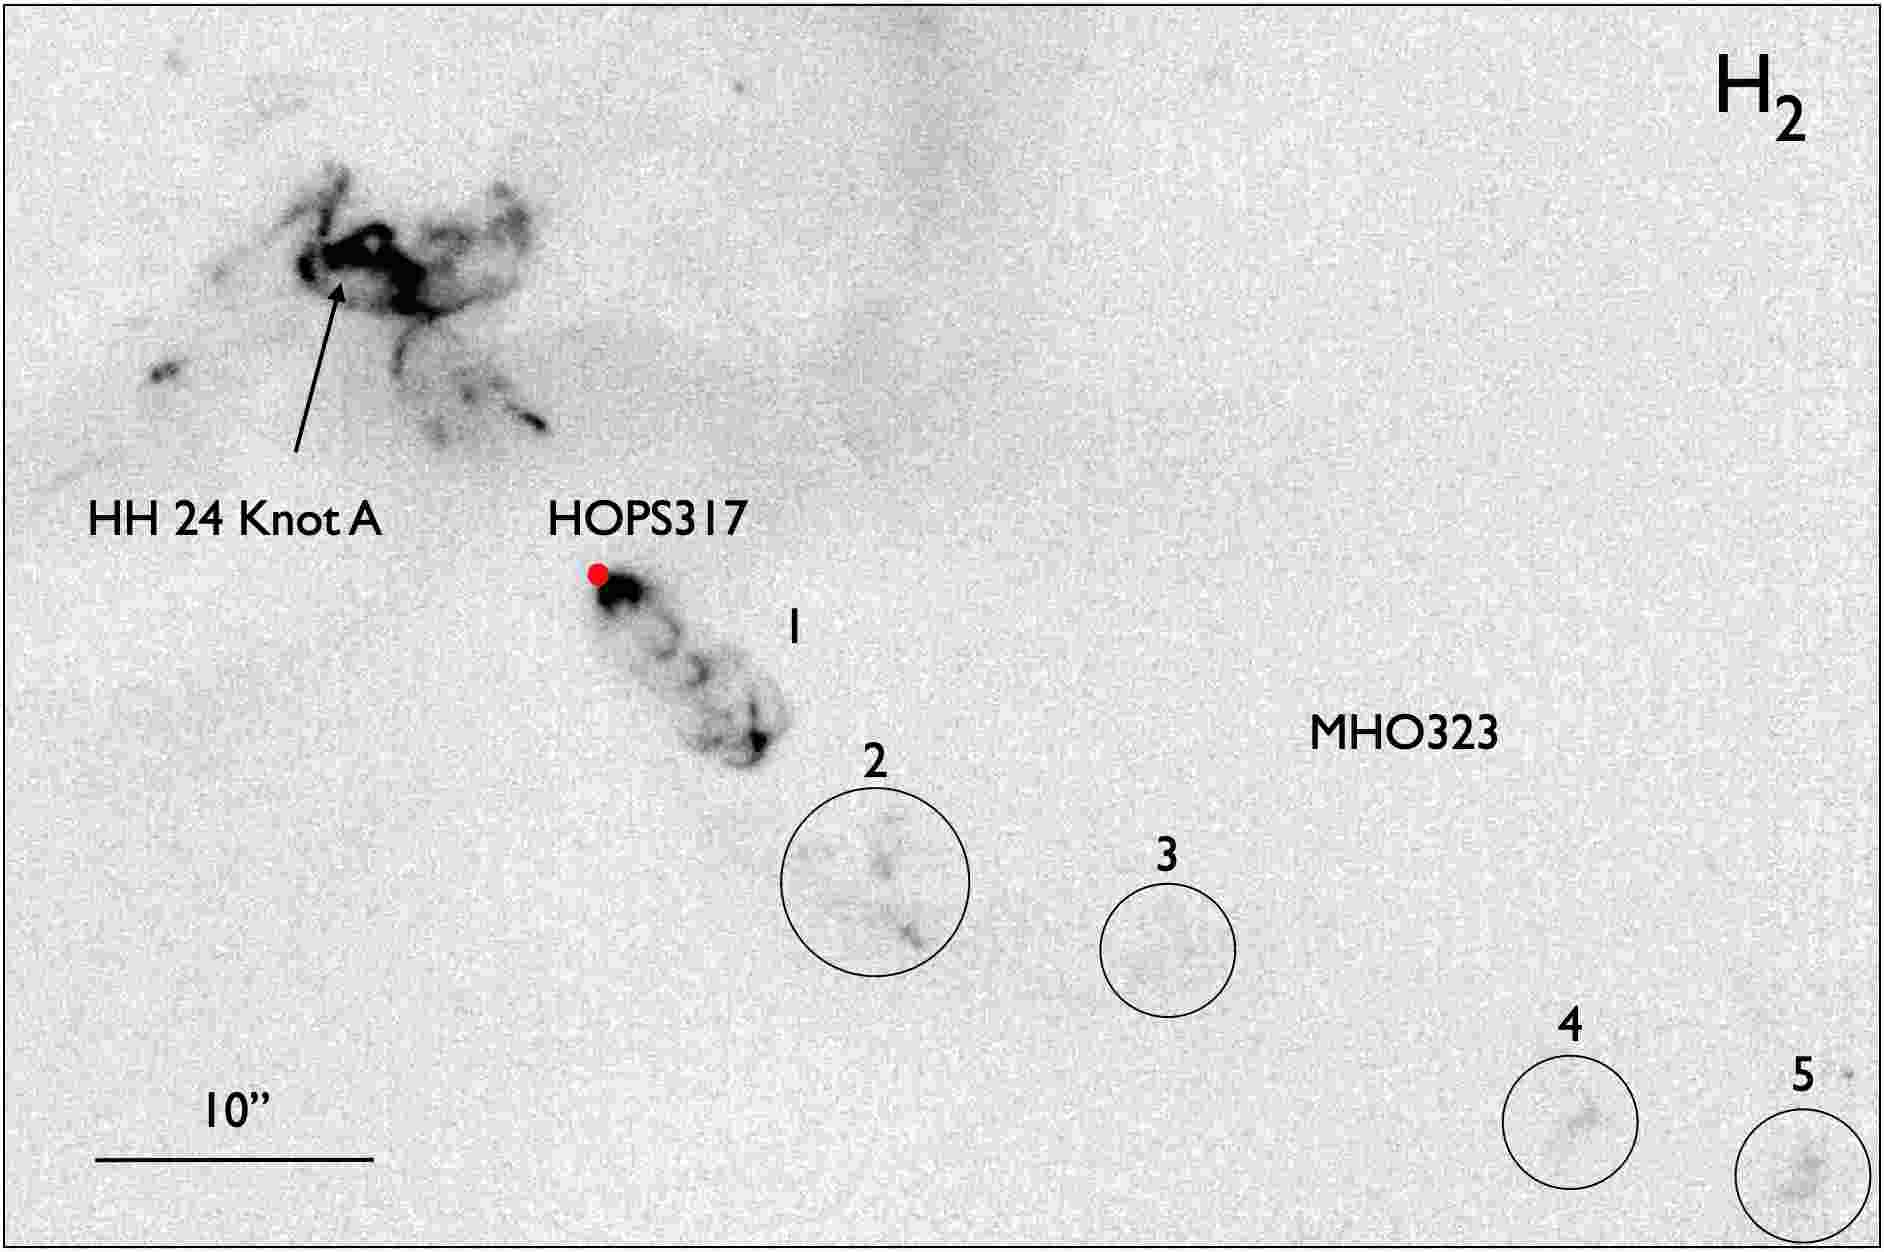
Figure 29 shows an infrared image obtained with WFC3 on HST through a [Feii] 1.64 m filter. The image shows an illuminated outflow cavity with a bright apex opening out from HOPS 317 and several emission-line knots, the brightest of which is an optically visible Herbig-Haro knot here designated HH 24L. The HH object is located 9″ from HOPS 317, which at a distance of 400 pc corresponds to a projected separation of 3600 AU. If the flow moves with a tangential velocity of about 100 km s-1, typical of HH flows, then it was ejected from this source 170 years ago.
Figure 30 is an image in the H2 1-0 S(1) line at 2.12 m of the same region, which shows that the HH 24L flow from HOPS 317 is much more pronounced in H2 near the source, showing a chain of small nested bow shocks and a series of more distant knots, with additional knots apparent in Figure 17. The molecular hydrogen flow emanating from HOPS 317 is known as MHO 323 and we here extend the notation to the four fainter outflow components.666The MHO catalog is maintained by Dirk Froebrich and is available at http://astro.kent.ac.uk/df/MHCat and is described in Davis et al. (2010) It is noteworthy that the position angles of the four outermost knots steadily increase with distance from HOPS 317, suggesting precession of the source and indicative of a close binary companion. Alternatively the flow may be deflected near knot 2.
In the opposite direction, several H2 knots are seen along the principal flow axis, including a bow shaped H2 structure that is intertwined with the bright HH 24A knot located on the HH 24E flow axis. As discussed in Section 6.2, it appears that HH 24A represents, at least partially, the collision of a flow from HOPS 317 with a stationary cloud.
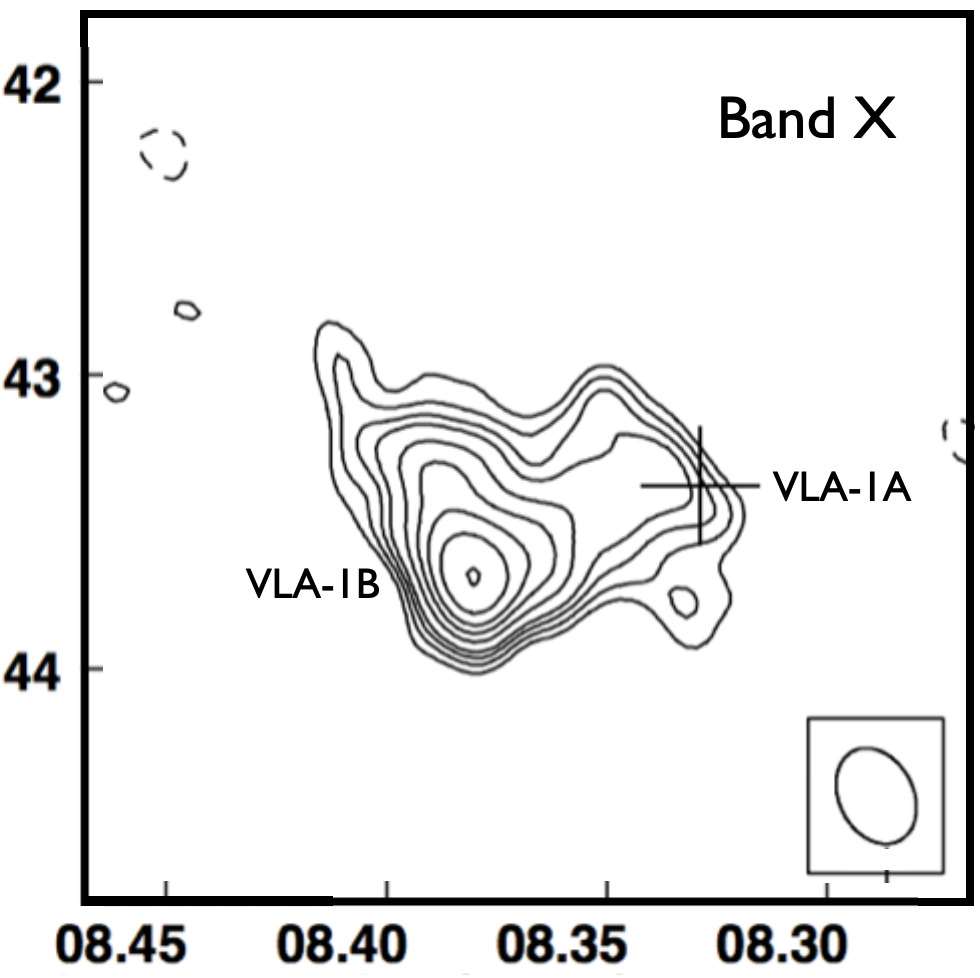
We have carried out the hitherto deepest and highest resolution observations of the HH 24 MMS region with the Karl G. Jansky Very Large Array at 10.0 GHz (X band) and 44.0 GHz (Q band), see Section 2 for details. Figure 31 shows the Band-X map revealing an extended highly structured nebula. The VLA position obtained by Reipurth et al. (2002b), marked with a cross and labeled VLA-1A, is 0.8 arcsec from the peak of the new observations, labeled VLA-1B.
These observations can be understood in several ways:
a: The morphology seen in Figure 31 is reminiscent of a bow shock pointing back towards the SSV 63W sources about 40 arcsec to the NNW. If the radio continuum emission is due to shocks it is most likely free-free emission (e.g., Rodríguez et al. 1999), in which case the shift of the peak emission from 2000 to 2019 could be flickering of the shocks, as seen in many HH objects (e.g., Raga et al. 2016a). However, if the shock originates in SSV 63W, it would be a remarkable coincidence that it happens to coincide with a bright embedded submm source.
b: Alternatively, the shocks may be local, driven by outflow from the submm source. However, the extended emission has a spectral index between 9.0 and 11.0 GHz of 2.91.2, which seems too steep for free-free emission, in particular because for diffuse emission one expects an optically-thin flat spectrum. The index between 10 and 44 GHz has a value of 2.90.1, confirming the steepness (Table 5).
c: The shift in position may be due to motion of the source. The two positions are measured 18.75 years apart, indicating a projected velocity of 15 km s-1. Such a high velocity would require the source to have been ejected from a small multiple system, but no other sources are found near HH 24 MMS from the presumed direction of motion.
d: It is conceivable that HH 24 MMS is a binary with a separation of 0.8 arcsec, corresponding to a projected separation of 320 AU. Such binaries are common among young stars. If so, the components could be variable, as is sometimes seen in young radio continuum sources (Anglada et al. 2018). In 2000 the western source would have been the brighter of the two, while in 2019 the eastern source was brighter.
e: Finally, HH 24 MMS may be irradiating its near environment, and the extended 3.6 cm emission could be dust heated by radiation from the submm source. Circumstellar material close to the source could obscure the light and create a lighthouse effect, and if the dust grains are small the heating and cooling would be rapid and thus variable. The diffuse low-level emission seen in Figure 31 from the deep 2019 observations would seem to favor such an interpretation.
None of the above scenarios can be firmly rejected, although some are more unlikely than others. We conclude that variable heating of dust is the most likely explanation of the observations.
HOPS 317 and HH 24 MMS are separated by 5, corresponding to 2000 AU in projection. They are currently bound to their host core, but as they accrete mass and the core shrinks it is likely that they eventually become bound as a binary with a shrinking orbit due to dynamical friction (e.g., Stahler 2010, Sadavoy & Stahler 2017). It is conceivable that, in the future when the cloud disperses, HOPS 317 and HH 24 MMS will become bound to the SSV 63 multiple, thus forming a wide multiple system, not unlike the well known wide high-order multiple system of Mizar and Alcor (Mamajek et al. 2010).
8 KINEMATICS OF NEARBY LOW-MASS STARS AND BROWN DWARFS
As we will discuss in Section 10, the stars in the SSV 63 system have significant masses, between 0.9 and 2.1 M⊙. With such massive members one would expect to find a large number of low-mass objects if the initial mass function is close to normal. However, the only potential low-mass objects are the components S (Section 5.1) and N (Section 10). In view of this disparity we have carried out a deep slitless grism survey using GMOS on the Gemini-N telescope to search for faint H emission stars in the area of SSV 63, for details see Section 3. H emission was detected in only 5 stars, marked as H 1-5 in Figure 32, and with coordinates and near- and mid-infrared photometry in Table 3. Fang et al. (2009) obtained low-resolution spectra of 4 of these sources, and our results concur with theirs. We find that H 1 is a CTTS with spectral type M3.5, H 2 is a strong-lined brown dwarf with spectral type M7, H 3 is a CTTS with spectral type M4.5, H 4 is a WTTS with spectral type M4.5, and H 5 is a WTTS borderline brown dwarf with spectral type M5.5. Spectra of the two objects with the latest spectral types are shown in Figure 33. All these five objects are optically faint red objects (Table 3).777Most of the sources discussed in this section, are listed as YSOs in Table 4 of Megeath et al. (2012) with the following IDs: Wa=3168, Ea=3167, NE=3169, H 1=3177, H 2=3176, H 3=3175, IRS 1=3170, IRS 2=3171. The sources Wb and Eb are not listed, probably because they could not be resolved from Wa and Ea, respectively. H 4 and H 5 are also not listed, probably because they are too faint for reliable photometry with Spitzer (they are, however, detected by WISE, see Table 3.)
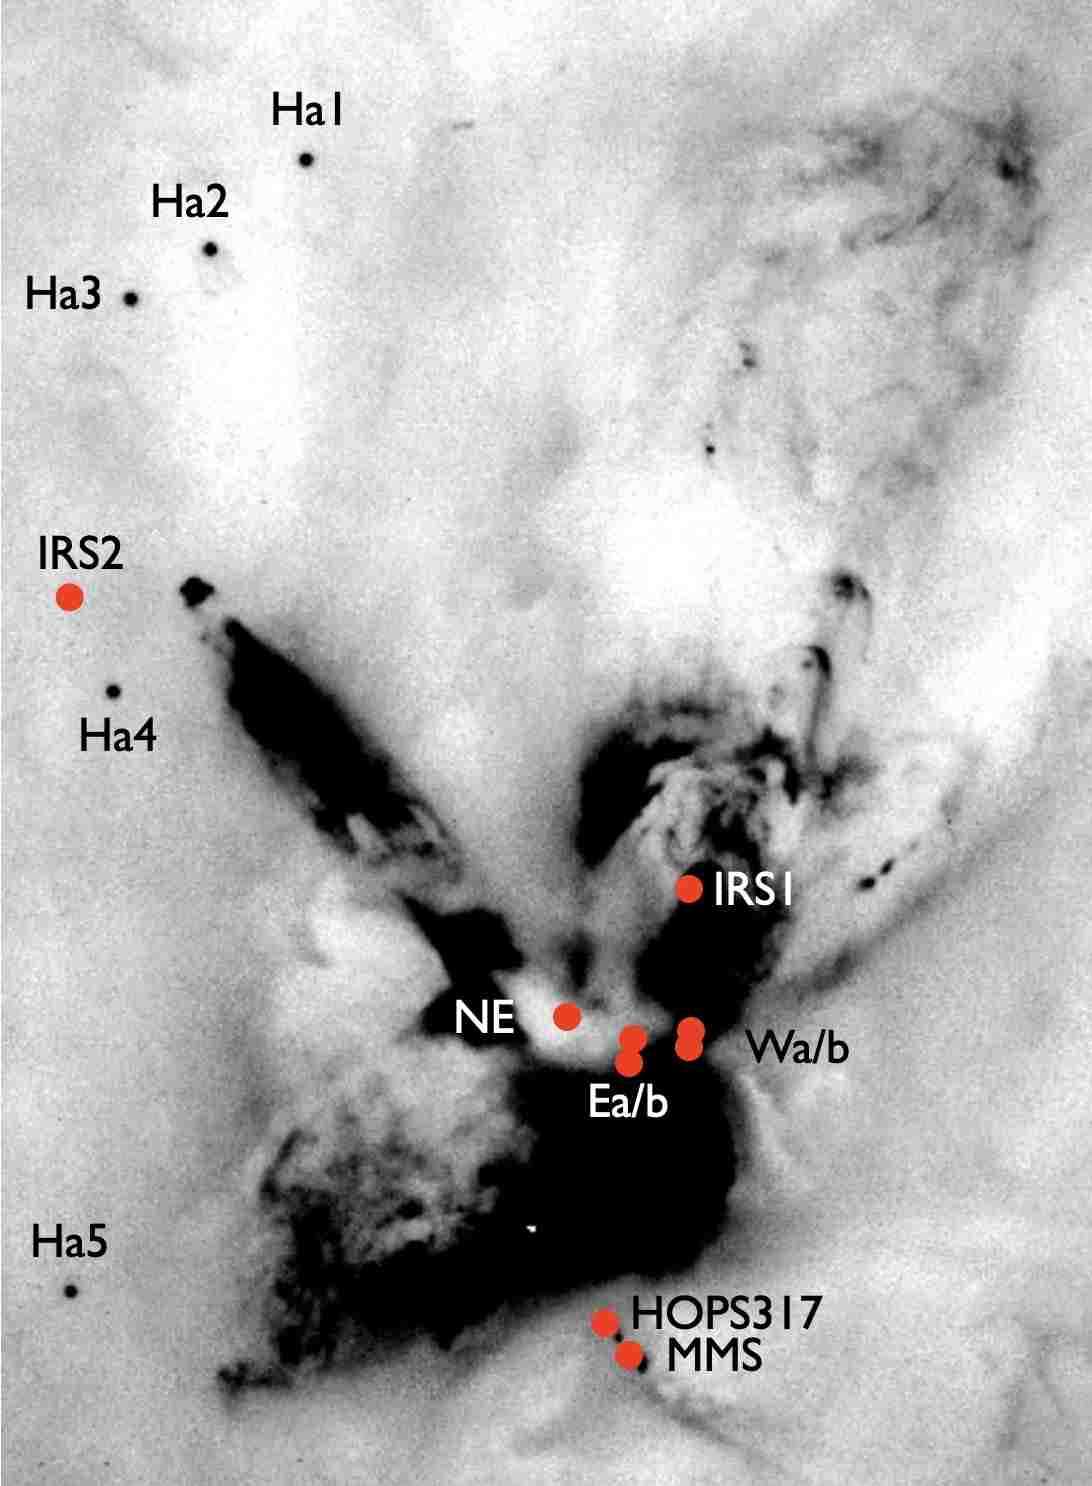
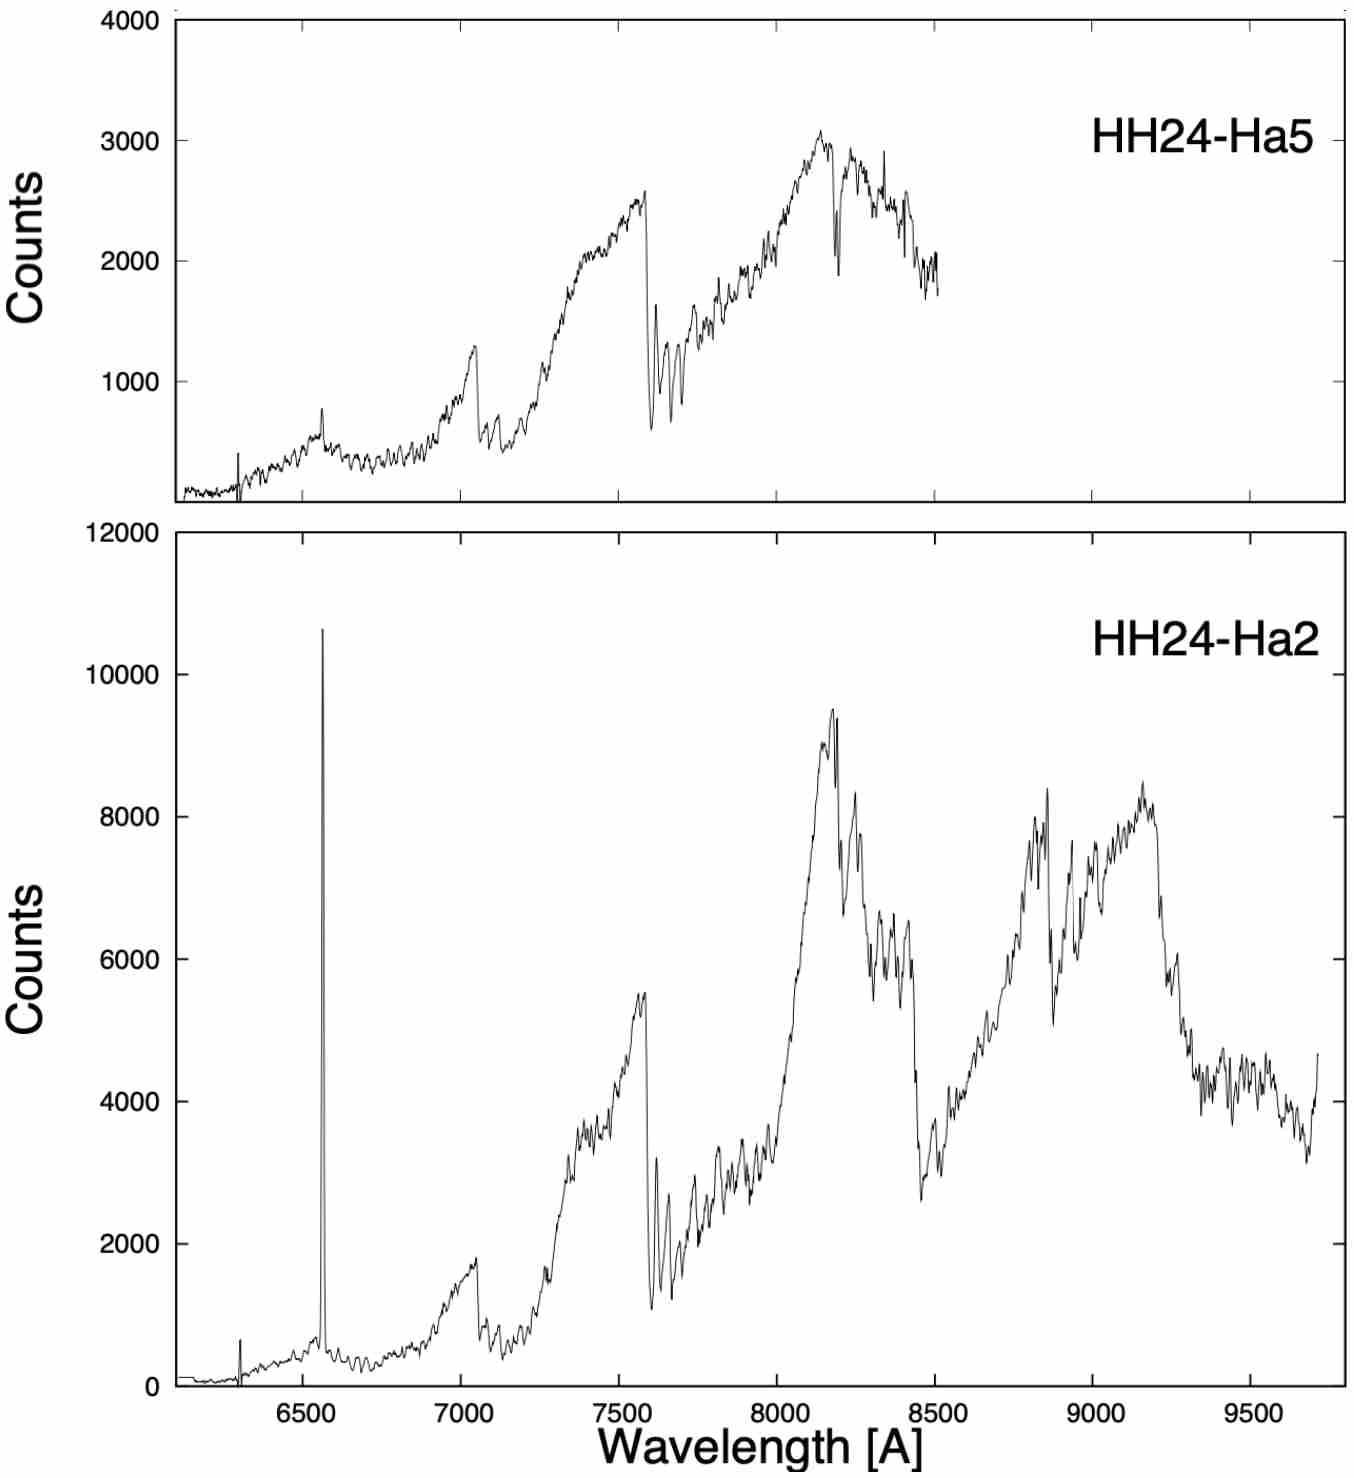
H 1 - 5 are located far from any of the dense cloud cores in the region (Figure 34), suggesting that they have traveled to their current locations from elsewhere. We have examined the Gaia EDR3 catalog, and find that Gaia has detected all of the five H emitters.
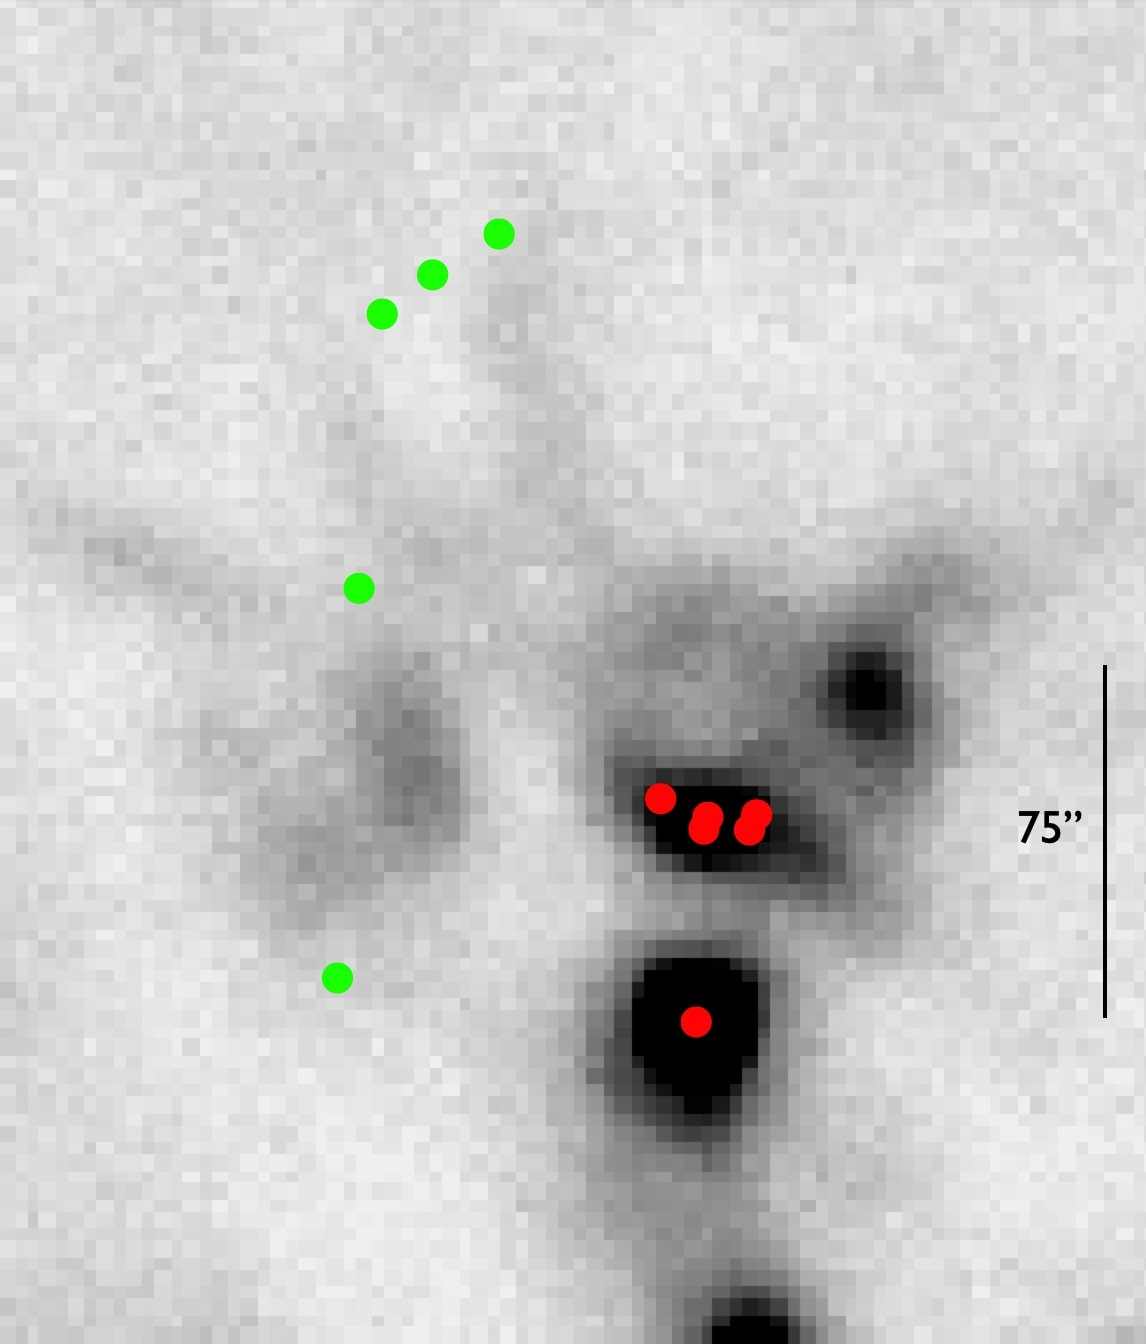
8.1 The Runaway Borderline Brown Dwarf HH24-H5
One object, H 5, immediately stands out because it has a very large, well determined proper motion determined in Gaia DR3 as 0.78390.0420 mas/yr in a reference frame determined by the motion of 129 YSOs in L1630 from Fang et al. (2009). This corresponds to a tangential velocity of = 26.11.4 km s-1 at the assumed distance of 400 pc. Recently a number of such low-mass runaway and walkaway stars have been found near the ONC (McBride & Kounkel 2019, Schoettler et al. 2020), who estimate that 1-2% of the cluster members they studied are runaway stars. What is particularly interesting about H 5 is that its proper motion vector, with a position angle of 121∘, points directly away from the HH 24 cloud core (Figure 35). One member of the SSV 63 multiple system, source NE, is located within a 2 uncertainty cone around the H 5 trajectory. It therefore appears very likely that H 5 was ejected from source NE about 5800 yr ago. If so, it implies that either NE or H 5 is a close binary.888It should be noted that there is another, more distant, star marginally within the uncertainty cone, namely the source labeled IRS 1 in Figure 35, also known as WISE J054607.76-000937.7. It is a highly extincted YSO showing a mid-infrared excess.
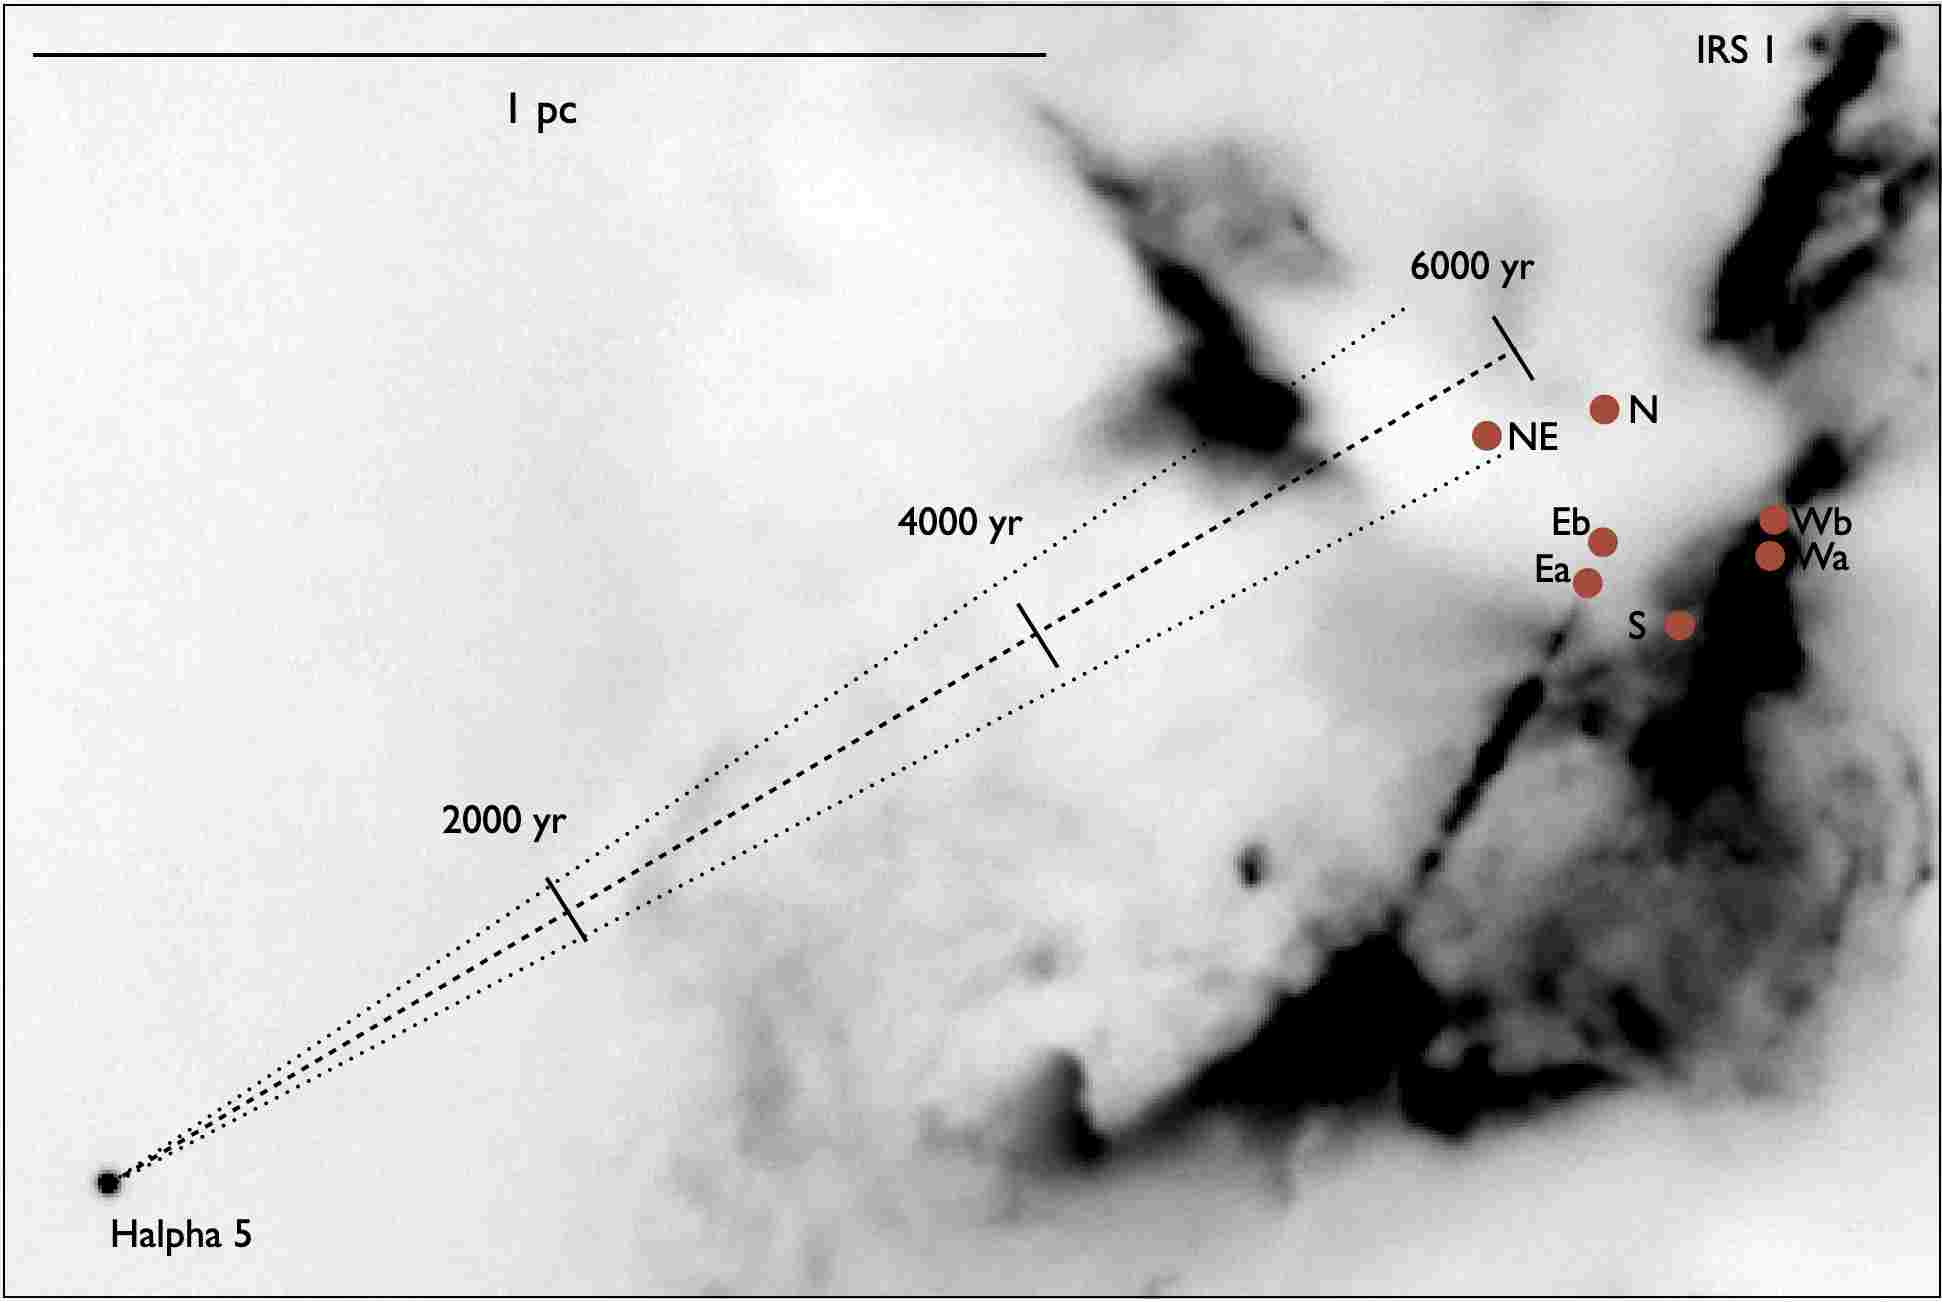
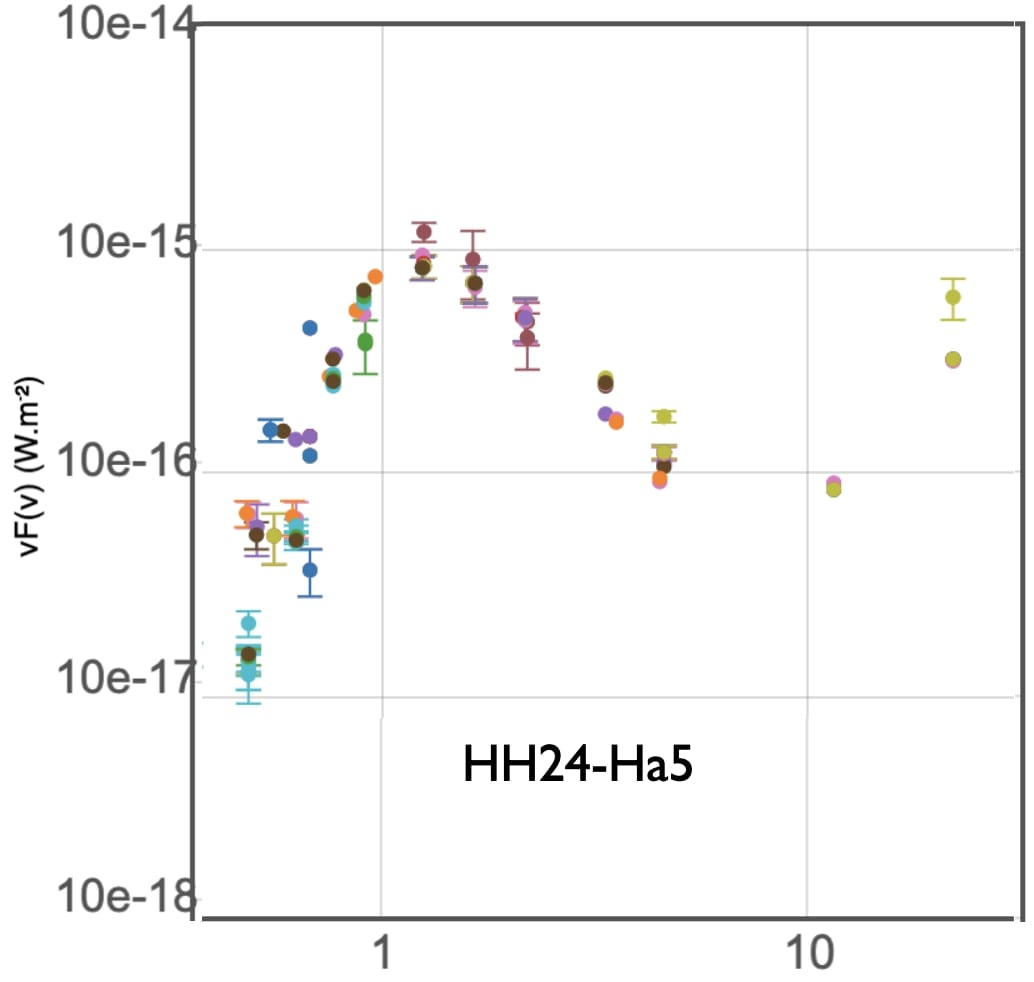
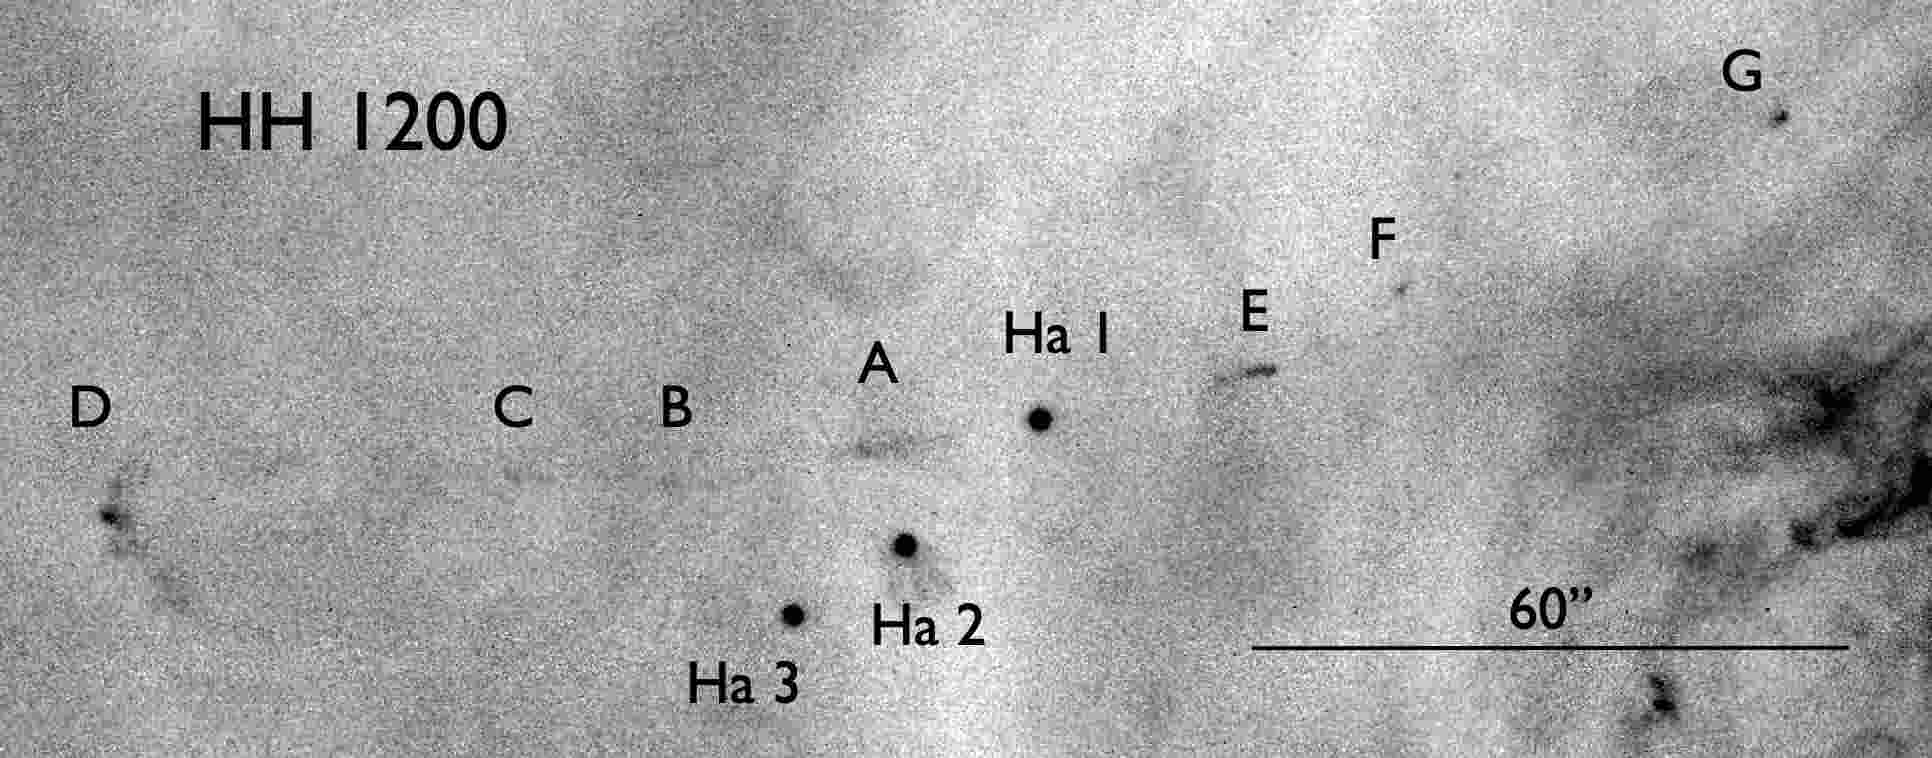
Source NE is a protostellar object, so if H 5 was once part of a triple system including NE, it follows that it is itself also a protostellar object. Reipurth et al. (2010) posited that dynamical breakups during the embedded phase could produce optically visible low-mass orphaned protostars drifting away from their birthsites. H 5 appears to be a fine case of such an orphaned protostar. The escape velocity from a 10 M⊙ core of gas and stars (see Section 9) is about 1.5 km s-1, and it follows that H 5 is escaping from the system.
The spectral class to effective temperature conversion established by Herczeg & Hillenbrand (2014) indicates that a spectral type of M5.5 corresponds to an effective temperature of about 2900 K. The evolutionary models of Baraffe et al. (2015) show that this is very close to the temperature for a 1 million year old object at the hydrogen-burning limit. So is H 5 a brown dwarf? Unfortunately the uncertainties involved are too large to allow a firm answer. First, even though both our spectrum and that of Fang et al. (2009) agree on the spectral classification, a much higher spectral resolution would be needed for a more accurate classification. Second, for models at 1 Myr or younger, the sensitivity to initial conditions is significant, and the accretion history of an object adds further uncertainty. Third, the temperature of about 2900 K determined for a 1 Myr old object at the hydrogen burning limit is model dependent. Taken together, the best that can be said is that H 5 hovers right around the stellar/substellar boundary.
Figure 36 shows the spectral energy distribution of H 5. At wavelengths out to 5 m it follows a Planck curve, but the WISE 12 and 22 m data points show a strong mid-infrared excess. The indication is that H 5 is having circumstellar material, but is missing an inner disk, thus resembling a transitional disk. Reipurth & Clarke (2001) suggested that brown dwarfs ejected in a triple interaction would lose some of their disks in the process, ending up with truncated disks, which was confirmed in a detailed numerical study by Umbreit et al. (2011), see also Steinhausen et al. (2012). It is conceivable that the disk around H 5 is in the process of re-assembling after being perturbed during the ejection.
| Star | PM() | PM() | Vtana | PAa |
|---|---|---|---|---|
| mas/yr | mas/yr | km s-1 | deg | |
| H 1 | -0.711 1.255 | -0.556 0.901 | 0.5 2.9 | 313.9 |
| H 2 | 1.175 0.302 | -0.048 0.249 | 3.5 0.7 | 67.8 |
| H 3 | 0.544 0.535 | -0.392 0.438 | 2.1 1.3 | 71.8 |
| H 4 | -3.438 0.437 | -3.094 0.368 | 7.1 1.1 | 231.1 |
| H 5 | 11.176 0.560 | -7.949 0.476 | 26.1 1.4 | 121.6 |
Note. — a: For calculation of space motion and position angle, the Gaia EDR3 proper motions listed in this table were corrected for the bulk motion of the L1630 cloud ( -0.519, -0.741) determined from Gaia proper motions of 129 YSOs associated with the cloud.
8.2 Other H Emission Stars and Infrared Sources
Gaia EDR3 proper motions for the other 4 H emitters are given in Table 9. As can be seen, none of the objects have particularly high velocities, and none are pointing directly away from the SSV 63 multiple system. Thus none are runaway or walkaway stars. However, the SSV 63 cloud core is the nearest high-density region to these young stars, so they could have been born in the core and drifted away, perhaps nudged along by the more massive stars. Assuming an approximate projected separation of about 100 from SSV 63 and a mass of stars and cloud core of about 10 M⊙, the orbital speed of a bound object is around 0.5 km s-1, so at least some of these H emission stars may be weakly bound to the SSV 63 system. That the velocity vectors do not point away from SSV 63 could be due to the highly irregular mass distribution of stars and gas in the region. Future Gaia releases will improve on the accuracy of proper motions for these very faint objects. Two are worthy of some comments.
H 1 is associated with a very faint, but highly collimated HH flow, here called HH 1200. Figure 37 is a part of our deep Subaru H image and shows that HH 1200 is a bent jet, with two symmetric lobes, the eastern (containing knots A,B,C, D) with a length of 81 arcsec (0.16 pc) and the western (knots E, F, G) with a length of 93 arcsec (0.18 pc). The eastern lobe terminates in knot G, which has a clear bow shock morphology. HH 1200 is much brighter in H than in [Sii], and is thus a high-excitation flow.
H 2 has a spectral type of M7, and for an assumed age of 1 Myr, its spectral type indicates that it is a very young brown dwarf (see Figure 33). It is also very bright at mid-infrared wavelengths, suggesting the presence of circumstellar material. H 2 has been detected as an X-ray source with Chandra by Simon et al. (2004, their source #16), whereas none of the other 4 H emission stars were detected.
Among the numerous near- and mid-infrared sources detected in 2MASS, WISE, and Spitzer images in L1630, two sources close to SSV 63 should be mentioned. IRS 1 is a faint optically visible star, classified as a disk-bearing star in Megeath et al. (2012), but bright at near-infrared wavelengths (Figures 32 and 35). As we speculated in Section 6.4 it is potentially the driving source of two of the shocks in the G-jet. IRS 2, marked in Figure 32, also has a steeply rising energy distribution and is classified as a young star by Megeath et al. (2012). We note that it is a binary with a fainter companion 0.8 distant at PA = 325∘.
9 CORE MASS AND STAR FORMATION EFFICIENCY
The SSV 63 multiple system is located in a cloud core that is part of a north-south molecular ridge active in star formation in the Orion-B cloud. The region has been studied in various transitions including CO, C18O, CS, and HCO+ by Gibb & Heaton (1993), Gibb et al. (1995), and Gibb & Little (1998). Sub-mm dust continuum observations of the region have been reported by Chini et al. (1993), Lis et al. (1999), and Kirk et al. (2016a,b). The molecular ridge has been sculpted by the many molecular outflows in the region (see Figure 1).
The cloud core in which SSV 63 resides is being torn apart by multiple jets, as seen at optical and infrared wavelengths in Figures 2 and 4, where the remnant of the core and associated outflow cavities are seen illuminated by the embedded sources. The core has also been significantly churned by the random motions of the stars in the non-hierarchical multiple system. If they are moving with characteristic velocities around 1 km s-1, stars like Ea and NE with 2 M⊙ will have a Bondi radius of 1800 AU and core crossing times of the order of 40,000 yr. Hence the stars will have traversed the core maybe a dozen times or more since their formation.
Könyves et al. (2020) used the Herschel Gould Belt Survey of the Orion B cloud to study the numerous cores in this complex. By combining PACS 70 and 160 m and SPIRE 250, 350, and 500 m data they were able to derive not only column densities but also dust temperatures. Their core #1025 corresponds to the HH 24 core for which they determine a mean core radius of 0.019 pc (diameter 20 arcsec), a dust temperature of 16.3 K, and a core mass of 2.31 M⊙.
The 850 m map of the SSV 63 cloud core by Kirk et al. (2016a,b), see Figure 34, shows clearly that the core is better described as an ellipse, which we fit with semi-minor and semi-major axes of 12.4″ 31.6″ at a PA=70∘. This area produces a 850 m flux of 1.737 Jy. Using the Tdust = 16.3 K of Könives et al. and using the mass formula of Lane et al. (2016, their Eqn 1) then yields a current mass of 3.3 M⊙, which we adopt here. Given the various uncertainties involved, this is probably accurate to within a factor of two.
Assuming that the masses of all the components of SSV 63 stars adds up to roughly 7 M⊙ (see Section 10), we can in principle estimate the star formation efficiency of the cloud core. If we further assume that the original core mass is the current mass plus the mass of the stars born in the core, that is, of the order of 10 M⊙, we obtain a very high star formation efficiency. It makes little difference that the mass lost in outflows from the stars has not been included, as it is relatively small. But, more importantly, the core is not isolated from the surroundings and, as will be shown in Section 11.8, it appears that the core is being continually fed gas from its environment. One possible scenario is that the initial small starburst that has taken place in the HH 24 core may have been triggered by infall of gas onto the core, and has continued at the rate that gas has become available, with source Eb being the most recent member of the small cluster. Whether star formation has proceeded in a static or a dynamic scenario, it appears that gas has been converted into stars at a high efficiency.
Eventually, as will be discussed later, the sources Ea and NE will emerge as young late-type Herbig Ae stars surrounded by a halo of loosely bound lower mass stars, as is frequently seen around Herbig Ae stars (Hillenbrand 1995, Hillenbrand et al. 1995). Testi et al. (1997) found that the clustering of YSOs around Herbig Ae/Be stars depends on their mass, with Be stars having significantly richer environments than Ae stars; in their sample of 6 Herbig Ae stars the mean number of components was 4.
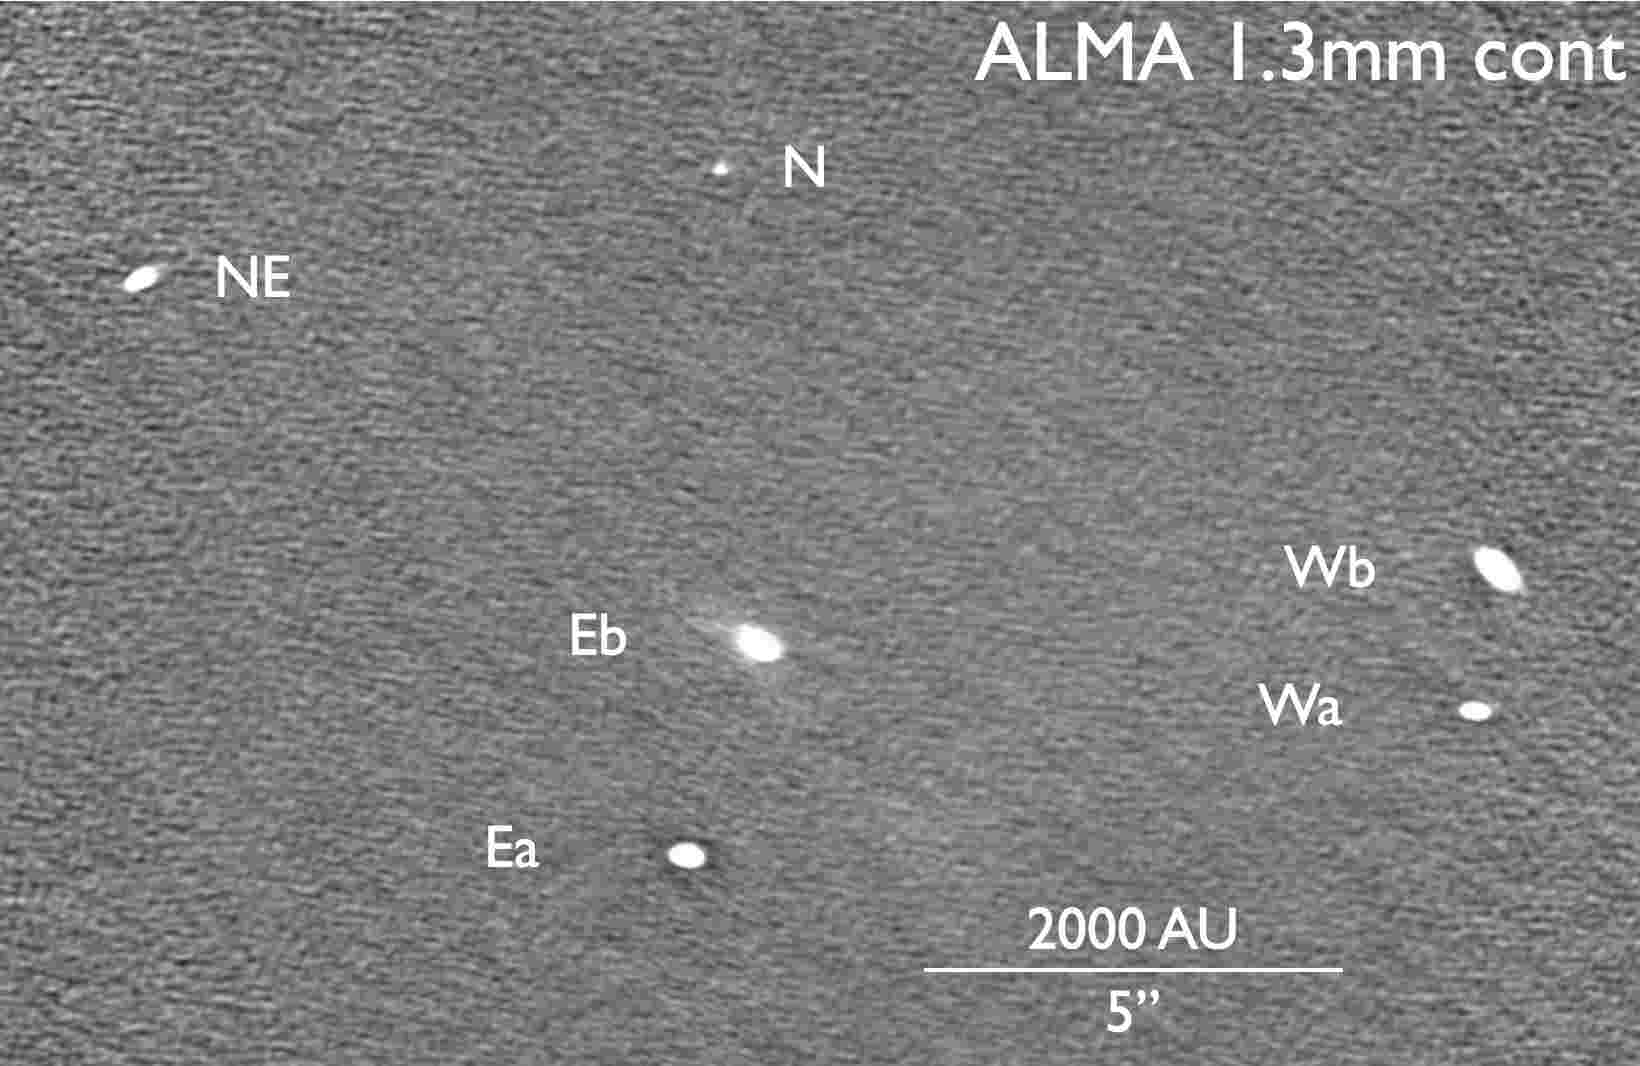
10 ALMA 1.3 MM OBSERVATIONS OF CIRCUMSTELLAR DISKS
10.1 Continuum emission
Six continuum compact sources were detected with our ALMA observations at 1.3 mm (Figure 38). These are the five sources Ea, Eb, Wa, Wb, and NE, as well as the new source N (Section 5.4). Source S was not detected by ALMA. A two-dimensional Gaussian function was fitted to each continuum compact source, and the center, integrated flux, and deconvolved size were measured (Table 10). Only source N was not resolved. The total fluxes of the residuals after subtracting the fitted Gaussian functions from the observed maps are comparable to or less than the uncertainties of the fitted fluxes, although the observed continuum intensity distributions in source NE, Ea, Eb, and Wb cannot be well reproduced with a Gaussian function. It is noteworthy that the major axis of these resolved continuum sources is almost precisely perpendicular to the jets associated with them. In addition, in the sources NE, Ea, Eb, and Wb, the compact C18O emission coincident with the compact continuum emission is observed and shows a clear velocity gradient along the major axis of the continuum emission (Section 10.2). Thus, these compact continuum components likely trace the circumstellar disks around the protostars. The inclination angles of the circumstellar disks were estimated from the ratio of the major and minor axes of the continuum emission.
| Source | RA | Dec | Flux | PA | Major | Minor | Residual | ||
|---|---|---|---|---|---|---|---|---|---|
| (ICRS) | (ICRS) | (mJy) | () | (mas) | (mas) | (mJy) | |||
| NE | 05:46:08.921 | 00:09:56.11 | 13.01.4 | 129.31.2 | 1413 | 484 | 0.3 | 70.21.5 | 0.00.8 |
| Ea | 05:46:08.485 | 00:10:03.04 | 48.90.7 | 58.10.5 | 1091 | 661 | 1.7 | 52.90.4 | 1.70.3 |
| Eb | 05:46:08.427 | 00:10:00.50 | 11.70.7 | 238.72.4 | 44012 | 27914 | 1.9 | 50.71.9 | 3.10.3 |
| Wa | 05:46:07.854 | 00:10:01.30 | 14.21.0 | 74.91.4 | 962 | 422 | 0.2 | 63.91.3 | 1.70.5 |
| Wb | 05:46:07.836 | 00:09:59.59 | 49.20.7 | 223.10.3 | 2441 | 981 | 0.4 | 66.40.3 | 1.80.3 |
| N | 05:46:08.457 | 00:09:54.80 | 0.90.1 | 0.07 |
Note. — PA is the position angle of the major axis from north to east. Major and minor axes are the deconvolved FWHM widths. The fluxes in the residual maps were computed in an area of approximately twice of the apparent size of the continuum emission. is the inclination angle to the plane of the sky computed from the ratio of the major and minor axes. is the spectral index between 1.3 and 0.9 mm. Source N is not resolved and not detected at 0.9 mm. The uncertainty of includes the uncertainty of the absolute flux calibration of 10%.
The same region was also observed with ALMA at 0.9 mm in Tobin et al. (2020). Source N was not detected at 0.9 mm, and the other sources were detected and resolved with the ALMA 0.9 mm observations. The deconvolved orientations and sizes measured at 1.3 mm are consistent with those at 0.9 mm within the uncertainties. The spectral indices of these continuum sources between 0.9 and 1.3 mm were computed. Except for source Eb, all the continuum sources have spectral indices 2, suggesting that the continuum emission is optically thick. The 1.3 mm continuum emission in source Eb is likely optically thin, and the total (dust+gas) mass () of the circumstellar material around source Eb is estimated as
| (1) |
where is the distance, is the continuum flux at 1.3 mm, is the dust mass opacity, and is the Planck function at a temperature . at 1.3 mm is adopted to be 0.019 g-1 cm2 (Beckwith et al., 1990), which includes a gas-to-dust mass ratio of 100. is assumed to be 20–94 K. of 94 K was estimated from the stellar luminosity, which can be considered as an upper limit because the protostellar source was resolved to be a multiple system (Tobin et al., 2020). in source Eb was estimated to be 3–18 .
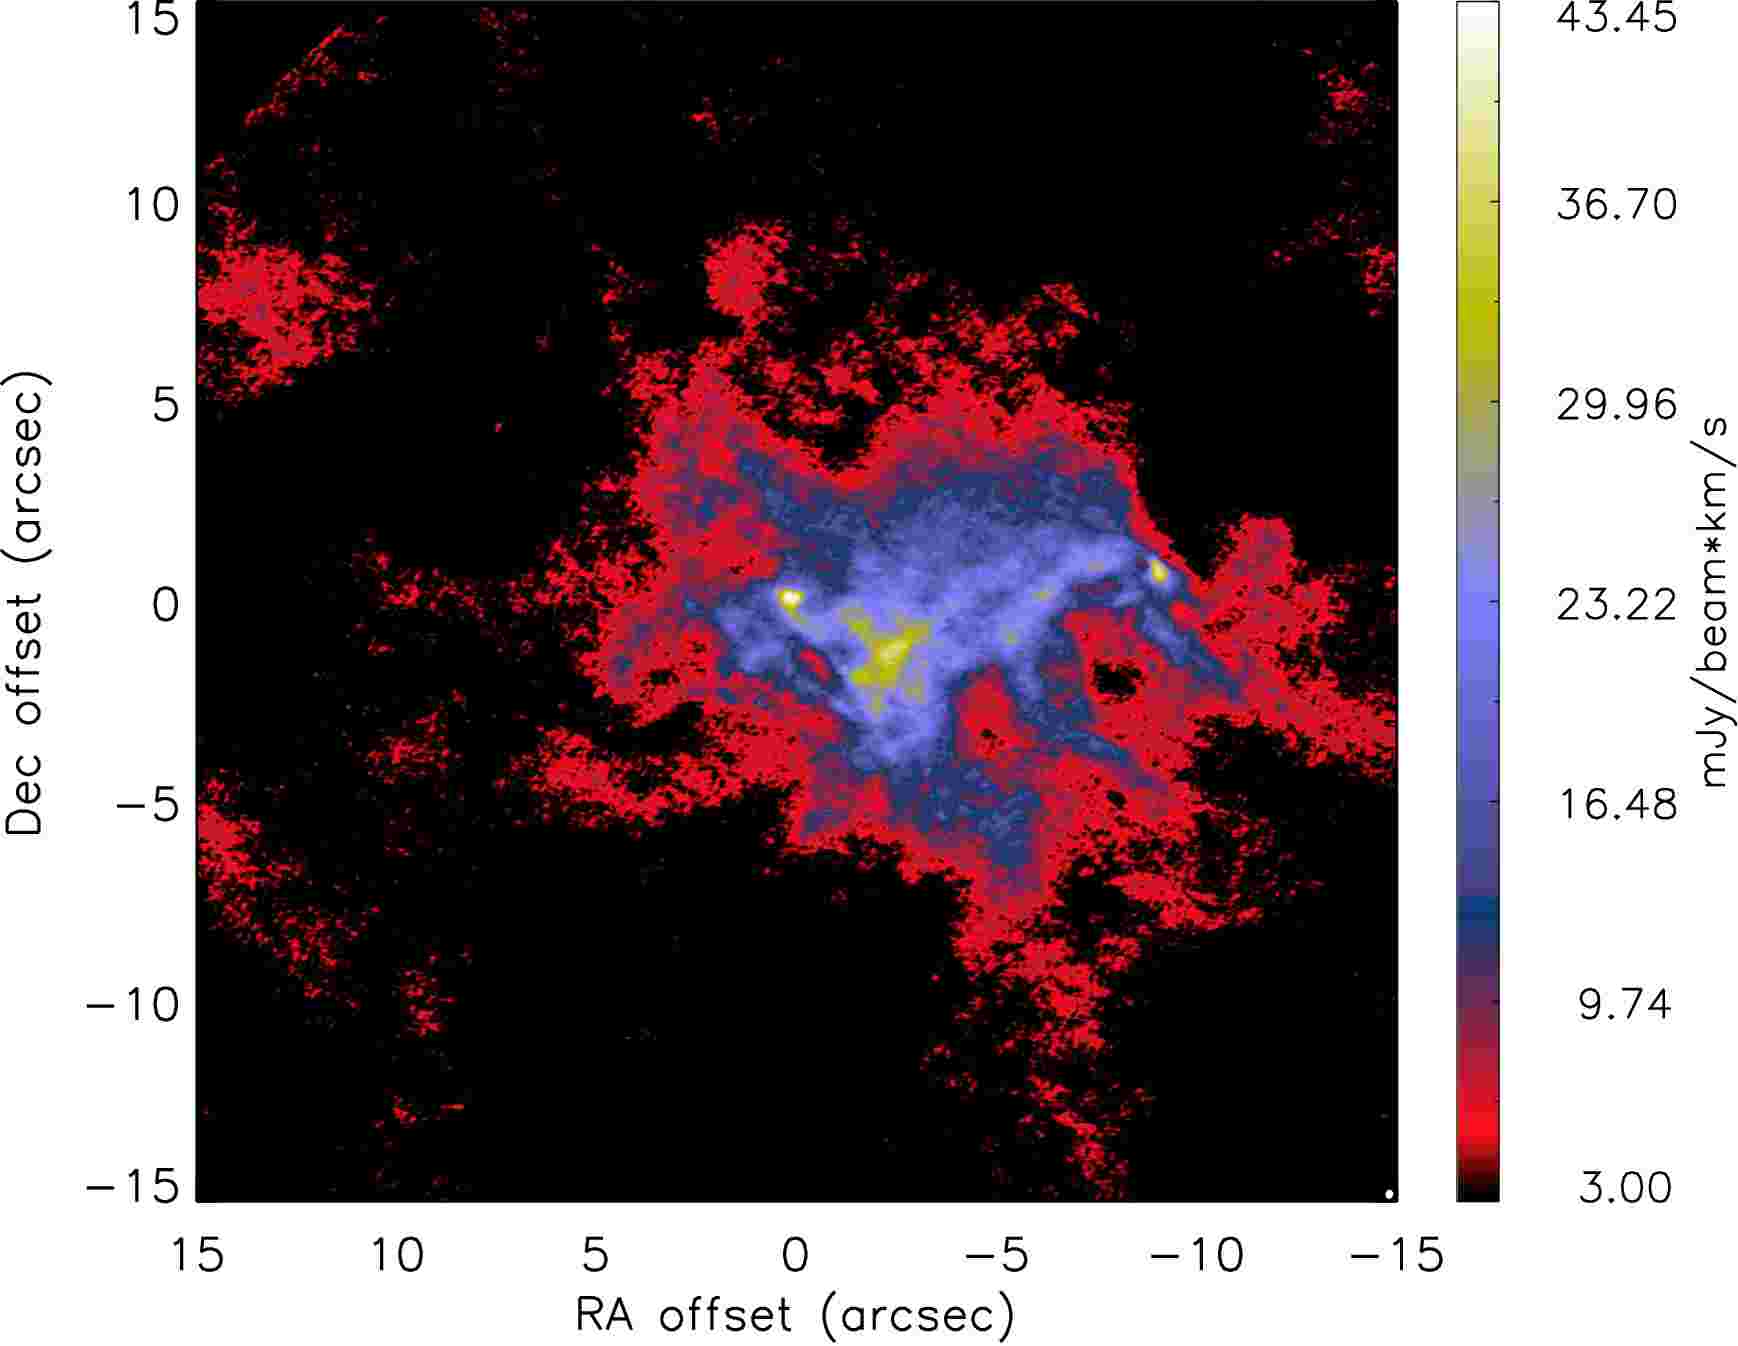
10.2 C18O (2–1) emission
Extended C18O emission associated with the large-scale clouds is detected at km s-1 (Figure 39). At higher velocities relative to the cloud velocity, compact C18O emission is seen around sources NE, Ea, Eb, and Wb. In these four sources, the high-velocity blue- and redshifted C18O emission is well aligned along the major axis of the continuum emission (Figure 40a, 41a, 42a, and 43a), which likely traces the disk rotation. We constructed kinematical models of a geometrically-thin Keplerian disk and performed fitting to the high-velocity C18O emission in sources NE, Ea, Eb, and Wb to measure stellar mass () and systemic velocity ().
Two disk models with different intensity profiles, Gaussian and power-law functions, were adopted. For each source, the center, orientation and inclination angle of the model disks were adopted from the continuum results (Table 10) and were fixed in our disk models. Thus, the free parameters in our disk models are , , and additional parameters to describe the intensity profiles (three and two parameters for the power-law and Gaussian profiles, respectively). The fitting was performed with the velocity channel maps, and only the velocity channels without significant extended C18O emission were included in the fitting. The velocity range for the fitting of each source is listed in Table 12. We generated velocity channel maps of the disk models, and convolved the model channel maps to the same beam sizes as the observed maps. Then, the residuals were calculated within a 1 region centered at the continuum peak after subtracting the model maps from the observed maps. We searched for the best-fit parameters by minimizing the residuals. We did not simulate ALMA observations and sample the uv coverage on the model channel maps because the disk sizes are smaller than the maximum recoverable angular scale of the observations.
| Source | |||||
|---|---|---|---|---|---|
| () | (au) | (au) | () | (km s-1) | |
| NE | 511 | 245 | 2.1 | 9.60.1 | |
| Ea | 391 | 161 | 2.00.1 | 9.60.1 | |
| Eb | 3–18 | 1594 | 332 | 1.30.1 | 10.80.1 |
| Wa | 351 | ||||
| Wb | 811 | 492 | 0.90.1 | 9.30.1 |
Note. — Except for Source Eb, the continuum disks are optically thick at 1.3 mm, so the disk mass cannot be estimated. The C18O fitting results with the Gaussian intensity profile are adopted here for comparison with the continuum disk size. The disk radius is defined as twice the 1 width of the best-fit Gaussian profile.
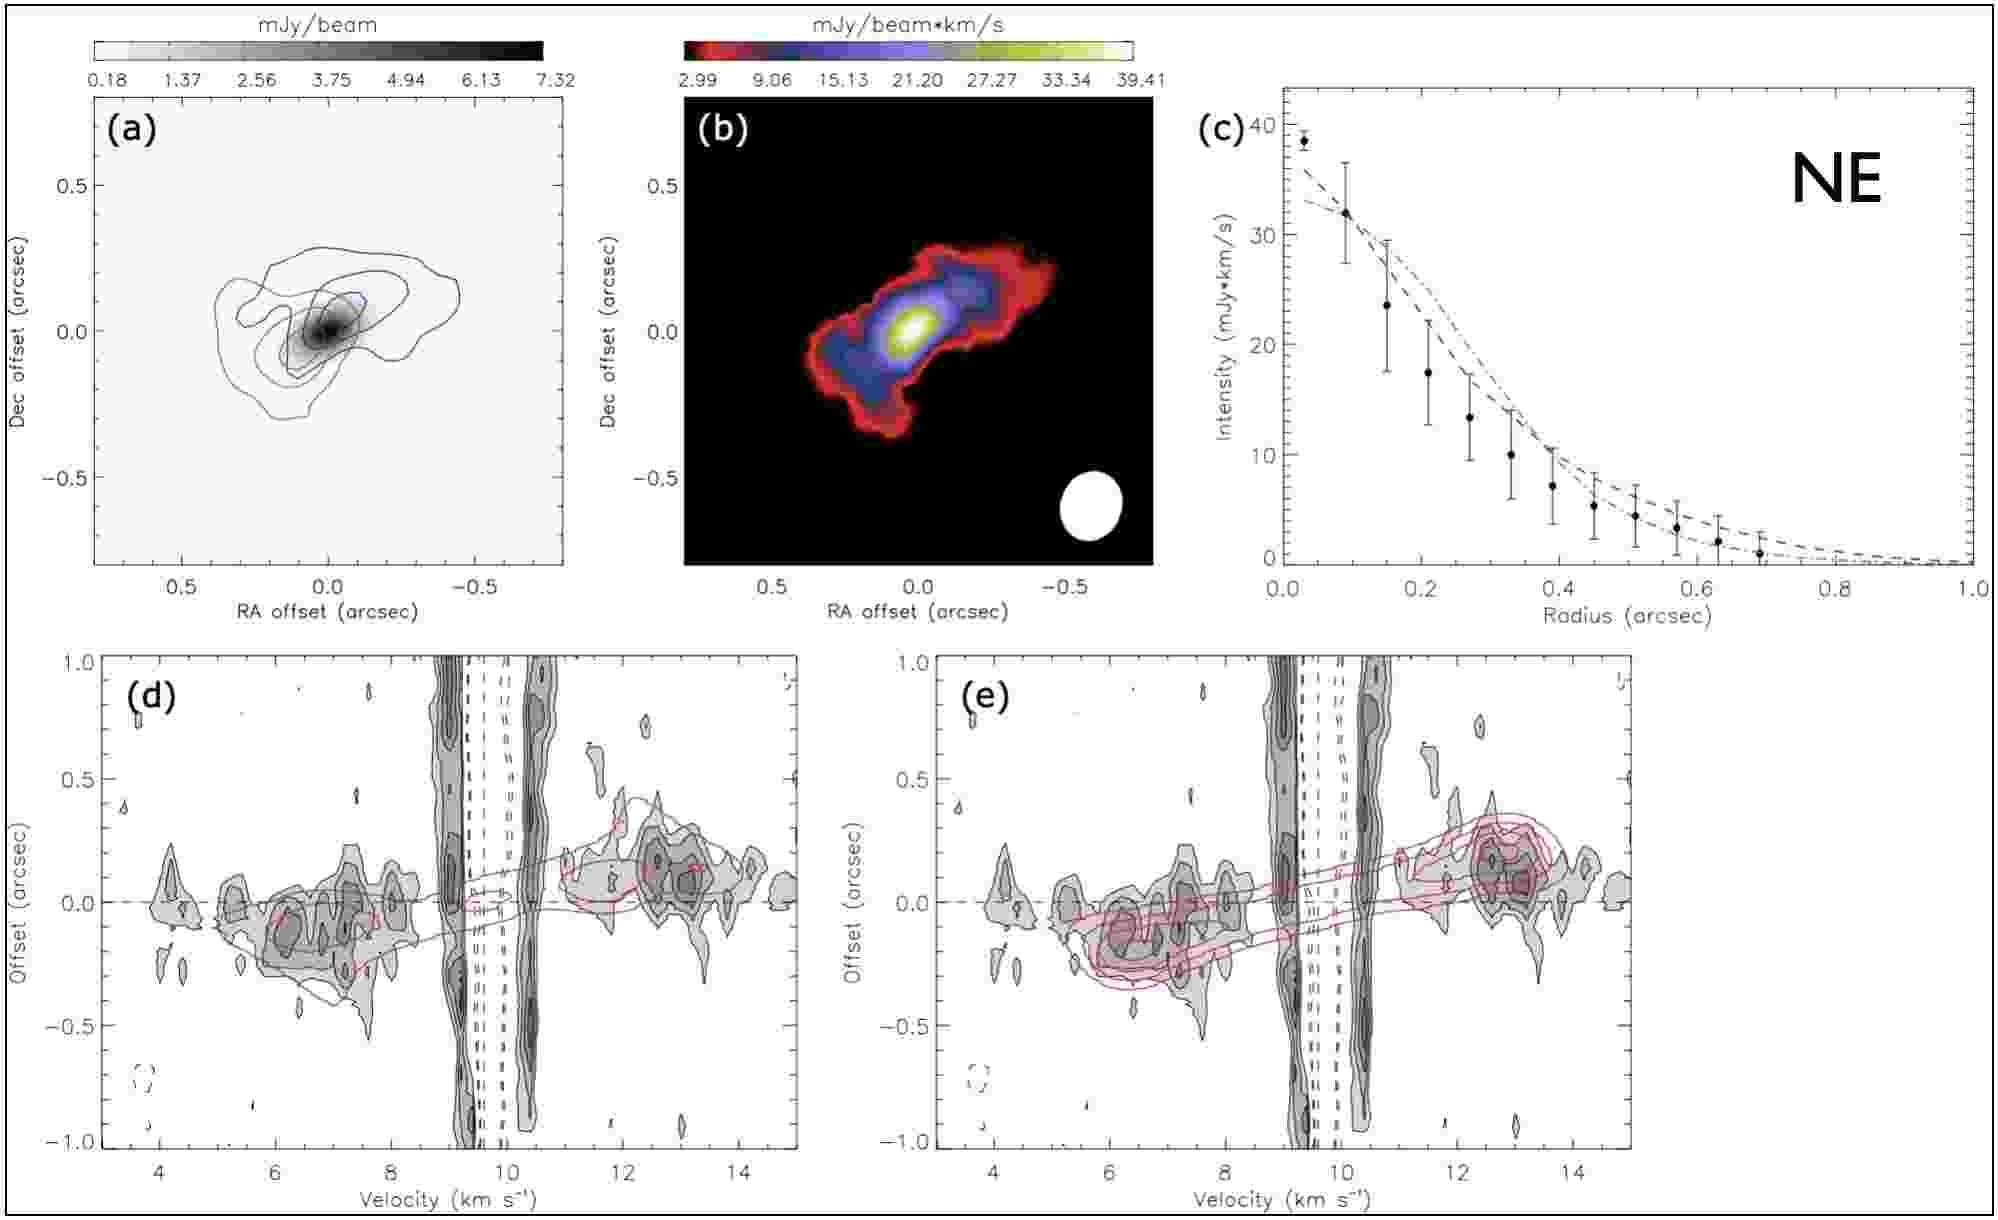
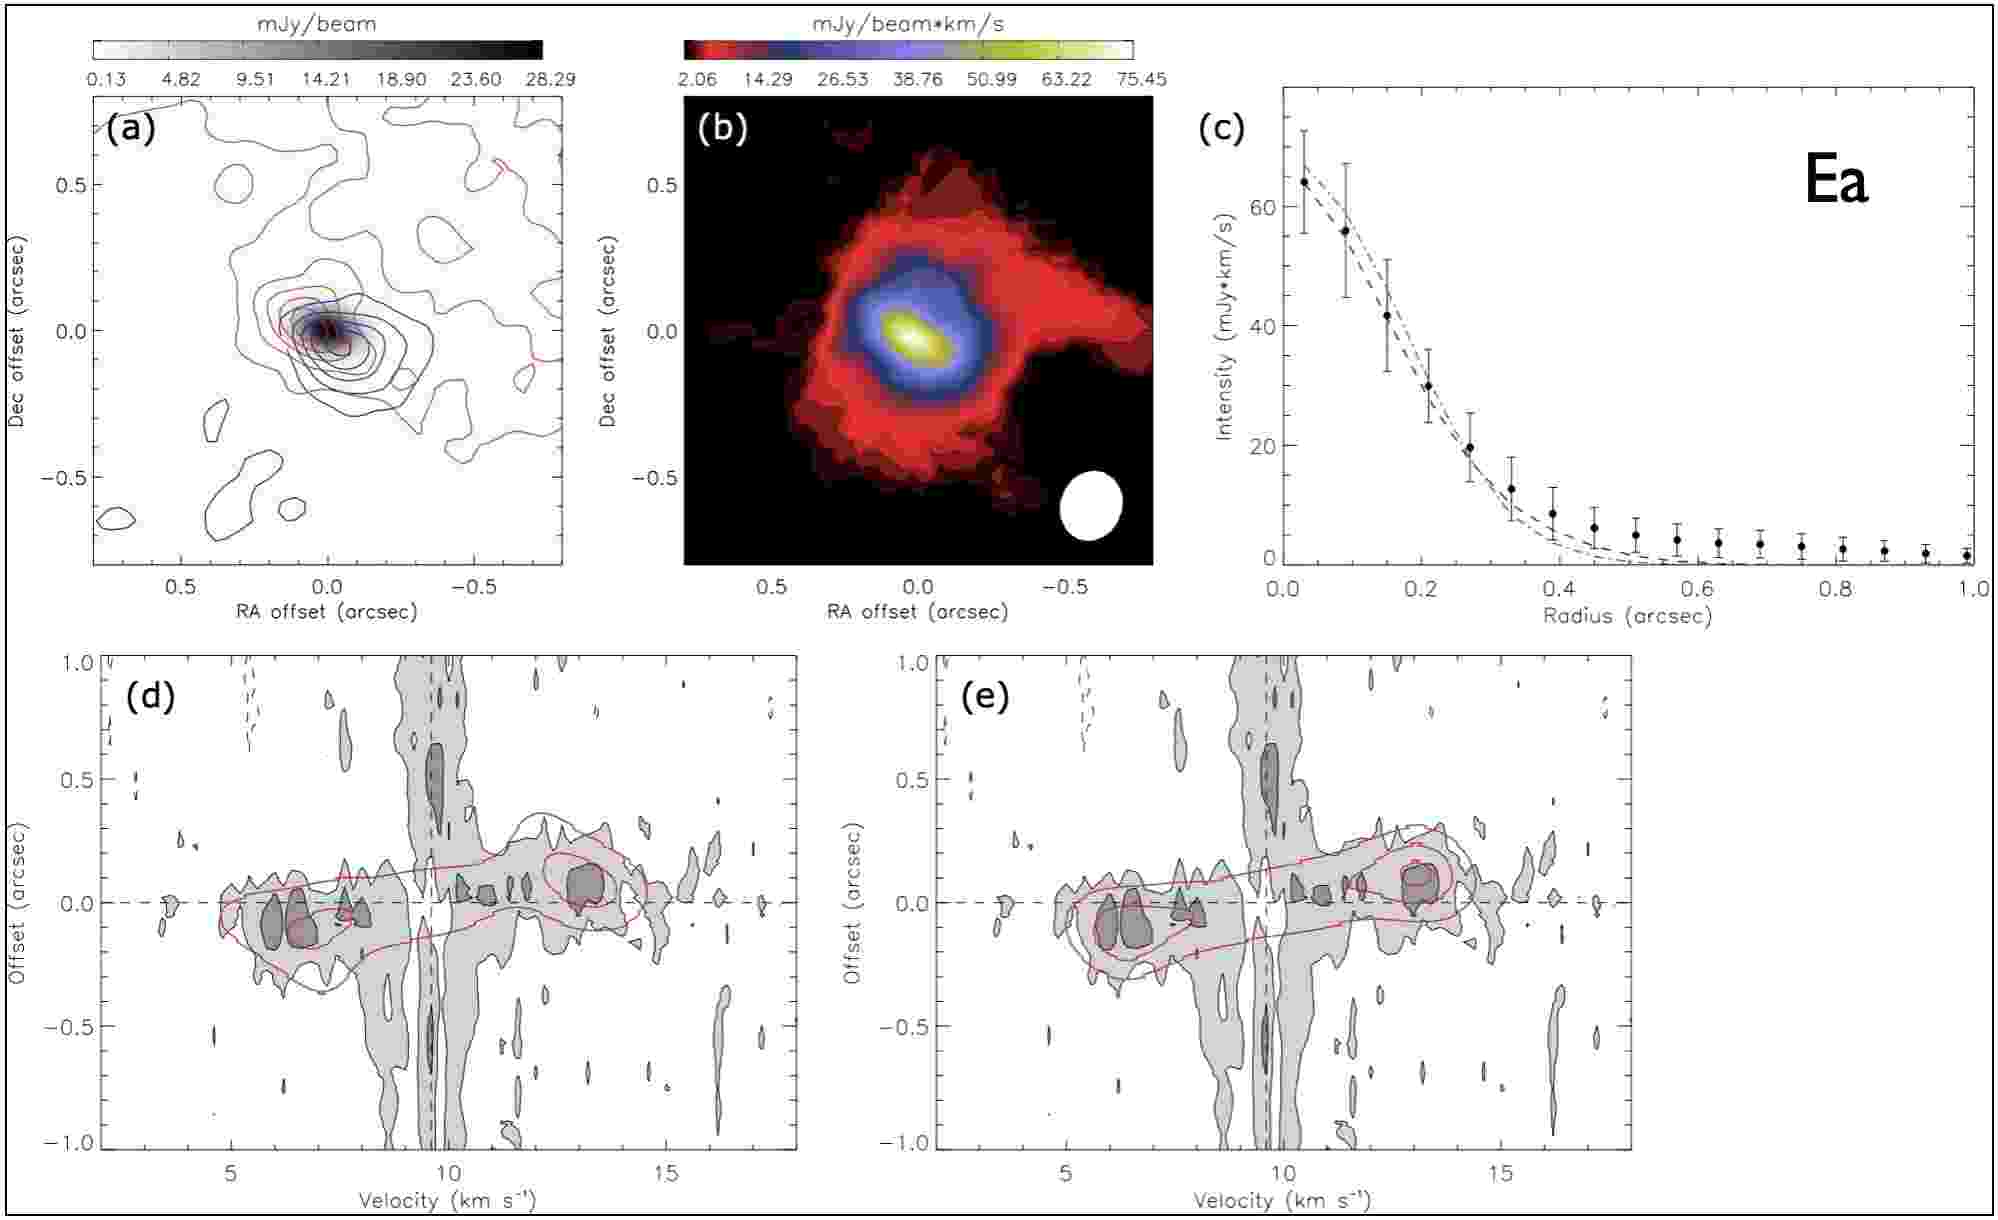
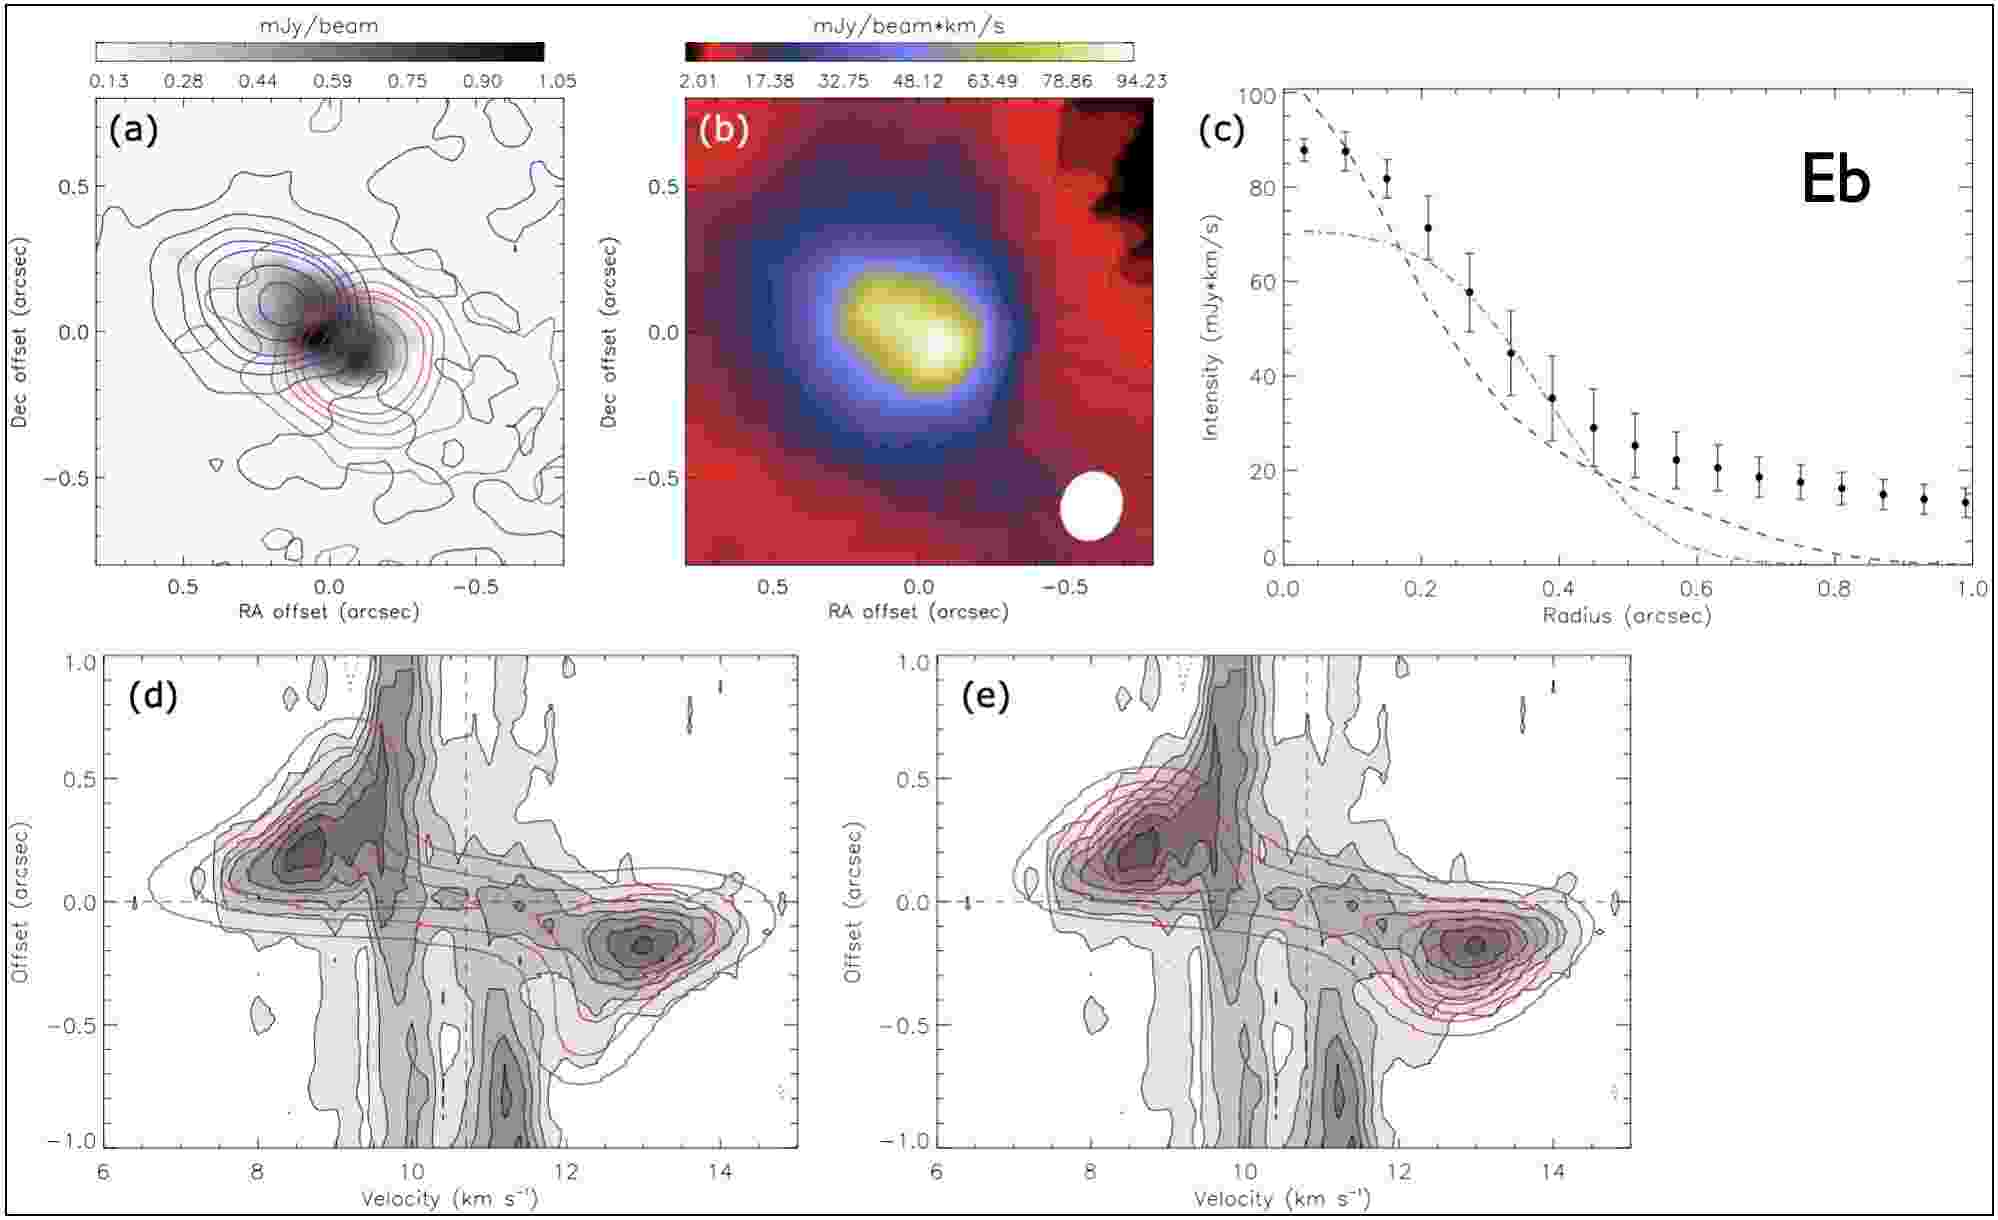
The best-fit parameters are listed in Table 12. We found that for source Ea, the outer radius of the disk model with a power-law intensity profile () could not be constrained with our fitting, so it was fixed to be 04. We confirmed that the best-fit and of source Ea are not sensitive to the choice of the fixed outer radius, and that the results remain unchanged when the outer radius is adopted to be 03 or 06. The uncertainties in the disk orientation and inclination are included in the error propagation in our fitting, although they are not free parameters in our disk models. We note that the uncertainty of in Table 12 does not include the uncertainty due to the geometrically thin approximation in our disk models. There could be an additional uncertainty in of 10%–20% if the C18O emission traces a flared disk, especially when the disk is highly inclined (e.g., Braun et al., 2021). Nonetheless, the mass estimates clearly show that both source NE and Ea, with masses of about 2 M⊙, are much more massive than a T Tauri star, and in fact will later emerge from the cloud core as young Herbig Ae stars. Sources Eb and Wb will become observable as massive T Tauri stars. Given that the sources may still experience significant accretion, these could be conservative estimates.
To reveal the distributions of the C18O emission in the disks with least contamination from an ambient envelope or cloud emission, we constructed Keplerian masks based on our best-fit disk models and applied them to the observed velocity channel maps. The total integrated intensity maps of the C18O emission after applying the Keplerian masks are shown in Figures 40b, 41b, 42b, and 43b, but diffuse emission can still be seen in source Ea, Eb, and Wb. We extracted azimuthally averaged intensity profiles of the C18O emission from the Keplerian masked maps. The observed intensity profiles in source NE and source Ea could be fitted with our simple disk models (Figures 40c and 41c), while those in source Eb and Wb could not be fully explained with simple Gaussian or power-law functions (Figures 42c and 43c). In source Eb and Wb, the power-law disk models fit the central and outer intensity profiles better, and the Gaussian disk models describe the intensity profiles at intermediate radii better. Nevertheless, the best-fit
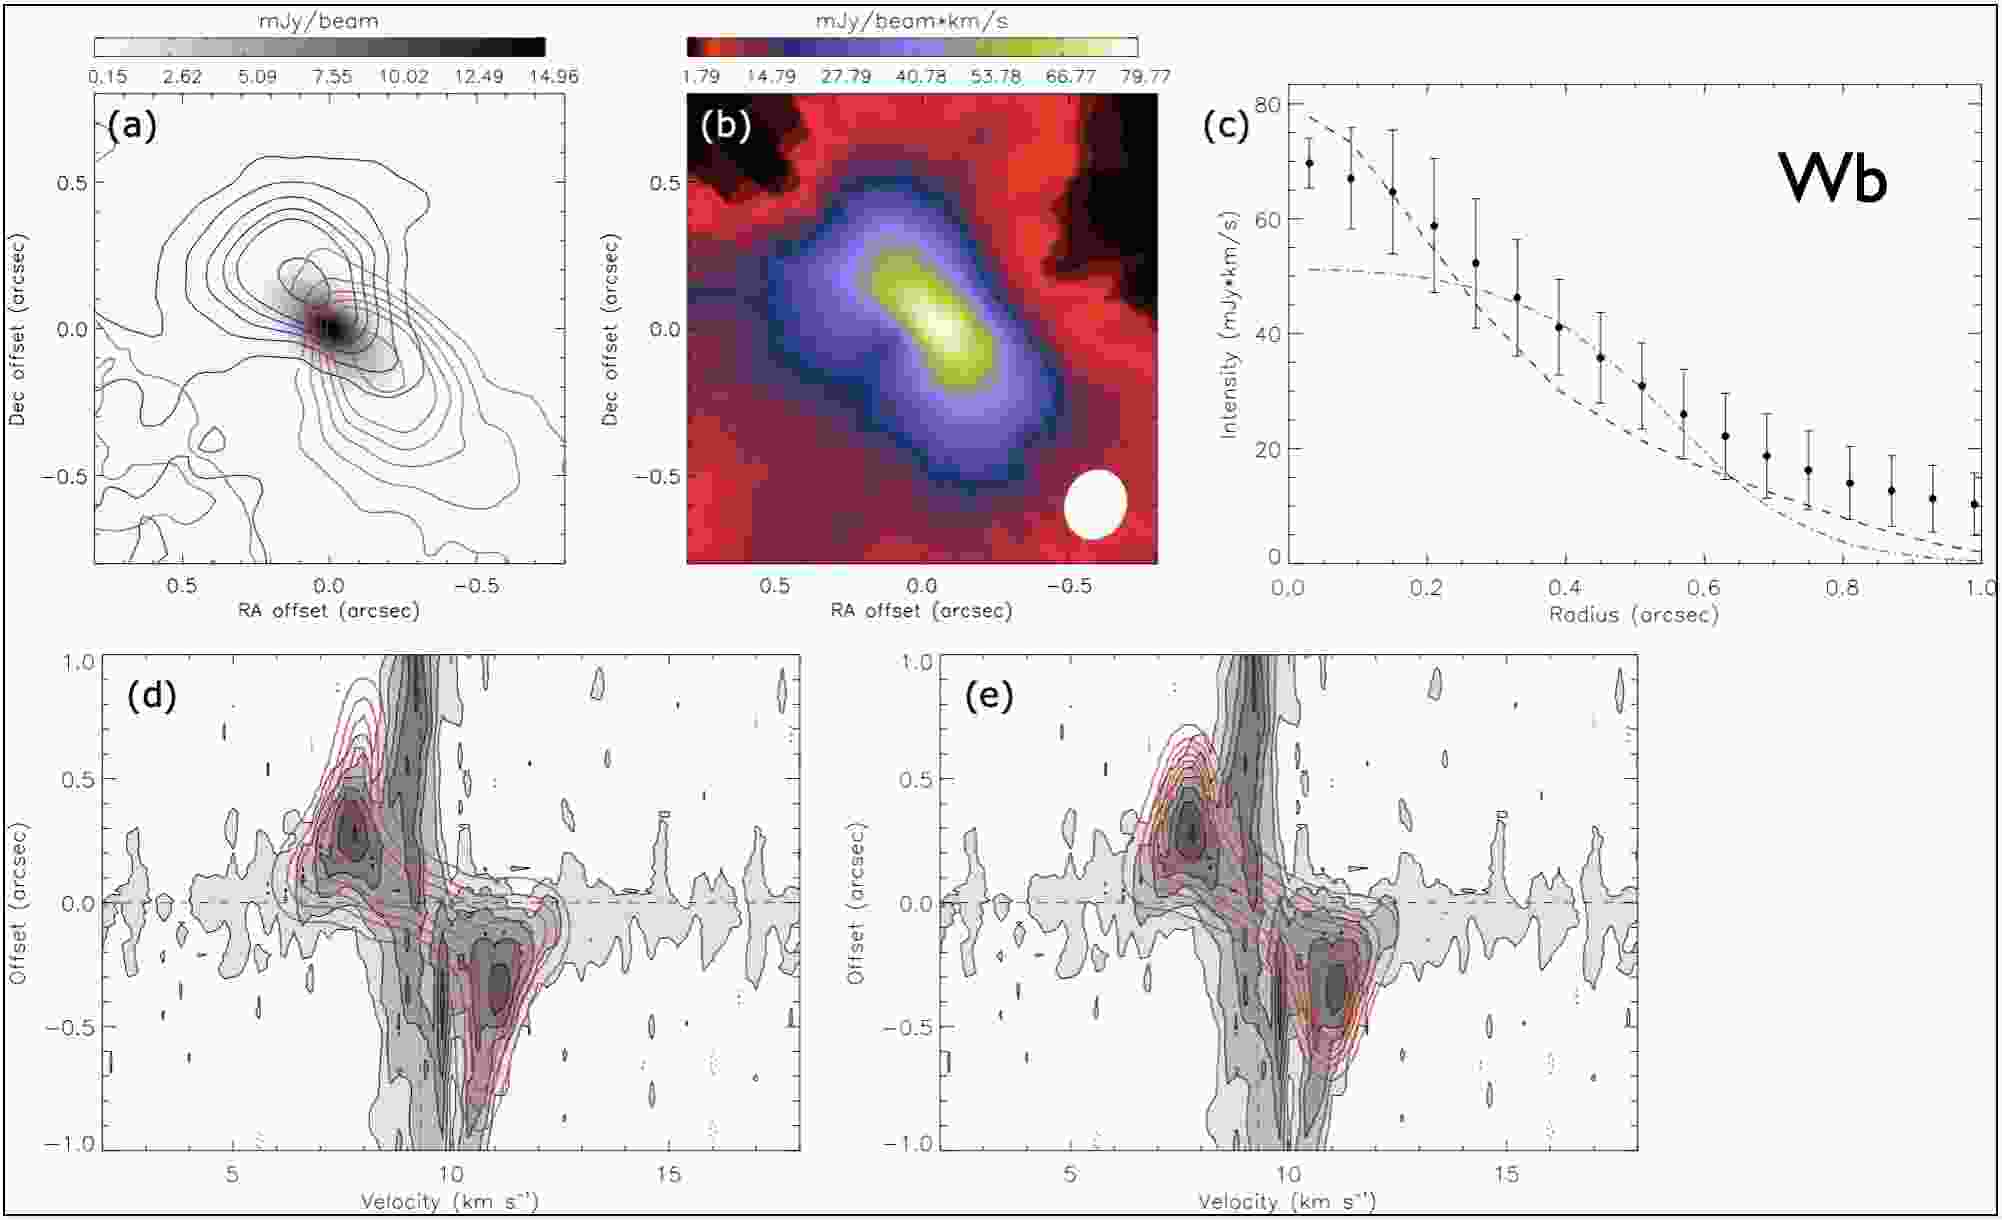
and of all the sources are not sensitive to the intensity profiles assumed in the disk models. The best-fit and from the fitting with the Gaussian and power-law intensity profiles are consistent within the uncertainty. In panel (d) and (e) in Figures 40–43, the observed position–velocity (PV) diagrams along the disk major axes are compared with those extracted from the best-fit disk models. The observed velocity structures of the compact C18O emission around source NE, Ea, Eb, and Wb indeed can be explained with Keplerian rotation, and significant extended emission associated with the ambient envelopes or clouds is also seen in the PV diagrams.
| Power-law intensity profile | ||||||
|---|---|---|---|---|---|---|
| Source | Velocity ranges | |||||
| (mas) | () | (km s-1) | (Jy) | |||
| NE | 701 | 2.1 | 9.60.1 | 3.440.03 | 2.00.1 | 4.9–8.3 & 10.9–14.5 |
| Ea | 400a | 1.90.1 | 9.60.1 | 3.560.03 | 2.00.1 | 4.5–8.1 & 10.5–14.5 |
| Eb | 701 | 1.30.1 | 10.70.1 | 3.140.01 | 1.30.1 | 7.3–9.5 & 11.5–14.3 |
| Wb | 853 | 0.90.1 | 9.30.1 | 3.050.01 | 1.30.1 | 4.9–8.5 & 10.1–14.1 |
| Gaussian intensity profile | ||||||
| Source | Velocity ranges | |||||
| (mas) | () | (km s-1) | (Jy) | |||
| NE | 287 | 2.0 | 9.60.1 | 3.10.05 | 4.9–8.3 & 10.9–14.5 | |
| Ea | 188 | 2.00.1 | 9.70.1 | 2.79 | 4.5–8.1 & 10.5–14.5 | |
| Eb | 388 | 1.30.1 | 10.80.1 | 2.94 | 7.3–9.5 & 11.5–14.3 | |
| Wb | 576 | 0.90.1 | 9.30.1 | 3.110.01 | 4.9–8.5 & 10.1–14.1 | |
Note. — The intensity profile of the model disks is adopted to be power-law or Gaussian functions. The power-law function is described with a power-law index , an outer radius , and the intensity at a radius of 100 au in a logarithmic scale . The Gaussian function is described with the 1 width and the peak intensity in a logarithmic scale . and are stellar mass and systemic velocity, respectively. ranges are the velocity ranges included in the fitting. The velocity channel maps at velocities close to were excluded in the fitting to avoid cloud contamination. The uncertainty does not include the systematic uncertainty due to the geometrically thin assumption. If the C18O emitting surface is flared with a scale height () larger than 0.1, there is an additional uncertainty in of 10%–20%, especially when the disk is more inclined.
10.3 Summary of source properties
Table 11 compares the disk sizes, and in our targets in the HH 24 region. The best-fit parameters of the C18O disk models with Gaussian intensity profiles are adopted here for comparison with the continuum results which were also fitted with the Gaussian functions. The disk radius is defined as twice the 1 width of the fitted Gaussian function, the same as that in Tobin et al. (2020). The radii of the gaseous disks traced by the C18O emission are two to six times larger than those of the dusty disks traced by the continuum emission. This is similar to the observations of several T Tauri disks (e.g., Sanchis et al., 2021). Nevertheless, the significant cloud and/or envelope contamination is seen in the C18O emission in our data, so the disk components cannot be fully separated from the ambient gas (e.g., panel (b) in Figures 40–43), which introduces an uncertainty in our estimated radii of the gaseous disks. Observations at higher resolutions and sensitivity and more detailed models are needed to fully separate the disk and envelope components.
11 CORE KINEMATICS AND MOLECULAR OUTFLOWS
Our ALMA data also includes observations of the J=2-1 transitions of 12CO, 13CO, and C18O, the J=5-4 transition of SiO, and the 3(0,3)-2(0,2) transition of H2CO (Table 2). To study the core and outflows, we used our ALMA data from the compact figuration observations of these molecular lines (with a synthesized beam of about 0.5″ 0.8″) as these data are more sensitive to extended structures; the higher resolution data over-resolved some of the outflow features. Figure 44 shows an outline of the primary beam of the ALMA observations superimposed on the HST [Feii] image. The locations of the five brightest 1.3 mm continuum sources detected in the ALMA pipeline products are marked.
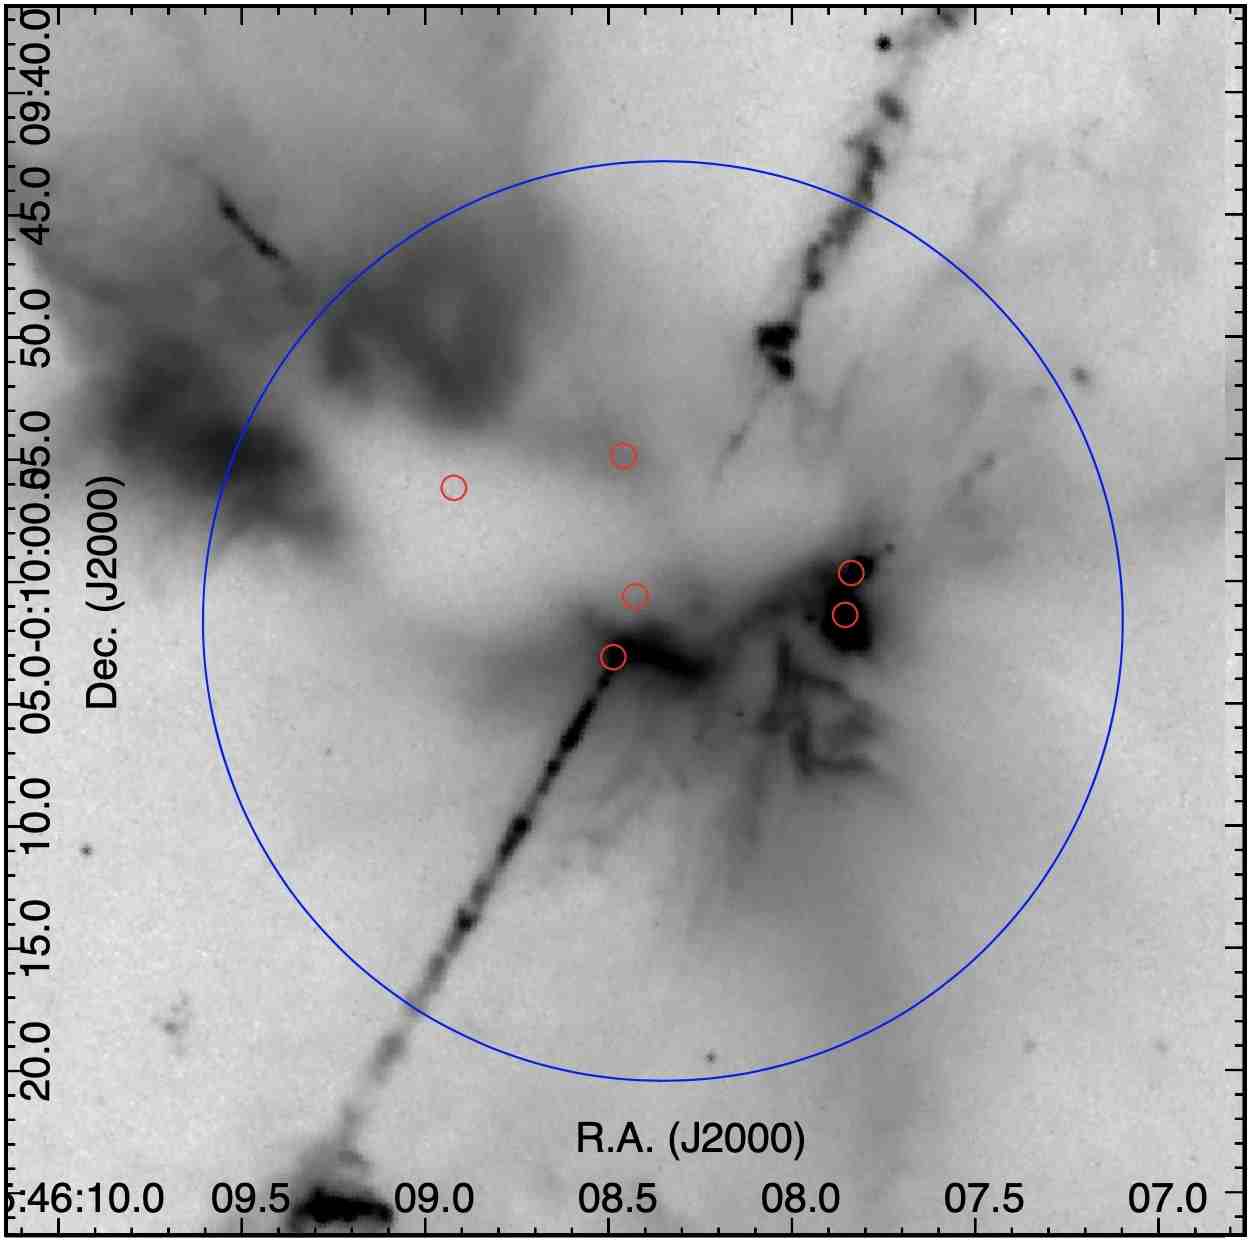
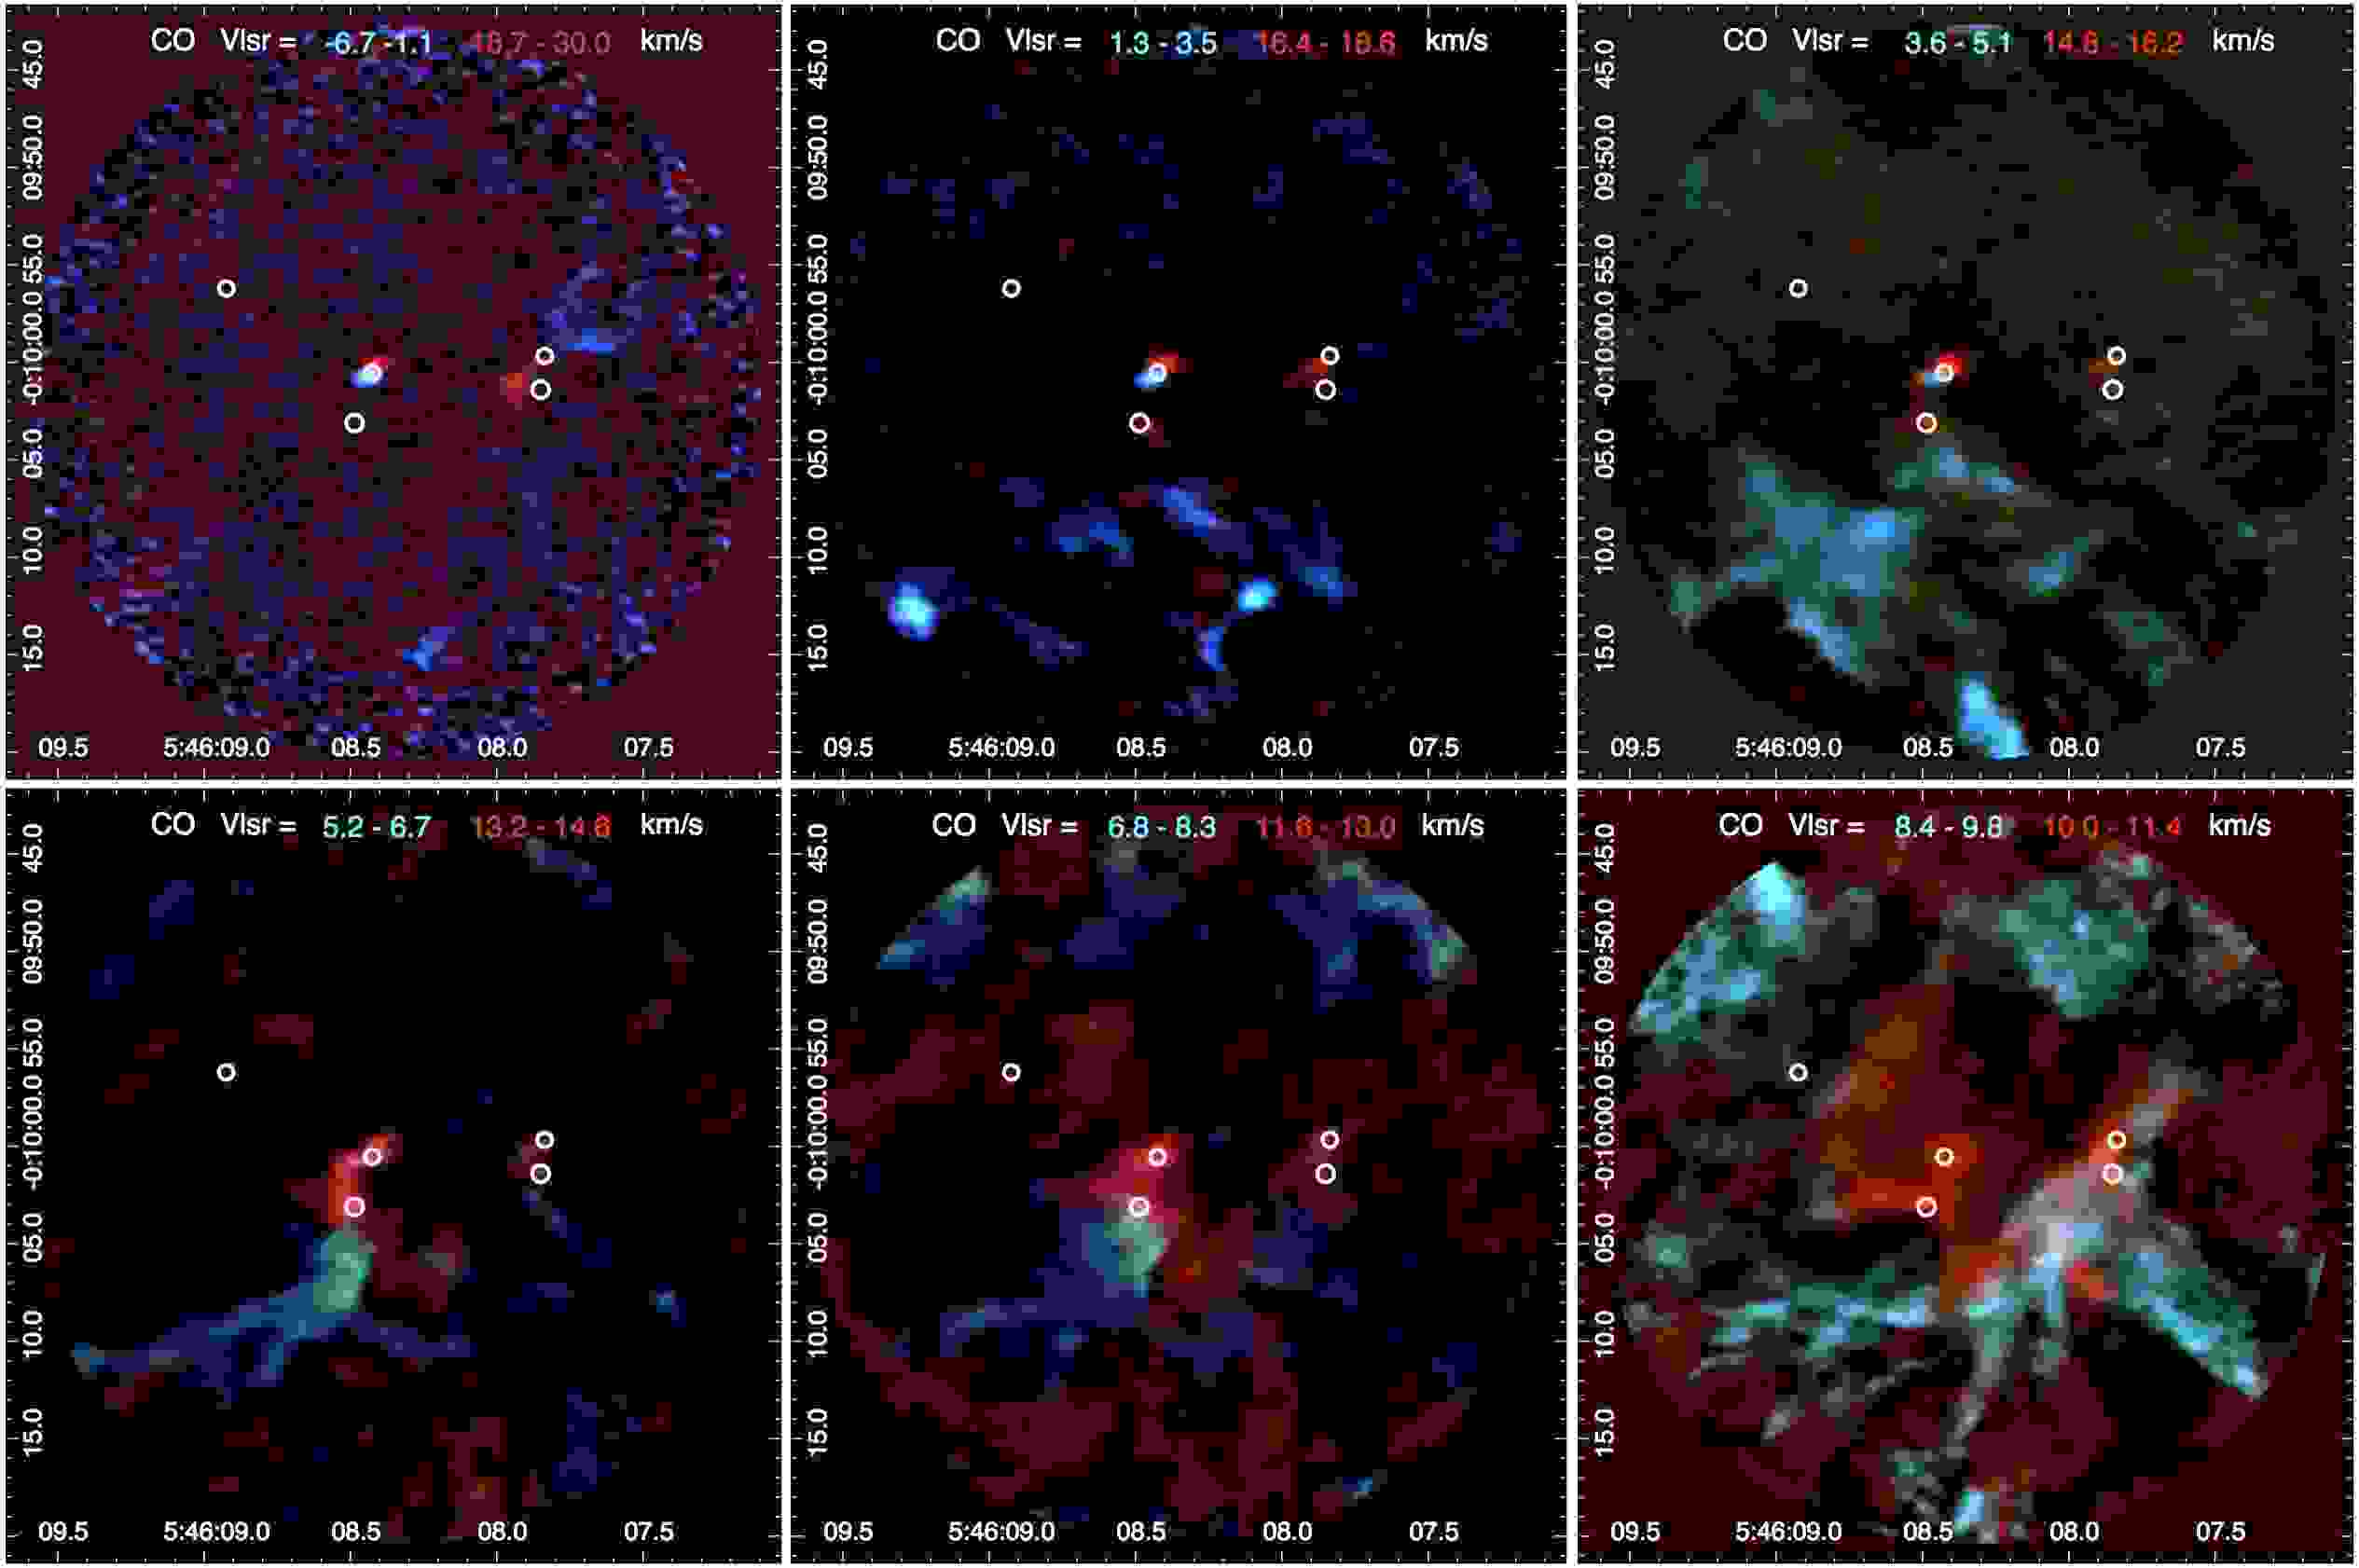
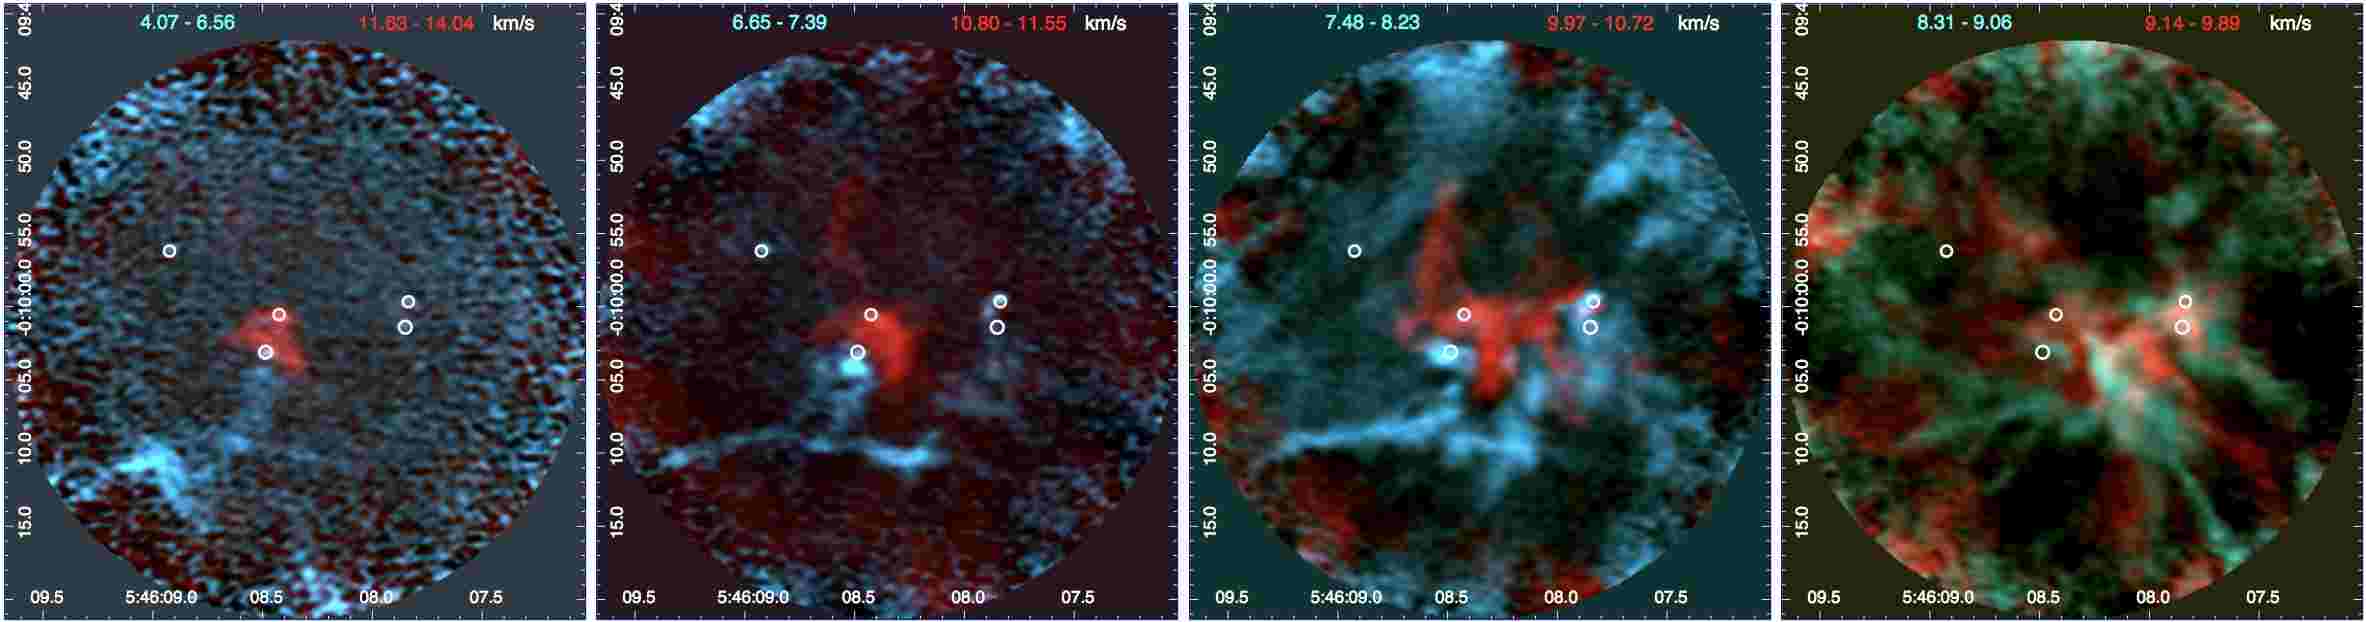
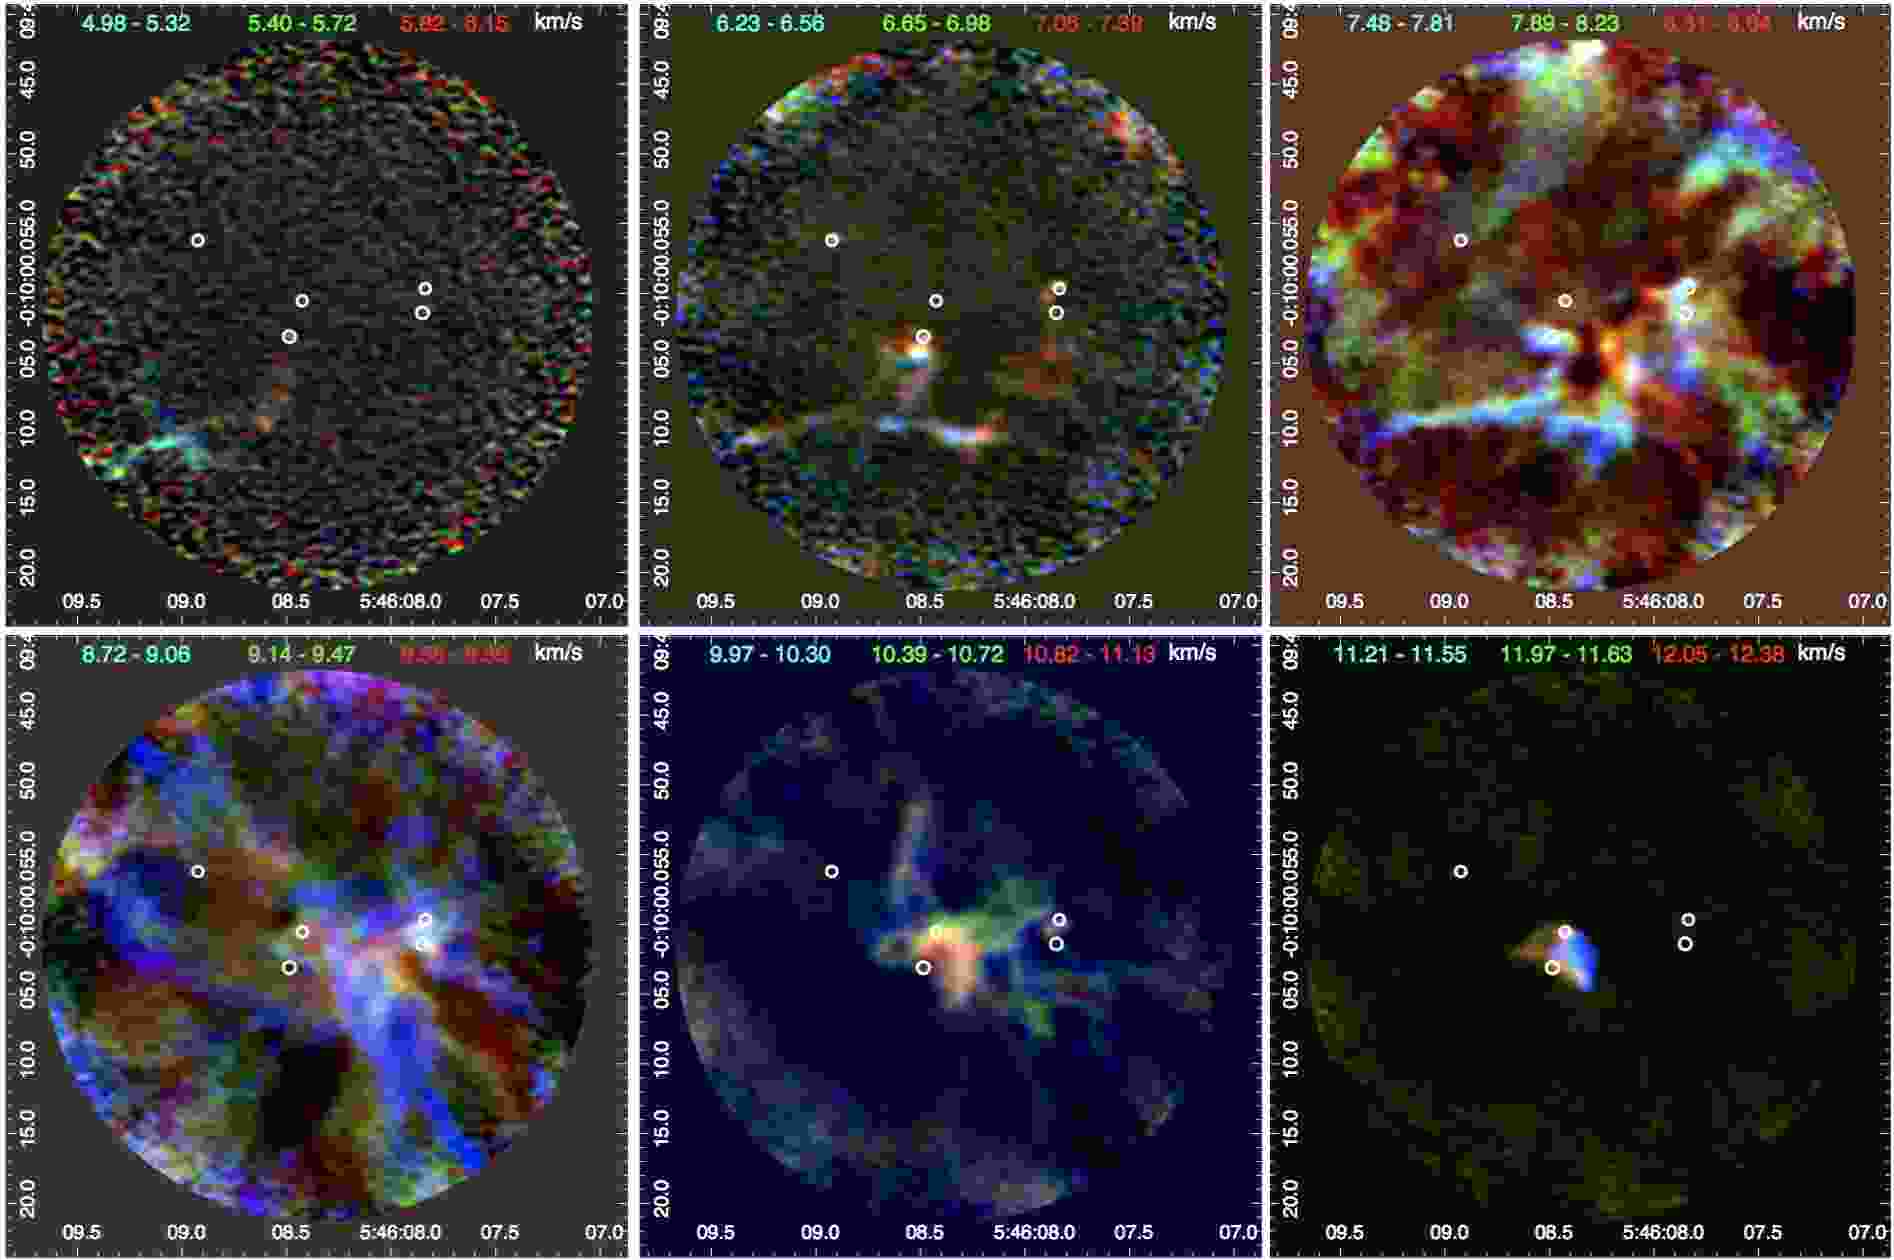
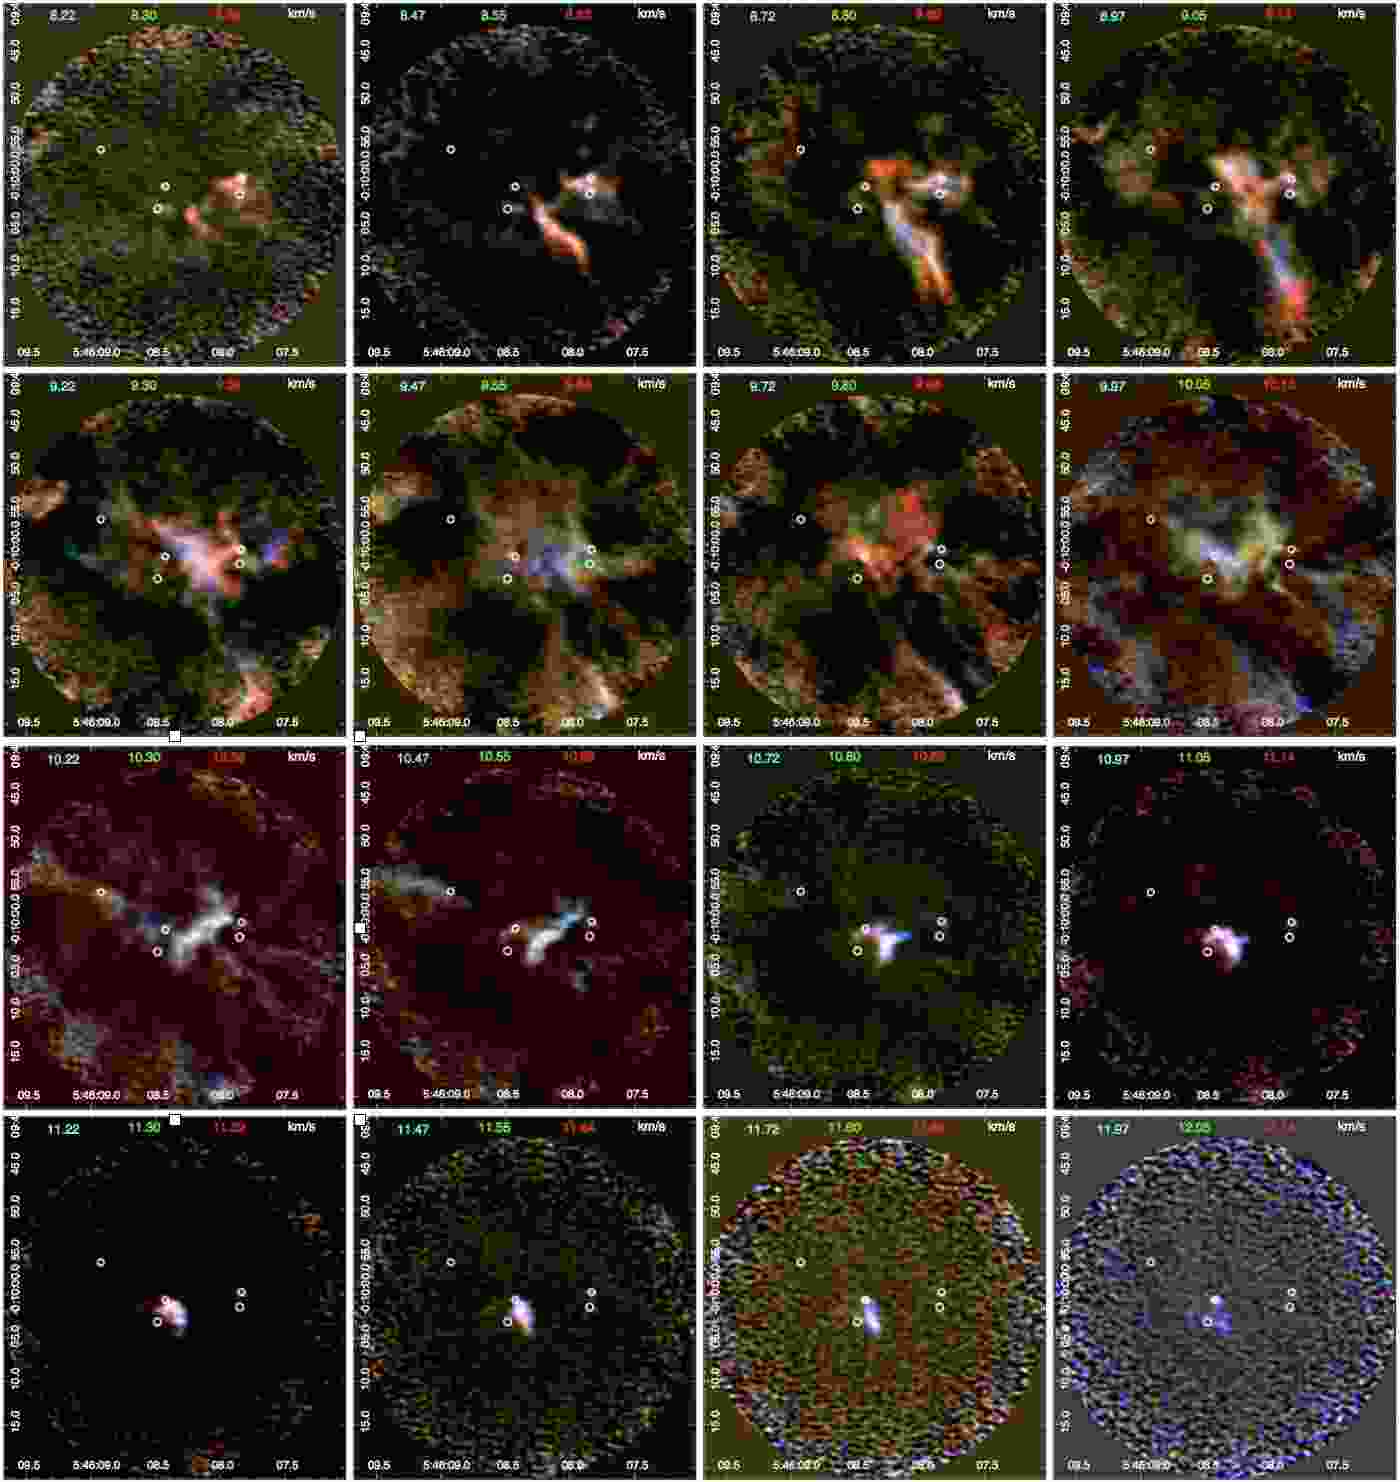
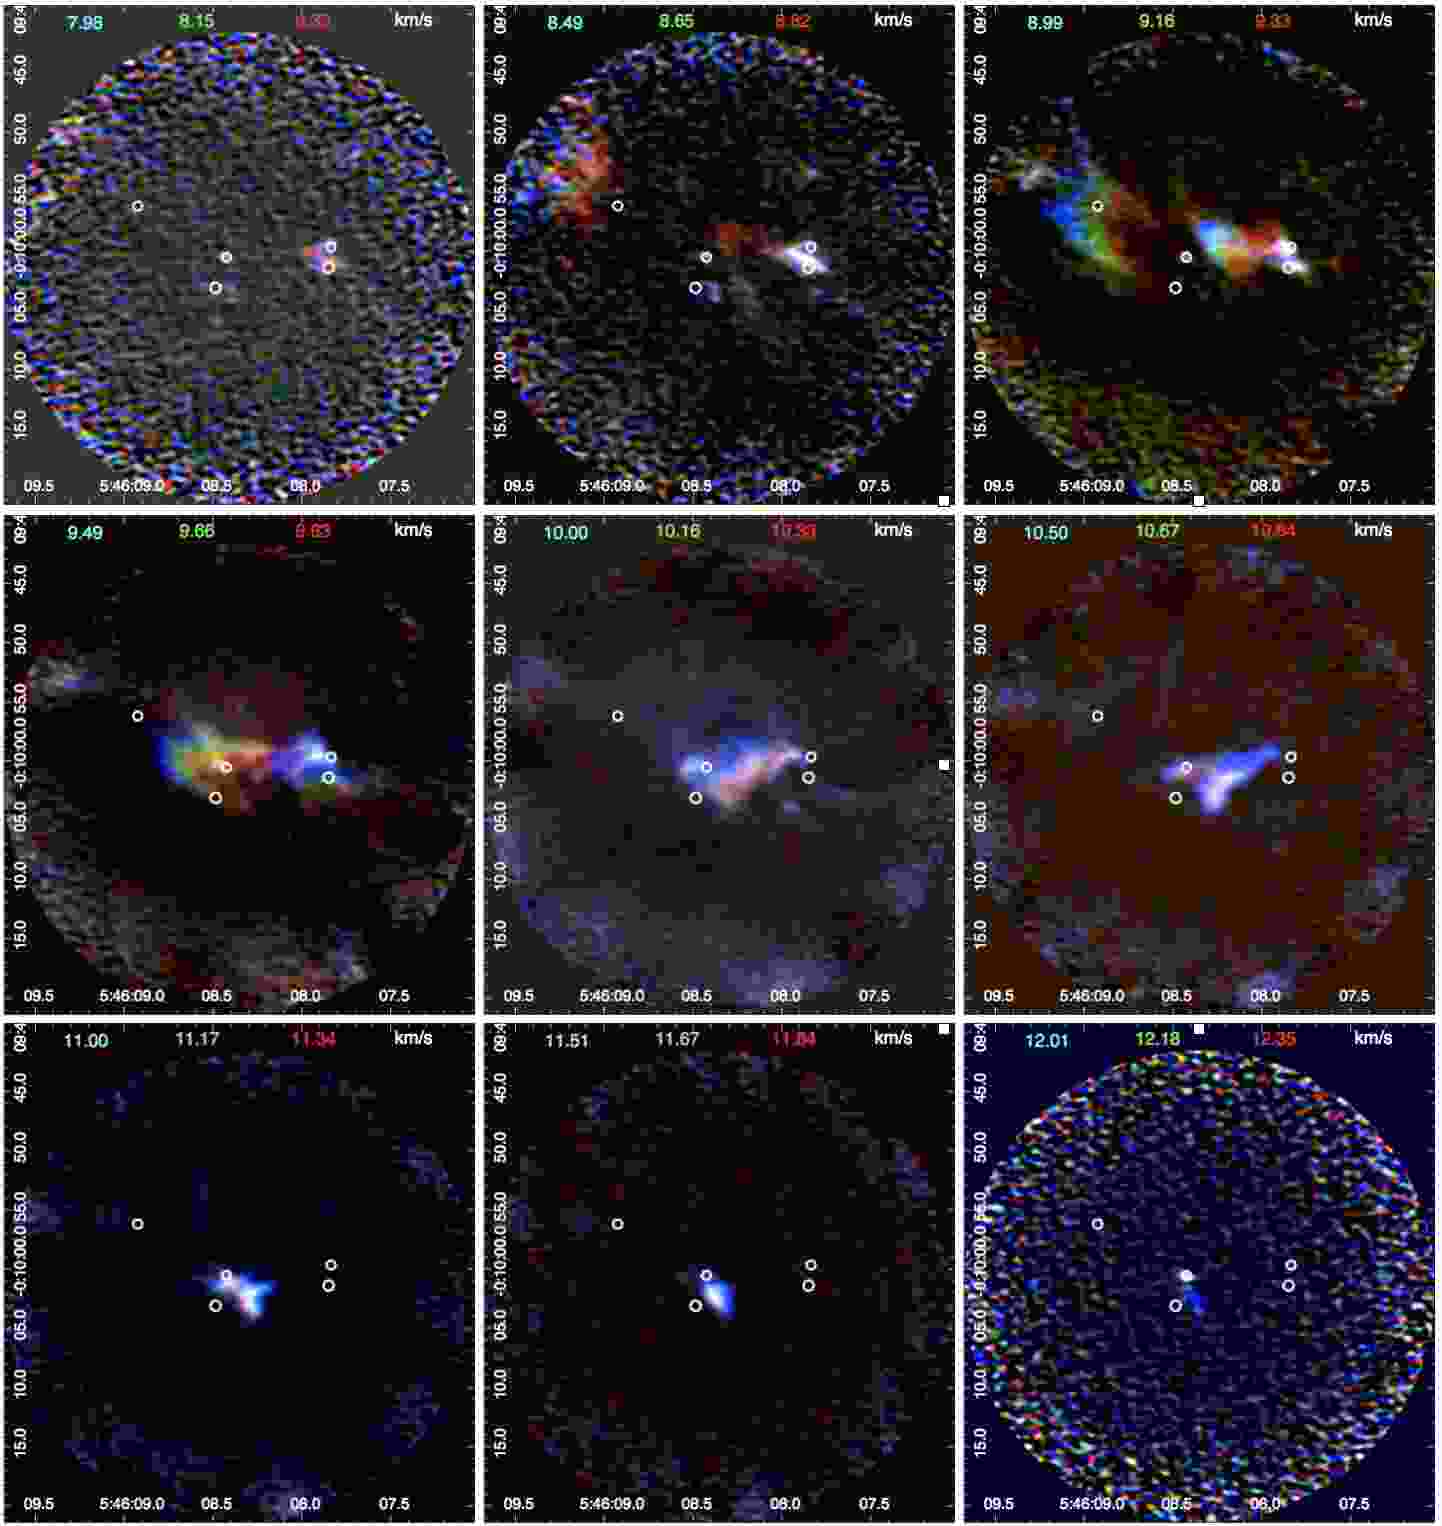
11.1 Overview of ALMA line data
In nearby clouds, the 12CO lines provide one of the best and most commonly used tracers of molecular outflows. 12CO emission is sensitive to molecular gas with a density n(H2) cm-3. Figure 45 contains six panels showing the velocity structure of 12CO emission optimized to show emission produced by outflows. Each panel shows both a redshifted and a blueshifted velocity range indicated by the cyan and red labels at the top. At the largest red and blueshifted velocities (top-left), compact flows are seen to be associated with the sources Eb and Wb. These show radial velocities of more than 15 km s-1 with respect to the velocity of the SSV 63 cloud core in both lobes. For velocities closer to the 9 to 10 km s-1 cloud velocity, the 12CO emission becomes impacted by the high optical depth of the 12CO line and the loss of large-scale structure resolved out by the ALMA interferometer. Gas associated with outflows close to the core radial velocity tends to be hidden behind the 12CO photosphere.
Figure 46 is similar to Figure 45, but for the 13CO line, with each panel showing both a redshifted and a blueshifted velocity range. with the red- and blueshifted emission from the highest speeds (left panel) to the lowest speeds (right panel) with respect to the 13CO line center. This figure shows that also in the lower opacity 13CO line, low velocity flows and cavity walls associated with the outflows powered by the HH 24 YSOs become apparent.
13CO emission is a tracer of molecular gas with a density n(H2) cm-3. Figure 47 shows the 13CO emission in the SSV 63 core covering the radial velocity range from 4.98 to 12.38 km s-1. Each panel shows three adjacent velocity ranges in blue, green, and red indicated by the corresponding colored labels at the top of each panel.
C18O emission is expected to be optically thin, thus displaying the kinematic structure of those small-scale features with a density n(H2) cm-3 that are not resolved out by the interferometer. Figure 48 shows the C18O data cube as three adjacent velocity channels in blue, green, and red from Vlsr = 8.22 to 12.14 km s-1.
Formaldehyde (H2CO) emission traces gas one to two orders of magnitude denser than that traced by C18O, 13CO, and 12CO. Figure 49 shows the H2CO data cube as a mosaic where each panel shows three adjacent velocity channels in blue, green, and red from Vlsr = 7.98 to 12.35 km s-1.
11.2 The MO1 Outflow from Source Eb
The diffuse continuum source Eb powers a compact, arc-second-scale bipolar 12CO outflow we label as Molecular Outflow 1 (MO1). MO1 can be traced 2″ (800 AU) from its source (Figure 50). The red lobe is located north-northwest of Eb, while the blue lobe is to the south-southeast of the source. The molecular outflow axis is perpendicular to the diffuse disk surrounding Eb shown in Figure 38. The position-velocity diagram (Figure 51) shows large velocity spikes at red and blue velocities displaced by less than 1″ from the position of Eb. Given the compact nature of the outflow lobes, we do not see any other clear velocity structure (i.e., dependence on distance from source) in the p-v diagram.
The ALMA SiO data cube shows only one feature in the primary beam, a compact knot of SiO emission associated with the northwest end of the redshifted lobe of the MO1 flow. The SiO is confined to a 1.6″ by 2.8″ region extending from the source to 5:46:08.317, -0:09:59.68. The SiO emission peaks at Vlsr = 10.7 km s-1 at this location (thick red circle in Figure 50). A secondary peak at this velocity nearly coincides with the source (thinner red circle in Figure 50). Between these two low-velocity peaks, the SiO spectrum shows a fainter tail of emission extending to 19.3 km s-1.
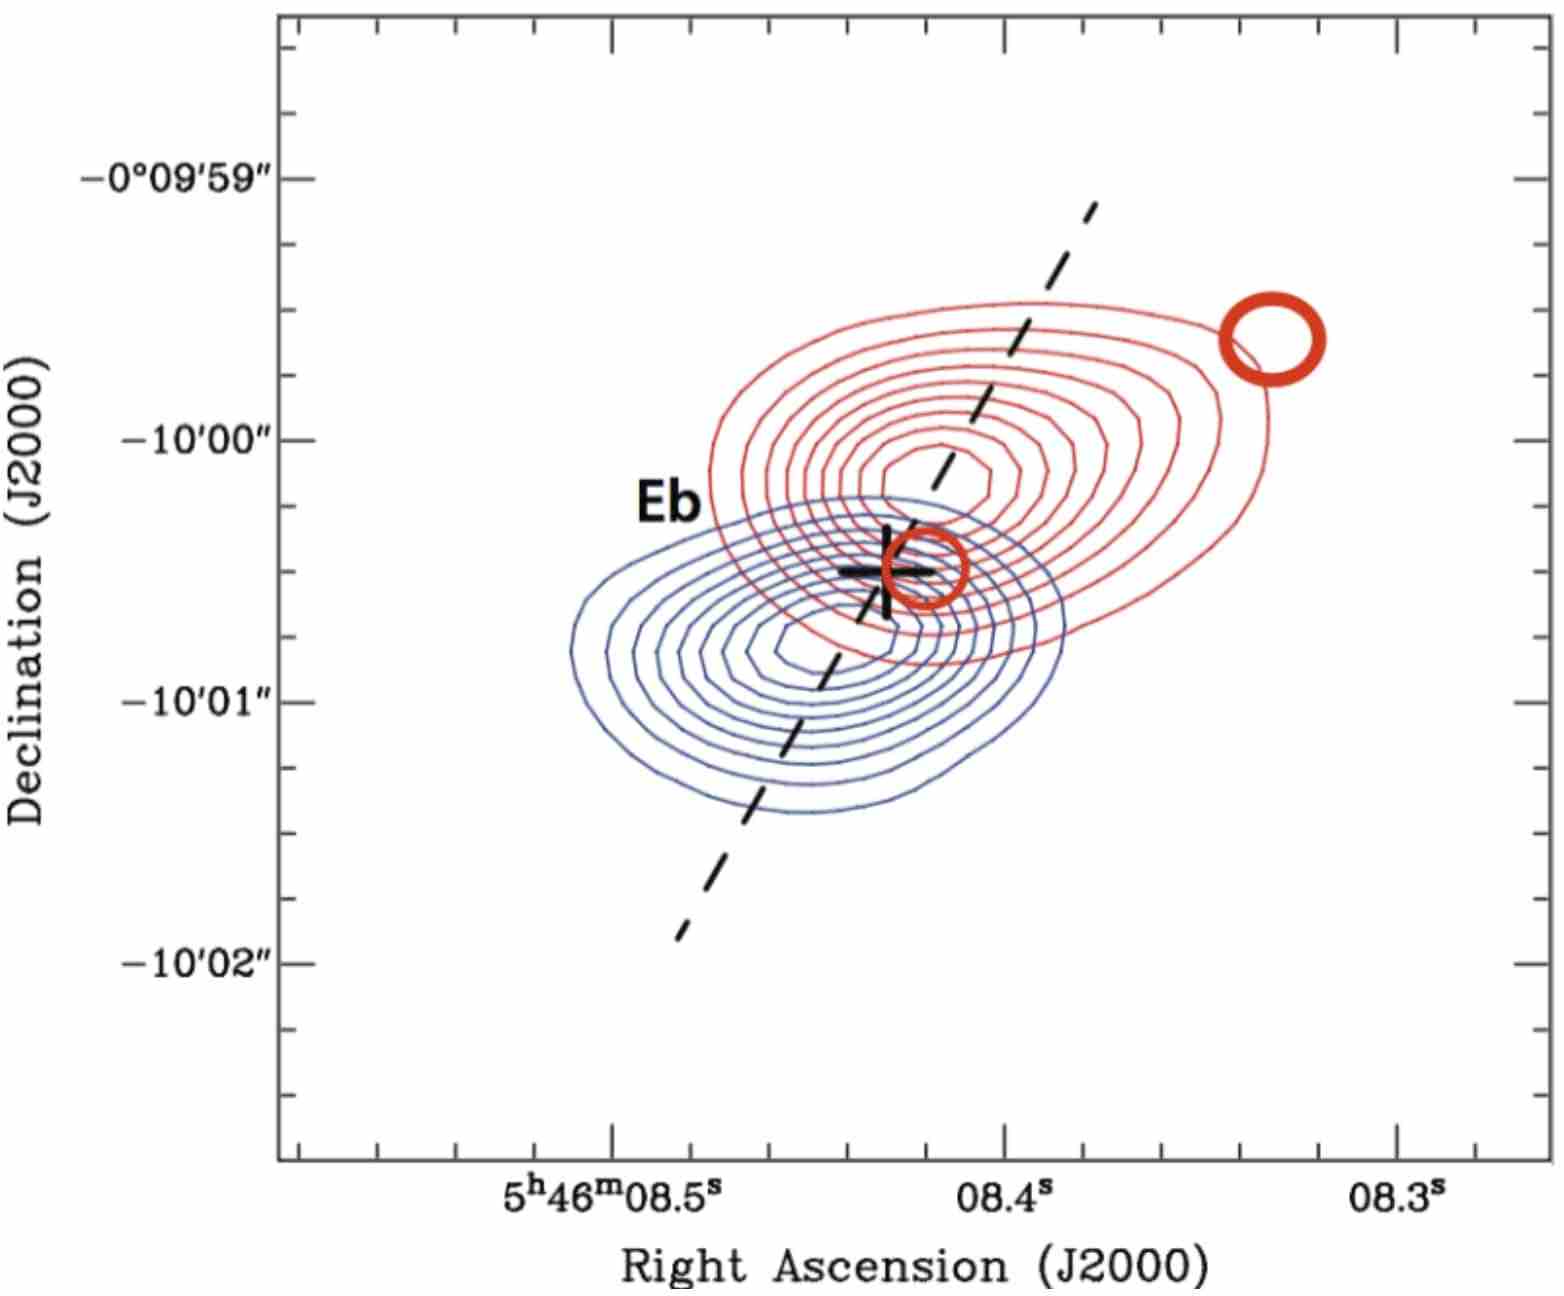
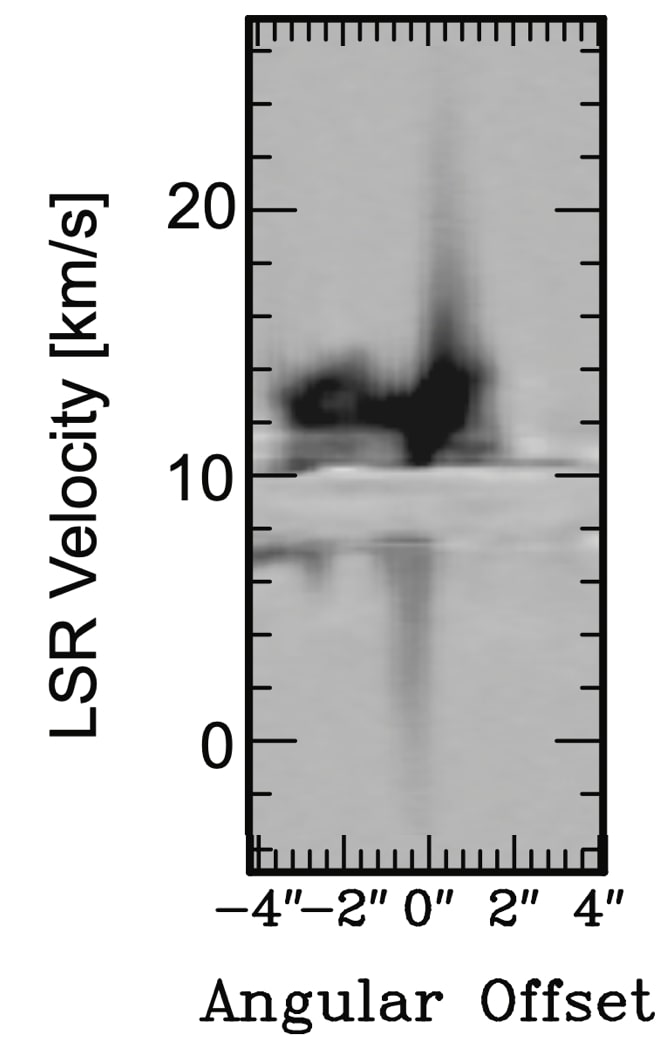
The minor axis of the source Eb disk and the compact 12CO outflow is misaligned with respect to the prominent C and E jets. Furthermore, the CO emission has the opposite parity in Doppler shifts: while the C jet north-northwest of the SSV 63 core is blueshifted and the E jet south-southeast of the core is red-shifted, the compact 12CO flow from source Eb has the opposite Doppler shifts. Thus, there is no obvious connection between molecular outflow MO1 with the E/C jet pair or any other Herbig-Haro object or near-infrared emission line feature in the SSV 63 core.
This 12CO outflow exhibits the lowest and highest radial velocities with respect to the SSV 63 cloud core in the entire ALMA field and is the only source powering SiO emission. The SiO emission suggests that very recent outflow activity may be impacting dense gas in the immediate surroundings of this YSO. The lack of obvious jets, HH objects or MHOs suggests that accretion and outflow activity may have been very weak or absent in recent past, say within the last few hundred or few thousand years.
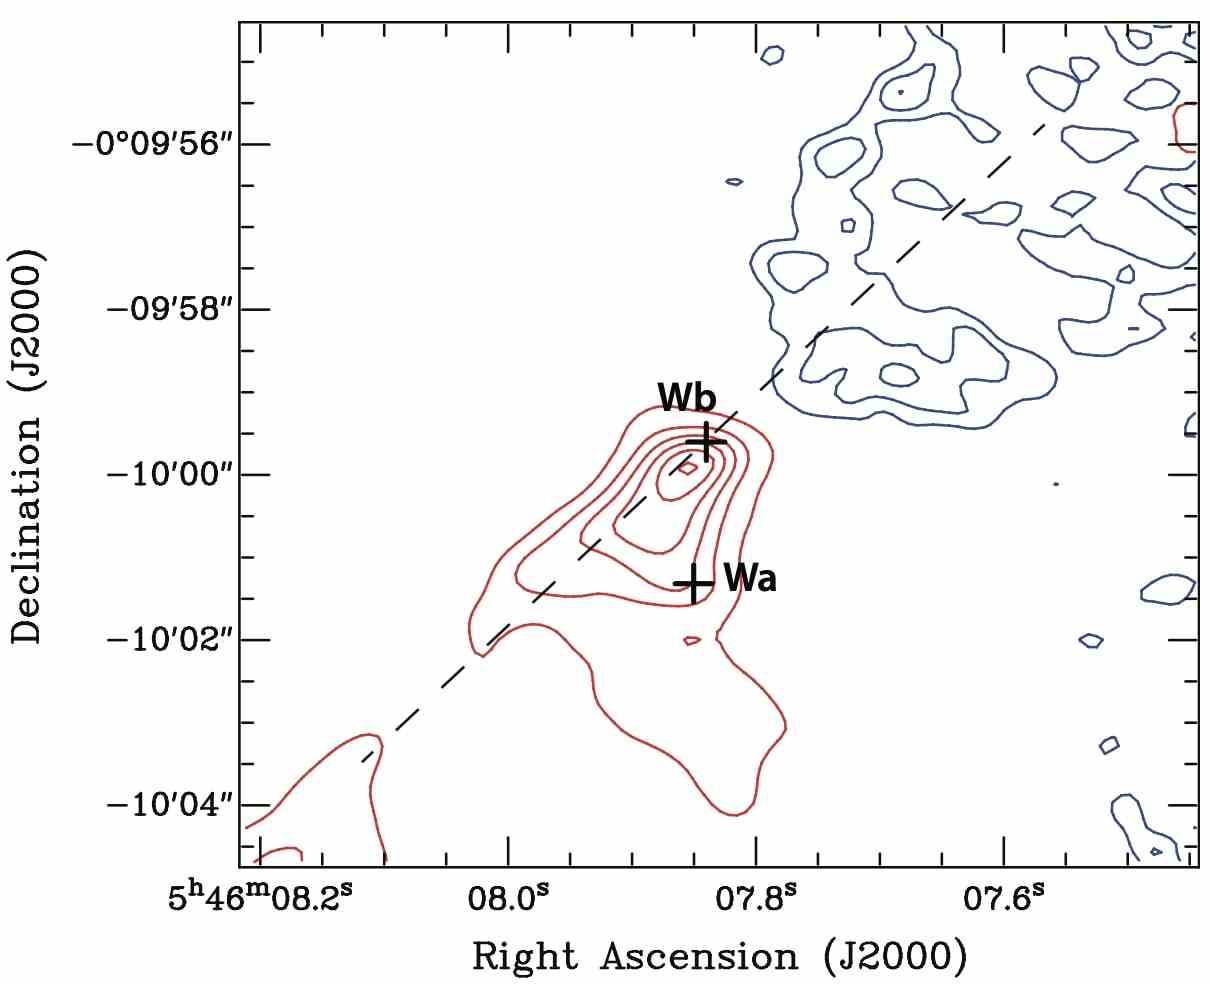
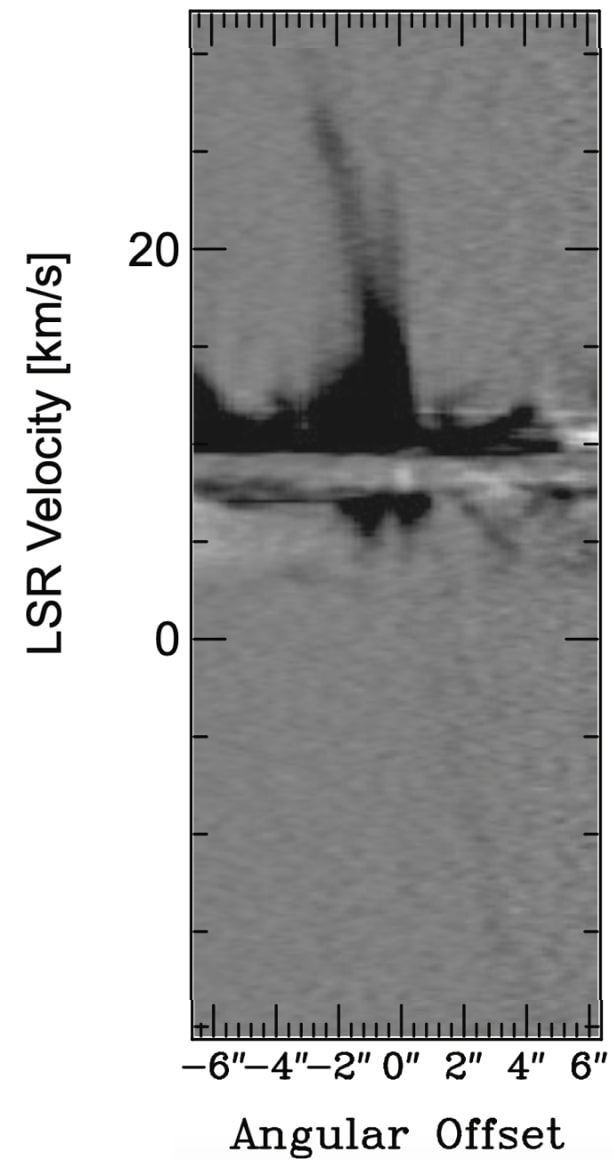
11.3 The MO2 Outflow from Source Wb
The molecular outflow associated with source Wb, labeled MO2, is the second most prominent molecular outflow from the SSV 63 sources. MO2 has a significantly more extended morphology than that of MO1 and exhibits red- and blue-shifted velocities to the southeast and northwest of Wb, respectively (see Figure 52). The axis of MO2 is approximately perpendicular to the Wb circumstellar disk major axis. The morphology and kinematics of MO2 are similar to those expected from a molecular outflow formed by entrainment by a wide-angle wind (as described in Lee et al. 2000). At the highest velocities relative to the cloud rest-velocity (upper-left panel in Figure 45) there is a compact cone of redshifted 12CO emission extending to the southeast, and a more open cone of blueshifted emission extending towards the northwest (Figure 52). The axes of symmetry of these small-scale 12CO lobes is closely aligned with the orientation and parity of the optical jet J. However, the 12CO Doppler shifts are more than an order-of-magnitude lower than the tangential velocities of the jet J knots, and the spatial extent of 12CO emission that can be related to an outflow from source Wb is at least two orders-of-magnitude smaller. The channel maps show discrete emission (i.e., blobs) with higher velocity at larger distances from the source, and the p-v diagram along the axis of MO2 shows parabola-like structures (see Figure 53).
11.4 The MO3 Outflow from Source N
A third, clearly defined, compact molecular outflow is powered by source N. This compact molecular outflow (denoted MO3) is relatively collimated but asymmetric. There is clear redshifted emission associated with molecular outflow from about 1.5″ out to about 5″ (2000 AU) from the source, whereas the blue lobe extends from the source out to only about 1.5″ (see Figure 54). The position-velocity diagram (Figure 55) shows a velocity structure in the redshifted lobe commonly known as a “Hubble-wedge” and usually seen in molecular outflows formed through jet bow shock entrainment of ambient gas (see, e.g., Lee et al. 2000; Arce & Goodman 2001). On the other hand, the velocity structure of the blue lobe is not as clearly defined as that of the red lobe. There are no obvious connections of MO3 to any Herbig-Haro objects or near-IR emission line features.
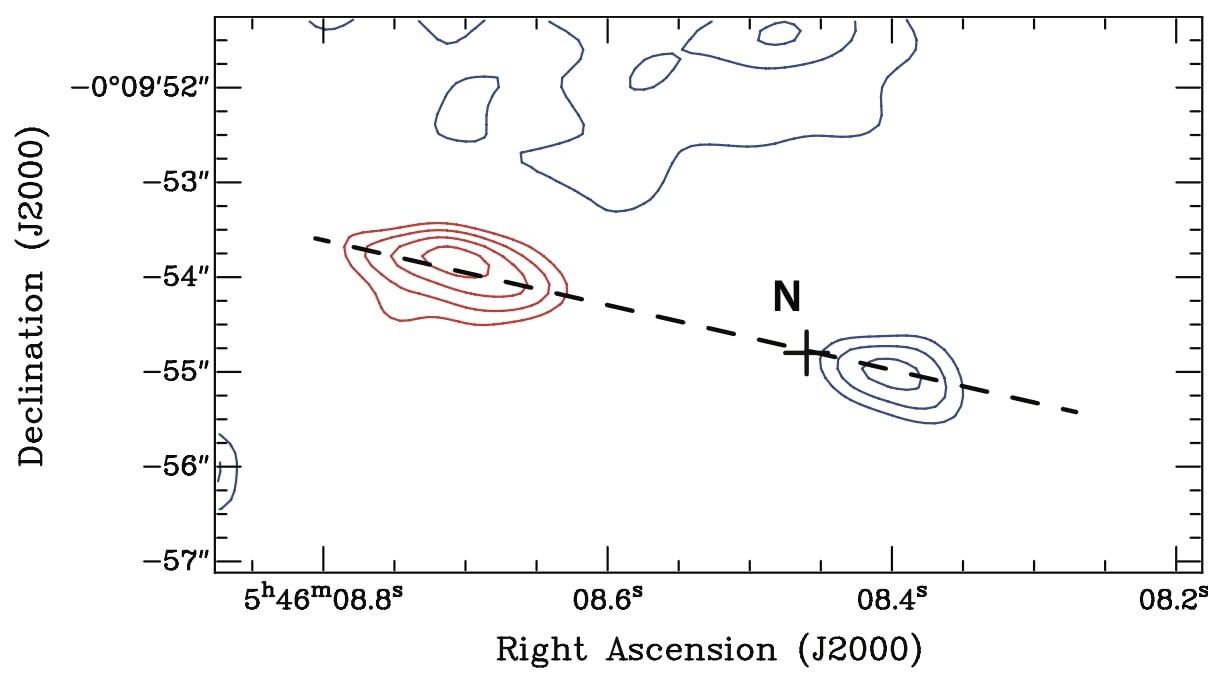
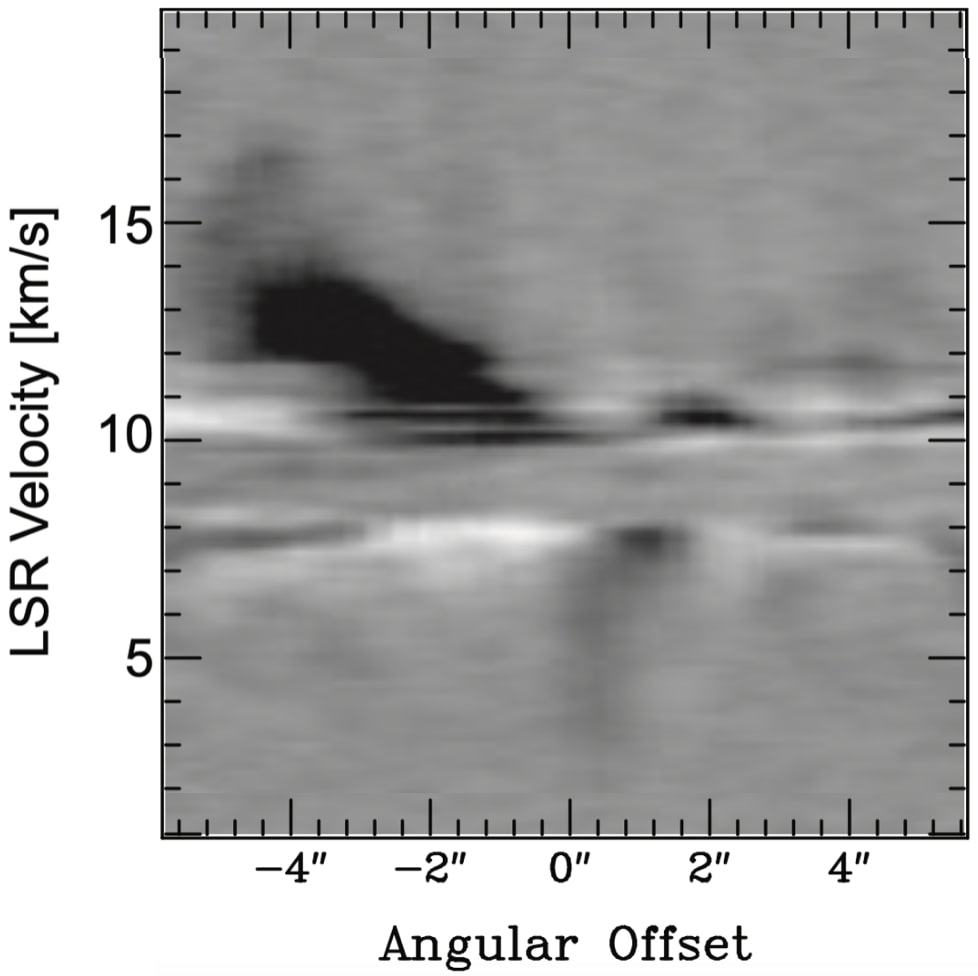
The low millimeter flux of source N, the non-detection of this YSO at visual, IR, or radio wavelengths, combined with the presence of a compact, low-velocity molecular outflow, suggests that it may be a sub-stellar object. It could be the youngest of the active accretors in the SSV 63 cloud core.
11.5 Outflow from Source Ea?
Most of the low-velocity blueshifted 12CO emission in the ALMA field is concentrated in the southern half of the field and extends from 1 to 8 km s-1, thus blueshifted relative to the cloud velocity and, remarkably, opposite to the redshifted radial velocity of the optical jet E emerging from source Ea. The most intense emission in this radial velocity range is concentrated south of source Ea, where within about 5″ of this source the emission resembles a clumpy, low-velocity flow, see Figure 45 and Figure 56.
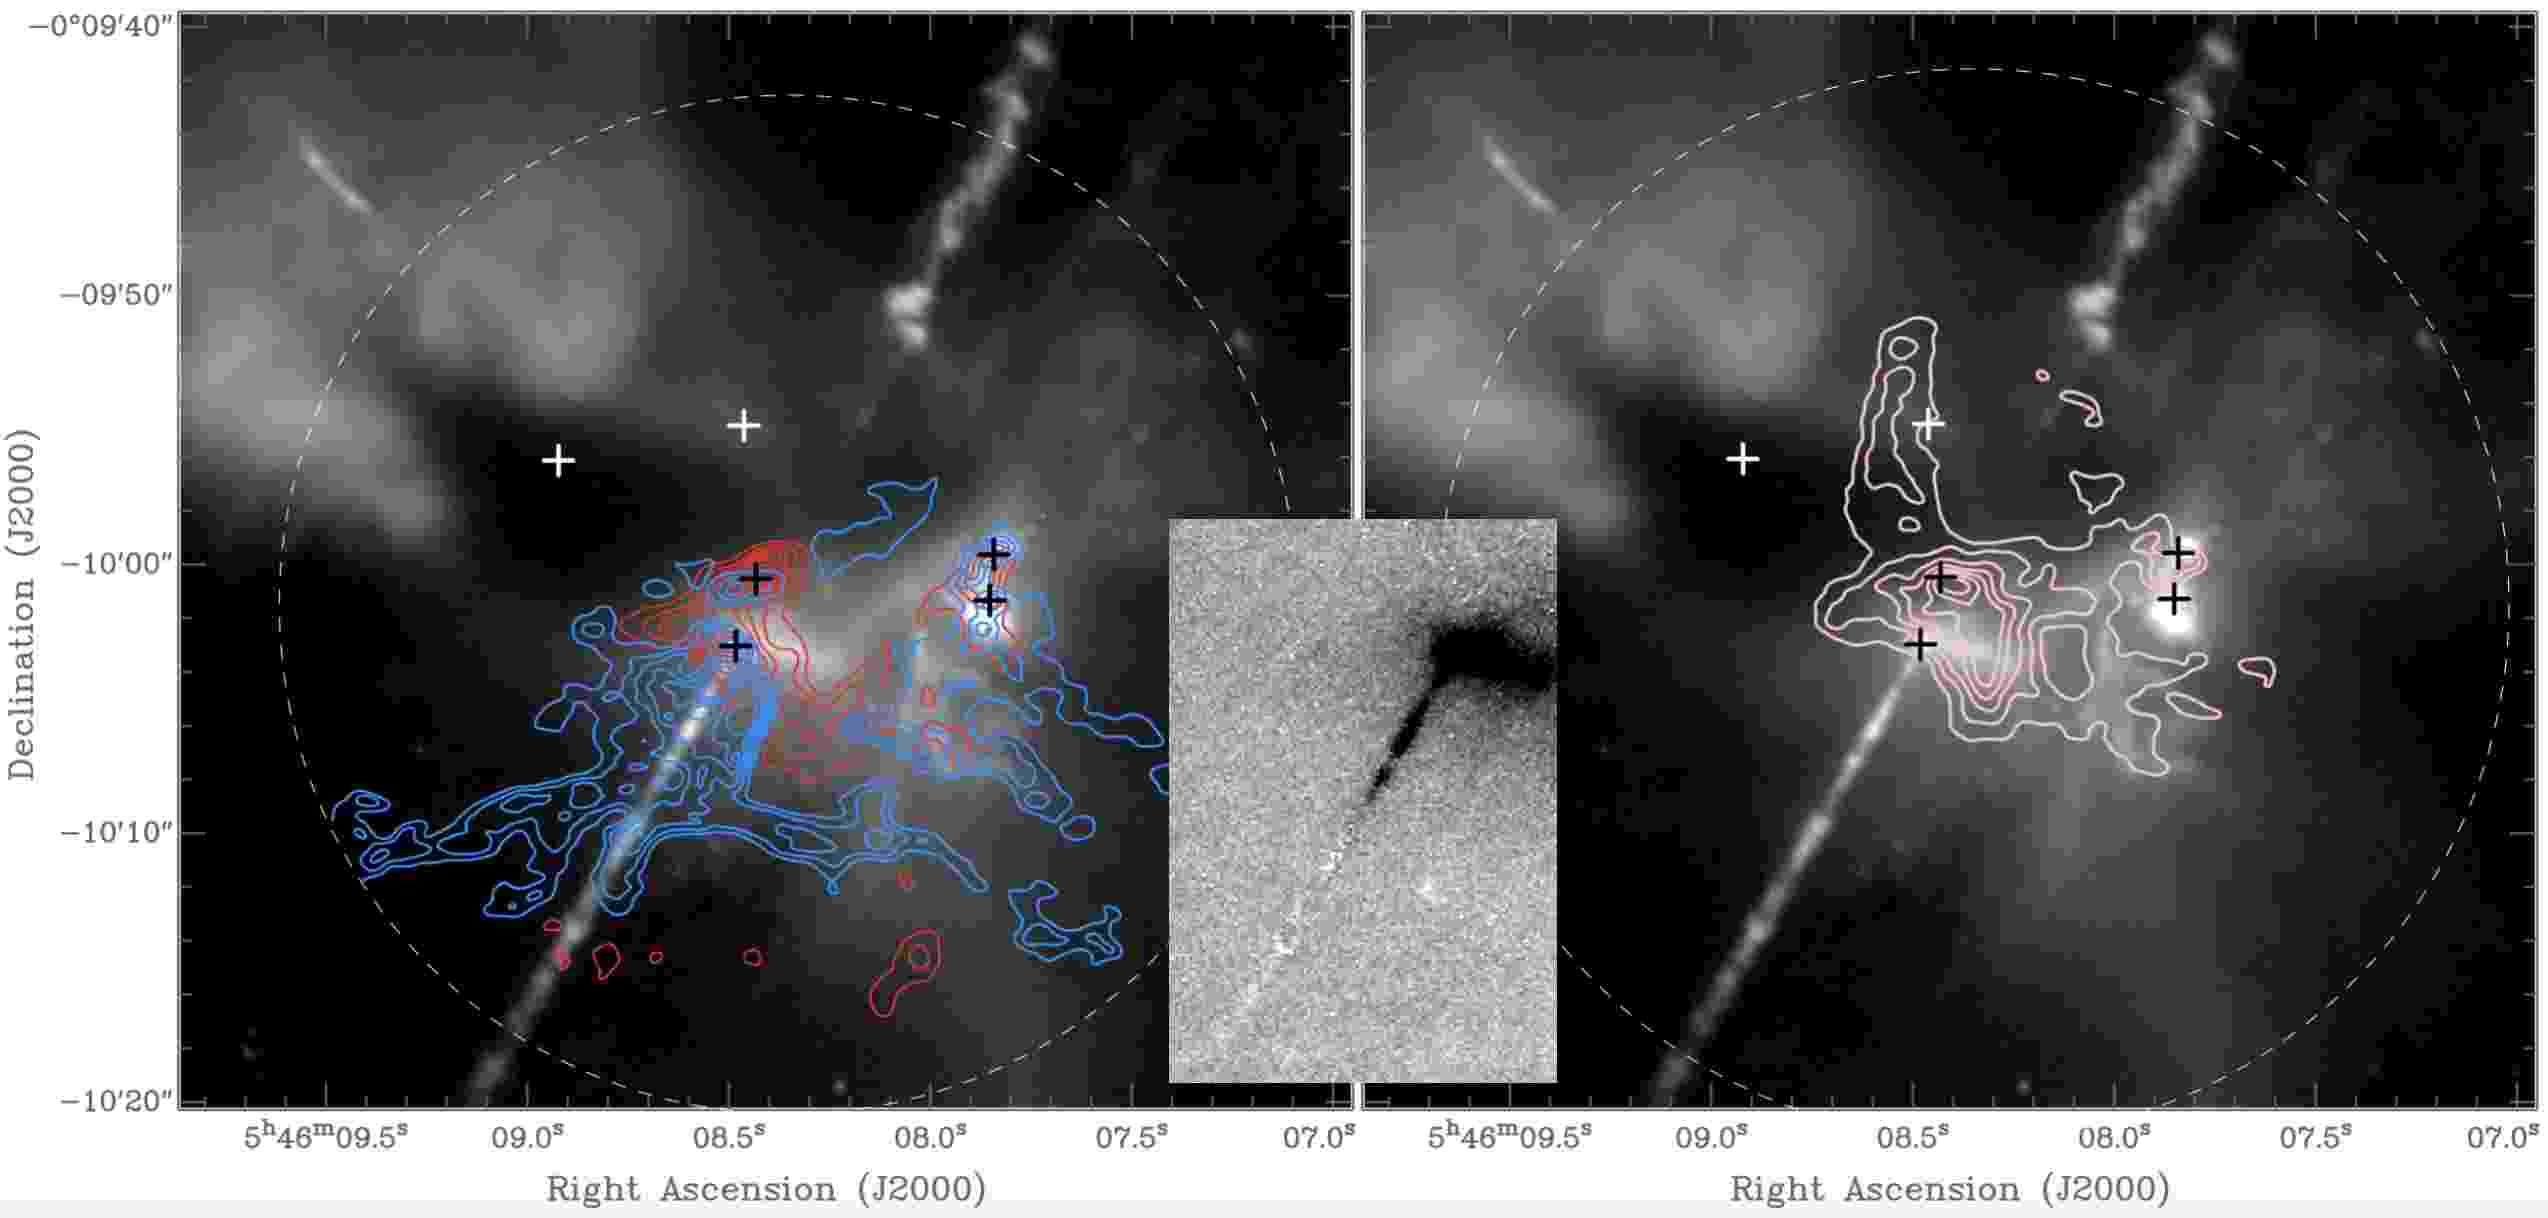
The blueshift of the 12CO emission south of source Ea suggests, in light of the much faster redshifted velocities of the optical jet E, that the CO emission here represents gas that has been deflected towards us by either a wide-angle wind surrounding the jet, or material was ejected at right angles from the axis. As faster ejecta in a velocity-variable jet overtakes slower material in the jet beam, material can be ejected to the side. Over time, the pressure of such sideways moving ejecta or a wide-angle wind can create a wide-angle cavity whose near-side walls would be expanding towards the observer. As discussed in Section 6.1.1, the diminishing ratio of [Feii]/[Sii] as jet E moves away from its source indicates a strong decline in extinction towards the observer. The middle panel in Figure 56 illustrates the decline in the [Feii]/[Sii] ratio.
We conclude that source Ea is not driving a major molecular outflow as it emerges from the cloud core, but shows kinematic evidence for either entrained or sideways splashing gas at blueshifted velocities.
It should be noted that close to, and southwest of, source Ea we also detect faint redshifted 12CO emission at to 18 km s-1(middle upper panel of Figure 45). At these velocities the emission is compact, extending to the southwest only out to 1″ to 2″ from Ea. We note that VLA X-band maps of source Ea shows evidence for a stubby extension perpendicular to the axis of the E-jet, which is unlikely to be from the circumstellar disk, since it is uncommon to detect disks at the relatively low frequency of 10 GHz, so it is probably another bipolar jet, indicating that Ea most likely is a close binary (Figure 10).
11.6 Low-velocity Features and Outflow Cavities
11.6.1 The Region between Source Ea and Eb
Between source Ea and source Eb there is a redshifted triangular feature seen at around Vlsr11 to 14 in both 12CO and 13CO (Figures 45 and 46). At slightly lower velocities Vlsr10.0 to 11.6 km s-1 (central two panels in Figure 46) there appears to be wide-angle, U-shaped cavity walls opening up from source Eb towards the northwest at PA 330°. At slightly higher velocities between 11.6 and 14 km s-1, this U-shaped feature disappears.
The triangular redshifted feature northwest of source Ea and its U-shaped extension (Figure 56-left) may trace the receding, far-side of a wide angle cavity excavated over time by either a wide angle wind or sideways splashing material surrounding the C-jet ejected by source Ea. Support for this scenario comes from the detection of both the blue- and red-shifted gas at 13CO (Figure 46).
Figure 56-right illustrates the relationship between the C and E jets emerging from source Ea and the low-velocity cavity walls traced by 13CO. At LSR velocities between 10.0 and 11.8 km s-1 (i.e., very low redshifted velocities), the 13CO emission is concentrated in the center of the ALMA field. The emission peaks close to source Eb and shows narrow, curved extensions to the north, south, east and west of Eb that trace a pair of parabolic structures that open to the northwest and the southeast. The axis of symmetry of these structures is close to the orientations of the C and E jets. The apex of the south-facing feature coincides with the redshifted CO emission close to Ea and thus likely traces the walls of the outflow cavity associated with jet E. The base (and center) of the northern parabola is approximately at the position of Eb and its axis is coincident with that of jet C. Therefore, this structure likely traces the walls of the cavity evacuated by the outflow associated with jet C.
The compact MO1 outflow and redshifted SiO emission northwest of and driven by source Eb has an axis aimed more to the southeast and northwest, and appears to be unrelated to the cavity walls discussed above.
11.6.2 Source Wa
Near-infrared HST images show a bright compact reflection nebulosity located about 1 arcsec south-east of source Wa which may trace an outflow cavity (Figure 6). If so, source Wa may also contribute to the generation of blueshifted 12CO emission in the southern part of the ALMA field. A filamentary knot complex known as HH 24B (Herbig 1974) is located a few arc-seconds south of source Wa which may trace shocks where a wide-angle wind impacts the southern part of the SSV 63 cloud core, see Figures 12 ([Sii]) and 8 (H2). The ALMA 12CO map of outflow MO2 from source Wb (Figure 52) shows a wing of redshifted 12CO emission south of source Wa. This may trace the redshifted side of a wide-angle cavity surrounding the reflection nebulosity and filamentary H2 and [Feii] emission south of source Wa.
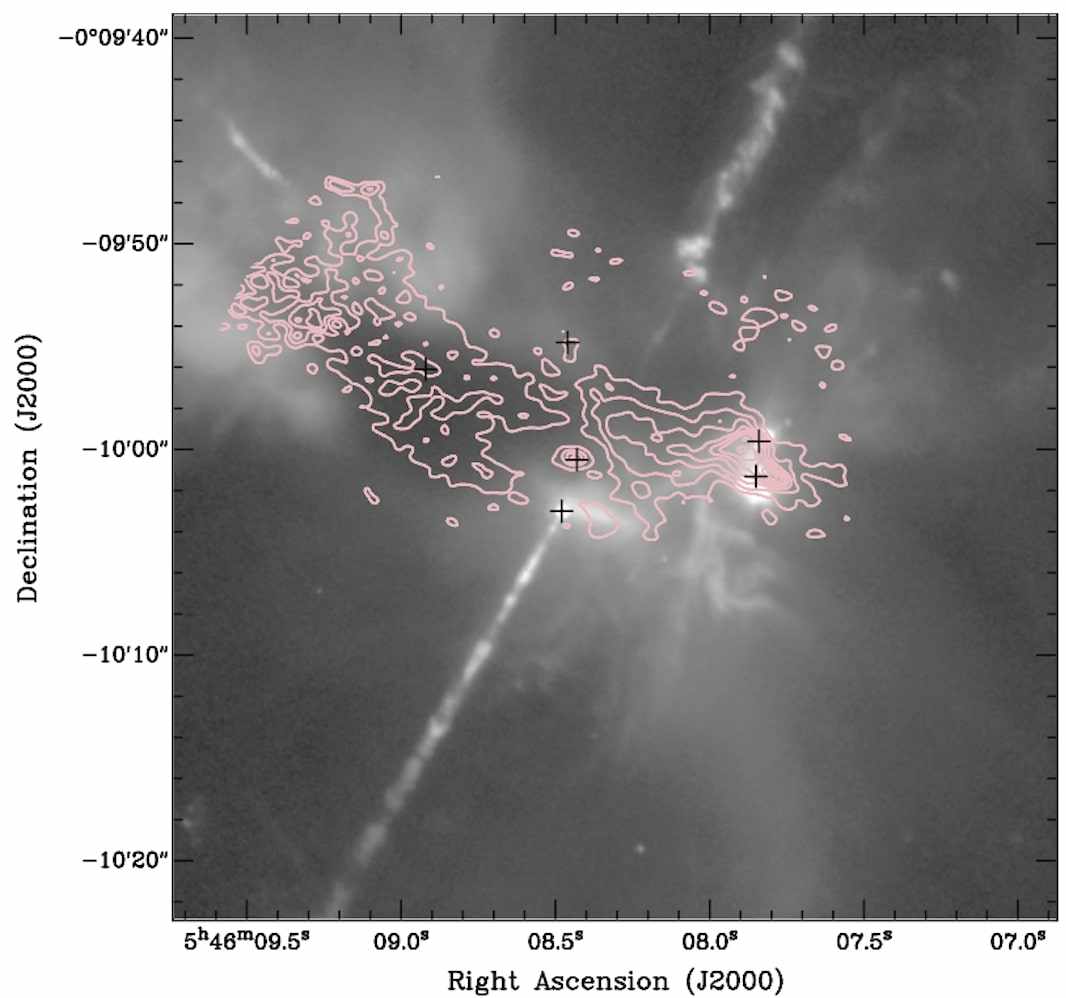
11.7 Formaldehyde Kinematics
At low blueshifted velocities (from about 8.6 km s-1 to 9.7 km s-1) the H2CO emission is concentrated in a 6″ to 7″ wide structure extending from the sources Ea and Eb and to the east-northeast up to the edge of the ALMA primary beam (Figure 57).
Figure 49 shows a clear velocity gradient, of about 2.1 km s-1 pc-1, along the structure towards the northeast with decreasing velocity (i.e. greater blueshifted velocities away from the central cloud velocity) at increasing distances from the field’s center. This is especially evident in the upper right frame in Figure 49. The feature shown there appears centered on source NE and exhibits U-shaped cavities facing away from this source along the axis of jet G propagating towards the northeast. At the edge of the H2CO flow, faint 13CO emission is detected at about Vlsr 9.2 km s-1 which appears to trace the walls of the structure seen in H2CO. Faint C18O emission is detected along the center of the H2CO flow, at low redshifted velocities (from about 10.2 to 10.7 km s-1). The C18O emission shows a velocity gradient where we, in contrast, see higher redshifted velocities the further away from the center of the field.
The interpretation of this formaldehyde flow is difficult. On morphological grounds, it appears to be associated with the cavity of the wide G-jet driven by source NE. The increase in velocity of the formaldehyde flow with increasing distance (a ’Hubble-flow’) from source NE could be caused by an explosion in this source. But it could also simply reflect geometry of the background cavity wall, which might be curving towards us. The projection into our line-of-sight of the flow-vectors along such a curve could produce the observed velocity field.
11.8 An Infalling Streamer?
At from 8.2 to 9.8 km s-1 we see a filamentary structure, in both the 13CO and C18O maps, that extends from the field center out to the edge of the field (see Figure 58). This structure, referred to as the streamer, shows a velocity gradient in which the gas at larger radii have, on average, lower blueshifted velocities compared to the gas closer to the center of the field (see Figure 59). This could be interpreted as infall from the far-side of the SSV 63 core feeding its center. The streamer is aimed at source Eb in the center of the SSV 63 cloud core.
As an order-of-magnitude estimate, the total C18O emission of the streamer is roughly 5% of the total C18O emission seen in the ALMA data. The mass of the HH 24 core has been measured as 2.3 M⊙ by Könives et al. (2020) (see Section 9), indicating that the streamer has a mass of roughly 0.12 M⊙. However, because ALMA resolves out most of the extended background emission, this is an upper bound on the mass of the infalling streamer.
Assuming an infall speed of 2 km s-1, the infall time from 7,200 AU, corresponding to the angular radius of the ALMA field-of-view, is 17,000 years. Thus, a rough upper limit to the mass accretion rate into the center is M⊙yr-1.
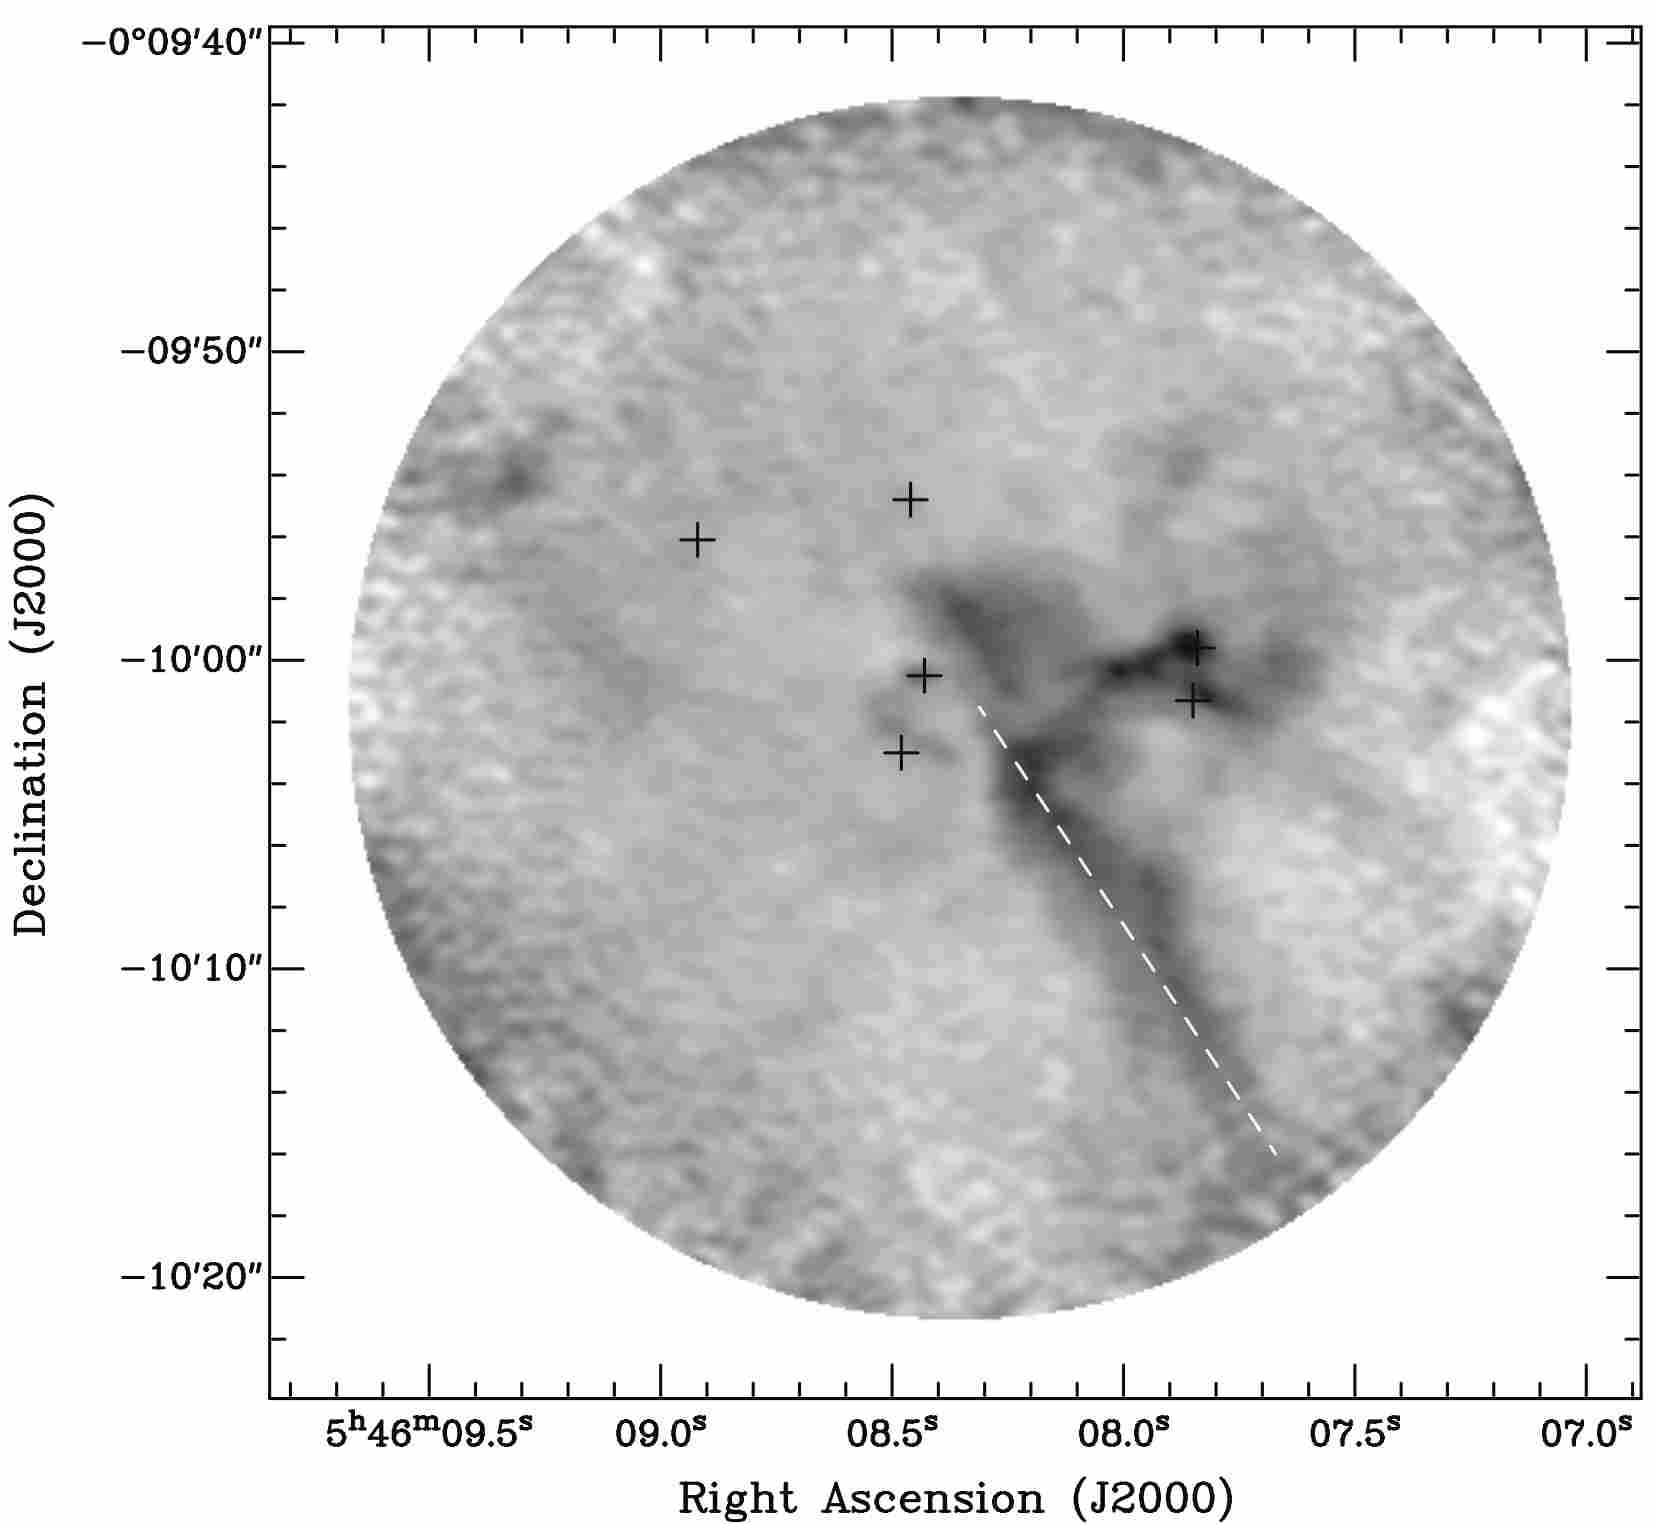
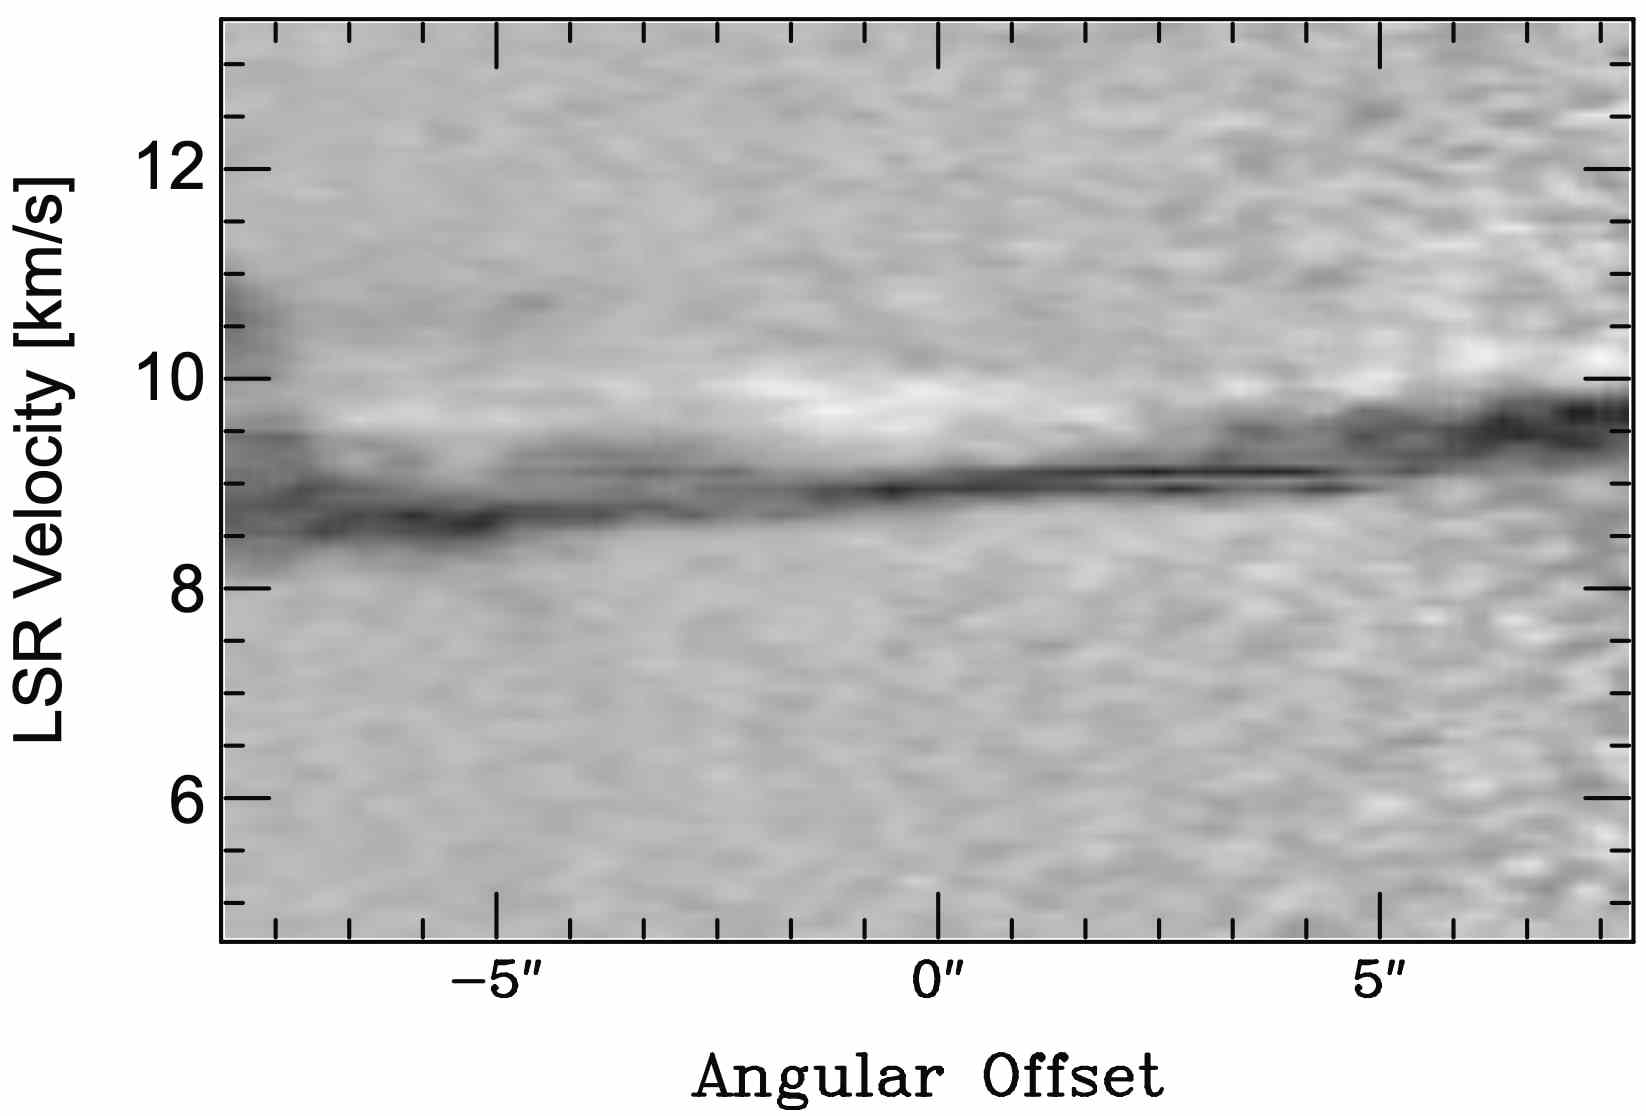
11.9 Interpretation of ALMA Data
The ALMA observations reveal several ultra-compact, bipolar molecular outflows emerging from YSOs embedded in the SSV 63 cloud core. The detected flows emerge from the sources Eb (MO1), Wb (MO2), and N (MO3). The CO emission from these flows range in size from 2″ to 10″ (800 to 4,000 AU), one to two orders-of-magnitude shorter than the chains of HH objects and MHOs which trace the parsec-scale regions impacted by the jets emerging from the SSV 63 core. Blue- and redshifted low radial-velocity, “perturbations” to the 12CO and 13CO and the H2CO line wings in the SSV 63 cloud core appear to be linked to outflow activity from sources Ea, Wa, and NE. The radial velocities of these 12CO and 13CO outflows are one to two orders-of-magnitude slower than the proper motions and radial velocities of the visual and near-IR wavelength jets, with detectable molecular emission reaching a maximum Vlsr of 15 to 20 km s-1 compared to the Vlsr of the core. As with many other highly evolved Herbig-Haro outflows, associated 12CO outflows are confined to the size-scale of the remnant parent cloud core. These relatively low-velocity outflow components are likely to be swept-up gas from the parent cloud by the action of velocity-variable jets or wide-angle winds that may surround the jets and be confined to outflow cavity walls.
The association of specific jets with individual sources constrains the evolutionary stages of the driving YSOs. The C and E jets are located at the base of the largest parsec-scale chain of HHs and MHOs emerging from the SSV 63 core. This giant flow consists of the MHOs SSE2-east and SSE2-west located 14′ (1.65 pc) south of source Ea and the HH 20, 21 and NNW shocks 13′ (1.45 pc) to the north. Comparison of the ALMA and HST images shows that the northwestern base of jet E coincides with the position of source Ea to within 0.1″. This implies that the southern lobe of this parsec-scale flow, powered by the redshifted jet E, emerges from source Ea which has a mass 1.9 - 2.0 M⊙, the second most massive YSO in the SSV 63 core. Assuming a steady, average mass accretion rate of M⊙yr-1, it would take years to accumulate Ea’s mass, the second most massive YSO in the core. Thus Ea may be the oldest or second oldest YSO formed in this core; it continues to drive active atomic and ionized jets indicating continuing accretion and stellar growth.
The most massive YSO is source NE that likely powers the G jet and the associated bow shock located 90″ (0.17 pc) northeast of the SSV 63 core. The association of the G jet with source NE is supported by the orientation of the NE disk, that has a minor axis closely aligned with this flow. There is no evidence for a larger, parsec-scale flow from source NE, indicating that the recent outflow activity responsible for the G jet and associated shocks followed an extended period of no outflow activity by source NE prior to the launch of the G jet. Assuming a jet speed of 100 km s-1, the dynamical age of the most distant detected bow shock at the head of the G jet is only 1,700 years.
12 DISCUSSION
12.1 The Formation of Jets
In the 70 years since the Herbig-Haro phenomenon was discovered (Herbig 1950,1951, Haro 1952,1953) the fundamental physical processes involved have been gradually established (Schwartz 1983, Reipurth & Bally 2001), as well as the properties of the molecular outflows that result from entrainment by the jets of the surrounding molecular clouds (Bachiller 1996, Bally 2016). There is general agreement that jets are launched when accreted matter interacts with magnetic fields within a few AU in the star-disk region, although the specific details of models vary greatly, see, e.g., Frank et al. (2014) for a review. In common for all these models is the issue of what triggers the accretion of matter to the central zone. A number of disk instability mechanisms have been identified that will lead to accretion with a concomitant outflow. Reipurth (2000) postulated that the giant, parsec-scale HH jets are driven by disk-instabilities induced by close periastron passages during the chaotic motions of the components of newborn non-hierarchical stellar systems, thus force-feeding the jet engine. This is in contrast to many small jets seen from single stars, which may result from internal disk instabilities.
12.2 Breakup of the SSV 63 Multiple System
The SSV 63 stellar group is a prototypical multiple system in a non-hierarchical configuration. It is an example of the exceedingly high stellar densities that can be associated with stellar birth: the stellar density of the HH 24 sources is estimated at about 4 105 pc-3, which is a factor of roughly 1000 times the stellar density in the center of globular clusters. This naturally leads to powerful dynamical interactions, and consequently such systems break up on timescales of about 100 crossing times (e.g., Valtonen & Mikkola 1991). Numerical simulations show that half of all break-ups occur during the embedded phase (Reipurth et al. 2010), lasting about 500,000 yr (Evans et al. 2009), which we then adopt as the upper limit for the age of the SSV 63 system.
The discovery that a low-mass young object, the borderline brown dwarf SSV 63 H 5, has been ejected from the SSV 63 multiple system about 5800 yr ago demonstrates directly the dynamical nature of this little group of protostars. With an upper limit of, say, 500,000 yr for the age of the SSV 63 multiple system, it is remarkable that we find a runaway star precisely during the last 1% of the age of the system. Either this is plain luck, or the ejection of low-mass members of the system is a more commonly occurring phenomenon. The top-heavy distribution of masses in SSV 63 might be an indicator that many other very low mass objects have been ejected during the lifetime of the system. Our search for runaway stars was limited to a small area about 10 arcmin around SSV 63. But if an object had been ejected 500,000 yr ago with a velocity of 25 km s-1 then in principle it could by now have travelled more than 4 degrees. Once Gaia DR4 is released, the proper motion uncertainties will be sufficiently low that a meaningful association with more distant objects can be established.
The escape speed from the SSV 63 system and its core is about 1.5 km s-1. Objects ejected with a lower speed will remain loosely tethered to the system, and will after a while return to the system, where numerical simulations suggest that they will be ejected again, until they eventually are kicked out with a velocity higher than the escape speed. Such almost-escapers can travel substantial distances before falling back. Given the ejection of H 5 within the very recent past, it appears likely that there could be a number of other both escaping and returning bodies that were once members of the SSV 63 multiple system. The ejection of low-mass cluster members has also been observed in regions of high mass star formation (Orion BN/KL, Gómez et al. 2008; W49 North, Rodríguez et al. 2020).
The energy for an ejection from an unstable triple system is acquired by shrinking the separation of two members. Usually the lowest mass member is ejected, and the two remaining members become bound into an eccentric binary. But occasionally a low-mass binary is ejected leaving behind a more massive member. If the triple is part of a larger multi-body system, the recoil of the remaining binary (or single) will add to the velocity dispersion of the system, and thus facilitate further break-up.
It follows that several of the SSV 63 components are likely to be close binaries. This is then consistent with the observation that a number of collimated jets are emanating from SSV 63 as a result of the inspiraling of binaries. Also we note the presence of what appears to be a quadrupolar radio continuum jet from source Ea, indicating that Ea is a close binary system. A similar quadrupolar radio morphology was found for HH 111 (Reipurth et al. 1999).
12.3 The Fate of the SSV 63 Multiple System
The non-hierarchical configuration of the SSV 63 multiple system implies that the system will inevitably undergo a dynamical transformation towards a hierarchical configuration, in the process likely losing several of its present members. There is evidently no way to predict the details of such a highly stochastic process, but one can approach the issue in a statistical manner. We have carried out numerical simulations using the N-body code described in detail by Reipurth & Mikkola (2012, 2015), except that a cloud core and accretion were not included. We model the SSV 63 system in an XYZ coordinate system, where XY is the plane of the sky, and we have assumed that the multiple system is as deep along the Z line-of-sight as it is across the XY-plane, that is, about 6000 AU. We fix the six bodies999The simulations were performed before the seventh member, N, was discovered with ALMA at the observed XY positions and randomly assign Z-values to each of the components in the range 3000 AU. We assume that the individual components have randomly oriented velocity vectors of 1 km s-1 corresponding to the velocity dispersion in a typical turbulent cloud. This is supported by the radial velocity differences of the stars measured by ALMA (Table 12). All bodies are assumed to have equal masses. We then run the code 1000 times for 100 Myr and review the end products at 1, 10, and 100 Myr. The results are the same within the uncertainties at 1, 10, and 100 Myr. For 1 Myr the values are as follows: Single bodies: 2919 (69.3%); Binaries: 958 (22.7%); Triples: 319 (7.6%); Quadruples: 19 (0.4%); Higher-order systems: none. The following conclusions can be drawn from these numbers:
(1): Since no system with an order higher than 4 survives, and even those are very rare, it follows that the sextuple SSV 63 system is almost certainly doomed to disintegrate.
(2): We note that 1000 simulations of six stars should lead to 6000 classifications in the above system categories, but the numbers do not add up to 6000, i.e. some stars are unaccounted for. While the simulations are very precise, in about 10% of the cases the analysis code that classifies the outcome cannot determine whether a nearby pair of stars are bound or not. For example two stars may be ejected in separate events and move close to each other, but it is not clear if the pair is bound or will become bound as the result of passing close to a third star. Such cases are not counted by the analysis software.
(3): A comparison between these simulations and observations of multiplicity (e.g., Raghavan et al. 2010) shows that in our simulations singles are overrepresented and triples are underrepresented. This is not surprising since our simulations do not include the molecular environment and the related dissipative processes that tend to bind pairs of stars into binaries and triples.
(4): The virtually unchanged numbers of singles, binaries, triples, and quadruples at 1, 10 and 100 Myr shows that the dynamical evolution is essentially complete within the first million years. It follows that the SSV 63 system is presently in a highly dynamical and unstable situation, as expected from its multi-component non-hierarchical configuration.
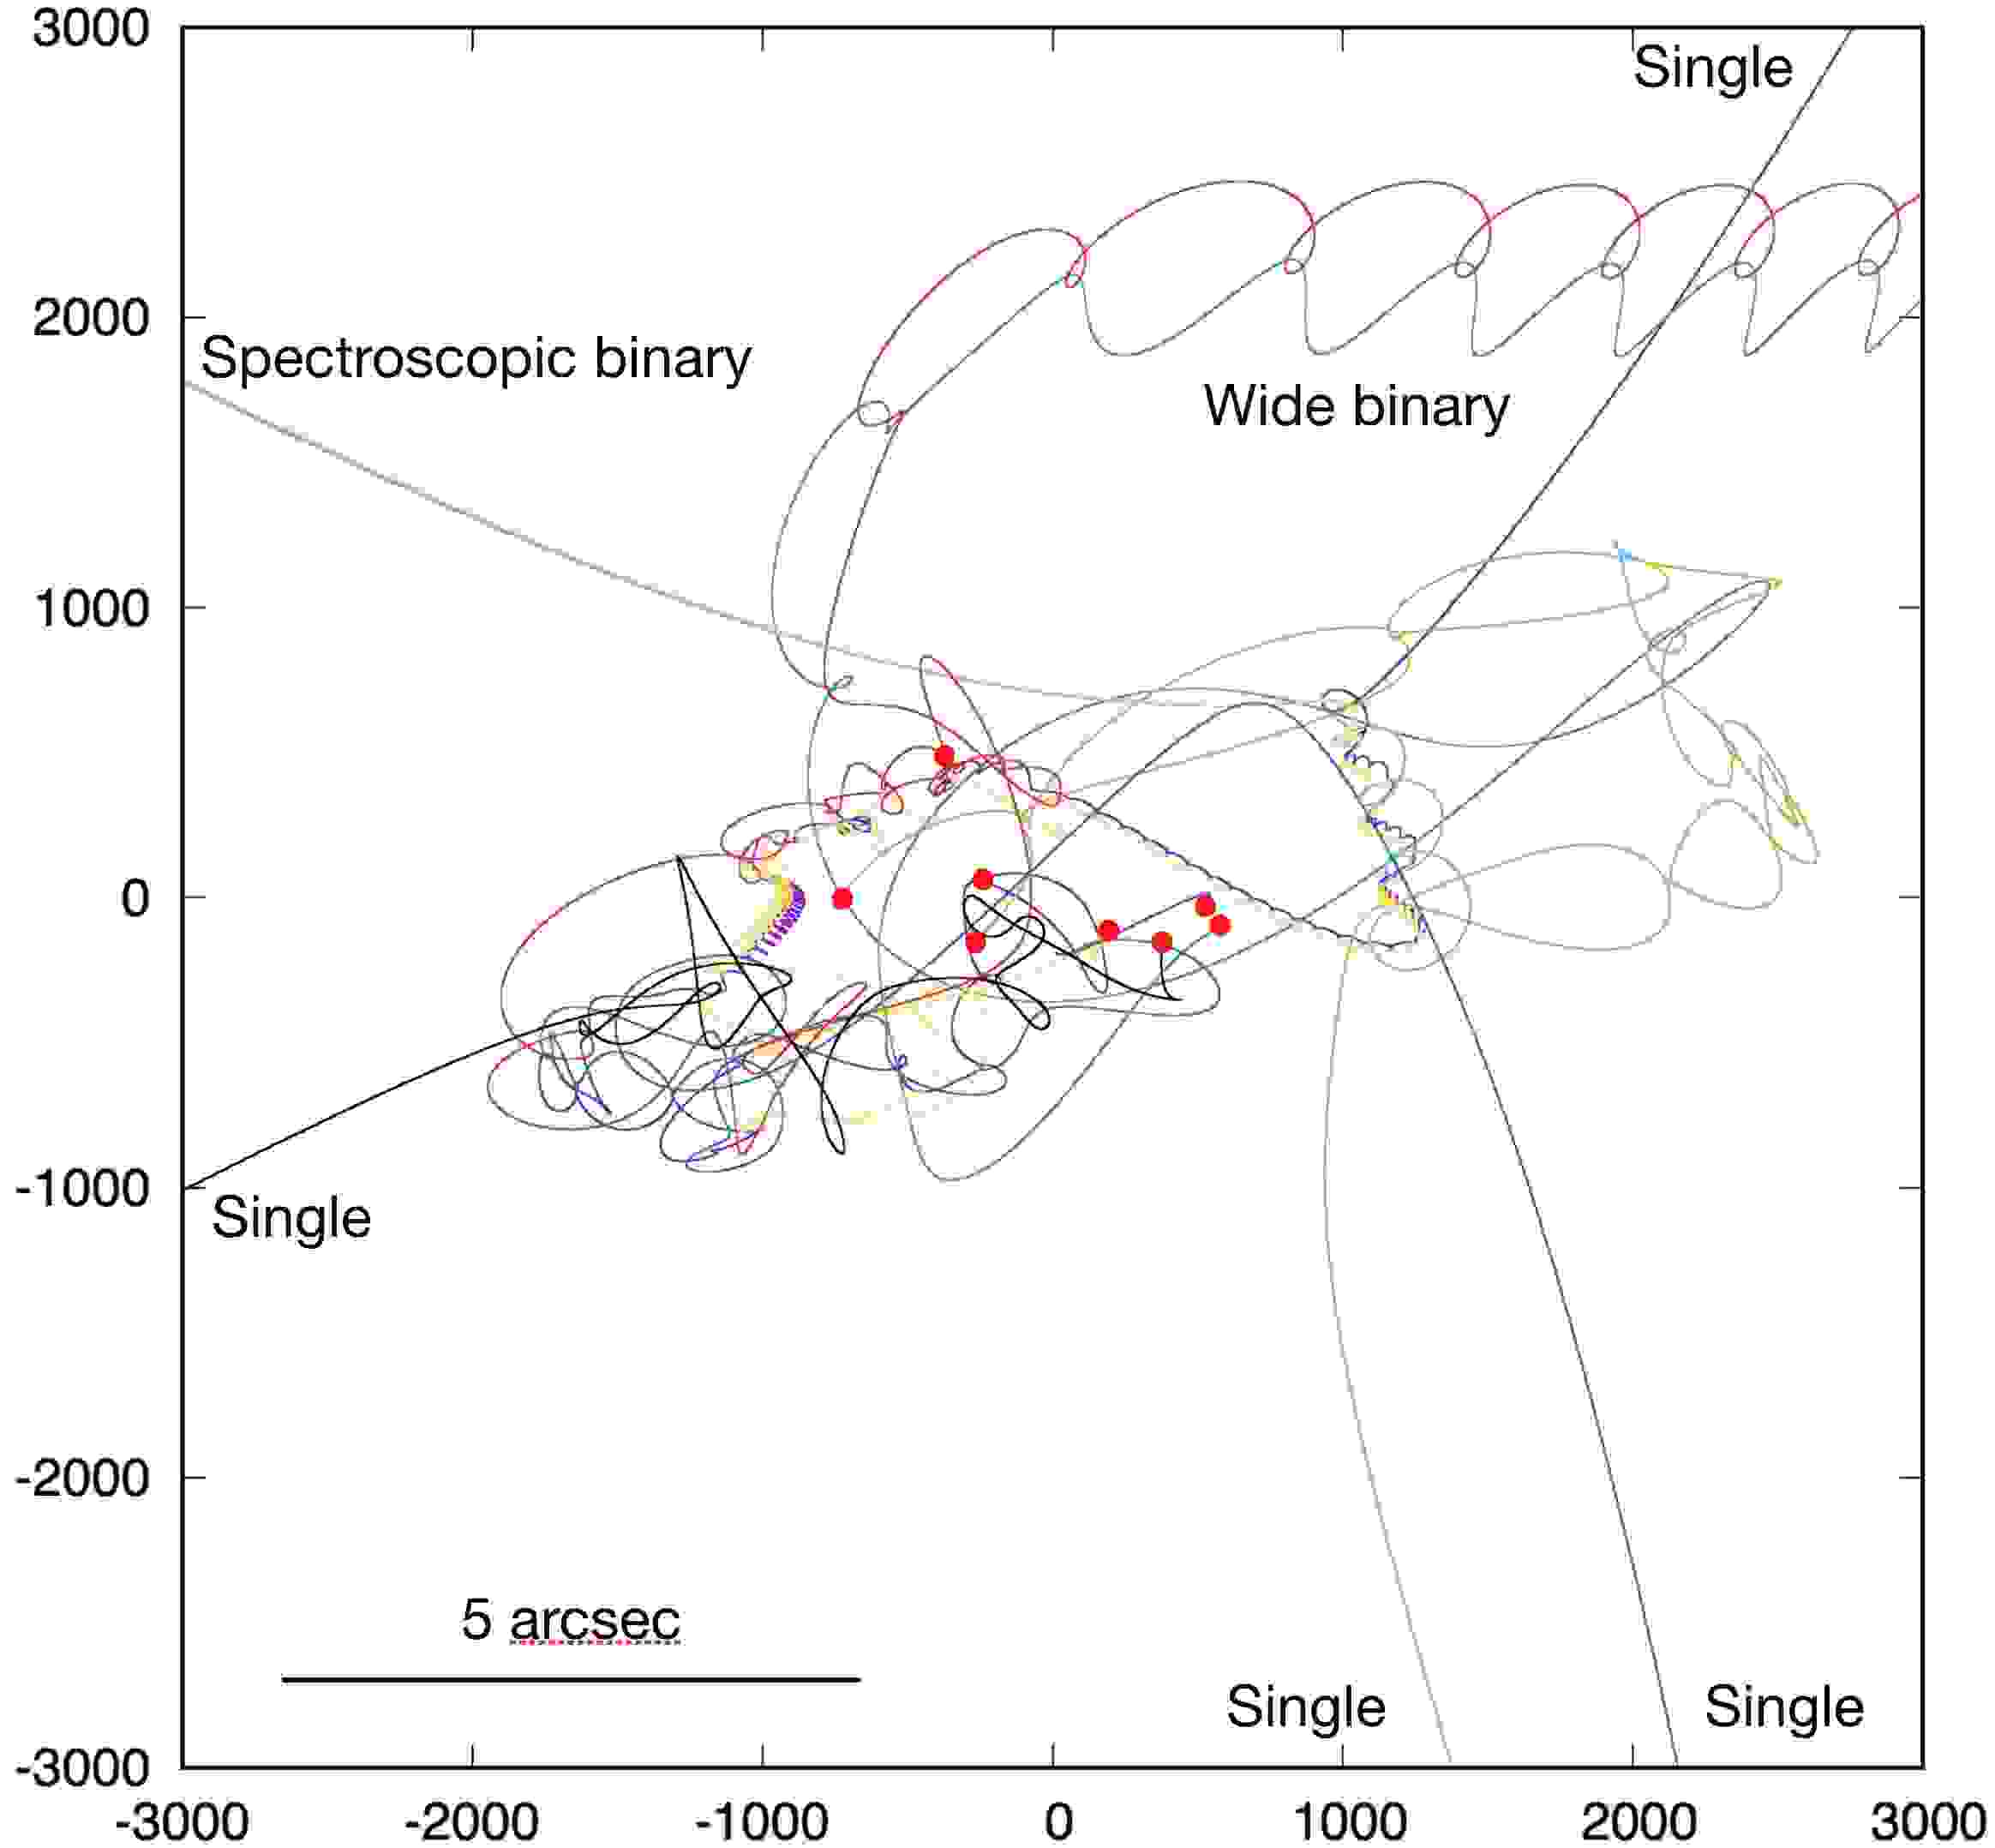
Similar results are obtained when running the code for higher-order systems. An example of an 8-body system is shown in Figure 60, in which a system with dimensions comparable to SSV 63 completely disintegrates within a million years.
SSV 63 is a specific case illustrating the dynamical evolution of small multiple systems. On a more general level, since numerical simulations show that about half of all ejections occur during the embedded phase while stars are still building their masses (Reipurth et al. 2010), it follows that dynamical interactions in small multiple systems play an important role in setting the masses of stars. Early ejections will in some cases lead to the formation of brown dwarfs (Reipurth & Clarke 2001), and later ejections at random times will play an important role in shaping the initial mass function (e.g., Bate & Bonnell 2005).
12.4 Flybys and Disk Structure
It has been known for some time that dynamical interactions in young binaries can have profound effects on circumstellar disks, as recognized in the seminal work of Clarke & Pringle (1993). Similarly, flybys in clusters can warp and truncate disks (e.g., Pfalzner 2003, Pfalzner & Govind 2021). Additionally, small embedded clusters are subject to ram pressure stripping from their passages through the ambient medium (Wijnen et al. 2017). Such effects are particularly pronounced in small non-hierarchical multiple systems still embedded in cloud cores, where stars chaotically move around each other on short time scales. With modern smoothed particle dynamical simulations such perturbations can be studied in great detail. Recent simulations by Cuello et al. (2020a,b) illustrate the various effects in detail. Among the observable signatures of such dynamical interactions are spiral arms, disk warping, diffuse halos of material pulled from disks, and disk truncation. High-resolution observations with ALMA, like the DSHARP project (Andrews et al. 2018), are able to detect such features, and they have been seen in several multiple systems (e.g., Kurtovic et al. 2018).
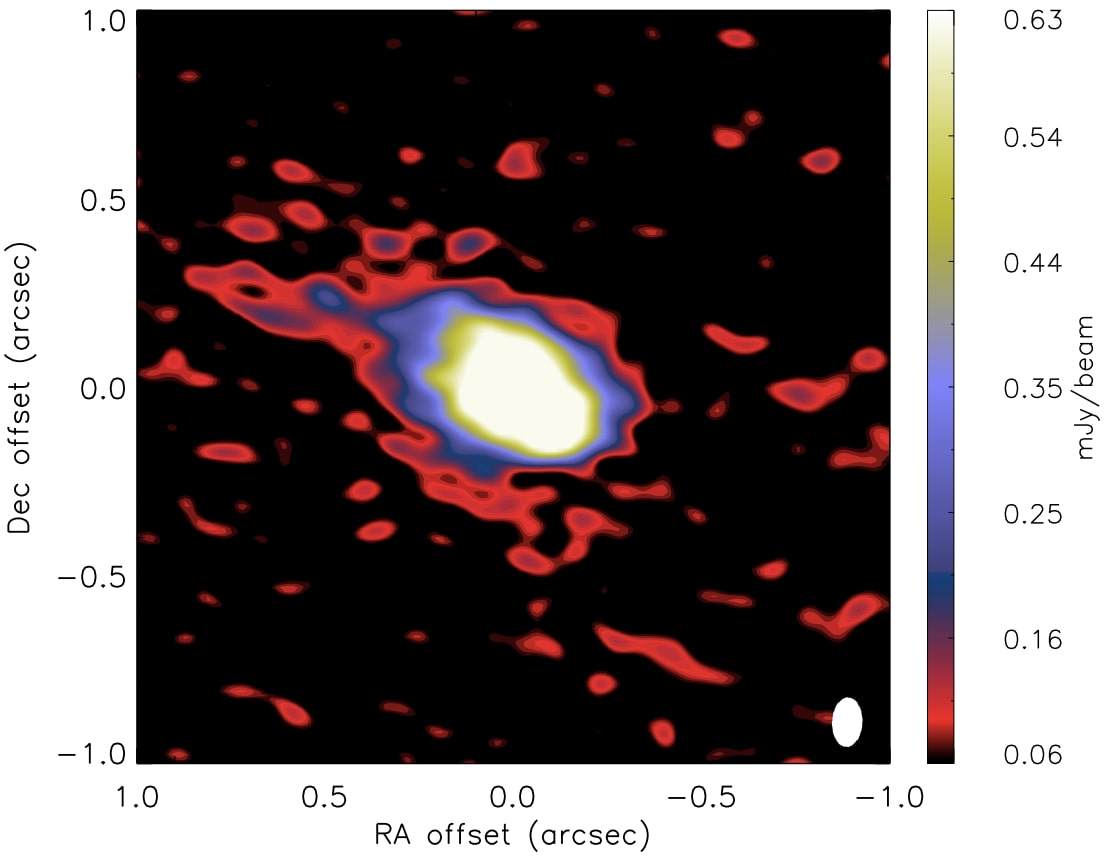
With the 012 angular resolution of the extended ALMA configuration the circumstellar disks of four of the sources in SSV 63 (Ea, Eb, Wb, and NE) are resolved, but at a distance of 400 pc finer structure of the disks is not discernable. However, disk radii can be estimated in both dust and C18O gas (Table 11). As is commonly seen, the dust disks are significantly smaller than the gaseous disks. For NE, Ea, Eb, Wa, and Wb we find dust radii of 51, 39, 159, 35, and 81 AU. We can compare this to the results of Tobin et al. (2020), who used ALMA to carry out a major 0.87 mm continuum survey of 328 protostars in Orion with similar angular resolution. For the subset of Class I non-multiple sources they find a median dust radius of 37 AU. However, it should be noted that the majority of protostars observed by Tobin et al. will arrive on the main sequence as M-dwarfs, whereas the SSV 63 components will become G, F, and A stars. It is well known that there is a clear correlation between dust radius and stellar mass, and Andrews (2020) suggests the relation Rmm M. Thus, it appears that the dust disks in SSV 63 are on average a factor 2 smaller than expected, which could be a signature that they have been truncated. However, the radius-stellar mass relation has significant scatter, and combined with the small number statistics we cannot be certain that the SSV 63 disks have suffered dynamically induced truncation.
The disks of sources Ea, Wb, and NE are almost perfectly symmetric, with no indication of recent perturbations. In contrast, the disk of Eb is asymmetric, with a diffuse halo or wing stretching towards the NNE (Figure 61). The length of this elongation is almost 0.5 arcsec, that is, about 200 AU in projected extent. Such an appearance is indicative of a recent interaction. However, because Eb is deeply embedded, it is conceivable that its diffuse appearance is related to an infalling envelope. Our current data cannot distinguish between these two possibilities.
13 SUMMARY AND CONCLUSIONS
We have performed a detailed observational study at optical, infrared, mm and cm wavelengths of the HH 24 jet complex and the multiple system SSV 63 that drives the various jets in order to better understand the nature of low- to intermediate-mass star formation in such a small system. We here summarize the main results:
1: The SSV 63 system is embedded in a cloud core, and the known components are the wide binaries Wa/Wb and Ea/Eb plus the NE source. All are likely Class I sources, but both NE and Eb are deeply embedded and only detected at mid-infrared and longer wavelengths, and may be borderline Class 0 sources. Our deep near-IR images have identified an additional faint source, S, and ALMA maps have discovered another deeply embedded source, N. Thus the cloud core, which is elliptical with dimensions of about 5,000 12,500 AU, contains at least 7 sources. The five main sources are all detected by the VLA, and source Wb has a secondary component.
2: The most prominent jet among the outflows is the finely collimated HH 24E jet. Multi-epoch HST images show the jet to be very bright in the [Feii] 1.64 m transition, to have a transverse velocity of around 250 km s-1 away from the driving source Ea, and expand with an opening angle of 2.6∘. Spectra show the jet to be redshifted, and to have an angle of 35∘ to the plane of the sky. Our VLA maps show a bipolar radio continuum jet from source Ea along the axis of the E-jet, with a smaller bipolar jet at right angles, indicating that source Ea is an unresolved binary.
3: The counter jet HH 24C displays a chaotic jumble of knots, likely the result of it having burrowed through the cloud core. High tangential velocities of about 300 km s-1 combined with a radial velocity around -200 km s-1 indicates that the jet is moving towards us at an angle of about 35∘ to the plane of the sky. A major new knot appeared at visual wavelengths from behind a cloud edge between 2006 and 2014.
4: The HH 24G jet has an unusual morphology, with fragments of a collimated jet surrounded by a tubular cavity with a diameter of 5000 AU and walls outlined by shocks. Its driving source is SSV 63 NE. Near the base of the jet is a bright and highly variable reflection nebulosity, indicating motion of shadowing material close to the source.
5: At large distances from HH 24, a group of HH objects, including HH 19, 20, and 21, is found to the NW; another, HH 27, is found to the SE. Proper motion measurements confirm previous suggestions that HH 19 and HH 27 form distant bow shocks from the faint jet HH 24J driven by the Wb source. The total extent of this giant bipolar flow is 1.39 pc in projection.
6: The group of objects HH 20 and 21 form part of a giant fractured working surface driven by the HH 24C jet. We have searched for further distant bow shocks along the well-defined flow axis and found an object, HH 24NNW, 1.45 pc from source Ea and along its flow axis. To the SE we have found several distant bow shocks, at distances of 0.98 and 1.67 pc from source Ea. The total extent of the E/C jet pair is thus 3.2 pc in projection, or 3.8 pc at an inclination of 35∘ to the plane of the sky.
7: The deeply embedded Class 0 VLA source HH 24-MMS, located 40 arcsec south of SSV 63, is shifted by 0.8 arcsec (320 AU) from its location observed in 2000. Possible explanations include variability in a binary, motion of the source, or dust heated through a lighthouse effect, none of which are without problems. Our H2 images reveal an extended series of shocks from the nearby Class 0 source HOPS 317.
8: The brightest shock in the HH 24 complex, HH 24A, is structurally and kinematically complex, with knots on its eastern side moving along the axis of the E-jet, while the central bright part is essentially stationary, and may represent a shock in the counterflow from the nearby source HOPS 317.
9: We have searched for additional YSOs near SSV 63, and have found five H-emission stars and brown dwarfs in the vicinity of SSV 63, with spectral types between M3.5 and M7. They are 1.5 to 2 arcmin from SSV 63, far outside the dense molecular core. Proper motions from Gaia show that one of these, SSV 63 H 5, moves straight away from the embedded sources with a tangential velocity of 26 km s-1. The object has a spectral type of M5.5, and is a borderline brown dwarf. H 5 was very close to the Class 0/I NE protostellar source about 5800 yr ago, and we assume NE is the source from which H 5 was dynamically ejected. Such an ejection requires that either NE or H 5 must be a close binary. If H 5 was ejected from a protostellar system it follows that it is itself protostellar, and hence it falls into the category of orphaned protostars (Reipurth et al. 2010). None of the other four H emission stars have significant motions, and their origin is unclear. Among these, H 1 drives a faint highly collimated jet, HH 1200, and H 2 is a young M7 brown dwarf.
10: Our 12CO observations with ALMA have revealed a few small molecular outflows. A bipolar one, labeled MO1, is centered on the deeply embedded source Eb and is perpendicular to the well-defined disk axis. The flow has a total extent of only about 2 arcsec, and is the only one that is also associated with SiO emission. Another bipolar flow, MO2, lies along the axis of the jet HH 24J driven by source Wb. The third bipolar outflow, MO3, is associated with the mm continuum source N. Surprisingly, the major bipolar E/C jet from source Ea does not show evidence of a molecular outflow, although some low-velocity emission may be associated with gas flowing along cavity walls.
11: A peculiar formaldehyde flow, 6′′-7′′ wide centered on source NE, is detected at low blueshifted velocities partly along the wide G-jet. Its velocity is increasing with distance from NE, and could be caused by an explosion, or be a flow gliding along a curved background cavity wall.
12: ALMA detects a large filamentary structure in 13CO and C18O extending from the edge of the field to its center with a slight 1.6 km s-1 gradient. This may be interpreted as a streamer of infalling material for which we estimate a rough upper limit to the mass feeding the core of 7 10-6 M⊙yr-1. Thus star formation in the core may be continously fed with fresh gas.
13: We have derived stellar masses of the four sources Ea, Eb, Wb, and NE assuming Keplerian rotation of their disks detected with ALMA. The masses are 2.0, 1.3, 0.9, and 2.1 M⊙, with estimated uncertainties of about 0.1 M⊙. The masses of Ea and NE indicate that they are proto-Herbig Ae stars. Eb and Wb have masses on the high end of T Tauri stars, but since both stars are heavily extincted and detectable only at mid-IR wavelengths, they may still gain a significant amount of gas.
14: The five dominant sources, Ea, Eb, Wa, Wb, and NE, display circumstellar disks in the ALMA observations, with major axes oriented almost precisely perpendicular to the prominent jets they drive. For four of the sources, Ea, Eb, Wb, and NE, disk radii are derived for the gas and the dust. On average, they are about a factor 2 smaller than inferred from a disk radius-stellar mass correlation. This might be the result of truncation in this dynamically active system, but due to the large scatter of the correlation and the small number of sources observed, a firm conclusion is premature. The disk of Eb is irregular with a larger eastern lobe that might be the result of a close encounter with another of the sources.
15: We determine a mass of 3.3 M⊙ for the cloud core in which the SSV 63 multiple system resides based on the 850 m data of Kirk et al. (2016a,b). A lower limit to the total stellar mass of the multiple system is roughly 7 M⊙. A filamentary structure in the region which may be an infalling streamer of gas, suggests that the core may be continously forming stars as its gas content is replenished.
16: SSV 63 is an excellent example of a protostellar multiple system of at least 7 embedded sources and one low-mass runaway borderline brown dwarf. With a non-hierarchical configuration, the system is unstable with the stars moving chaotically among each other. This will eventually lead to the breakup of the system, in the process ejecting a number of the members, preferentially those with lowest mass. Numerical simulations indicate that the system will almost completely disintegrate within less than 1 million years. As the stars are ejected from their feeding zones their masses are set, and dynamical interactions in small protostellar multiple systems are thus an important factor in defining the initial mass function.
14 Acknowledgements
We thank an anonymous referee for an insightful report, which improved this paper. We also thank Helen Kirk for providing Figure 34, Göran Sandell for help with the Herschel data, and Isabel Baraffe for advice on the BHAC15 models. B.R. acknowledges support by NASA through grant HST-GO-13485. J.B. acknowledges support by the National Science Foundation through grant AST-1910393. H.-W.Y. acknowledges support from Ministry of Science and Technology (MOST) in Taiwan through the grant MOST 110-2628-M-001-003-MY3 and from the Academia Sinica Career Development Award (AS-CDA-111-M03). H.G.A. acknowledges support from the National Science Foundation award AST-1714710. L.F.R. acknowledges the financial support of DGAPA (UNAM) IN105617, IN101418, N110618 and IN112417 and CONACyT 238631 and 280775. A.C.R. acknowledges support by DGAPA (UNAM) grant IG100422. This paper makes use of the following ALMA data: ADS/JAO.ALMA#2018.1.01194.S. ALMA is a partnership of ESO (representing its member states), NSF (USA) and NINS (Japan), together with NRC (Canada), MOST and ASIAA (Taiwan), and KASI (Republic of Korea), in cooperation with the Republic of Chile. The Joint ALMA Observatory is operated by ESO, AUI/NRAO and NAOJ. The National Radio Astronomy Observatory is a facility of the National Science Foundation operated under cooperative agreement by Associated Universities, Inc. Based in part on data collected at the Subaru Telescope, which is operated by the National Astronomical Observatory of Japan (NAOJ). Thanks are due to the Subaru staff, in particular Miki Ishii and Hisanori Furusawa for excellent and dedicated support during the observations. We are grateful to Nobunari Kashikawa for permission to use his [Sii] filter. Based in part on observations (GN-2010A-Q-10, GN-2013B-Q-77) obtained at the international Gemini Observatory, a program of NSF’s NOIRLab, which is managed by the Association of Universities for Research in Astronomy (AURA) under a cooperative agreement with the National Science Foundation on behalf of the Gemini Observatory partnership: the National Science Foundation (United States), National Research Council (Canada), Agencia Nacional de Investigación y Desarrollo (Chile), Ministerio de Ciencia, Tecnología e Innovación (Argentina), Ministério da Ciência, Tecnologia, Inovações e Comunicações (Brazil), and Korea Astronomy and Space Science Institute (Republic of Korea). We are thankful to Richard McDermid for help with the Gemini Phase II submission. This research is based in part on observations made with the NASA/ESA Hubble Space Telescope obtained from the Space Telescope Science Institute, which is operated by the Association of Universities for Research in Astronomy, Inc., under NASA contract NAS 5-26555. The VLA observations were part of our project 19A-012, made with the NSF’s Karl G. Jansky Very Large Array (VLA) of the National Radio Astronomy Observatory, which is a facility of the National Science Foundation operated under cooperative agreement by Associated Universities, Inc. Observations were obtained with the Apache Point Observatory 3.5-meter telescope, which is owned and operated by the Astrophysical Research Corporation. We thank the APO Observing Specialists for their assistance during the observations. This work is based in part on observations made with the Spitzer Space Telescope, which is operated by the Jet Propulsion Laboratory, California Institute of Technology under a contract with NASA, and by Herschel, which is an ESA space observatory with science instruments provided by European-led Principal Investigator consortia and with important praticipation from NASA. This publication makes use of data products from the Two Micron All Sky Survey, which is a joint project of the University of Massachusetts and the Infrared Processing and Analysis Center/California Institute of Technology, funded by the National Aeronautics and Space Administration and the National Science Foundation. Based on observations collected at the European Organisation for Astronomical Research in the Southern Hemisphere and extracted from the ESO archives. This material is based upon work supported by the National Aeronautics and Space Administration through the NASA Astrobiology Institute under Cooperative Agreement No. NNA09DA77A issued through the Office of Space Science. This research has made use of the SIMBAD database, operated at CDS, Strasbourg, France, and of NASA’s Astrophysics Data System Bibliographic Services.
Facilities: Gemini (GMOS,GNIRS), Spitzer, Subaru (SuprimeCam,IRCS), Herschel, ALMA, VLA, HST (WFC3,ACS), Apache Point Observatory 3.5m (ARCES, ARCTIC, NICFPS), VLT (NACO)
References
- Bok (1999) Andrews, S.M. 2020, ARAA, 58, 483
- Bok (1999) Andrews, S.M., Huang, J., Pérez, L.M. et al. 2018, ApJL, 869, L41
- Bok (1999) Anglada, G., Rodríguez, L.F., Carrasco-González, C. 2018, Astron. Astrophys. Rev. 26, 3
- Bok (1999) Anosova, J.P. 1986, Ap&SS, 124, 217
- Bok (1999) Anthony-Twarog, B.J. 1982, AJ, 87, 1213
- Bok (1999) Arce, H.G. & Goodman, A.A. 2001, ApJ, 551, L17
- Bok (1999) Armitage, P.J. & Clarke, C.J. 1997, MNRAS, 285, 540
- Bok (1999) Bacciotti, F. & Eislöffel, J. 1999, A&A, 342, 717
- Bok (1999) Bachiller, R. 1996, ARAA, 34, 111
- Bok (1999) Bally, J. 2016, ARAA, 54, 491
- Bok (1999) Bally, J. & Reipurth, B. 2001, ApJ, 546, 299
- Bok (1999) Bally, J., O’Dell, C.R., McCaughrean, M.J. 2000, AJ, 119, 2919
- Bok (1999) Bate, M.R. 2009, MNRAS, 392, 590
- Bok (1999) Bate, M.R. 2012, MNRAS, 419, 3115
- Bok (1999) Bate, M.R. & Bonnell, I.A. 2005, MNRAS, 356, 1201
- Bok (1999) Bate, M.R., Bonnell, I.A., & Bromm, V. 2002, MNRAS, 336, 705
- Beckwith et al. (1990) Beckwith, S. V. W., Sargent, A. I., Chini, R. S., et al. 1990, AJ, 99, 924
- Bok (1999) Benedettini, M., Giannini, T., Nisini, B., Tommasi, E., Lorenzetti, D., Di Giorgio, A. M., Saraceno, P., Smith, H. A., & White, G. J. 2000, A&A, 359, 148
- Bok (1999) Bieging, J.H., Cohen, M., & Schwartz, P.R. 1984, ApJ, 282, 699
- Bok (1999) Bontemps, S., André, P., & Ward-Thompson, D. 1995, A&A, 297, 98
- Bok (1999) Bontemps, S., Ward-Thompson, D., & Andre, P. 1996, A&A, 314, 477
- Bok (1999) Böhm, K.-H., Noriega-Crespo, A., Solf, J., & Brugel, E.W. 1992, PASP, 104, 251
- Braun et al. (2021) Braun, T. A. M., Yen, H.-W., Koch, P. M., et al. 2021, ApJ, 908, 46
- Bok (1999) Briggs, D.S. 1995, PhD dissertation, The New Mexico Institute of Mining and Technology, Socorro, New Mexico
- Bok (1999) Brugel, E.W., Böhm, K.-H., & Mannery, E. 1981, ApJS, 47, 117
- Bok (1999) Chandler, C.J., Koerner, D.W., Sargent, A.L., & Wood, D.O.S. 1995 ApJ 449, L139 (erratum ApJ 455, L93)
- Bok (1999) Chen, X., Arce, H.G., Zhang, Q. et al. 2013, AJ, 768, 110
- Bok (1999) Chini, R., Krügel, E., Haslam, C.G.T., Kreysa, E., Lemke, R., Reipurth, B., Sievers, A., Ward-Thompson, D. 1993, A&A, 272, L5
- Bok (1999) Clarke, C.J. & Pringle, J.E. 1993, MNRAS, 261, 190
- Bok (1999) Cohen, M. & Schwartz, R.D. 1987, ApJ, 316, 311
- Bok (1999) Connelley, M.S., Reipurth, B., Tokunaga, A.T. 2008a, AJ, 135, 2496
- Bok (1999) Connelley, M.S., Reipurth, B., Tokunaga, A.T. 2008b, AJ, 135, 2526
- Bok (1999) Cuello, N., Dipierro, G., Mentiplay, D. et al. 2019, MNRAS, 483, 4114
- Bok (1999) Cuello, N., Louvet, F., Mentiplay, D. et al. 2020, MNRAS, 491, 504
- Bok (1999) Dahm, S.E. & Hillenbrand, L.A. 2017, AJ, 154, A177
- Bok (1999) Davis, C.J., Ray, T.P., Eislöffel, J., & Corcoran, D. 1997, A&A, 324, 263
- Bok (1999) Davis, C.J., Gell, R., Khanzadyan, T. et al. 2010, A&A, 511, A24
- Bok (1999) Delgado-Donate, E.J., Clarke, C.J., Bate M.R., Hodgkin, S.T. 2004, MNRAS, 351, 617
- Bok (1999) Dopita, M. 1978, ApJS, 37, 117
- Bok (1999) Duchêne, G. & Kraus, A. 2013, ARA&A, 51, 269
- Bok (1999) Erkal, J., Nisini, B., Coffey, D. et al. 2021, ApJ, 919, 23
- Bok (1999) Eislöffel, J. & Mundt, R. 1997, AJ, 114, 280
- Bok (1999) Evans, N.J., Dunham, M.M., Jørgensen, J.K. et al. 2009, ApJS, 181, 321
- Bok (1999) Fang, M., van Boekel, R., Wang, W. et al. 2009, A&A, 504, 461
- Bok (1999) Furlan, E., Fischer, W.J., Ali, B. et al. 2016, ApJS, 224:A5
- Bok (1999) Gibb, A.G. 2008, in Handbook of Star Forming Regions Vol. I, Ed. Bo Reipurth, ASP, p. 693
- Bok (1999) Gibb, A.G., Heaton, B.D. 1993, A&A, 276, 511
- Bok (1999) Gibb, A.G. & Little, L.T. 1998, MNRAS, 295, 299
- Bok (1999) Gibb, A.G., Little, L.T., Heaton, B.D., & Lehtinen, K.K.
- Bok (1999) Gómez, L., Rodríguez, L.F., Loinard, L. et ak. 2008, ApJ, 685, 333
- Bok (1999) Graham, J.A. & Phillips, A.C. 1987, PASP, 99, 91
- Bok (1999) Hartigan, P. 1989, ApJ, 339, 987
- Bok (1999) Hartigan, P., Heathcote, S., Morse, J.A. et al. 2005, AJ, 130, 2197
- Bok (1999) Hartigan, P., Frank, A., Foster, J.M. et al. 2011, ApJ, 736, 29
- Bok (1999) Heathcote, S., Morse, J.A., Hartigan, P. et al. 1996, AJ, 112, 1141
- Bok (1999) Herbig, G.H. 1974, Lick Obs. Bull., Vol. 658, p.1
- Bok (1999) Herbig, G.H. & Kuhi, L.V. 1963, ApJ, 137, 398
- Bok (1999) Hillenbrand, L.A., 1995, PhD thesis, Univ. of Massachusetts
- Bok (1999) Hillenbrand, L.A., Meyer, M.R., Strom, S.E., Skrutskie, M.F. 1995, AJ, 109, 280
- Ho et al. (2004) Ho, P. T. P., Moran, J. M., & Lo, K. Y. 2004, ApJ, 616, L1
- Bok (1999) Hodapp, K.-W. 1994, ApJS, 94, 615
- Bok (1999) Hoyle, F. 1953, ApJ, 118, 513
- Bok (1999) Hsieh, C.-H., Arce, H.G., Mardones, D. et al. 2021, ApJ, 980, A92
- Bok (1999) Hubble, E.P. 1917, ApJ., 45, 351
- Bok (1999) Jones, B.F., Cohen, M., Wehinger, P.A., & Gehren, T. 1987, AJ, 94, 1260
- Bok (1999) Kang, M., Choi, M., Ho, P.T.P., & Lee, Y. 2008, ApJ, 683, 267
- Bok (1999) Kirk, H., Di Francesco, J., Johnstone, D. et al. 2016, ApJ, 817, A167
- Bok (1999) Kounkel, M., Hartmann, L., Loinard, L. et al. 2017, ApJ, 834, A142
- Bok (1999) Knox-Shaw, H. 1916, MNRAS, 76, 646
- Bok (1999) Kratter, K.M. & Matzner, C.D. 2006, MNRAS, 373, 1563
- Bok (1999) Krügel, E., Chini, R. 1994, A&A, 287, 947
- Bok (1999) Könyves, V., André, Ph., Arzoumanian, D. et al. 2020, A&A, 635, A34
- Bok (1999) Kurtovic, N.T., Pérez, L.M., Benisty, M. et al. 2018, ApJL, 869, L44
- Bok (1999) Lada, E.A., Bally, J., Stark, A.A. 1991, ApJ, 368, 432
- Lane et al. (2016) Lane, J., Kirk, H., Johnstone, D., et al. 2016, ApJ, 833, A44
- Bok (1999) Larson, R.B. 1972, MNRAS, 156, 437
- Bok (1999) Lee, C.-F., Mundy, L.G., Reipurth, B., Ostriker, E.C. et al. 2000, ApJ, 542, 925
- Bok (1999) Lee, M. G., Böhm, K. H., Temple, S. D., et al. 1988, ApJ, 334, 229
- Bok (1999) Leggett, S.K., Hawarden, T.G., Currie, M.J. et al. 2003, MNRAS 345, 144
- Bok (1999) Lenzen, R., Hartung, M., Brandner, W. et al. 2003, SPIE, 4841, 944
- Bok (1999) Leinert, Ch., Zinnecker, H., Weitzel, N. et al. 1993, A&A, 278, 129
- Bok (1999) Lis, D.C, Menten, K.M., & Zylka, R. 1999, ApJ, 527, 856
- Bok (1999) Little, L. T., Davies, S. R., Riley, P. W., Matthews, N., MacDonald, G. H., Vizard, D. R., Ellison, B. N., & Nyman, L.-A. 1985, A&A, 142, 378
- Bok (1999) Lombardi, M., Alves, J., Lada, C.J. 2011, A&A, 535, A16
- Bok (1999) Mamajek, E.E., Kenworthy, M.A., Hinz, P.M., and Meyer, M.R. 2010, AJ, 139, 919
- Bok (1999) Matthews, N. & Little, L.T. 1983, MNRAS, 205, 123
- Bok (1999) McBride, A. & Kounkel, M. 2019, ApJ, 884:6
- Bok (1999) McMullin, J.P., Waters, B., Schiebel, D. et al. 2007, ASPC vol. 376, eds. R.A. Shaw, F. Hill, D.J. Bell, p.127
- Bok (1999) Megeath, S.T., Gutermuth, R., Muzerolle, J. et al. 2012, AJ, 144:192
- Bok (1999) Mitchell, G.F., Johnstone, D., Moriarty-Schieven, G., Fich, M., & Tothill, N.F.H. 2001, ApJ, 556, 215
- Bok (1999) Moneti, A. & Reipurth, B. 1995, A&A, 301, 721
- Bok (1999) Moro-Martin, A., Noriega-Crespo, A., Böhm, K.-H., & Raga, A.C. 1996, Rev. Mex. Astron. Astrofis., 32, 75
- Bok (1999) Mundt, R., Bührke, T., Fried, J.W. et al. 1984, A&A 140, 17
- Bok (1999) Mundt, R., Ray, T.P., & Raga, A.C. 1991, A&A, 252, 740
- Bok (1999) Offner, S.S.R., Moe, M., Kratter, K.M. et al. 2022, Protostars and Planets VII, arXiv:2203.10066
- Bok (1999) Ozawa, H., Nagase, F., Ueda, Y., Dotani, T., & Ishida, M. 1999, ApJ, 523, L81
- Bok (1999) Persson, S.E., Murphy, D.C., Krzeminski, W. et al. 1998, AJ, 116, 2475
- Bok (1999) Pfalzner, S. 2003, ApJ, 592, 986
- Bok (1999) Pfalzner, S. & Govind, A. 2021, ApJ, 921:90
- Bok (1999) Phillips, R.R., Gibb, A.G., & Little, L.T. 2001, MNRAS 326, 927
- Bok (1999) Principe, D.A., Kastner, J.H., Grosso, N., Hamaguchi, K., Richmond, M. et al. 2014, ApJS, 213, A4
- Bok (1999) Raga, A.C., Esquivel, A., Velázquez, Canto, J., et al. 2009a, ApJ, 707, L6
- Bok (1999) Raga, A.C., Cantó, J., Rodríguez-González, A., Esquivel, A. 2009b, A&A, 493, 115
- Bok (1999) Raga, A.C. & Noriega-Crespo, A. 2013, RMxAA, 49, 363
- Bok (1999) Raga, A.C., Reipurth, B., Velazquez, P.F. et al. 2016a, AJ, 152:186
- Bok (1999) Raga, A.C., Reipurth, B., A. Esquivel, Bally, J. 2016b, AJ, 151:113
- Bok (1999) Raghavan, D., McAlister, H.A., Henry, T.J. et al. 2010, ApJS, 190, 1
- Bok (1999) Reipurth, B. 2000, AJ, 120, 3177
- Bok (1999) Reipurth, B. & Bally, J. 1986, Nature, 320, 336
- Bok (1999) Reipurth, B. & Bally, J. 2001, ARAA, 39, 403
- Bok (1999) Reipurth, B. & Clarke, C.J. 2001, AJ, 122, 432
- Bok (1999) Reipurth, B. & Heathcote, S. 1992, A&A, 257, 693
- Bok (1999) Reipurth, B. & Mikkola, S. 2012, Nature, 492, 221
- Bok (1999) Reipurth, B. & Mikkola, S. 2015, AJ, 149:A145
- Bok (1999) Reipurth, B. & Zinnecker, H. 1993, A&A,, 278, 81
- Bok (1999) Reipurth, B., Yu, K.C., Rodríguez, L.F. et al. 1999, A&A, 352, L83
- Bok (1999) Reipurth, B., Heathcote, S., Yu, K.C. et al. 2000, ApJ, 534, 317
- Bok (1999) Reipurth, B., Heathcote, S., Morse, J. et al. 2002a, AJ, 123, 362
- Bok (1999) Reipurth, B., Rodríguez, L.F., Anglada, G., & Bally, J. 2002b, AJ, 124, 1045
- Bok (1999) Reipurth, B., Rodríguez, L.F., Anglada, G., & Bally, J. 2004, AJ, 127, 1736
- Bok (1999) Reipurth, B., Mikkola, S., Connelley, M., & Valtonen, M. 2010, ApJ, 725, L56
- Bok (1999) Reipurth, B., Clarke, C.J., Boss, A.P. et al. 2014, in Protostars and Planets VI, eds. H. Beuther et al., Univ. Arizona Press, p. 267
- Bok (1999) Riaz, B. & Bally, J. 2021, MNRAS, 504, 6049
- Bok (1999) Rodríguez, L.F., Anglada, G., Curiel, S. 1999, ApJS, 125, 427)
- Bok (1999) Rodríguez, L.F., Galván-Madrid, R., Sanchez-Bermudez, J. et al. 2020, ApJ, 890:165
- Bok (1999) Rousset, G., Lacombe, F., Puget, P. et al. 2003, SPIE 4839, 140
- Sanchis et al. (2021) Sanchis, E., Testi, L., Natta, A., et al. 2021, A&A, 649, A19
- Bok (1999) Scarrott, S.M., Gledhill, T.M., & Warren-Smith, R.F. 1987, MNRAS, 227, 1065
- Bok (1999) Schmidt, G.D. & Miller, J.S. 1979, ApJ, 234, L191
- Bok (1999) Schoettler, C., de Bruijne, J., Vaher, E, Parker, R.J. 2020, MNRAS, 495, 3104
- Bok (1999) Simon, T. Andrews, S.M., Rayner, J.T., & Drake, S.A. 2004, ApJ, 611, 940
- Bok (1999) Skinner, C. J., et al. 1998, Proc. SPIE, 3354, 2
- Bok (1999) Snell, R.L. & Edwards, S. 1982, ApJ, 259, 668
- Bok (1999) Solf, J. 1987, A&A, 184, 322
- Bok (1999) Spezzi, L., Petr-Gotzens, M.G., Alcalá, J.M. et al. 2015, A&A, 581:A140
- Bok (1999) Sadavoy, S.I. & Stahler, S.W. 2017, MNRAS 469, 3881
- Bok (1999) Stahler, S.W. 2010, MNRAS, 402, 1758
- Stanke et al. (2022) Stanke, T., Arce, H. G., Bally, J., et al. 2022, A&A, 658, A178
- Bok (1999) Steinhausen, M., Olczak, C., Pfalzner, S. 2012, A&A, 538, A10
- Bok (1999) Sterzik, M.F. & Durisen, R.H. 1998, A&A, 339, 95
- Bok (1999) Strom, S.E., Grasdalen, G.L., & Strom, K.M. 1974a, ApJ, 191, 111
- Bok (1999) Strom, K.M., Strom, S.E., Kinman, T.D. 1974b, ApJ, 191, L93
- Bok (1999) Strom, K.M., Strom, S.E., & Vrba, F.J. 1976, AJ, 81, 308
- Bok (1999) Strom, K.M., Strom, S.E., Wolff, S.C., Morgan, J., & Wenz, M. 1986, ApJS, 62, 39
- Bok (1999) Terquem, C., Eislöffel, J., Papaloizou, J.C.B., & Nelson, R.P. 1999, ApJ, 512, L131
- Bok (1999) Testi, L., Palla, F., Prusti, T. et al. 1997, A&A, 320, 159
- Bok (1999) Tobin, J.J., Looney, L.W., Li, Z.-Y. et al. 2016, Nature, 538, 483
- Bok (1999) Tobin, J.J., Looney, L.W., Li, Z.-Y. et al. 2018, ApJ, 867, 43
- Tobin et al. (2020) Tobin, J.J., Sheehan, P.D., Megeath, S.T., et al. 2020, ApJ, 890, 130
- Bok (1999) Tobin, J.J., Offner, S.S.R., Kratter, K.M. et al. 2022, ApJ, 925:39
- Bok (1999) Thompson, R. I., Rieke, M., Schneider, G., Hines, D. C., & Corbin, M. R. 1998, ApJ, 492, L95
- Bok (1999) Umbreit, S., Spurzem, R., Henning, Th. et al. 2011, ApJ, 743:106
- Bok (1999) Valtonen, M. & Mikkola, S. 1991, Ann. Rev. Astron. Astrophys., 29, 9
- Bok (1999) Ward-Thompson, D., Chini, R., Krügel, E., André, P., Bontemps, S. 1995, MNRAS, 274, 1219
- Bok (1999) Whitworth, A., Bate, M.R., Nordlund, A., Reipurth, B., & Zinnecker, H. 2007, in Protostars and Planets V, eds. B. Reipurth, D. Jewitt, & K. Keil, Univ. of Arizona Press, 459
- Bok (1999) Wijnen, T.P.G., Pols, O.R., Pelupessy, F.I., Portegies Zwart, S. 2017, A&A, 604, A91
- Wright & Sault (1993) Wright, M. C. H., & Sault, R. J. 1993, ApJ, 402, 546
- Bok (1999) Zealey, W.J., Williams, P.M., Sandell, G., Taylor, K.N.R., & Ray, T.P. 1992, A&A, 262, 570
- Bok (1999) Zucker, C., Speagle, J.S., Schafly, E.F. et al. 2019, ApJ, 879:125