Exploring the stellar populations of backsplash galaxies
Abstract
Backsplash galaxies are those that traverse and overshoot cluster cores as they fall into these structures. They are affected by environment, and should stand out in contrast to the infalling population. We target galaxies in the vicinity of clusters (RR200) and select a sample in projected phase space (PPS), from the compilation of Sampaio et al. based on SDSS data. We present a statistical analysis, comparing two regions in PPS, with the same projected distance to the cluster but different velocity. The analysis relies on the presence of variations in the stellar population content of backsplash galaxies. We find a lower limit in the fractional contribution of 5% with respect to the general sample of infalling galaxies at similar group-centric distance when using single line strength analysis, or 15-30% when adopting bivariate distributions. The stellar populations show a subtle but significant difference towards older ages, and a higher fraction of quiescent galaxies. We also compare this set with a general field sample, where a substantially larger difference in galaxy properties is found, with the field sample being consistently younger, metal poorer and with a lower fraction of quiescent galaxies. Noting that our “cluster” sample is located outside of the virial radius, we expect this difference to be caused by pre-processing of the infalling galaxies in the overall higher density regions.
keywords:
galaxies: clusters: general – galaxies: evolution galaxies:interactions – galaxies: stellar content.1 Introduction
The evolution of cosmic structure is mostly driven by the growth of dark matter fluctuations in an expanding Universe, that takes shape as an entangled web, where fluctuations cover a wide range of scales. In this picture, galaxies are located within dark matter halos, where gas cools down and forms stars. While the overall properties of galaxies strongly correlate with “local” observables – such as morphology, stellar mass or central velocity dispersion – the mass distribution over larger scales (i.e. “the environment”) also play an important role: In high density regions, such as the cores of clusters, it is more likely to find galaxies with an early-type morphology, and with overall older stellar ages with respect to the field, suggesting that the process of galaxy formation is “accelerated” in denser places (e.g. Dressler et al., 1997). A number of environment-related mechanisms have been proposed to explain the observations in groups and clusters, including ram pressure stripping, strangulation, harassment. Those processes affect the evolution of the gas reservoir in galaxies and their subsequent star formation (see, e.g., Pasquali, 2015, and references therein). Disentangling the different effects is one of the main goals in extragalactic astrophysics, as they link the evolution of galaxies with the larger dark matter halos that host them (see, e.g., Weinmann et al., 2006; Peng et al., 2010; Henriques et al., 2017).
Stellar populations can be used as a tracer of these processes by comparing their properties in carefully selected samples that would appear homogeneous if the environment did not affect their star formation histories. Many papers present detailed analyses of spectroscopic indicators of stellar age and metallicity (to name a few: Thomas et al., 2005; Rogers et al., 2010; Pasquali et al., 2010; La Barbera et al., 2011; Fitzpatrick & Graves, 2015; Goddard et al., 2017; Scholz-Díaz et al., 2022), with the major conclusion being that the largest difference in the stellar population content concerns the central vs satellite nature of these galaxies, with the former having slightly younger ages, representative of extended episodes of star formation, in contrast with satellites, that feature older populations, indicative of efficient quenching. Beyond the central/satellite dichotomy, the effect of other environment properties – such as host halo mass, or cluster-centric distance – is discernible (see, e.g, Smith et al., 2006, 2012; Taranu et al., 2014; Pasquali et al., 2019; Sampaio et al., 2021). However, the overall effect on the underlying stellar populations appears weaker when the samples are segregated by morphology or evolutionary phase (e.g., La Barbera et al., 2014; Trussler et al., 2021). In early-type galaxies, environment effects are subdominant to the more important scaling relations with local observables such as stellar mass or velocity dispersion (e.g. Ferreras et al., 2019b). Some targeted differences can be found, for instance, in close galaxy pairs, where satellites of the same mass, orbiting more massive primaries tend to be slightly older, a potential indicator of assembly bias (Ferreras et al., 2017; Ferreras et al., 2019a). A more detailed view in projected phase space finds subtle but consistent differences between the stellar populations of galaxies in clusters with a Gaussian or non Gaussian velocity distribution (Ribeiro et al., 2013; De Carvaho et al., 2017), reflecting the state of virialisation, and thus the intensity of environment-related effects on the star formation histories (Sampaio et al., 2021).
Backsplash galaxies are defined as those that already fell into the cluster, passing through the dense cluster core, and overshot the structure, so that they are found at larger distances, typically outside of the virial radius (Gill et al., 2005). In this framework, backsplash galaxies constitute very interesting laboratories, as they represent systems that have been strongly affected by environment-related effects, but, due to their motion within the structure, are found in the outer, lower density regions, where such effects are not expected (Balogh et al., 2000). Therefore, the population of backsplash galaxies would stand out with respect to the other galaxies in the same region, mainly infallers. Moreover, galaxies falling towards a cluster were likely part of a lower mass group, and therefore were also affected by the environment of the earlier structures, defined as pre-processsing (e.g., Fujita, 2004). Numerical simulations show that a high fraction of galaxies outside of the virial radius have already plunged within the core of the corresponding cluster, thus being affected by their environment (Mamon et al., 2004), losing a substantial fraction of their mass (Gill et al., 2005). Observational studies based on cluster samples from SDSS confirm the presence of backsplash galaxies at projected radii 1–2 R200 (Pimbblet, 2011), with signs of quenched star formation activity (Mahajan et al., 2011; Muriel & Coenda, 2014).
The presence of backsplash galaxies is related to a more fundamental property concerning the formation of dark matter halos (e.g. Fillmore & Goldreich, 1984). Due to the collisionless nature of dark matter, during the collapse and virialisation of a structure, the particles will overshoot the nascent core and will reach some distance before falling back again. Such behaviour explains the steep density gradients found in the outer profile of dark matter halos (e.g. Diemer & Kravtsov, 2014; Adhikari et al., 2014; Xhakaj et al., 2020), which somehow represents a limit of the bound particles with respect to the infalling matter. This signature can also be found in velocity space (Okumura et al., 2018). Similarly to dark matter, galaxies that fall into a cluster but overshoot them, reach an orbital apocenter further out, defining the so-called splashback radius (Rsp) that could be detected in the radial profile of the galaxy distribution, where a sharp drop is expected outside of this radius. More et al. (2015) estimate Rsp between 0.8 and 1.5 R200m (with R200m defined at 200 times the mean density of the Universe), depending on the accretion history of the cluster, and therefore allowing for the determination of assembly bias, since Rsp will depend on halo parameters other than its mass (see also Busch & White 2017; Sunayama & More 2019). Recently, a number of attempts have been made to determine the location of Rsp in galaxy clusters from weak lensing and galaxy clustering observations (e.g., More et al., 2016; Baxter et al., 2017; Umetsu & Diemer, 2017; Chang et al., 2018; Contigiani et al., 2019; Shin et al., 2019; Murata et al., 2020)
Comparisons with numerical simulations allow us to characterize in detail the properties of the backsplash population and its connection to assembly bias (Busch & White, 2017), finding that over half of all galaxies located, at present, within R200 and 2 R200 of the cluster centre have already passed through the core – where R200 is defined as the radius where the density reaches 200 times the critical value – with this population assembled over relatively recent times, therefore being dependent on the recent formation history of the cluster (Haggar et al., 2020).
This paper focuses on a methodology to contrast the spectroscopic signatures of stellar populations in a sample selected in projected phase space, in order to explore the effect of environment in backsplash galaxies, and constrain their fractional contribution to the samples located just outside of the virial radius. Our methodology relies on variations of the stellar population content, therefore assumes that the effect of the passage through the cluster leaves some imprint on the absorption line spectra. Section 2 defines the two key subsets adopted to find backsplash galaxies. Section 3 explores a number of observable properties, focusing on three targeted line strengths that are strongly dependent on the stellar age of the stellar populations. Section 4 describes a simple methodology based on cumulative distributions to assess the fraction of backsplash galaxies. Finally, Section 5 summarises our main conclusions.
2 Defining the backsplash region in projected phase space
Our sample of backsplash candidates is retrieved from the compilation of Sampaio et al. (2021), who made use of the galaxy group catalogue of Yang et al. (2007), based on the Sloan Digital Sky Survey (York et al., 2000, hereafter SDSS). This catalogue classifies galaxies in projected phase space (PPS) relative to their respective groups, where the peculiar, line-of-sight, velocity of a galaxy – measured as a fraction of the velocity dispersion within the group – is plotted against its 2D projected group-centric distance. By making comparisons with computer simulations, the PPS diagram can be sliced in a number of zones that characterize the dynamical state of the galaxy within the group, and can give the time since the galaxy fell in that structure (see, e.g. Oman & Hudson, 2016; Rhee et al., 2017; Pasquali et al., 2019). The Sampaio et al. (2021) sample targets Yang et al. (2007) groups with mass MM⊙, therefore we can refer to these systems as clusters. The properties of the 319 clusters are estimated via Virial Analysis (Lopes et al., 2009) applied to the final member list defined by the Shiftgapper technique (De Carvaho et al., 2017). Note that only members within R200 are considered in the estimate of the velocity dispersion. In this paper, the radius that characterises each group is given by R200 defined as the position where the density is 200 times the critical value, as laid out in Lopes et al. (2009).
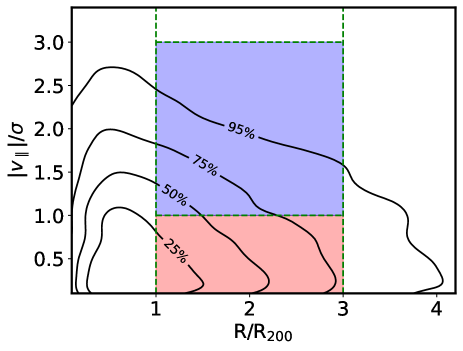
Fig. 1 shows the PPS diagram of the sample, as a density plot. The original set consists of 570,643 galaxies, from which we have 23,631 satellites with detailed phase space information. Modulo projection effects, backsplash galaxies should be located outside of the group radius. According to Haggar et al. (2020), over half of all galaxies located between one and two group radii (measured as R200), are backsplash galaxies, as measured at z=0 in a set of detailed numerical simulations. This fraction decreases to negligible values at R3 R200. Moreover, this fraction increases in dynamically relaxed clusters (i.e. Gaussian clusters). Our criterion to split the sample on the PPS diagram is aimed at testing whether the spectroscopic signature of the backsplash galaxies can be determined by focusing on the not-too-distant outskirts of clusters, split with respect to relative velocity. The expected quenching effects will be noticeable in the signature of the stellar populations, although we should also expect additional factors affecting the stellar populations of the infalling galaxies. The sample is also split with respect to the dynamical state of the group, into Gaussian (G) and non Gaussian (nG) clusters, a criterion based on the distribution of velocities. The latter represent structures with a more recent dynamical formation history and a higher diversity regarding galaxy properties, suggesting higher levels of pre-processing (De Carvaho et al., 2017; Roberts & Parker, 2017; Sampaio et al., 2021). We note that Gaussian clusters are already virialised systems (at least within R200), where the infall of new members is, in principle, smaller than in non-Gaussian clusters. Therefore, in the vicinity of nG grous we expect to find a higher fraction of infalling galaxies, thus with overall higher levels of pre-processing, as these infallers belong to smaller groups that are in the process of merging. We also note that the fraction of interlopers – defined as galaxies that are within 1-3 R200 in projection, but not in 3D radial distance, , can be rather high (see figure 2 of Oman & Hudson, 2016). However, we will see below that the PPS-selected sample shows strong differences with respect to the field.
We select galaxies in the region of PPS: R/R and (a total of 12,738 SDSS spectra), split into high- and low-velocity galaxies at , as highlighted in blue and red, respectively, in Fig. 1. We follow this colour coding throughout the paper. From this set, we retrieve the line strength measurements from the SDSS galSpecIndx table, as defined in Brinchmann et al. (2004). The cross-correlation produces 11,252 galaxies, with 5,282 (1,951) classified as belonging to Gaussian (non Gaussian) clusters. The remaining 4,019 cannot be accurately classified regarding the Gaussian nature of the velocity dispersion of the cluster, but are also included in a general sample that comprise all cluster galaxies with well-defined PPS information. As comparison with a general (“field”) sample, we also extract from SDSS (Legacy) a complete set of spectra that are unconstrained in PPS, imposing a high enough S/N (5111Defined by the snMedian_r parameter in the SpecObjAll table as the median signal-to-noise over all good pixels in the SDSS band, given per pixel, 1Å.) in the same redshift window, 0.03z0.10. Moreover, we exclude from this sample all galaxies that, according to the groups classification of Yang et al. (2007), inhabit a halo with mass above M⊙. This control sample comprises over 200 thousand spectra and represents the general population of galaxies not located in high density regions. We note that projected distances RR200 will include galaxies outside of the virial sphere, and thus will include infallers and backsplash galaxies as well. For instance, Rines et al. (2005) estimate 20% of absorption line galaxies and 50% of emission line galaxies to be interlopers inside the virial cylinder. However, we aim at a robust assessment that minimises all systematics associated with the sample selection, focusing on projected cluster-centric distances R>R200, and thus fully eliminating galaxies inside the cluster.

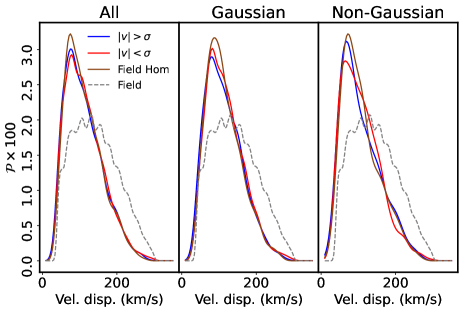
Since this analysis focuses on the comparison of line strengths that constrain the stellar population properties, it is important to ensure that all samples feature the same distribution of stellar velocity dispersion, which consistently appears as the dominant driver of population properties in galaxies (see, e.g. Bernardi et al., 2003; Ferreras et al., 2019b). We extract subsamples from the original ones, so that the cross-comparison sets involve galaxies with identical distributions of velocity dispersion. This homogeneisation process is illustrated in Fig. 2, where we compare the distributions (from left to right), of the complete sample, galaxies in Gaussian clusters and in non-Gaussian clusters, respectively. In each panel, galaxies with high- (low-) are shown in blue (red). The original general sample from SDSS (i.e. “field”) is shown as a brown dashed line, with a clear excess at high velocity dispersion with respect to the PPS-constrained samples. The distribution of the homogenised field sample appears as a solid brown line. We note that hereafter, in each comparison, all samples are homogenised with respect to the smaller subset, by random selection of galaxies until the target distribution is reached.
3 Probing the stellar population properties
Fig. 3 (left) shows three of the line strengths – from top to bottom: Dn(4000), H and [MgFe]′. The 4000Å break strength follows the definition of the index as a ratio of flux redward and blueward of the break, as defined in Bruzual (1983), but over a narrower spectral window, as proposed by Balogh et al. (1999). The Balmer line uses the definition of Worthey & Ottaviani (1997), and has been corrected for emission contamination: we use the lick_hd_sub parameter in the SDSS galSpecIndx table, which removes all emission lines detected in the spectra at the 3 level (Brinchmann et al., 2004). The [MgFe]′ index is defined as (Thomas et al., 2003), where those indices are the standard Lick definitions shown in Trager et al. (1998).
The results are shown in bins regarding group-centric distance. The samples within each radial bin are homogeneised in stellar velocity dispersion as described above. The red and blue lines correspond to subsamples with a high and low projected velocity, consistently with the shaded zones of Fig. 1. For reference, we include as brown lines the results for a general (i.e. field) sample of SDSS galaxies with the same distribution in velocity dispersion and stellar mass as the targeted samples. Within each bin in R/R200, we extract a sample of SDSS galaxies from the general catalogue, with the same velocity dispersion as the reference, which is always the smaller sample, i.e. the high subset in that radial bin. Therefore, while the R/R200 has no actual meaning for the SDSS general sample it simply represents a subset with the same stellar velocity dispersion as the group-related samples in the same bin. Variations in the field sample regarding group-centric distance only reflect differences in the stellar velocity dispersion of the cluster galaxies. Note the substantial difference towards higher Dn(4000) and [MgFe]′, and lower H, in the low sample, corresponding to older and more metal rich populations, suggesting these as the typical populations in backsplash galaxies.
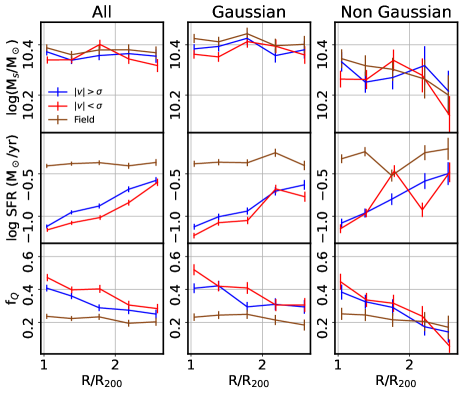
As reference, Fig. 3 (right) shows the trends of stellar mass, star formation rate and fraction of quiescent galaxies (, defined as the fraction of galaxies with a BPT classification flag according to the galspecExtra catalogue, along with weak specific star formation, sSFR0.03 Gyr-1). The samples are indistinguishable regarding stellar mass. Note that the homogenisation process (Fig. 2) somehow forces this result in general, to ensure that the differences in stellar population properties are not caused by a systematic difference in stellar velocity dispersion. The star formation rate does show a substantial difference with respect to , with the low velocity sample having consistently weaker star formation activity, a result also confirmed by the increased fraction of quiescent galaxies (). In all the plots of Fig. 3 it is also evident the remarkable difference between galaxies in the “catchment area” of groups (i.e. both blue and red lines) and the general population extracted from SDSS (in brown). The latter shows substantially weaker Dn(4000), [MgFe]′, and stronger H, reflecting younger and metal-poorer populations, and a correspondingly higher star formation rate and lower quiescent fraction. We emphasize that, by construction, the general SDSS sample is defined to have the same distribution of velocity dispersion as those selected in PPS. Hence, this difference should be interpreted as pre-processing in the higher density regions surrounding galaxy groups. Therefore, we see two levels of variation regarding these samples: the strong difference from pre-processing (brown vs blue/red), along with the subtle difference introduced by backsplash galaxies (blue vs red).
In addition, Fig. 3 shows the results for the full set of galaxies selected in PPS, and for galaxies in Gaussian and non-Gaussian clusters. Note that the number of galaxies in non-Gaussian clusters is smaller in our sample, so that the Poisson noise is higher. The trends are rather similar between G and nG clusters. While simulations suggest a higher fractional contribution from backsplash galaxies in Gaussian clusters – i.e. already virialised systems that had more time to produce overshooting orbits – the effect on the line strengths is not so evident, perhaps reflecting a weaker environment impact on the stellar populations by the cluster passage, or a more substantial amount of pre-processing in nG clusters, thus producing a higher quenched fraction that counterbalances the additional contribution of backsplash galaxies in G clusters (Sampaio et al., 2021). It is worth noting that the comparison includes the Balmer absorption index H, which is especially sensitive to changes in the stellar population content within the recent Gyr, i.e. comparable with typical dynamical timescales in these systems.
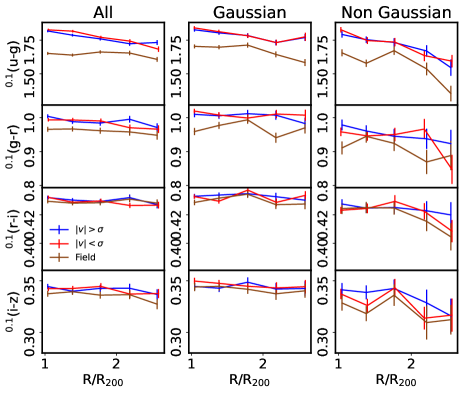
Fig. 4 shows the trends of the standard colours from the SDSS photometric measurements – after correcting for foreground, Milky Way, dust extinction, taking the fluxes within the 3 arcsec diameter fibers, and k-correcting the colours to a common redshift z=0.1, following Blanton & Roweis (2007). The group vs field difference is once more evident, with bluer colours in the field sample. However, the more subtle changes regarding backsplash are undistinguishable with broadband photometry.
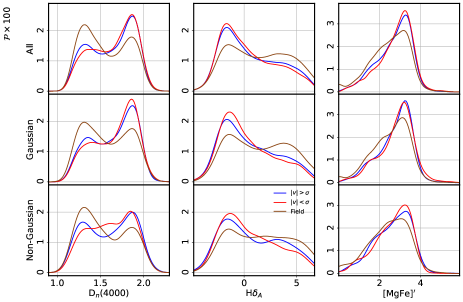
Complementary to Fig. 3 – where the median of the distributions were shown as a function of projected group-centric distance – we show in Fig. 5 the distribution of targeted line strengths, taking all galaxies within the interval R/R, following the same split regarding . The well-known bimodality (e.g. Strateva et al., 2001; Baldry et al., 2004; Angthopo et al., 2019) is evident in the 4000Å break strength, with a more prominent blue cloud (i.e. the peak at low Dn(4000) in the field sample. Within groups, the low velocity subset has a slightly stronger red sequence, i.e. once more reflecting an additional component of quenched galaxies. This behaviour is also prominent in H. We apply the Anderson-Darling test for k-samples (Scholz & Stephens, 1987) to statistically confirm the difference between the subsets regarding velocity, finding low significance () values for the general cluster sample in Dn(4000) (=0.065) and H (0.001) thus rejecting the null hypothesis that both sets originate from the same parent distribution. Differences regarding the metallicity-sensitive index [MgFe]′ are only substantial between field and groups (being higher in the latter). However, they are not conclusive when splitting group galaxies into high- and low-velocity. We will see below that a bivariate plot involving [MgFe]′ and Dn(4000) produces a cleaner separation between these two sets (i.e. extending the analysis beyond a simple, one-dimensional interpretation, akin to that of a Simple Stellar Population).
4 The contribution of backsplash galaxies
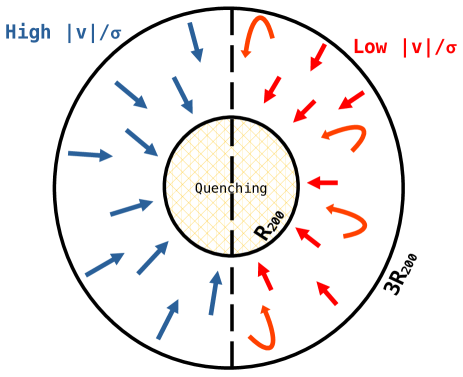
In the outskirts of groups and clusters, we expect to find galaxies in different “dynamical phases” concerning their motion with respect to those. We simplify this scenario by assuming that the mixture reduces to two components in our working sample of galaxies at RR200, namely: 1) infalling galaxies with a substantial amount of pre-processing – relative to a field sample of galaxies with similar stellar velocity dispersion, and 2) backsplash galaxies that have undergone strong environment-related effects during (at least one) passage through the cluster core. When split with respect to projected velocity, we expect a higher fraction of backsplash galaxies at low . Unfortunately, the effect of the cluster passage on the absorption spectra may be subtle, so that we can not pick individual galaxies as representative of this sample. We follow instead a statistical estimate, imposing the ansatz that backsplash galaxies can only be found in the subsample (see Fig. 6). We emphasize this is just an approximation, but it will allow us to produce robust lower bounds on the contribution of backsplash galaxies in clusters, as long as the effect of the group/cluster passage leaves discernible imprints on the spectra. Previous estimates impose specific models about how this population should look like. For instance, Pimbblet (2011) adopt a mixture model, imposing the backsplash population to have the same quenched features as those found in galaxies at the cores of the clusters, leading to a fraction around 56% at the virial radius, slowly decreasing outwards. However, such an approach would imply that the infalling population should have no quenched star formation, to be properly discerned in the mixture, whereas pre-processing of the infallers will also produce quenched galaxies. In fact, Fig. 3 confirms a large difference between the field sample and those in the vicinity of clusters – regardless of their velocity – hence showing that the presence of quenched features is prevalent even before the galaxy enters the cluster. Therefore, we emphasize that if we choose the field sample as reference, any method based on a prior on quenching signatures is expected to overestimate the fraction of backsplash galaxies, as they will be contaminated by (quenched) infallers.
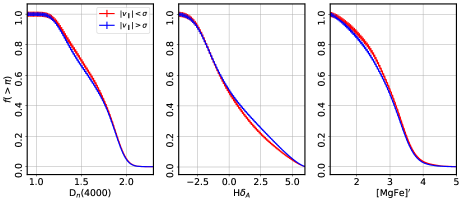
Our method to quantify the presence of backsplash galaxies only relies on phase space, with the main assumption that high velocity galaxies outside of the virial radius are infallers. In this case, the difference between high- and low-velocity galaxies outside of the group radius will determine the fraction of backsplash galaxies. The real scenario will of course include a number of backsplash galaxies at high velocity, therefore our estimates will provide a robust lower bound on this fraction. We use the distributions presented in Fig. 5 to compute the cumulative fractions , i.e. the fraction of galaxies within a given sample that have a spectral index () higher than a chosen value. This function trivially decreases from 1, at the lowest value of in the sample, to 0, at the highest value. Fig. 7 illustrates this definition for the targeted line strengths adopted in this paper to characterize the stellar populations of the full sample. To avoid crowding, we do not show the Gaussian and non Gaussian samples here. If we define the cumulative function as for the high velocity sample, and for the low velocity sample, then we expect the difference to represent the excess of galaxies corresponding to the backsplash population. Note the differences between these cumulative functions are non-negligible, but rather subtle. The shaded areas in the figure mark the standard 1 Poisson error.
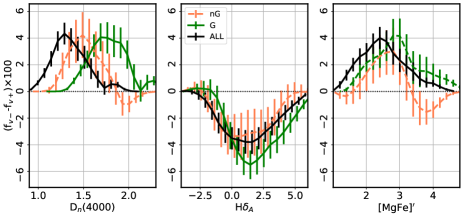
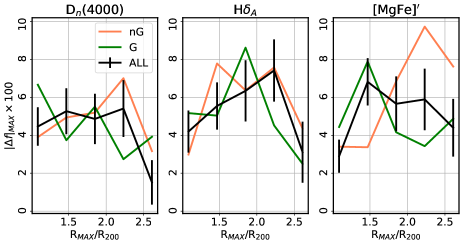
Fig. 8 shows for the distributions of the three spectral indices in the general cluster sample (black), as well as the subsets comprising galaxies in Gaussian (G, green) and non Gaussian (nG, orange) clusters. Note is expected to trivially converge to zero at both ends, as all cumulative functions reach 1 at low values of the spectral index, and 0 for high values. The peak of these lines – reminiscent of the Kolmogorov-Smirnov (KS) statistic – corresponds to the maximum difference between the subsamples segregated with respect to projected velocity, and therefore represents a lower bound in the fraction of backsplash galaxies. While there are some variations in the distributions between galaxies in Gaussian and non Gaussian clusters, the difference is not statistically significant (confirmed by the values of the KS test around 0.3-0.4).
To quantify this fraction in more detail, we show in Fig. 9 the dependence of this peak in the difference between distributions () and the radial interval chosen: Fig. 8 was computed for galaxies within RR200, whereas in this new figure the maximum fraction is derived within a sliding interval . We also include the associated Poisson error bar for the lines corresponding to the complete set of galaxies (i.e. not split into Gaussian and non Gaussian). Note that, although the error bars are substantial in this detailed analysis, the difference consistently reaches a value at R2 R200. Therefore, we claim that the fraction of backsplash galaxies with a well-defined signature on the stellar populations, is at least 5% of the total population located within 1 and 2 group radii. This figure is lower than the predictions made by simulations: Gill et al. (2005) estimated around half of the galaxies within 1-2R200 to be backsplash systems, and Haggar et al. (2020) claim that the backsplash fraction would reach 40–80% in low-redshift clusters, with a strong dependence on cluster-centric distance and dynamical state. Their results are based on simulations and allow them to precisely track the orbits of the cluster members. Therefore, the backsplash “dynamical” signature is determined accurately in the simulations. Our observations would suggest that a dominant portion of backsplash galaxies feature similar stellar population properties as the infallers, i.e. only a small fraction shows signatures of stronger quenching caused by having passed already through the cluster core. The substantial difference between our results and those from Haggar et al. (2020) – that can cleanly define the set of backsplash galaxies based on their orbits – imply that the passage through the cluster core only produces noticeable differences on the stellar populations in a relatively small fraction of galaxies. A previous set of simulations (Oman et al., 2013) suggest potentially lower fractions of backsplash galaxies. Their figure 5 shows the distribution of infall times in different locations of PPS. If we focus on group-centric distances larger than the virial radius, and infall times 4 Gyr to represent the backsplash population, we only find fractions comparable with Haggar et al. (2020) at RR200 but not at 1.5 R200. Therefore, this type of observable constraint can be used to calibrate galaxy formation models, both on the dynamical properties as well as the hydrodynamics that controls the flow of the gas components that eventually feed star formation. Environment-related effects on the star formation histories of galaxies leave a signal on the stellar populations that can be tested in samples defined in projected phase space in the same way as presented in this paper. Phenomenological models have suggested extended quenching timescales in agreement with our results (e.g., Reeves et al., 2022). In other words, the observational data suggests weak (or delayed) quenching in backsplash galaxies, in line with mechanisms based on the ’delayed-then-rapid’ environment quenching (Wetzel et al., 2013), where the slow quenching process can extend over 2-4 Gyr, and thus over longer than the typical dynamical timescales. Therefore, our ansatz is only sensitive to a fraction of the total sample of backsplash galaxies.
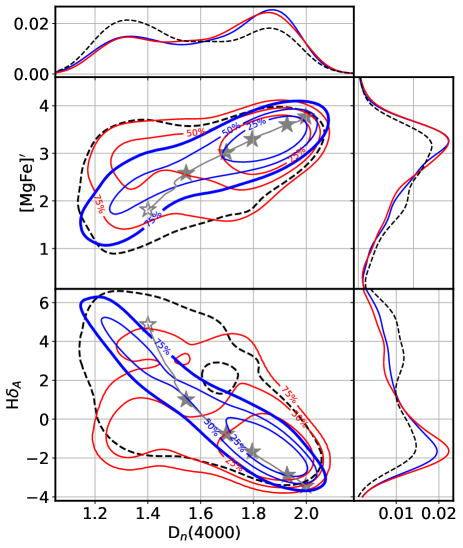
A more detailed view of the differences found in the line strengths can be produced with bivariate plots of line strengths. We show in Fig. 10 the distribution of cluster galaxies on the plane spanned by [MgFe]′ (top) or H (bottom) vs 4000Å break strength. These diagrams are powerful indicators of the population properties, as Dn(4000) preferentially traces the average stellar age, whereas Balmer absorption is sensitive to recent episodes of star formation (see, e.g. Kauffmann et al., 2003; Gallazzi et al., 2005). While [MgFe]′ is usually adopted as a metallicity indicator, it features a significant age dependence (see, e.g. fig. 4 of La Barbera et al., 2013). The sample is once more separated into low (, red) and high projected velocity (, blue). The contours represent fractions of the total number of galaxies in each sample, as labelled. The field sample is also shown, only at the 75% level, to avoid crowding, with a back dashed line. As reference, we include as a grey line the estimates for a set of synthethic simple stellar populations (SSP) from the models of Vazdekis et al. (2010) at solar metallicity. The star symbols mark the values for ages of 1, 2, 3, 4, 8 and 10 Gyr (with the youngest population represented by a white star). The high velocity sample – expected to be dominated by pre-processed, infalling galaxies – has a clear tail towards younger ages (weaker Dn(4000), and higher H absorption) and lower metallicity (although [MgFe]′ also decreases towards young age), whereas the low velocity sample – which is expected to include backsplash galaxies – is more concentrated towards weaker Balmer absorption and [MgFe]′, as well as stronger 4000Å break strength, suggesting that this set has more complex star formation histories, and likely having an increased fraction of galaxies with quenched star formation, lacking systems with SSP-equivalent ages younger than 2 Gyr. Our results align with the work of Mahajan et al. (2011) where a special set of galaxies, termed GORES (Galaxies with Ongoing or Recent Efficient Star formation), was defined based on their 4000Å break strength (1.5) and H equivalent width (2Å), indicative of recent quenching. Their analysis, combining SDSS data with simulations, found that 19% of backsplash galaxies have a GORES signature, in contrast with 34% for the infallers, which implies quenching operates efficiently after a core passage, but leaves open the issue that many of the infallers may also have signatures of quenching due to pre-processing. Our work qualitatively goes in the same direction, but the effect is more nuanced as seen in the bivariate distribution on the bottom-left panel of Fig. 10. Rather than simple thresholds on 4000Å break strength and Balmer absorption, the differences, rather affect the offset with respect to the correlation between H and Dn(4000) typically found in galaxies. The low-velocity subset features a higher scatter. Note that simple star formation histories, defined by a single burst of star formation, will populate the lines traced by the stars in the figure. In contrast, the presence of recently quenched episodes of star formation will result in departures away from the locus described in this diagram by the SSP prediction (see, e.g. figure 7 of Wild et al. 2007). Therefore, a marked difference between the low- and high-velocity subsets concerns galaxies with a more complex, recent history of star formation (and quenching), as expected in a backsplash scenario.
If we take the 75% contour level of the high velocity subsample of the H vs Dn(4000) plot as reference (thick red line) and integrate the number density outwards, we find a fraction of the total of 25% for the high velocity sample (trivially, by construction), and 58% for the low velocity set, i.e. an excess of 33%. The equivalent comparison in the [MgFe]′ vs Dn(4000) plot yields an excess of 19% at low , which could be interpreted as the fractional contribution from backsplash galaxies. We also note that this result is not dependent on the signal-to-noise threshold imposed: samples cut at higher values produce a consistent difference in the distributions of low- and high-velocity: if we restrict the spectra to S/N20 (measured as the median value in the SDSS- band), the excess fractions are 27% (for the H vs Dn(4000) diagram) and 15% (for the [MgFe]′ vs Dn(4000) distribution).
Note that a bivariate analysis is needed to produce this result, whereas the one dimensional work presented above gives a lower 5% fractional difference between the high- and low-velocity subsamples. This is corroborated by the one dimensional histograms shown in Fig. 10, where the differences between the two subsets are much smaller than those in the bivariate plot. Somehow, the 2D analysis allows us to go beyond a simple interpretation of the results as a single parameter (say the age of an SSP). A more detailed, but model-prone, analysis is beyond the scope of this paper, but will be explored in a future work.
5 Conclusions
In this paper, we explore a method to assess the role of backsplash galaxies in the outskirts of galaxy groups, by studying the imprint of environment-related effects on the stellar populations. We define a sample of 11,252 galaxy spectra from the legacy Sloan Digital Sky Survey, cross-matched with the groups catalogue of Yang et al. (2007), only selecting galaxies with cluster-centric distance 1R/R3, and separate the sample with respect to line of sight velocity, normalized by the velocity dispersion of the individual clusters. We split the sample into low () and high (13) velocity, and adopt the ansatz that the former includes a substantially higher fraction of backsplash galaxies, as suggested by simulations (Haggar et al., 2020). A comparison is also made with a general sample of SDSS galaxy spectra selected in the same redshift window, but irrespective of environment, always making sure the samples have the same distribution in stellar velocity dispersion, which is a well-known driver of population properties in galaxies (Ferreras et al., 2019b).
Our analysis confirms the trend towards older stellar ages in the low velocity sample that we interpret as the additional contribution from the backsplash population. This difference is consistent in three key spectral indices: Dn(4000), H, and [MgFe]′, but also manifests itself in the gas phase via lower star formation rates and a higher fraction of quiescent galaxies in the low velocity subsample. The difference is small but statistically significant, which implies backsplash galaxies cannot be the dominant population, at least regarding the observable signatures of interaction. The comparison with the general sample confirms the very large difference between field galaxies and those in the catchment area of clusters, confirming the strong effect of pre-processing on the stellar content of galaxies (e.g. Roberts & Parker, 2017).
By defining the difference between the cumulative fractions of galaxies with a given spectral indicator, we quantify the role of backsplash galaxies and conclude that the fraction of this type of galaxies should be at least 5%. By comparing this fraction with respect to cluster-centric distance, we confirm that the difference is highest around R2 R200. The extension of the analysis to bivariate line strength diagrams (Fig. 10), shows a more marked difference between the two subsamples, with the low-velocity set featuring a wider scatter in H and higher values of [MgFe]′, interpreted as the contribution of backsplash galaxies, with a more complex formation history, consistent with the quenching of a recent episode of star formation. Integrating the 2D number density on these plots, we semi-quantitatively estimate the contribution of backsplash galaxies in the range 15-30%, more in line with numerical simulations.
Our work confirms the presence of the backsplash population, and suggests that detailed analysis, beyond simple 1D distributions, should be adopted to find the subtle features left by the cluster core passage on the absorption spectra that reflects the variations in stellar populations with respect to the infalling galaxies. Pre-processing is found to produce as strong a signature as in backsplash galaxies, thus complicating observational constraints. Our estimate of the backsplash fraction is, at most, around 25%, whereas simulations suggest a higher fraction, confirming that various quenching processes operate in the vicinity of clusters, and backsplash quenching may be affected by delays longer than the dynamical timescale, hindering accurate estimates of the backsplash galaxies from spectroscopic data alone.
Acknowledgements
IF acknowledges support from the Spanish Research Agency of the Ministry of Science and Innovation (AEI-MICINN) under grant PID2019-104788GB-I00. KU acknowledges support from the Ministry of Science and Technology of Taiwan (grant MOST 109-2112-M-001-018-MY3) and from the Academia Sinica (grant AS-IA-107-M01). VMS acknowledges the FAPESP scholarship programme through grants 2020/16243-3 and 2021/13683-5. Funding for SDSS-III has been provided by the Alfred P. Sloan Foundation, the Participating Institutions, the National Science Foundation, and the U.S. Department of Energy Office of Science. The SDSS-III web site is http://www.sdss3.org/.
Data availability
This work has been fully based on publicly available data: galaxy spectra were retrieved from the SDSS DR16 archive (https://www.sdss.org/dr16/) and stellar population synthesis models can be obtained from the respective authors.
References
- Adhikari et al. (2014) Adhikari S., Dalal N., Chamberlain R. T., 2014, J. Cosmology Astropart. Phys., 2014, 019
- Angthopo et al. (2019) Angthopo J., Ferreras I., Silk J., 2019, MNRAS, 488, L99
- Baldry et al. (2004) Baldry I. K., Glazebrook K., Brinkmann J., Ivezić Ž., Lupton R. H., Nichol R. C., Szalay A. S., 2004, ApJ, 600, 681
- Balogh et al. (1999) Balogh M. L., Morris S. L., Yee H. K. C., Carlberg R. G., Ellingson E., 1999, ApJ, 527, 54
- Balogh et al. (2000) Balogh M. L., Navarro J. F., Morris S. L., 2000, ApJ, 540, 113
- Baxter et al. (2017) Baxter E., et al., 2017, ApJ, 841, 18
- Bernardi et al. (2003) Bernardi M., et al., 2003, AJ, 125, 1849
- Blanton & Roweis (2007) Blanton M. R., Roweis S., 2007, AJ, 133, 734
- Brinchmann et al. (2004) Brinchmann J., Charlot S., White S. D. M., Tremonti C., Kauffmann G., Heckman T., Brinkmann J., 2004, MNRAS, 351, 1151
- Bruzual (1983) Bruzual G. A., 1983, ApJ, 273, 105
- Busch & White (2017) Busch P., White S. D. M., 2017, MNRAS, 470, 4767
- Chang et al. (2018) Chang C., et al., 2018, ApJ, 864, 83
- Contigiani et al. (2019) Contigiani O., Hoekstra H., Bahé Y. M., 2019, MNRAS, 485, 408
- De Carvaho et al. (2017) De Carvaho R. R., Ribeiro A. L. B., Stalder D. H., Rosa R. R., Costa A. P., Moura T. C., 2017, AJ, 154, 96
- Diemer & Kravtsov (2014) Diemer B., Kravtsov A. V., 2014, ApJ, 789, 1
- Dressler et al. (1997) Dressler A., et al., 1997, ApJ, 490, 577
- Ferreras et al. (2017) Ferreras I., et al., 2017, MNRAS, 468, 607
- Ferreras et al. (2019a) Ferreras I., Hopkins A. M., Lagos C., Sansom A. E., Scott N., Croom S., Brough S., 2019a, MNRAS, 487, 435
- Ferreras et al. (2019b) Ferreras I., et al., 2019b, MNRAS, 489, 608
- Fillmore & Goldreich (1984) Fillmore J. A., Goldreich P., 1984, ApJ, 281, 1
- Fitzpatrick & Graves (2015) Fitzpatrick P. J., Graves G. J., 2015, MNRAS, 447, 1383
- Fujita (2004) Fujita Y., 2004, PASJ, 56, 29
- Gallazzi et al. (2005) Gallazzi A., Charlot S., Brinchmann J., White S. D. M., Tremonti C. A., 2005, MNRAS, 362, 41
- Gill et al. (2005) Gill S. P. D., Knebe A., Gibson B. K., 2005, MNRAS, 356, 1327
- Goddard et al. (2017) Goddard D., et al., 2017, MNRAS, 465, 688
- Haggar et al. (2020) Haggar R., Gray M. E., Pearce F. R., Knebe A., Cui W., Mostoghiu R., Yepes G., 2020, MNRAS, 492, 6074
- Henriques et al. (2017) Henriques B. M. B., White S. D. M., Thomas P. A., Angulo R. E., Guo Q., Lemson G., Wang W., 2017, MNRAS, 469, 2626
- Kauffmann et al. (2003) Kauffmann G., et al., 2003, MNRAS, 341, 33
- La Barbera et al. (2011) La Barbera F., Ferreras I., de Carvalho R. R., Lopes P. A. A., Pasquali A., de la Rosa I. G., De Lucia G., 2011, ApJ, 740, L41
- La Barbera et al. (2013) La Barbera F., Ferreras I., Vazdekis A., de la Rosa I. G., de Carvalho R. R., Trevisan M., Falcón-Barroso J., Ricciardelli E., 2013, MNRAS, 433, 3017
- La Barbera et al. (2014) La Barbera F., Pasquali A., Ferreras I., Gallazzi A., de Carvalho R. R., de la Rosa I. G., 2014, MNRAS, 445, 1977
- Lopes et al. (2009) Lopes P. A. A., de Carvalho R. R., Kohl-Moreira J. L., Jones C., 2009, MNRAS, 392, 135
- Mahajan et al. (2011) Mahajan S., Mamon G. A., Raychaudhury S., 2011, MNRAS, 416, 2882
- Mamon et al. (2004) Mamon G. A., Sanchis T., Salvador-Solé E., Solanes J. M., 2004, A&A, 414, 445
- More et al. (2015) More S., Diemer B., Kravtsov A. V., 2015, ApJ, 810, 36
- More et al. (2016) More S., et al., 2016, ApJ, 825, 39
- Murata et al. (2020) Murata R., Sunayama T., Oguri M., More S., Nishizawa A. J., Nishimichi T., Osato K., 2020, PASJ, 72, 64
- Muriel & Coenda (2014) Muriel H., Coenda V., 2014, A&A, 564, A85
- Okumura et al. (2018) Okumura T., Nishimichi T., Umetsu K., Osato K., 2018, Phys. Rev. D, 98, 023523
- Oman & Hudson (2016) Oman K. A., Hudson M. J., 2016, MNRAS, 463, 3083
- Oman et al. (2013) Oman K. A., Hudson M. J., Behroozi P. S., 2013, MNRAS, 431, 2307
- Pasquali (2015) Pasquali A., 2015, Astronomische Nachrichten, 336, 505
- Pasquali et al. (2010) Pasquali A., Gallazzi A., Fontanot F., van den Bosch F. C., De Lucia G., Mo H. J., Yang X., 2010, MNRAS, 407, 937
- Pasquali et al. (2019) Pasquali A., Smith R., Gallazzi A., De Lucia G., Zibetti S., Hirschmann M., Yi S. K., 2019, MNRAS, 484, 1702
- Peng et al. (2010) Peng Y.-j., et al., 2010, ApJ, 721, 193
- Pimbblet (2011) Pimbblet K. A., 2011, MNRAS, 411, 2637
- Reeves et al. (2022) Reeves A. M. M., Hudson M. J., Oman K. A., 2022, arXiv e-prints, p. arXiv:2211.09145
- Rhee et al. (2017) Rhee J., Smith R., Choi H., Yi S. K., Jaffé Y., Candlish G., Sánchez-Jánssen R., 2017, ApJ, 843, 128
- Ribeiro et al. (2013) Ribeiro A. L. B., de Carvalho R. R., Trevisan M., Capelato H. V., La Barbera F., Lopes P. A. A., Schilling A. C., 2013, MNRAS, 434, 784
- Rines et al. (2005) Rines K., Geller M. J., Kurtz M. J., Diaferio A., 2005, AJ, 130, 1482
- Roberts & Parker (2017) Roberts I. D., Parker L. C., 2017, MNRAS, 467, 3268
- Rogers et al. (2010) Rogers B., Ferreras I., Pasquali A., Bernardi M., Lahav O., Kaviraj S., 2010, MNRAS, 405, 329
- Sampaio et al. (2021) Sampaio V. M., de Carvalho R. R., Ferreras I., Laganá T. F., Ribeiro A. L. B., Rembold S. B., 2021, MNRAS, 503, 3065
- Scholz & Stephens (1987) Scholz F. W., Stephens M. A., 1987, Journal of the American Statistical Association, 82, 918
- Scholz-Díaz et al. (2022) Scholz-Díaz L., Martín-Navarro I., Falcón-Barroso J., 2022, MNRAS, 511, 4900
- Shin et al. (2019) Shin T., et al., 2019, MNRAS, 487, 2900
- Smith et al. (2006) Smith R. J., Hudson M. J., Lucey J. R., Nelan J. E., Wegner G. A., 2006, MNRAS, 369, 1419
- Smith et al. (2012) Smith R. J., Lucey J. R., Price J., Hudson M. J., Phillipps S., 2012, MNRAS, 419, 3167
- Strateva et al. (2001) Strateva I., et al., 2001, AJ, 122, 1861
- Sunayama & More (2019) Sunayama T., More S., 2019, MNRAS, 490, 4945
- Taranu et al. (2014) Taranu D. S., Hudson M. J., Balogh M. L., Smith R. J., Power C., Oman K. A., Krane B., 2014, MNRAS, 440, 1934
- Thomas et al. (2003) Thomas D., Maraston C., Bender R., 2003, MNRAS, 339, 897
- Thomas et al. (2005) Thomas D., Maraston C., Bender R., Mendes de Oliveira C., 2005, ApJ, 621, 673
- Trager et al. (1998) Trager S. C., Worthey G., Faber S. M., Burstein D., González J. J., 1998, ApJS, 116, 1
- Trussler et al. (2021) Trussler J., Maiolino R., Maraston C., Peng Y., Thomas D., Goddard D., Lian J., 2021, MNRAS, 500, 4469
- Umetsu & Diemer (2017) Umetsu K., Diemer B., 2017, ApJ, 836, 231
- Vazdekis et al. (2010) Vazdekis A., Sánchez-Blázquez P., Falcón-Barroso J., Cenarro A. J., Beasley M. A., Cardiel N., Gorgas J., Peletier R. F., 2010, MNRAS, 404, 1639
- Weinmann et al. (2006) Weinmann S. M., van den Bosch F. C., Yang X., Mo H. J., 2006, MNRAS, 366, 2
- Wetzel et al. (2013) Wetzel A. R., Tinker J. L., Conroy C., van den Bosch F. C., 2013, MNRAS, 432, 336
- Wild et al. (2007) Wild V., Kauffmann G., Heckman T., Charlot S., Lemson G., Brinchmann J., Reichard T., Pasquali A., 2007, MNRAS, 381, 543
- Worthey & Ottaviani (1997) Worthey G., Ottaviani D. L., 1997, ApJS, 111, 377
- Xhakaj et al. (2020) Xhakaj E., Diemer B., Leauthaud A., Wasserman A., Huang S., Luo Y., Adhikari S., Singh S., 2020, MNRAS, 499, 3534
- Yang et al. (2007) Yang X., Mo H. J., van den Bosch F. C., Pasquali A., Li C., Barden M., 2007, ApJ, 671, 153
- York et al. (2000) York D. G., et al., 2000, AJ, 120, 1579