Multiwavelength Scrutiny of X-ray Sources in Dwarf Galaxies: ULXs versus AGN
Abstract
Owing to their quiet evolutionary histories, nearby dwarf galaxies (stellar masses ) have the potential to teach us about the mechanism(s) that ‘seeded’ the growth of supermassive black holes, and also how the first stellar mass black holes formed and interacted with their environments. Here, we present high spatial-resolution observations of three dwarf galaxies in the X-ray (Chandra), the optical/near-infrared (Hubble Space Telescope), and the radio (Karl G. Jansky Very Large Array). These three galaxies were previously identified as hosting candidate active galactic nuclei on the basis of lower resolution X-ray imaging. With our new observations, we find that X-ray sources in two galaxies (SDSS J121326.01+543631.6 and SDSS J122111.29+173819.1) are off nuclear and lack corresponding radio emission, implying they are likely luminous X-ray binaries. The third galaxy (Mrk 1434) contains two X-ray sources (each with erg s-1) separated by 28, has a low-metallicity (12 + log (O/H) = 7.8), and emits nebular He ii 4686 line emission. The northern source has spatially coincident point-like radio emission at 9.0 GHz and extended radio emission at 5.5 GHz. We discuss X-ray binary interpretations (where an ultraluminous X-ray source blows a ‘radio bubble’) and active galactic nucleus interpretations (where a black hole launches a jet). In either case, we find that the He ii emission cannot be photoionised by the X-ray source, unless the source was 30–-90 times more luminous several hundred years ago.
keywords:
galaxies: dwarf — stars: black holes — radio continuum: galaxies — X-rays: galaxies1 Introduction
There is abundant evidence that supermassive black holes (SMBHs; ) ubiquitously exist at the centres of large galaxies (e.g., Kormendy & Ho, 2013), some of which accrete and shine as active galactic nuclei (AGNs). Some lower-mass dwarf galaxies (which we define by stellar masses ) are known to host nuclear black holes (e.g., Filippenko & Ho 2003; Barth et al. 2004; Reines et al. 2011; Reines et al. 2013; Schramm et al. 2013; Moran et al. 2014; Sartori et al. 2015; Mezcua et al. 2016, 2018; Pardo et al. 2016; Ho & Kim 2016; Chen et al. 2017; Chilingarian et al. 2018; Nguyen et al. 2019; Baldassare et al. 2020; Martínez-Palomera et al. 2020; Cann et al. 2021; Schutte & Reines 2022), with some mass estimates as low as 104 (e.g., Baldassare et al., 2015; Woo et al., 2019). These black holes represent the lower-mass end of the SMBH population, and we refer to them here as ‘massive black holes’ (mBHs; ). An actively accreting mBH can affect how dwarf galaxies provide feedback to their larger scale environments (e.g., Dashyan et al., 2018; Trebitsch et al., 2018; Mezcua et al., 2019), and more generally, mBHs represent a phase that nuclear black holes must pass through as they grow to SMBH sizes over cosmological time scales (e.g., Volonteri, 2010). Given that dwarf galaxies have had relatively quiet evolutionary histories, constraining the fraction of dwarf galaxies hosting mBHs in the local Universe, along with the mBH mass distribution, may provide constraints on the mechanism(s) that formed the first black holes in the Universe (e.g., Ricarte & Natarajan, 2018; Inayoshi et al., 2020; Volonteri et al., 2021). The fraction of dwarf galaxies hosting an mBH is still relatively unknown, with current empirical constraints implying % occupation (Miller et al., 2015; Gallo & Sesana, 2019; Greene et al., 2020).
Stellar mass black holes (10 ) and neutron stars are also observed within some dwarf galaxies in the form of X-ray binaries (XRBs). XRBs serve as probes of stellar populations within galaxies, with the number and/or luminosity of XRBs expected to scale with the star formation rate, stellar mass, and metallicity of the host galaxy (e.g., Grimm et al., 2003; Gilfanov, 2004; Linden et al., 2010; Mineo et al., 2014; Lehmer et al., 2021). Intriguingly, lower-metallicity galaxies appear to contain an excess of luminous XRBs compared to Solar-metallicity galaxies (Prestwich et al., 2013; Brorby et al., 2014; Douna et al., 2015; Ponnada et al., 2020; Lehmer et al., 2021), which may be a consequence of lower-metallicity progenitor stars having weaker stellar winds, and therefore producing black hole remnants that are more numerous and/or more massive (e.g., Heger et al. 2003; Mapelli et al. 2010). Besides tracing stellar populations, the energy output from XRBs can also provide feedback to their host galaxies. For example, line emission from the high-ionisation He ii 4686 line ( eV) has been observed from some ultraluminous X-ray sources (ULXs),111We define ULXs as having X-ray luminosities erg s-1. ULXs are most commonly interpreted as super-Eddington neutron star or black hole XRBs (see, e.g., Feng & Soria, 2011; Kaaret et al., 2017). which is often interpreted as an X-ray photoionised nebula (Pakull & Angebault, 1986; Moon et al., 2011). Extrapolating such ULX phenomenology in the local Universe to higher redshifts, XRBs could have contributed to the X-ray heating of the intergalactic medium during the Epoch of Reionisation and Cosmic Dawn (e.g., Mirabel et al., 2011; Ponnada et al., 2020). Thus, characterising both the XRB and mBH populations in nearby dwarf galaxies, particularly as a function of host galaxy metallicity, is important for understanding the formation of the first black holes and galaxies in the Universe.
X-ray observations are commonly used to identify accreting compact objects, since hard X-ray emission (1–2 keV) is a universal signature of accretion. However, in several cases, it is very challenging to determine the mass of an accreting object via X-ray observations alone. In particular, both a rapidly-accreting XRB and a weakly-accreting mBH/SMBH can have comparable X-ray luminosities in the erg s-1 range, and they can also display similar X-ray spectral shapes (below 50 keV). Folding in multiwavelength information is therefore essential for differentiating between rapidly accreting XRBs and weakly-accreting mBHs/SMBHs. It is well established that weakly accreting SMBHs (i.e., low-luminosity AGNs with , where is the bolometric luminosity and erg s-1 is the Eddington luminosity) emit compact, usually unresolved, radio emission with a flat spectrum (, where is the radio flux density at frequency , and the radio spectral index for a flat spectrum; Ho, 2008). Such unresolved, flat spectrum radio emission is usually interpreted as a partially self-absorbed synchrotron jet (Blandford & Königl, 1979). Meanwhile, rapidly accreting XRBs do not launch jets that would be detectable beyond distances of a few Mpc (Fender et al., 2004). Thus, the presence of unresolved radio emission has the potential to exclude hard X-ray sources as rapidly accreting XRBs.
In this paper, we present high spatial-resolution X-ray (Chandra), optical/near-infrared (Hubble Space Telescope; HST), and radio observations (Karl G. Jansky Very Large Array; VLA) of three nearby dwarf galaxies that each host at least one hard X-ray point source. These three targets were initially identified as AGN candidates by Lemons et al. (2015), but with the caveat that the positions of their X-ray sources were poorly determined. From the multiwavelength data presented here, we better locate the positions of the X-ray sources within these three galaxies, and we attempt to constrain the nature of each source (i.e., XRB or mBH). In Section 2 we detail our sample selection and data reduction. We outline our results in Section 3, followed by a discussion in Section 4. Our conclusions are presented in Section 5. Unless stated otherwise, uncertainties are reported at the 68% confidence level.
2 Observations and Data Reduction
2.1 Sample
Our three targets were selected from the survey by Lemons et al. (2015), who cross matched 44,000 nearby dwarf galaxies () from the NASA-Sloan Atlas222http://www.nsatlas.org/ to the Chandra Source Catalog (CSC Release 1.1; Evans et al. 2010). They identified 19 galaxies with hard X-ray point sources (2–7 keV), of which 10 contained an X-ray source positionally consistent with the galaxy optical centre (given positional uncertainties, we note that not every galaxy has a well defined nucleus). They presented these 10 galaxies as AGN candidates.333Since publication of Lemons et al. (2015), there is new theoretical evidence that mBHs do not need to reside in the nucleus (e.g., Bellovary et al., 2019).
| Name | D | SFR | 12+ | |
|---|---|---|---|---|
| (Mpc) | () | ( yr-1) | ||
| (1) | (2) | (3) | (4) | (5) |
| Mrk 1434 | 30.7 | 6.6 | 0.9 | 7.8 |
| SDSS J1213 | 32.7 | 7.3 | 2.2 | … |
| SDSS J1221 | 16.1 | 8.0 | 1.5 | 8.3 |
Chandra provides exquisite spatial resolution (04) for targets located at the telescope’s aimpoint, but the resolution degrades for sources located farther away. Of the 10 AGN candidates in Lemons et al. (2015), they found that four galaxies contain X-ray sources that are far enough from the aimpoint to have large positional uncertainties (5, which is comparable to the projected size of the entire dwarf galaxy). Of these four galaxies, three contained X-ray sources with hard X-ray luminosities 3 (1.2 dex) larger than expected from the galaxy-wide contribution from X-ray binaries, given the stellar mass and star formation rate of each galaxy (see Sections 4.3 and 4.4 of Lemons et al. 2015). These three galaxies include: Mrk 1434 (), SDSS J121326.01+543631.6 (; hereafter SDSS J1213), and SDSS J122111.29+173819.1 (; hereafter SDSS J1221; see Table 1). Of particular interest, Mrk 1434 is a metal-poor galaxy (; Shirazi & Brinchmann 2012) and its optical spectrum from the Sloan Digital Sky Survey (SDSS; York et al. 2000) shows nebular He ii line emission (Shirazi & Brinchmann, 2012).
To better constrain the locations of the X-ray sources relative to their host galaxies, we obtained new Chandra X-ray and HST optical/near-infrared observations for these three galaxies. We also obtained new VLA radio observations for one target, SDSS J1213, while archival VLA data were already available for the other two sources. We adopt distances for each galaxy based on their redshifts, using km s-1 Mpc-1, except for SDSS J1221, which is a member of the Virgo cluster (VCC 459). For this galaxy, we use a distance of 16.1 Mpc based on the Tully-Fisher relation (Kashibadze et al., 2020). For all three galaxies, we adopt star formation rates from Lemons et al. (2015), which are based on (dust-corrected) far-ultraviolet and infrared luminosities and the relationships from Hao et al. (2011) and Kennicutt & Evans (2012). For SDSS J1221, we scale the star formation rate from Lemons et al. (2015) to 16.1 Mpc. For stellar mass estimates, following Reines & Volonteri (2015), we use the colour-dependent mass-to-light ratios from Zibetti et al. (2009).
2.2 Chandra
We obtained new Chandra observations (Cycle 17; PI Plotkin) with each galaxy centred at the aimpoint of the S3 chip of the Advanced CCD Imaging Spectrometer (ACIS; Garmire et al., 2003). Data were telemetered in VFAINT mode. Chandra data reduction was carried out using the Chandra Interactive Analysis of Observations (ciao) software version 4.13 (Fruscione et al., 2006) and caldb v4.9.5. The Chandra data were reprocessed using chandrarepro to create new level 2 event files and bad pixel files, and to apply the latest calibration files. We then searched for background flares using the deflare script, and we did not find any periods with elevated background levels.
| Source | obsID | Date | Exp Time | Right Ascension | Declination | Net Rate (0.5-7.0 keV) | Net Rate (2.0-7.0 keV) | |
|---|---|---|---|---|---|---|---|---|
| (ks) | (J2000) | (J2000) | () | (ks-1) | (ks-1) | |||
| (1) | (2) | (3) | (4) | (5) | (6) | (7) | (8) | (9) |
| Mrk 1434 X-N | 18059 | 2016 Jan 26 | 5.0 | 10:34:10.19 | +58:03:49.0 | 0.35 | ||
| Mrk 1434 X-S | 18059 | 2016 Jan 26 | 5.0 | 10:34:10.11 | +58:03:46.3 | 0.36 | ||
| SDSS J1213 | 18060 | 2016 Aug 04 | 7.0 | 12:13:26.12 | +54:36:34.1 | 0.38 | ||
| SDSS J1221 | 18061 | 2016 Feb 13 | 7.0 | 12:21:11.00 | +17:38:18.0 | 0.33 |
Next we aligned the event file astrometry to the SDSS reference frame. We first excluded areas on each X-ray image occupied by the dwarf galaxy, so that our astrometric corrections would not be influenced by sources within each target galaxy. We then filtered each Chandra image to 0.5-7.0 keV and ran wavdetect to identify X-ray point sources, adopting wavelet scales of 1,2,4,8, and 16, setting sigthresh to 10-6 (i.e., approximately one false positive per chip), and using a point spread function map (at 2.3 keV) with an enclosed count fraction (ecf) of 0.9. The relatively large ecf was chosen to help filter out weak X-ray sources, which would not have sufficient positional accuracy for astrometric alignment. We then cross-matched X-ray sources identified by wavdetect to the SDSS catalog using wcs_match. We found only two common X-ray/optical sources for Mrk 1434, zero common sources for SDSS J1213, and one common source for SDSS J1221. Thus, we applied a translational astrometric correction for Mrk 1434 ( pixels) and for SDSS J1221 ( pixels) using wcs_update. No astrometric correction was applied to SDSS J1213.
We next re-ran wavdetect on the aligned event files (filtered from 0.5-7 keV, now including each target dwarf galaxy) to determine positions in the aligned reference frame of X-ray sources hosted by each dwarf galaxy. We used the same wavdetect parameters as above, except we used ecf=0.3 when generating the point spread function map to allow the detection of fainter point sources. wavdetect identified two X-ray sources in Mrk 1434, one source in SDSS J1213, and one source in SDSS J1221. The positions of each X-ray source are listed in Table 2. We estimated 95% uncertainties of each X-ray position based on the distance from the telescope aimpoint and the number of counts detected by wavdetect, following Equation 5 in Hong et al. (2005). Note, this 95% positional uncertainty represents the statistical error on each source. For SDSS J1213 in particular, where we could not perform an astrometric alignment of the Chandra image, there is an additional systematic uncertainty that could be as large as 2 (although 08 is more typical).444https://cxc.harvard.edu/cal/ASPECT/celmon/
We then measured the number of counts from each X-ray source using srcflux. We adopted circular apertures centred at each wavdetect position with radii of 5 pixels, except for Mrk 1434, which contains two X-ray sources, where we adopted radii of 2.5 pixels to avoid the regions from each X-ray source from overlapping. The number of background counts per pixel was estimated from nearby source-free regions of each image. These measurements were performed in both broad (0.5-7.0 keV) and hard (2.0-7.0 keV) images, and we detected 19–73 counts from each source in the broad band and 8–23 counts in the hard band. All X-ray detections (in all bands) are significant at the 99% level according to the confidence tables in Kraft et al. (1991).
Finally, spectra were extracted for each X-ray source using specextract and fit using an absorbed powerlaw model (tbabs*powerlaw) in the Interactive Spectral Interpretation System v1.6.2 (ISIS; Houck & Denicola 2000), adopting Cash statistics (Cash, 1979) given the relatively low number of counts per source. We initially left the column density as a free parameter. However, for three X-ray sources converged to zero, in which case we froze the value to the Galactic column density and refit the spectrum. Model fluxes were calculated using the cflux convolution model. Spectral parameters and model fluxes are reported in Table 3.
| Broad (0.5-10.0 keV) | Hard (2.0-10.0 keV) | ||||||
| Source | C-stat/d.o.f. | log Flux | log Luminosity | log Flux | log Luminosity | ||
| ( cm-2) | (erg s-1 cm-2) | (erg s-1) | (erg s-1 cm-2) | (erg s-1) | |||
| (1) | (2) | (3) | (4) | (5) | (6) | (7) | (8) |
| Mrk 1434 X-N | 56.9a | 16.0/13 | |||||
| Mrk 1434 X-S | 0.6b | 10.3/13 | |||||
| SDSS J1213 | 1.4b | 5.8/12 | |||||
| SDSS J1221 | 2.7b | 27.1/32 | |||||
| aBest-fit column density cm-2, reported as an upper limit (95% confidence level) because the uncertainty on the best-fit value extends down to the Galactic value of cm-2 . | |||||||
| bColumn density frozen to the Galactic value during fitting, taken from Dickey & Lockman (1990). | |||||||
2.3 Hubble Space Telescope
We observed each galaxy with the Wide Field Camera 3 (WFC3) aboard HST for one orbit per galaxy (PI Plotkin; program 14356). For Mrk 1434 and SDSS J1221 we observed in both the F110W and F606W filters (with the IR and UVIS channels, respectively), and for SDSS J1213, which is a fainter galaxy, we took observations only in the F110W filter. Observations in each filter were taken over four dither positions, and we used the IRSUB512 subarray for Mrk 1434 and SDSS J1221. Total exposure times in each filter are listed in Table 4. Data were downloaded from the Mikulski Archive for Space Telescopes (MAST), and individual exposures were aligned and combined using AstroDrizzle in the DrizzlePac software (Hack et al., 2013).555https://hst-docs.stsci.edu/drizzpac The F110W drizzled images were created with plate scales 006 pix-1 for Mrk 1434 and SDSS J1221, and 009 pix-1 for SDSS J1213. All F606W images have plate scales 003 pix-1.
We aligned the HST astrometry to the Gaia Data Release 2 (Gaia Collaboration et al., 2018) reference frame using the tweakreg task within AstroDrizzle (after excluding sources falling within each galaxy).666We note that we aligned HST images to the Gaia frame and the Chandra X-ray images to the SDSS frame, because we generally found a larger number of common HST/Gaia sources vs. common HST/SDSS sources (and vice-versa for Chandra). Compared to the statistical uncertainty on each Chandra position (03–04), we do not expect a meaningful offset between the absolute astrometry of SDSS vs. Gaia, such that systematic uncertainties in our astrometric alignments are dominated by the small number of sources used to apply the corrections. For Mrk 1434, the corrections resulted in astrometric shifts by () pixels (from two common sources) and () pixels (from nine common sources) in the F110W and F606W filters, respectively. For SDSS J1213, we shifted the F110W filter by () pixels (five common sources). Finally, for SDSS J1221 we could not identify enough common sources between the HST image and the Gaia catalog in the F110W filter (which has a smaller field of view). So, we only aligned the F606W filter to the Gaia frame, shifting by () pixels (four common sources), and we then aligned the F110W filter to the F606W filter (via three common sources between the two HST filters).
| Source | Date | Filter | Exp. Time |
|---|---|---|---|
| (min) | |||
| (1) | (2) | (3) | (4) |
| Mrk 1434 | 2016 Apr 16 | F110W/F606W | 8.6/30.9 |
| SDSS J1213 | 2016 Apr 16 | F110W | 43.7 |
| SDSS J1221 | 2016 Apr 9 | F110W/F606W | 8.6/26.9 |
2.4 Very Large Array
Mrk 1434 and SDSS J1221 both had archival datasets (PI Satyapal, 14A-358) from the VLA, while new data were obtained for SDSS J1213 for this study (PI Plotkin, SH0563). All three galaxies were observed in the most extended A configuration. Both Mrk 1434 and SDSS J1221 observations were from 4.5-6.5 GHz (C band) and 8-10 GHz (X band), while SDSS J1213 was observed only from 8-12 GHz.
The Common Astronomy Software Applications (CASA; CASA Team et al. 2022) software package version 5.1 was used to carry out standard data reduction. We used 3C 286 to perform delay and bandpass calibrations, and to set the flux density scale. Nearby phase calibrators (see Table 5) were observed to solve for the time-dependent complex gain solutions. Imaging was performed using the task tclean, using two Taylor terms (nterms=2) to account for the wide fractional bandwidth and natural weighting to maximise sensitivity. We achieved root-mean-square (rms) sensitivities ranging from 3.7 to 8.7 Jy bm-1 in each observing band (see Table 5).
| Source | Program | Date | Phase Calibrator | |||||
| (J2000) | (GHz) | (GHz) | (min) | () | (Jy bm-1) | |||
| (1) | (2) | (3) | (4) | (5) | (6) | (7) | (8) | (9) |
| Mrk 1434a | 14A-358 | 2014 Feb 24 | 1035+564 | 5.5 | 2.0 | 8.5 | 0.450.38 | 8.7 |
| Mrk 1434b | 14A-358 | 2014 Feb 24 | 1035+564 | 9.0 | 2.0 | 8.5 | 0.270.24 | 8.6 |
| SDSS J1213 | SH0563 | 2016 Sep 30 | 1219+482 | 10.0 | 4.0 | 39.5 | 0.280.23 | 3.7 |
| SDSS J1221 | 14A-358 | 2014 Feb 26 | 1158+248 | 5.5 | 2.0 | 25.8 | 0.420.38 | 5.9 |
| SDSS J1221 | 14A-358 | 2014 Feb 26 | 1158+248 | 9.0 | 2.0 | 26.0 | 0.250.23 | 5.8 |
| aExtended radio emission detected near Mrk 1434 X-N at 5.5 GHz, with mJy and mJy bm-1. The centroid of emission is located at RA=10h34m10.1867s 0.0042s, Dec=58∘03491481 00763. | ||||||||
| bPoint-like radio emission detected near Mrk 1434 X-N at 9.0 GHz, with mJy bm-1. The emission is located at RA=10h34m10.2045s 0.0039s, Dec=58∘03492883 00460. | ||||||||
The only X-ray source for which we found coincident radio emission is Mrk 1434 X-N, where we found radio detections at both 5.5 and 9.0 GHz within the X-ray error circle. We used imfit to fit two-dimensional Gaussians in the image plane (at each frequency) to calculate the size of the radio structure, and to measure peak and integrated flux densities. As discussed further in Section 3.1, the 5.5 GHz emission is slightly extended (with integrated flux density mJy) while the 9.0 GHz is point-like ( mJy). The centroids of the radio emission at each frequency are offset by . For the other two galaxies, we place 3 limits on their radio flux densities. We note that SDSS J1221 displays radio emission aligned with a likely H ii region toward the eastern outskirts of the galaxy that is not associated with X-ray emission, so we do not discuss that radio emission in this paper.
3 Results
In the following subsections we present the multiwavelength results for each galaxy, deferring discussions regarding the possible nature of each X-ray source to Section 4. Composite HST images are shown for each galaxy in Figure 1, including the locations of X-ray sources.
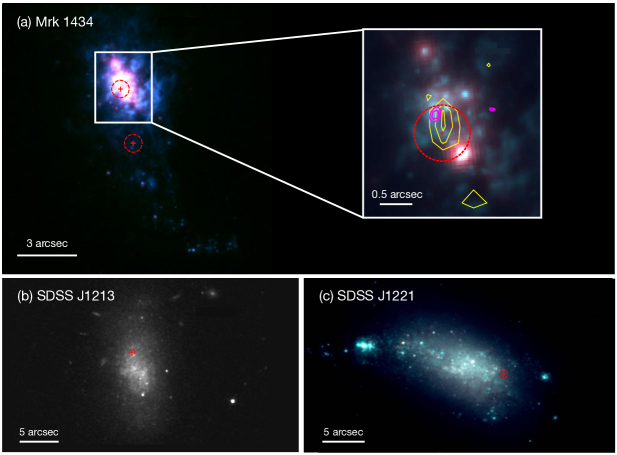
3.1 Mrk 1434
Mrk 1434 hosts two X-ray sources separated by 28 (see Figure 1a), both of which are classified as ULXs: the northern source (Mrk 1434 X-N), which is located toward the galactic nucleus, has an unabsorbed hard X-ray luminosity erg s-1, and the southern source (Mrk 1434 X-S) has erg s-1. The X-ray spectra of each source are fit by powerlaw models with photon indices of for Mrk 1434 X-N and for Mrk 1434 X-S. Neither source shows evidence for significant intrinsic absorption.
It is unlikely that either hard X-ray source is a superposed foreground/background object. Given the density and flux distribution of hard X-ray sources in the cosmic X-ray background (see, e.g., Equation 2 of Moretti et al. 2003), we expect to only find 0.001 and 0.003 hard X-ray sources with 2-10 keV fluxes similar (or brighter) than Mrk 1434 X-N and Mrk 1434 X-S, respectively, within the projected size of the galaxy (which we conservatively approximate as a circle with a 20 radius).
Radio emission is detected only from the northern source, Mrk 1434 X-N. At 5.5 GHz, the emission is extended with major and minor axis full width half maxima of 1106 (160 pc 90 pc), respectively, covering 3.5 synthesised beams. The centroid of the 5.5 GHz emission is 016 from the X-ray position (for reference, the 95% Chandra error circle is 035), and the integrated luminosity is erg s-1. At 9.0 GHz we detect a point source located 032 from the X-ray position, with a peak luminosity erg s-1. We do not detect any extended radio structures at 9.0 GHz, thereby indicating that the emission seen at 5.5 GHz has a steep radio spectrum (our 5.5 and 9.0 GHz radio maps have similar sensitivities; see Table 5). Note, extended emission is not simply resolved out at the higher radio frequency, since the smallest baselines of the VLA in A configuration are sensitive to structures up to 5 at 9.0 GHz, which is larger than the 1 angular size of the 5.5 GHz emission.
At 9.0 GHz, the chance of a random alignment of a background radio point source falling within the Chandra error circle is very small. Integrating the differential source counts tabulated by de Zotti et al. (2010) at 8.4 GHz, and assuming a flat radio spectrum (as expected if the 9.0 GHz emission is from a compact jet; see Section 4.1.2), we expect only sources with mJy within the X-ray error circle. The chance of a statistical fluctuation as large as 0.036 mJy (i.e., 4) within the X-ray error circle (which contains 240 pixels in the radio map) is also very small (). Thus, we believe the 9.0 GHz emission is indeed physically associated with the galaxy. However, we note that the radio source lies toward the edge of the X-ray error circle. Thus, even though the radio source formally falls within the Chandra positional uncertainty, its association specifically with Mrk 1434 X-N is less clear, particularly after considering that the Chandra X-ray astrometry of Mrk 1434 was aligned to the optical frame using only two common X-ray/SDSS sources.
Finally, we note that towards the southwest of the 035 Chandra X-ray error circle of Mrk 1434 X-N, there is an optical/near-infrared source that appears red in the HST composite image (see the zoom-in of Figure 1a). If that source is a background quasar it may also be responsible for the X-ray and/or radio emission. However, the random alignment of such a background quasar is very unlikely, as described below. The AB magnitude of the HST source in the F606W filter is 18.8, which we convert to SDSS i18.7 assuming a typical quasar spectrum (Vanden Berk et al., 2001). We then consider SDSS Type 1 quasar counts from (Richards et al., 2006; Ross et al., 2013), and we find only a negligible number of background quasars () are likely to fall within the Chandra X-ray circle by random chance (note, the random alignment of a radio-loud or a Type 2 quasar would be even rarer). That source is likely intrinsic to the galaxy.
3.2 SDSS J1213 and SDSS J1221
SDSS J1213 and SDSS J1221 each contain a single hard X-ray point source near the outskirts of each galaxy (Figure 1b-c). The hard (2-10 keV) X-ray luminosities of the sources are and erg s-1, respectively (Table 2), such that both sources are classified as ULXs. The chance of a superposed foreground/background object is negligible (we expect only 0.005 hard X-ray background sources for SDSS J1213 and 0.001 sources for SDSS J1221; Moretti et al. 2003). Neither galaxy contains radio emission within the Chandra X-ray circles to 3 upper limits of erg s-1 at 10.0 GHz for SDSS J1213, and to limits of erg s-1 and erg s-1 at 5.5 and 9.0 GHz, respectively, for SDSS J1221.
4 Discussion
In the following subsections we discuss possible interpretations for the X-ray sources in our sample of three dwarf galaxies. We focus primarily on Mrk 1434 since it exhibits the most complex phenomenology (i.e., two X-ray sources, one of which is coincident with radio emission). We provide arguments for/against XRB interpretations in Section 4.1.1 and for/against AGN interpretations in Section 4.1.2. In Section 4.1.3 we discuss whether the observed X-ray flux is sufficient to explain He ii line emission observed in the SDSS spectrum of Mrk 1434. A discussion on the nature of the X-ray sources in the other two galaxies is presented in Section 4.2.
4.1 Mrk 1434
4.1.1 XRB Interpretations
As shown in Section 3.1, both X-ray sources in Mrk 1434 are physically associated with the galaxy and luminous enough to be classified as ULXs. The observed X-ray luminosity, however, is higher than expected from the luminous tail of the galaxy’s XRB population. The luminosities of both X-ray sources are above the cutoff of the low-mass XRB luminosity function (e.g., Gilfanov, 2004), so in the following we only consider high-mass XRBs using the metallicity-dependent luminosity function from Lehmer et al. (2021). For Mrk 1434, with and SFR=0.12 yr-1, Lehmer et al. (2021) predict a total 0.5-8.0 keV X-ray luminosity (i.e., from all X-ray point sources) of erg s-1 (where the error bar represents the 68% confidence interval provided by Lehmer et al. 2021). They also predict only ULXs with erg s-1. For reference, the unabsorbed 0.5–8.0 keV model luminosities of Mrk 1434 X-N and Mrk 1434 X-S are and erg s-1, respectively. Thus, the combined X-ray luminosity of both ULXs is 10 times higher than expected relative to the Lehmer et al. (2021) luminosity function, which is significant even after considering uncertainties and intrinsic scatter.
Even though the above suggests that it is statistically unlikely for both sources to be XRBs, small number statistics could influence the above arguments, and it is worth exploring XRB interpretations. In particular, the extended 5.5 GHz radio emission from Mrk 1434 X-N could represent a ‘ULX bubble’, as similar types of extended radio structures have been observed from other ULXs, making the radio emission a signature of a ULX outflow shocking the nearby interstellar environment (e.g., Pakull et al., 2010; Soria et al., 2010, 2021; Cseh et al., 2012; Urquhart et al., 2019). If the 5.5 GHz radio emission is indeed a ULX bubble, then with erg s-1 it would represent the most luminous ULX bubble yet observed by a factor of 6 (Pakull et al., 2010; Soria et al., 2010, 2021). Meanwhile, the projected size of 160 pc 90 pc () in diameter is fairly typical compared to other ULX bubbles, where diameters range from 25–350 pc (Soria et al. 2021; also see Table 1 of Berghea et al. 2020 and references therein). Taking the peak flux density of the 5.5 GHz structure, and extrapolating to 1 GHz assuming a spectral index , the intensity of the radio bubble in Mrk 1434 X-N would be erg s-1 cm-2 Hz-1 sr-1, which is relatively large but reasonable compared to other ULX radio bubbles with similar physical sizes (see Figure 5 of Berghea et al. 2020).
Although a ULX bubble is one interpretation of the 5.5 GHz emission, we stress that it is not a unique (or necessary) explanation. Adopting SFR yr-1 for Mrk 1434 and the relation between star formation rate and the 1.4 GHz specific luminosity from Kennicutt & Evans (2012), we expect erg s-1 (we convert from 1.4 GHz to 5.5 GHz assuming a spectral index ). Considering that the intrinsic scatter on the conversion between SFR and radio luminosity is on the order of 0.3 dex (Murphy et al., 2011), the observed extended structure at 5.5 GHz could be produced entirely by star formation processes. Since the extended radio structure at 5.5 GHz is not detected at 9.0 GHz, the dominant radio emission mechanism in such a scenario would most likely be synchrotron radiation with a steep spectrum from supernova remnants. Note, our data exclude free-free radio emission from an H ii region, which would produce a flat spectrum that would be detectable at 9.0 GHz.
4.1.2 AGN Interpretations
AGN can also produce extended radio emission, which is another viable explanation for the 5.5 GHz radio structure. However, in light of the discussion in the previous subsection that a super-Eddington XRB is also capable of producing the observed extended emission at 5.5 GHz, the resolved radio complex does not provide useful diagnostics for attempting to discriminate between XRB vs. AGN. Since the X-ray spectra of Mrk 1434 X-N and Mrk 1434 X-S ( and , respectively) are consistent with low-luminosity AGNs (Younes et al., 2011; Yang et al., 2015), we focus the following discussion on AGN scenarios with Eddington ratios . For such weakly accreting AGN, we expect to observe unresolved radio emission from a partially self-absorbed compact jet (Ho, 2008). By combining X-ray and radio luminosities, we can then make crude estimates on black hole masses by appealing to the fundamental plane of black hole activity (Merloni et al., 2003; Falcke et al., 2004). For Mrk 1434 X-N, we then interpret the the unresolved 9.0 GHz radio emission as arising from a compact jet, and we utilise the fundamental plane regression by Gültekin et al. (2019),
| (1) | ||||
which has an intrinsic scatter 1 dex. We estimate that Mrk 1434 X-N would have if powered by an mBH (see Table 6). Note, we assume a flat radio spectrum to convert the observed radio luminosity at 9.0 GHz to 5.0 GHz for use in the fundamental plane (we cannot use our 5.5 GHz radio map to estimate the 5 GHz luminosity because we do not have enough signal-to-noise to attempt to decompose a point source embedded within the extended radio emission observed at 5.5 GHz). Similarly, the lack of radio emission from Mrk 1434 X-S implies (where we adopt a 3 upper limit, based on the observed near Mrk 1434 X-S in our 5.5 GHz image). These mass estimates imply Eddington ratios () of and for Mrk 1434 X-N and Mrk 1434 X-S, respectively, which, assuming bolometric corrections of 10, are consistent with Eddington ratios for which the fundamental plane can be applied (see, e.g., Plotkin et al., 2012).
| Source | |||
|---|---|---|---|
| (erg s-1) | (erg s-1) | () | |
| (1) | (2) | (3) | (4) |
| Mrk 1434 X-N | 5.6 | ||
| Mrk 1434 X-S | 35.2 | 5.6 | |
| SDSS J1213 | 34.9 | 5.3 | |
| SDSS J1221 | 34.4 | 5.0 |
4.1.3 On the Origin of Nebular He ii Emission
In the following we determine whether the X-ray emission from Mrk 1434 is a strong enough source of photoionisation to explain the strength of the He ii emission in the SDSS spectrum of Mrk 1434. The observed He ii line flux is erg s-1 cm-2, which translates to a photon flux of photons s-1 cm-2. Every photon emitted in the He ii line requires 5.2 ionizing photons incident on singly ionised helium (Pakull & Angebault, 1986). Given the ionisation potential of singly ionised helium ( eV), and considering that the photoionisation cross section has a steep dependence on photon energy, , then producing the observed SDSS He ii line flux requires a photon flux in the extreme ultraviolet (54–300 eV) of photons s-1 cm-2. Note, this photon flux is an underestimate because we have not corrected the observed SDSS line flux for extinction.
The 3 SDSS spectroscopic fibre is centred near Mrk 1434 X-N, such that if the He ii emission arises from photoionisation by the X-ray source, we expect the emission to be dominated by Mrk 1434 X-N. We do not have direct measurements on the extreme ultraviolet flux from 54-300 eV, so we extrapolate the Chandra X-ray spectrum into the extreme ultraviolet. Our best-fit powerlaw model predicts a photon flux of photons s-1 cm-2 (note the large range in uncertainty because we are extrapolating the model to energies lower than the Chandra X-ray band). Thus, while high-energy radiation from Mrk 1434 X-N may contribute to some of the He ii photoionisation, the observed X-ray source is too faint, by a factor of 30, to supply all of the photoionising photons. If we assume a thermal X-ray emission model (tbabs*diskbb), it becomes even more difficult for the X-ray source to explain the He ii photionisation, as the extrapolated 54-300 eV extreme ultraviolet flux becomes 90 times too faint. Adding a contribution of photons form Mrk 1434 X-S would only increase the above photon flux by a factor of 2, for either spectral model.
There is currently no evidence for significant X-ray variability from Mrk 1434 over the past 1–2 decades. Coincidentally, the SDSS spectrum and the archival Chandra observation from Lemons et al. (2015, Chandra obsID 3347) were both taken in May 2002 (separated by 2 weeks). The archival data from 2002 show nearly identical X-ray luminosities ( and 39.9 erg s-1 for Mrk 1434 X-N and Mrk 1434 X-S, respectively; see Table 2 of Lemons et al. 2015) compared to the Chandra observations presented here, which were taken nearly 14 years later (see Table 2 of this paper). There are also two X-ray detections of Mrk 1434 in the third XMM-Newton serendipitous source catalog (3XMM; Rosen et al., 2016) in 2007 and 2008. Both X-ray sources are blended together due to XMM-Newton’s poorer spatial resolution. Comparing the XMM-Newton fluxes to the combined fluxes of both sources in the Chandra observations, X-ray variability is smaller than a factor of 2 over the four observations. However, considering the light travel time between the X-ray source and the ionised medium, it is feasible that Mrk 1434 X-N was more active in the past. The projected radius of the SDSS spectroscopic fibre is 730 light years, and we cannot exclude the possibility that Mrk 1434 X-N was 30–90 times more luminous several hundred years ago, which appears to be on the only viable way for the He ii emission to be powered by X-ray photoionisation.
If the extended radio emission is produced by an outflow shocking the interstellar medium, then one must also consider the possibility of the He ii emission being produced by ionisation from a radiative shock (e.g., Dopita & Sutherland, 1995). According to the MAPPINGS III libraries of line ratios for radiative shocks (Allen et al., 2008), assuming a shock velocity of 300 km s-1, we expect the luminosity of the He ii 4686 emission line , where is the total radiative luminosity of the shock.777Given the low metallicity of Mrk 1434, we adopt the MAPPINGS III model grid with Small Magellanic Cloud abundances. We also assume an interstellar medium density of 1 cm-3 and equipartition of magnetic and thermal pressures. Assuming that the kinetic power required to inflate a bubble (Weaver et al., 1977), then explaining the observed He ii line via shock ionisation requires an outflow with erg s-1.
We do not have a reliable method to independently estimate (especially considering that other emission lines in the SDSS spectrum are dominated by star formation). However, for an order of magnitude estimate, we calculate the minimum synchrotron energy of the 5.5 GHz radio emission, which is erg (Longair, 1994).888We adopt erg s-1, a bubble diameter of 160 pc, and an ion to electron energy ratio of . We note that , and the proper value of is not well constrained. A 300 km s-1 shock would take yr to inflate a bubble with a 160 pc diameter, such that the average power stored in internal energies of the synchrotron emitting structure is erg s-1 (i.e., the average power in particles and in the magnetic field). Thus, an outflow would need to carry 102 times more power in order for a shock to be the sole ionisation source of the observed He ii emission line. Of course, is a minimum energy estimate, and the power in bubbles/cavities carved out by kinetic outflows have sometimes been observed to be larger, sometimes by factors of several hundreds (e.g., Ito et al., 2008), such that the above does not exclude the possibility of shock ionisation.
For comparison, the ULX NGC 6946 MF16 (Roberts & Colbert, 2003) has a luminous and compact radio bubble (Berghea et al., 2020), which suggests a relatively powerful outflow. Adopting the NGC 6946 MF16 bubble line flux in the [Fe ii] 16440 emission line ( erg s-1 cm-2) and a distance of 7.8 Mpc (Long et al., 2020), the MAPPINGS III libraries for a 300 km s-1 shock (with Solar abundances) suggest a kinetic power of erg s-1. Thus, the kinetic power of NGC 6946 MF16 (i.e., one of the most powerful known ULX radio bubbles) is an order of magnitude lower than the power required for shock ionisation to be responsible for the observed strength of the He ii emission line near Mrk 1434 X-N. Thus, if the He ii line is powered by shock ionisation, then it would represent one of the most powerful bubbles carved by a ULX outflow yet observed.
Intriguingly, Mrk 1434 is one member of a population of 182 star forming galaxies with nebular He ii emission that were identified by Shirazi & Brinchmann (2012). The ratios of He ii/H relative to [N ii] 6584/H are inconsistent with AGN for these galaxies. Typically, when an AGN is absent, Wolf-Rayet stars are considered the primary stellar population capable of producing enough extreme ultraviolet flux above the 54 eV He ii ionisation edge. However, Shirazi & Brinchmann (2012) inspected the SDSS spectra for broad emission features indicative of Wolf-Rayet stars, and they found no Wolf-Rayet signatures in the spectrum of Mrk 1434. Thus, without concrete evidence that Mrk 1434 X-N was indeed brighter several hundred years ago to power the He ii emission via photoionisation, and/or lacking a reliable estimate of the kinetic power of an outflow for shock ionisation, the source of extreme ultraviolet photons in Mrk 1434 remains a mystery. Another plausible explanation could be photoionisation from extreme ultraviolet photons emitted by exotic stellar populations (like rapidly rotating stars) in metal-poor environments (see the discussion in Section 6 of Shirazi & Brinchmann 2012). It is very plausible that several of the above scenarios contribute toward producing the He ii line, and Shirazi & Brinchmann (2012) recovered a heterogeneous population (multiple mechanisms may even contribute to producing the He ii emission within a single galaxy). For example, Senchyna et al. (2020) conclude that X-ray photoionisation cannot explain nebular He ii emission across a sample of nearly a dozen metal-poor galaxies. Meanwhile, there are several well-established examples of X-ray sources that are indeed sufficient to power nebular He ii emission (e.g., Pakull & Angebault, 1986; Moon et al., 2011; Schaerer et al., 2019; Simmonds et al., 2021). Further observational constraints, ideally via systematic X-ray surveys of metal-poor dwarf galaxies under high spatial resolution, are required to understand the level to which ULXs contribute extreme ultraviolet radiation in metal-poor galaxies, which has implications for understanding sources of ionisation and heating of the intergalactic medium in the early Universe.
4.2 SDSS J1213 and SDSS J1221
Our new Chandra observations confirm the conclusion of Lemons et al. (2015) that both X-ray sources are more luminous than expected from the XRB populations in each galaxy, as described below. Unlike for Mrk 1434, the luminosities of both X-ray sources in SDSS J1213 and SDSS J1221 are low enough that we should consider both high-mass and low-mass XRBs. Following Lemons et al. (2015), we therefore adopt the relation from Lehmer et al. (2010), which predicts the hard X-ray luminosity from low-mass and high-mass XRBs as a function of stellar mass and star formation rate: , with an intrinsic scatter of 0.34 dex. The Lehmer et al. (2010) relation predicts and erg s-1 for SDSS J1213 and SDSS J1221, respectively. The predicted luminosities are 3 times higher if we instead adopt the calibrations in Lehmer et al. (2019). Thus, the observed X-ray luminosities are 120–360 and 17–50 times higher than expected, for SDSS J1213 and SDSS J1221, respectively.999The Lehmer et al. (2010) relation is calibrated to galaxies with approximately Solar metallicities. The metallicity of SDSS J1213 is unknown, and the metallicity of SDSS J1221 is (Zhao et al., 2013). If we adopt the metallicity-dependent Lehmer et al. (2021) relation for high-mass XRBs, the X-ray luminosity of the X-ray source in SDSS J1221 is still 20 times higher than expected for a galaxy with its star formation rate and metallicity.
In light of recent theoretical motivation for ‘wandering’ mBHs (Bellovary et al., 2019; Bellovary et al., 2021, also see, e.g., Mezcua & Domínguez Sánchez 2020; Reines et al. 2020; Greene et al. 2021; Sargent et al. 2022 for observational searches), an X-ray source being ‘off-nucleus’ does not on its own preclude the possibility of an accreting mBH. It is possible that these sources are mBHs launching jets that are either (a) beneath our radio detection limit or (b) that are very extended and ‘resolved out’ by the VLA when it is in its most extended A configuration. The largest angular scale to which the VLA is sensitive to radio emission at our observing frequencies (X-band) and configuration (A) is , such that our VLA observations would not detect flux from extended jets larger than 850 and 410 pc for SDSS J1213 and SDSS J1221, respectively. On the other hand, the radio cores of weakly accreting AGN (bolometric luminosities ) have flat radio spectra and are compact enough that their radio emission should not be ‘resolved out’ at VLA resolutions (see, e.g., Orienti & Prieto, 2010). Thus, if only considering mBHs in the weak accretion regime, we can use our radio upper limits in conjunction with the fundamental plane to place mass limits of and for SDSS J1213 and SDSS J1221, respectively. Requiring , and assuming X-ray bolometric corrections of 10, then places lower limits on black hole masses of (SDSS J1213) and (SDSS J1221). Thus, there is a relatively narrow range of mass where our VLA observations could ‘miss’ the compact radio jet from a weakly accreting mBH. Note, our radio limits do not place useful constraints on the possibility of a more rapidly accreting mBH with , which would correspond to a mass for both sources. Nevertheless, even though our data do not exclude the possibility of mBHs, Occam’s razor probably suggests that the simplest and most likely scenario is that these are luminous XRBs.
4.3 An Update to Lemons et al. (2015)
After considering the above multiwavelength observations, all 10 of the dwarf galaxy AGN candidates identified by Lemons et al. (2015) (via hard X-ray emission) now have sufficient spatial resolution to determine if the X-ray sources indeed reside in galactic nuclei. Our study reduces their number of AGN candidates to 7–8 (adopting an AGN definition that requires nuclear sources). It is very unlikely that any of these 7–8 nuclear sources are chance alignments with foreground/background X-ray emitting objects. Adopting the hard (2-10 keV) X-ray fluxes and X-ray position error circles of the nuclear candidates from Table 2 of Lemons et al. (2015), and replacing the X-ray flux and positional uncertainty of Mrk 1434 X-N with the values presented here, the Moretti et al. (2003) cosmic X-ray background predicts only 0.003 sources to fall within the nuclei of the eight possible nuclear mBH candidates. Obtaining 7–8 viable AGN candidates is a significant result, considering that (a) the Lemons et al. (2015) dwarf galaxy survey was archival and therefore serendipitous in nature, and (b) the three dwarf galaxies with follow-up presented here represent three of their most unlikely AGN candidates (given the poor spatial resolution of their archival Chandra data). Lemons et al. (2015) found X-ray sources in 19 galaxies total (i.e., the remaining 11–12 galaxies host off-nuclear X-ray sources, most likely XRBs). Thus, if a luminous X-ray source is detected in a dwarf galaxy, our study (very roughly) implies a 30–40% chance101010This number is an upper limit, and it neglects biases inherent to an archival/serendipitous survey, which is out of the scope of this paper to quantify. that it could be a nuclear mBH, which supports the viability of using X-ray surveys to identify mBHs in low-mass galaxies, as long as the survey is performed with sufficient sensitivity and spatial resolution. We stress the importance of high spatial-resolution X-ray observations. For example, Mrk 1434 was previously identified as an AGN from an XMM-Newton survey (Birchall et al., 2020), while our higher spatial-resolution Chandra observation clearly resolves the ‘nuclear’ X-ray source into two distinct sources (and even then, it remains unclear if either source is indeed an accreting mBH).
5 Summary and Conclusions
We have presented a multiwavelength study of three nearby dwarf galaxies that host ULXs. Two galaxies in our sample, SDSS J1213 and SDSS J1221, each contain single off-nuclear X-ray sources that we suspect are luminous XRBs. The third galaxy, Mrk 1434 hosts two X-ray sources separated by 28. The northern source (Mrk 1434 X-N) also displays extended radio emission at 5.5 GHz and point-like radio emission at 9.0 GHz. It remains unclear if the X-ray sources in Mrk 1434 are XRBs or AGNs (especially Mrk 1434 X-N), although either scenario is intriguing. If XRBs, then the combined X-ray luminosity of both sources is larger than expected for a galaxy with Mrk 1434’s star formation rate and (low) metallicity. Futhermore, the extended radio emission at 5.5 GHz could then represent the most luminous ‘ULX bubble’ ever observed in the radio, although we stress that the 5.5 GHz radio emission can also be attributed entirely to star formation within the galaxy, or to an AGN jet. Regardless of the correct scenario, we find that the line emission from He ii in Mrk 1434 is inconsistent with a nebula being powered by the central X-ray source, unless the central source underwent a period of higher activity several hundred years ago, or if the the nebula is shock ionised by an outflow that is an order of magnitude more powerful than yet observed from a ULX. If Mrk 1434 X-N is an AGN, then the 9.0 GHz radio emission may represent a compact synchrotron jet from a low-luminosity AGN power by an mBH with . We conclude by stressing the importance of high spatial-resolution observations when performing multiwavelength searches for mBHs in dwarf galaxies.
Acknowledgements
We thank the anonymous referee for helpful comments that improved this manuscript. Support for this work was provided by the National Aeronautics and Space Administration through Chandra Award Number GO6-17079X issued by the Chandra X-ray Center, which is operated by the Smithsonian Astrophysical Observatory for and on behalf of the National Aeronautics Space Administration under contract NAS8-03060. This research is based on observations made with the NASA/ESA Hubble Space Telescope obtained from the Space Telescope Science Institute, which is operated by the Association of Universities for Research in Astronomy, Inc., under NASA contract NAS 5–26555. These observations are associated with program HST-GO-14356. Support for Program No. HST-GO-14356 was provided by NASA through a grant from the Space Telescope Science Institute, which is operated by the Association of Universities for Research in Astronomy, Incorporated, under NASA contract NAS5-26555. RMP and JDP acknowledge support from the National Science Foundation under grant No. 2206123. RS acknowledges support from grant number 12073029 from the National Natural Science Foundation of China (NSFC). AER acknowledges support provided by NASA through EPSCoR grant number 80NSSC20M0231. GEA is the recipient of an Australian Research Council Discovery Early Career Researcher Award (project number DE180100346) funded by the Australian Government. This research made use of Astropy,111111http://www.astropy.org a community-developed core Python package for Astronomy (Astropy Collaboration et al., 2013, 2018).
Data Availability
The data underlying this article are available in the Chandra Data Archve under ObsIDs 18059, 18060, and 18061 (https://cda.harvard.edu/chaser/), in the Barbara A. Mikulski Archive for Space Telescopes under program ID 14356 (dx.doi.org/10.17909/3bxp-zt07), and in the National Radio Astronomy Observatory Data Archive under programs 14-358 and SH0563 (data.nrao.edu).
References
- Allen et al. (2008) Allen M. G., Groves B. A., Dopita M. A., Sutherland R. S., Kewley L. J., 2008, ApJS, 178, 20
- Astropy Collaboration et al. (2013) Astropy Collaboration et al., 2013, A&A, 558, A33
- Astropy Collaboration et al. (2018) Astropy Collaboration et al., 2018, AJ, 156, 123
- Baldassare et al. (2015) Baldassare V. F., Reines A. E., Gallo E., Greene J. E., 2015, ApJ, 809, L14
- Baldassare et al. (2020) Baldassare V. F., Geha M., Greene J., 2020, ApJ, 896, 10
- Barth et al. (2004) Barth A. J., Ho L. C., Rutledge R. E., Sargent W. L. W., 2004, ApJ, 607, 90
- Bellovary et al. (2019) Bellovary J. M., Cleary C. E., Munshi F., Tremmel M., Christensen C. R., Brooks A., Quinn T. R., 2019, MNRAS, 482, 2913
- Bellovary et al. (2021) Bellovary J. M., et al., 2021, MNRAS, 505, 5129
- Berghea et al. (2020) Berghea C. T., Johnson M. C., Secrest N. J., Dudik R. P., Hennessy G. S., El-khatib A., 2020, ApJ, 896, 117
- Birchall et al. (2020) Birchall K. L., Watson M. G., Aird J., 2020, MNRAS, 492, 2268
- Blandford & Königl (1979) Blandford R. D., Königl A., 1979, ApJ, 232, 34
- Brorby et al. (2014) Brorby M., Kaaret P., Prestwich A., 2014, MNRAS, 441, 2346
- CASA Team et al. (2022) CASA Team et al., 2022, arXiv e-prints, p. arXiv:2210.02276
- Cann et al. (2021) Cann J. M., et al., 2021, ApJ, 912, L2
- Cash (1979) Cash W., 1979, ApJ, 228, 939
- Chen et al. (2017) Chen C.-T. J., et al., 2017, ApJ, 837, 48
- Chilingarian et al. (2018) Chilingarian I. V., Katkov I. Y., Zolotukhin I. Y., Grishin K. A., Beletsky Y., Boutsia K., Osip D. J., 2018, ApJ, 863, 1
- Cseh et al. (2012) Cseh D., et al., 2012, ApJ, 749, 17
- Dashyan et al. (2018) Dashyan G., Silk J., Mamon G. A., Dubois Y., Hartwig T., 2018, MNRAS, 473, 5698
- Dickey & Lockman (1990) Dickey J. M., Lockman F. J., 1990, ARA&A, 28, 215
- Dopita & Sutherland (1995) Dopita M. A., Sutherland R. S., 1995, ApJ, 455, 468
- Douna et al. (2015) Douna V. M., Pellizza L. J., Mirabel I. F., Pedrosa S. E., 2015, A&A, 579, A44
- Evans et al. (2010) Evans I. N., et al., 2010, ApJS, 189, 37
- Falcke et al. (2004) Falcke H., Körding E., Markoff S., 2004, A&A, 414, 895
- Fender et al. (2004) Fender R. P., Belloni T. M., Gallo E., 2004, MNRAS, 355, 1105
- Feng & Soria (2011) Feng H., Soria R., 2011, New Astron. Rev., 55, 166
- Filippenko & Ho (2003) Filippenko A. V., Ho L. C., 2003, ApJ, 588, L13
- Fruscione et al. (2006) Fruscione A., et al., 2006, in Society of Photo-Optical Instrumentation Engineers (SPIE) Conference Series. p. 62701V, doi:10.1117/12.671760
- Gaia Collaboration et al. (2018) Gaia Collaboration et al., 2018, A&A, 616, A1
- Gallo & Sesana (2019) Gallo E., Sesana A., 2019, ApJ, 883, L18
- Garmire et al. (2003) Garmire G. P., Bautz M. W., Ford P. G., Nousek J. A., Ricker Jr. G. R., 2003, in Truemper J. E., Tananbaum H. D., eds, Proc. SPIEVol. 4851, X-Ray and Gamma-Ray Telescopes and Instruments for Astronomy.. pp 28–44, doi:10.1117/12.461599
- Gilfanov (2004) Gilfanov M., 2004, MNRAS, 349, 146
- Greene et al. (2020) Greene J. E., Strader J., Ho L. C., 2020, ARA&A, 58, 257
- Greene et al. (2021) Greene J. E., et al., 2021, ApJ, 917, 17
- Grimm et al. (2003) Grimm H. J., Gilfanov M., Sunyaev R., 2003, MNRAS, 339, 793
- Gültekin et al. (2019) Gültekin K., King A. L., Cackett E. M., Nyland K., Miller J. M., Di Matteo T., Markoff S., Rupen M. P., 2019, ApJ, 871, 80
- Hack et al. (2013) Hack W. J., Dencheva N., Fruchter A. S., 2013, in Friedel D. N., ed., Astronomical Society of the Pacific Conference Series Vol. 475, Astronomical Data Analysis Software and Systems XXII. p. 49
- Hao et al. (2011) Hao C.-N., Kennicutt R. C., Johnson B. D., Calzetti D., Dale D. A., Moustakas J., 2011, ApJ, 741, 124
- Heger et al. (2003) Heger A., Fryer C. L., Woosley S. E., Langer N., Hartmann D. H., 2003, ApJ, 591, 288
- Ho (2008) Ho L. C., 2008, ARA&A, 46, 475
- Ho & Kim (2016) Ho L. C., Kim M., 2016, ApJ, 821, 48
- Hong et al. (2005) Hong J., van den Berg M., Schlegel E. M., Grindlay J. E., Koenig X., Laycock S., Zhao P., 2005, ApJ, 635, 907
- Houck & Denicola (2000) Houck J. C., Denicola L. A., 2000, in Manset N., Veillet C., Crabtree D., eds, Astronomical Society of the Pacific Conference Series Vol. 216, Astronomical Data Analysis Software and Systems IX. p. 591
- Inayoshi et al. (2020) Inayoshi K., Visbal E., Haiman Z., 2020, ARA&A, 58, 27
- Ito et al. (2008) Ito H., Kino M., Kawakatu N., Isobe N., Yamada S., 2008, ApJ, 685, 828
- Kaaret et al. (2017) Kaaret P., Feng H., Roberts T. P., 2017, ARA&A, 55, 303
- Kashibadze et al. (2020) Kashibadze O. G., Karachentsev I. D., Karachentseva V. E., 2020, A&A, 635, A135
- Kennicutt & Evans (2012) Kennicutt R. C., Evans N. J., 2012, ARA&A, 50, 531
- Kormendy & Ho (2013) Kormendy J., Ho L. C., 2013, ARA&A, 51, 511
- Kraft et al. (1991) Kraft R. P., Burrows D. N., Nousek J. A., 1991, ApJ, 374, 344
- Lehmer et al. (2010) Lehmer B. D., Alexander D. M., Bauer F. E., Brandt W. N., Goulding A. D., Jenkins L. P., Ptak A., Roberts T. P., 2010, ApJ, 724, 559
- Lehmer et al. (2019) Lehmer B. D., et al., 2019, ApJS, 243, 3
- Lehmer et al. (2021) Lehmer B. D., et al., 2021, ApJ, 907, 17
- Lemons et al. (2015) Lemons S. M., Reines A. E., Plotkin R. M., Gallo E., Greene J. E., 2015, ApJ, 805, 12
- Linden et al. (2010) Linden T., Kalogera V., Sepinsky J. F., Prestwich A., Zezas A., Gallagher J. S., 2010, ApJ, 725, 1984
- Long et al. (2020) Long K. S., Blair W. P., Winkler P. F., Lacey C. K., 2020, ApJ, 899, 14
- Longair (1994) Longair M. S., 1994, High energy astrophysics. Vol.2: Stars, the galaxy and the interstellar medium. Vol. 2
- Mapelli et al. (2010) Mapelli M., Ripamonti E., Zampieri L., Colpi M., Bressan A., 2010, MNRAS, 408, 234
- Martínez-Palomera et al. (2020) Martínez-Palomera J., Lira P., Bhalla-Ladd I., Förster F., Plotkin R. M., 2020, ApJ, 889, 113
- Merloni et al. (2003) Merloni A., Heinz S., di Matteo T., 2003, MNRAS, 345, 1057
- Mezcua & Domínguez Sánchez (2020) Mezcua M., Domínguez Sánchez H., 2020, ApJ, 898, L30
- Mezcua et al. (2016) Mezcua M., Civano F., Fabbiano G., Miyaji T., Marchesi S., 2016, ApJ, 817, 20
- Mezcua et al. (2018) Mezcua M., Civano F., Marchesi S., Suh H., Fabbiano G., Volonteri M., 2018, MNRAS, 478, 2576
- Mezcua et al. (2019) Mezcua M., Suh H., Civano F., 2019, MNRAS, 488, 685
- Miller et al. (2015) Miller B. P., Gallo E., Greene J. E., Kelly B. C., Treu T., Woo J.-H., Baldassare V., 2015, ApJ, 799, 98
- Mineo et al. (2014) Mineo S., Gilfanov M., Lehmer B. D., Morrison G. E., Sunyaev R., 2014, MNRAS, 437, 1698
- Mirabel et al. (2011) Mirabel I. F., Dijkstra M., Laurent P., Loeb A., Pritchard J. R., 2011, A&A, 528, A149
- Moon et al. (2011) Moon D.-S., Harrison F. A., Cenko S. B., Shariff J. A., 2011, ApJ, 731, L32
- Moran et al. (2014) Moran E. C., Shahinyan K., Sugarman H. R., Vélez D. O., Eracleous M., 2014, AJ, 148, 136
- Moretti et al. (2003) Moretti A., Campana S., Lazzati D., Tagliaferri G., 2003, ApJ, 588, 696
- Murphy et al. (2011) Murphy E. J., et al., 2011, ApJ, 737, 67
- Nguyen et al. (2019) Nguyen D. D., et al., 2019, ApJ, 872, 104
- Orienti & Prieto (2010) Orienti M., Prieto M. A., 2010, MNRAS, 401, 2599
- Pakull & Angebault (1986) Pakull M. W., Angebault L. P., 1986, Nature, 322, 511
- Pakull et al. (2010) Pakull M. W., Soria R., Motch C., 2010, Nature, 466, 209
- Pardo et al. (2016) Pardo K., et al., 2016, ApJ, 831, 203
- Plotkin et al. (2012) Plotkin R. M., Markoff S., Kelly B. C., Körding E., Anderson S. F., 2012, MNRAS, 419, 267
- Ponnada et al. (2020) Ponnada S., Brorby M., Kaaret P., 2020, MNRAS, 491, 3606
- Prestwich et al. (2013) Prestwich A. H., Tsantaki M., Zezas A., Jackson F., Roberts T. P., Foltz R., Linden T., Kalogera V., 2013, ApJ, 769, 92
- Reines & Volonteri (2015) Reines A. E., Volonteri M., 2015, ApJ, 813, 82
- Reines et al. (2011) Reines A. E., Sivakoff G. R., Johnson K. E., Brogan C. L., 2011, Nature, 470, 66
- Reines et al. (2013) Reines A. E., Greene J. E., Geha M., 2013, ApJ, 775, 116
- Reines et al. (2020) Reines A. E., Condon J. J., Darling J., Greene J. E., 2020, ApJ, 888, 36
- Ricarte & Natarajan (2018) Ricarte A., Natarajan P., 2018, MNRAS, 481, 3278
- Richards et al. (2006) Richards G. T., et al., 2006, AJ, 131, 2766
- Roberts & Colbert (2003) Roberts T. P., Colbert E. J. M., 2003, MNRAS, 341, L49
- Rosen et al. (2016) Rosen S. R., et al., 2016, A&A, 590, A1
- Ross et al. (2013) Ross N. P., et al., 2013, ApJ, 773, 14
- Sargent et al. (2022) Sargent A. J., Johnson M. C., Reines A. E., Secrest N. J., van der Horst A. J., Cigan P. J., Darling J., Greene J. E., 2022, ApJ, 933, 160
- Sartori et al. (2015) Sartori L. F., Schawinski K., Treister E., Trakhtenbrot B., Koss M., Shirazi M., Oh K., 2015, MNRAS, 454, 3722
- Schaerer et al. (2019) Schaerer D., Fragos T., Izotov Y. I., 2019, A&A, 622, L10
- Schramm et al. (2013) Schramm M., et al., 2013, ApJ, 773, 150
- Schutte & Reines (2022) Schutte Z., Reines A. E., 2022, Nature, 601, 329
- Senchyna et al. (2020) Senchyna P., Stark D. P., Mirocha J., Reines A. E., Charlot S., Jones T., Mulchaey J. S., 2020, MNRAS, 494, 941
- Shirazi & Brinchmann (2012) Shirazi M., Brinchmann J., 2012, MNRAS, 421, 1043
- Simmonds et al. (2021) Simmonds C., Schaerer D., Verhamme A., 2021, A&A, 656, A127
- Soria et al. (2010) Soria R., Pakull M. W., Broderick J. W., Corbel S., Motch C., 2010, MNRAS, 409, 541
- Soria et al. (2021) Soria R., Pakull M. W., Motch C., Miller-Jones J. C. A., Schwope A. D., Urquhart R. T., Ryan M. S., 2021, MNRAS, 501, 1644
- Trebitsch et al. (2018) Trebitsch M., Volonteri M., Dubois Y., Madau P., 2018, MNRAS, 478, 5607
- Urquhart et al. (2019) Urquhart R., et al., 2019, MNRAS, 482, 2389
- Vanden Berk et al. (2001) Vanden Berk D. E., et al., 2001, AJ, 122, 549
- Volonteri (2010) Volonteri M., 2010, A&ARv, 18, 279
- Volonteri et al. (2021) Volonteri M., Habouzit M., Colpi M., 2021, Nature Reviews Physics, 3, 732
- Weaver et al. (1977) Weaver R., McCray R., Castor J., Shapiro P., Moore R., 1977, ApJ, 218, 377
- Woo et al. (2019) Woo J.-H., Cho H., Gallo E., Hodges-Kluck E., Le H. A. N., Shin J., Son D., Horst J. C., 2019, Nature Astronomy, 3, 755
- Yang et al. (2015) Yang Q.-X., Xie F.-G., Yuan F., Zdziarski A. A., Gierliński M., Ho L. C., Yu Z., 2015, MNRAS, 447, 1692
- York et al. (2000) York D. G., et al., 2000, AJ, 120, 1579
- Younes et al. (2011) Younes G., Porquet D., Sabra B., Reeves J. N., 2011, A&A, 530, A149
- Zhao et al. (2013) Zhao Y., Gao Y., Gu Q., 2013, ApJ, 764, 44
- Zibetti et al. (2009) Zibetti S., Charlot S., Rix H.-W., 2009, MNRAS, 400, 1181
- de Zotti et al. (2010) de Zotti G., Massardi M., Negrello M., Wall J., 2010, A&ARv, 18, 1