citnum
Modal decomposition of nonlinear interactions in wall turbulence
Abstract
Coherent structures are found in many different turbulent flows and are known to drive self-sustaining processes in wall turbulence. Identifying the triadic interactions which generate coherent structures can provide insights beyond what is possible in the framework of linearized models. There are infinite possible interactions that may generate a given structure. Thus a method to systematically study those, ranking them in terms of their contribution to the structure of interest, is essential. We here use the resolvent-based extended spectral proper orthogonal decomposition (RESPOD) approach (Karban, U. et al. 2022 Self-similar mechanisms in wall turbulence studied using resolvent analysis. Journal of Fluid Mechanics 969, A36) to rank the triadic interactions which give rise to wall-attached structures in a minimal Couette flow at Reynolds number 400. Our analysis identifies that six triadic interactions dominate the most-energetic wall-attached structure, revealing the capability of the methodology to identify and rank nonlinear interactions responsible for a given coherent structure. The approach can be used to analyse the energy exchange in turbulent flows and may guide the construction of reduced-order models based on the interplay between different flow modes.
keywords:
1 Introduction
Turbulent flows contain coherent structures that span large spatial and temporal scales. These structures are responsible for many important phenomena observed in different flows, ranging from sustaining the near-wall cycle (Hamilton et al., 1995) in wall-bounded flows to noise generation in jets (Jordan & Colonius, 2013; Cavalieri et al., 2019). It has been shown that the linear mechanisms play a major role in the generation of coherent structures (Ellingsen & Palm, 1975; Landahl, 1980; Trefethen et al., 1993; Hwang & Cossu, 2010b; Brandt, 2014; Schmidt et al., 2018; Pickering et al., 2020). A now popular approach to investigate these mechanisms is the resolvent analysis, where the Navier-Stokes (N-S) equation are arranged in input-output form in the frequency domain (Farrell & Ioannou, 1993; Jovanović & Bamieh, 2005; McKeon & Sharma, 2010; Hwang & Cossu, 2010a; Sipp & Marquet, 2012; Towne et al., 2018; Lesshafft et al., 2019). Although resolvent analysis provides a dynamical framework, in most cases, it provides a qualitative understanding of the coherent structures and the associated mechanisms. It has been shown for certain flows that modelling the nonlinear fluctuations, i.e., the color of the turbulence, is essential for better prediction of these structures (Zare et al., 2017; Martini et al., 2020; Amaral et al., 2021; Morra et al., 2021; Nogueira et al., 2021; Karban et al., 2022), particularly when developing flow models that can quantitatively predict coherent structures.
One way to tackle the nonlinearity is to use eddy viscosity. It has been shown for many flows that adopting an eddy viscosity model while constructing the resolvent operator improves the prediction of coherent structures (Hwang & Cossu, 2010b; Morra et al., 2019, 2021; Pickering et al., 2021; Kuhn et al., 2021). One can consider the use of eddy viscosity within resolvent framework as the following: it is known that the resolvent operator yields the exact coherent structures observed in the flow if the forcing is white. The actual forcing is not white, and inclusion of an eddy viscosity in the linear operator allows to model at least part of the forcing colour. Given that the eddy viscosity models incoherent disturbances (cf. Hussain & Reynolds, 1970), one may conjecture that it provides a good model of the effect of the incoherent disturbances on coherent structures.
An alternative approach to model the nonlinearity is to use quasi-linear approximation (Malkus, 1956), where the N-S equations are split into somehow-averaged quantities and the remaining fluctuating terms. The equations for the averaged quantities are then solved directly taking into account the coupling with the fluctuation equations, while the fluctuation equations are linearised by neglecting the nonlinear fluctuating terms (Malkus, 1956) or replacing them with a linear model (Farrell & Ioannou, 2012; Thomas et al., 2014; Constantinou et al., 2014; Bretheim et al., 2015; Farrell et al., 2017; Bretheim et al., 2018).
All these approaches try modelling the nonlinear terms as a whole rather than tracing separately the triadic interactions that add up to form them. When decomposing the flow into Fourier modes, the quadratic nonlinearity of the incompressible N-S equations become triadic interactions between these modes. For a high-Reynolds-number turbulent flow, the vast number of possible interactions forming a given nonlinear term prohibits their direct modelling. There are some studies which analytically investigate triadic interactions in simple cases such as homogeneous turbulence (Kraichnan, 1973; Waleffe, 1992; Moffatt, 2014). Cheung & Zaki (2014) derived the spectral N-S equations. Investigating the analytical properties of triadic interactions in homogeneous, isotropic turbulence, they showed that the famous -5/3 decay is embedded in the N-S equations. In a recent study, Cho et al. (2018) employed the spectral turbulent kinetic energy equation to trace the energy transfer between different scales in a turbulent channel via triadic interactions. Jin et al. (2021) adopted a similar approach to study the energy transfer in cylinder wake.
Triadic interactions in turbulent flows are also investigated within the resolvent framework. The interactions between the response modes of the resolvent operator and their effect of the self-similar nature of these modes was first discussed in Sharma et al. (2017). Rosenberg et al. (2019) showed that by including the effect of triadic interactions among the dominant response modes of the resolvent operator, prediction of coherent structures can be significantly improved in oscillatory flows. This approach was followed by Symon et al. (2019) where they studied flow over airfoils, and then by Symon et al. (2021), where they investigated the energy transfer in some minimal flow units. A formalism was provided by Padovan et al. (2020) to extend the resolvent framework to oscillatory flows, taking into account the cross-frequency interactions. Rigas et al. (2021) used the resolvent framework together with limited triadic interactions to investigate boundary layer transition. Bae et al. (2021) investigated critical nonlinear mechanisms in Couette flow, again using resolvent framework, by filtering the contribution of the dominant forcing mode to response generation.
In this study, we investigate dominant nonlinear mechanisms in wall-bounded turbulence. The complexity of all possible triadic interactions in a turbulent flow can be reduced by focusing on a certain quantity and eliminating all the non-relevant interactions. We use the resolvent-based extended spectral proper orthogonal decomposition (RESPOD) (Towne et al., 2015; Karban et al., 2022) for this purpose. RESPOD is used to rank the triadic interactions in terms of their correlation and/or their contribution to a given observable. The method is implemented using a direct numerical simulation (DNS) of minimal Couette flow with Reynolds number 400, where the spanwise wall shear is considered the target observable. In similar minimal channel configurations, Bae et al. (2021) investigated the triadic interactions contributing to the mode, where and are streamwise and spanwise wavenumbers, respectively, and is the domain size in -direction. We investigate here the triadic interactions systematically extracted using RESPOD for the same mode. By doing so, we present an approach to investigate nonlinear interactions in numerical datasets, where the effect of each triad on the observable of interest may be studied separately using the resolvent operator. This provides a quantitative analysis of the contribution of the various triads at play.
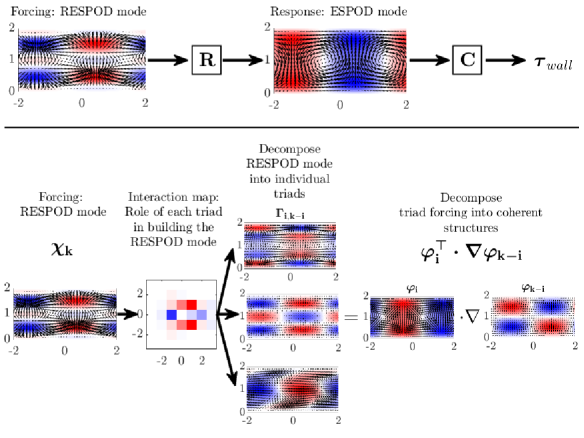
In this approach we wish to move a step further in the analysis of turbulence using the resolvent operator. With numerical datasets, it is possible to recover forcings and responses and relate them through the resolvent operator, as discussed above. The set of tools we wish to develop here aim at a further exploration of the forcing, which is first split into constituent triads, whose role in exciting coherent structures may be quantified using the resolvent operator. Next, once a particular triad is isolated and recognised as dynamically relevant, we wish to extract the individual structures in the flow that form each element of the triad; it is also our objective to propose a modal analysis for that task. A schematic depicting the flow chart of the analysis is presented in figure 1.
The flow configuration chosen here is minimal Couette flow due to its simplicity, leading to a lower number of non-linear interactions and a few dominant coherent structures, which simplifies the task. The available knowledge on the dynamics of this flow allows us to demonstrate that the tool we propose does indeed identifies the dominant flow interactions. The methods are general and may be employed in other flows of interest. With the approaches developed here we move beyond the analysis capabilities given by the resolvent operator, by analysing the non-linear terms at play, which are unquestionably relevant in turbulence dynamics.
The remainder of the paper is structured as follows: the mathematical framework to extract triadic interactions associated with a measured quantity is explained in §2. The details about the DNS database of the minimal Couette flow are provided in §3. The results of identifying the relevant triadic interactions and the energy transfer via these interactions in the minimal Couette flow are discussed in §4. An modelling approach to predict the relevant forcing using response structures is proposed in §5. Finally, some concluding remarks are provided in §6.
2 Extracting nonlinear interactions using RESPOD
We consider the incompressible Navier-Stokes (N-S) equations in Cartesian coordinates as,
| (1) |
where is the state vector, denotes the nonlinear N-S operator for incompressible flows and the matrix is zero for the continuity equation and identity matrix for the remaining equations. Discretisation in space and linearisation around the mean, , yields
| (2) |
where is the linear operator obtained from the Jacobian of and denotes all the remaining nonlinear terms, interpreted as a forcing term in the momentum equations; imposes zero forcing at the continuity equation. Full expressions for the operators are given in Nogueira et al. (2021). We focus on parallel flow, i.e., a flow that is homogeneous in two directions, for instance, in and , with the mean flow varying only in . We can modify (2) to cast it in the resolvent form by applying Fourier transforms in all homogeneous dimensions and rearranging as,
| (3) |
where and are the streamwise and spanwise wavenumbers, respectively, and is the angular frequency, the hat indicates a Fourier transformed quantity and is the resolvent operator. For brevity, we drop the notation showing dependence on wavenumber, wall-normal coordinate and frequency in what follows.
One can restrict and/or transform the response to a given set of observables , using a measurement matrix, as,
| (4) |
which yields
| (5) |
where is called the modified resolvent operator.
For the incompressible N-S equations, the forcing term in (2) is given as , where and denote dot product and transpose, respectively, and the overbar denotes averaging in time and homogeneous directions and . The forcing in the wavenumber-frequency space, , is then obtained via a convolution,
| (6) |
where , and denote wavenumber-frequency combinations, and summation over implies a nested summation over , and . Here, we consider that is discretised. Note that (6) is valid assuming that the triplet contains at least one non-zero element, such that the averaged term in has no contribution.
The RESPOD method, adapted from extended proper orthogonal decomposition (Borée, 2003; Hoarau et al., 2006), finds, for a given observable, all structures in a ‘target’ event that are correlated to the SPOD modes of the observable. Here we choose the target event to be the nonlinear interactions, which give rise to the forcing terms in the resolvent framework, as in Towne et al. (2015) and Karban et al. (2022). The goal is to map the triadic interactions underpinning the dominant coherent structures of the flow.
The SPOD modes of an observable, , can be estimated using the ensemble matrix of realisations, through the eigendecomposition,
| (7) |
and the SPOD modes are obtained from as,
| (8) |
where denotes the ensemble matrix for different realisations of with being the total number of realisations, and are SPOD modes and their associated eigenvalues, respectively (see Towne et al. (2018)), and is a positive-definite matrix of quadrature gains along , which is discretised. The SPOD modes in the columns of are the optimal orthonormal basis for the realisations of the observable .
In Karban et al. (2022), it was shown that the coefficient matrix can be used to extract the part in the forcing that is correlated with the observed SPOD mode as
| (9) |
where, is the ensemble matrix of . The RESPOD forcing mode satisfies
| (10) |
i.e., the RESPOD forcing mode excites precisely the SPOD mode via the resolvent operator. As discussed in Karban et al. (2022), the RESPOD mode includes the part of the forcing that is correlated to the SPOD mode of interest. This comprises a “silent” part , which generates no response () but is nonetheless present in the dataset and correlated to the SPOD mode.
Substituting into (9) the expansion in (6), which shows the triadic interactions summing up to yield the forcing , one can compute the triadic interactions correlated with the observable as
| (11) |
where denotes the ensemble matrix of . Defining
| (12) |
the correlated forcing can be decomposed as,
| (13) |
We define the energy as,
| (14) |
where the superscript indicates Hermitian transpose, and denotes the expectation operator. In what follows, corresponds to time-averaging for time-dependent structures, and to ensemble averaging for Fourier realisations in the frequency space. The energy of , denoted by , for all shows the correlation map of the nonlinear interactions related to the observed SPOD mode, . One can instead investigate , where , which provides the contribution of a triadic interaction to a given SPOD mode of the measured state, as suggested by (10) and (13). By removing or including terms in the sum in equation (13), one is able to inspect the contributions of each triad to the observable.
3 Database of the minimal Couette flow
The use of RESPOD for detection of ‘important’ nonlinear interactions associated with a specific measurement is tested on a minimal Couette flow (Hamilton et al., 1995), similar to that investigated by Nogueira et al. (2021). The simulations are performed using the ‘ChannelFlow’ code, a pseudo-spectral incompressible flow solver using a Fourier-Chebyshev discretisation in the wall-parallel and wall-normal directions, respectively (see www.channelflow.ch for details). The dimensions of the minimal box are , where the subscripts , and denote the streamwise, wall-normal and spanwise directions, and is the channel half-height. These are the minimal dimensions to sustain turbulence in Couette flow at low Reynolds number, as studied by Hamilton et al. (1995). The domain was discretised as with a dealiasing factor of 3/2 in the wall-parallel directions. The channel walls move with wall velocity, yielding a Reynolds number, based on and , corresponding to a friction Reynolds number, . Once the initial transients disappeared, the flow data was stored for 7000 convective units with a sampling rate, . Temporal data is transformed into frequency space using blocks of 2048 time steps with 50% overlapping and using a second-order exponential windowing function given in Martini et al. (2019). While computing the forcing data, the correction due to using windowing functions is implemented as described in Martini et al. (2019) and Nogueira et al. (2021). We verified that the forcing acting on the resolvent operator accurately yields the response, however, the comparison is not shown here for brevity.
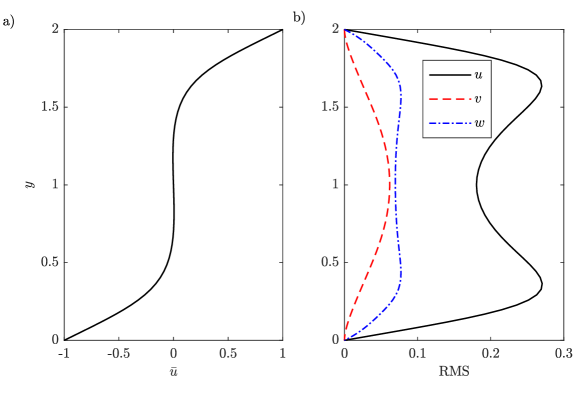
Figure 2 presents the profiles for the mean and the root-mean-square (RMS) of the velocity components, , and in the streamwise, wall-normal and spanwise directions, respectively, along the wall-normal direction, . We see that the mean flow deviates from the laminar solution given by due to nonlinear interactions between turbulent fluctuations. The RMS plots indicate that the fluctuations in peak around and . A similar but smaller double-peak structure is seen in the RMS of with the peaks occurring at the same wall-normal positions. The RMS of peaks around the centre at an amplitude slightly lower than that of .
We choose wall shear fluctuations in the spanwise direction, at both upper and lower walls as our observable. Spanwise wall shear was used to extract self-similar wall-attached structures in a turbulent channel in Karban et al. (2022). We use it to have a low-rank representation of the flow associated with this quantity in this study. Here and in what follows, we use the term ‘wall-attached’ to define quantities that are correlated with the wall-shear.
For simpler notation, wavenumbers will be presented in integers defined as and . Similarly, mode frequencies will be presented in integer bins denoted by , ranging in , where is the number of temporal points used for taking the Fourier transform (FT) and is the sampling rate of the database.
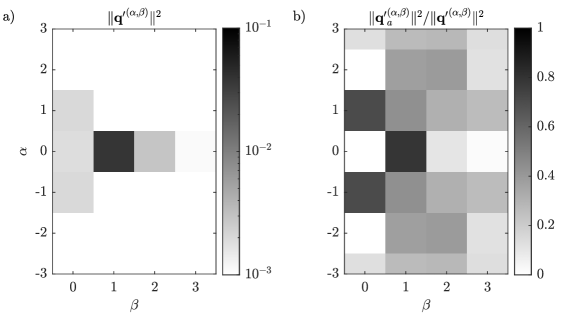
Minimal Couette flow is known to be dominated most of the time by rolls and streaks spanning the entire computational domain, corresponding to . Occasionally wavy disturbances with appear after streak instability and breakdown, and subsequently non-linear interactions among such “waves” lead to the formation of new rolls, restarting the process (Hamilton et al., 1995; Hall & Sherwin, 2010). Figure 3 shows the time-averaged energy contained in each wavenumber pair together with the ratio of the time-averaged energy of the wall-attached structures to the total energy at each wavenumber pair. We see that the mode pair , related to streaks and rolls, contains most of the fluctuation energy (75%). In contrast, the modes , related to waves, and , which we will refer to as roll-streak harmonic, contain slightly less than 5% of the total energy, and all the other mode pairs have less than 2%. The energy of the wall-attached part of the state, denoted by , of the roll-streak mode (0,1) is around 80% of its total energy. Therefore, the coherent structures correlated with the spanwise wall-shear can constitute a good low-rank representative of the flow at this wavenumber pair. A similar case is observed for the wave modes while for the mode (0,2), the energy ratio of the wall-attached part is around 15%.
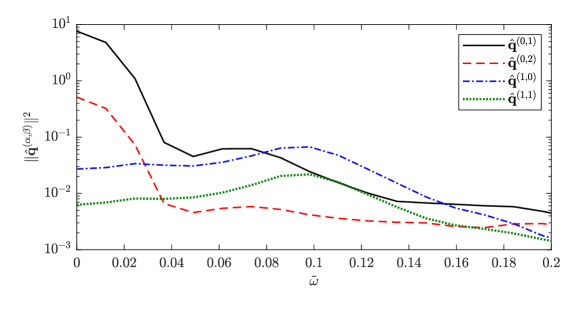
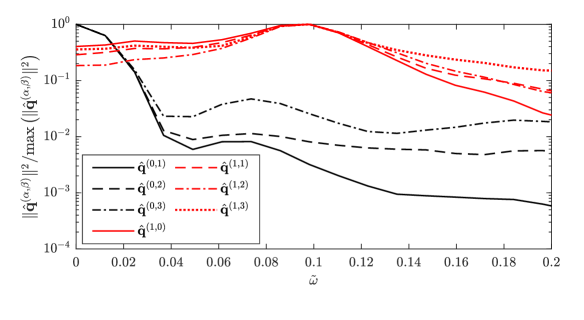
Figure 4 shows the power spectral density (PSD), integrated along the wall-normal direction, of the velocity field at wavenumber pairs , (0,2), (1,0) and (1,1). Although the oblique-wave mode is energy-wise insignificant, it plays a critical role for transfer of energy to mode, as will be shown later, and hence is included here. We see that the streamwise-constant modes peak around the zero frequency, which is expected due to their quasi-steady nature, while the wave modes (1,0) and (1,1) have their peak around (), leading to a phase speed of in wall units (negative values arise if frequency or wavenumber is negative) corresponding to of wall velocity. The shape of the spectra is observed to be similar for the modes that have the same streamwise wavenumber. This trend can be more clearly seen in figure 5, where the integrated PSDs normalised with respect to the peak value are plotted for different modes. We see two different families of PSD distributions for the two streamwise wavenumbers, and , respectively.

We now focus on the most energetic mode at its peak-energy frequency, . The wall-attached forcing and response modes, and , respectively, are shown in figure 6. The response field, which is the velocity field correlated to the wall-shear, consists of streaks and rolls. Given that the upper and lower walls have positive and negative mean velocities, respectively, the phase relation between streaks and rolls is reminiscent of the lift-up mechanism (Brandt, 2014). This is further supported regarding the associated forcing mode. At the spanwise positions where the streamwise vortices are located, the forcing is mainly located near the walls aligned with the -direction, causing a moment to generate the streamwise vortices. These vortices then generate streaks by carrying the high- and low-velocity structures near the upper and lower walls, respectively, towards the channel centre. Note that the forcing component in the streamwise direction is in opposite phase to the streaks seen in the response. This indicates that the streaks are generated by the lift-up mechanism despite the counteracting effect of the streamwise forcing, as previously reported by Nogueira et al. (2021). The response generation at this triplet can therefore be considered suboptimal.
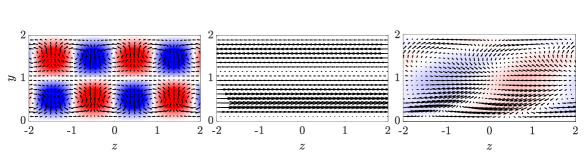
We also plot the wall-attached response fields for the modes , (1,0,8) and (1,1,8), respectively, in figure 7. Each mode is shown at its peak frequency (see figure 4). The response field contains streaks and rolls for the mode (0,2,0) as in the roll-streak mode (0,1,0), but with doubled periodicity, and thus, is called roll-streak harmonic. The mode (1,0,8) is dominated by its spanwise component, leading to a wave mode. Finally, the response field for the mode (1,1,8) contains some oblique wave structures tilted with the mean flow.
4 Nonlinear interactions in the minimal Couette flow
4.1 Extracting important triadic interactions
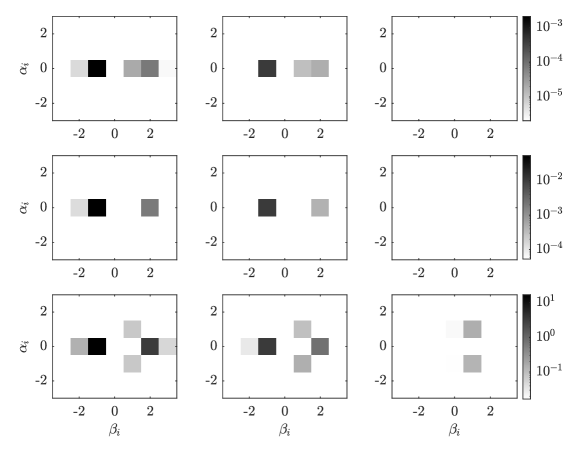
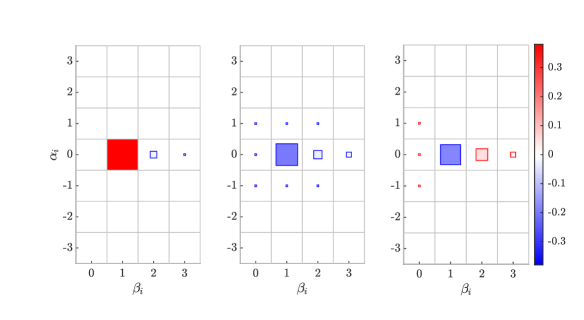
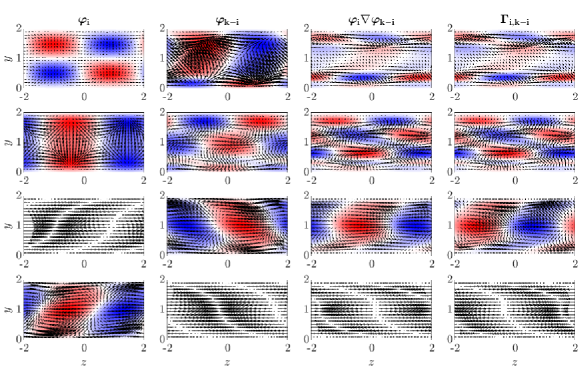
The maps showing the energy of the nonlinear interactions contributing to the dominant mode, are shown in figure 8. Different columns compares the maps , and , which correspond respectively to energies of the direct triadic interactions, the interactions correlated with the wall shear, and the response to the latter obtained by the resolvent operator. Note that only the triplet is shown, where for each , there exists a such that the nonlinear interaction between and yields . Starting with , we see that the interaction between the roll-streak mode, and its complementary, roll-streak harmonic , is dominant in all three maps, indicating that the interaction is large in amplitude, highly correlated to the dominant mode, and generates the response with the largest amplitude. We also observe large amplitude for the interaction , which involves the same structures with the previous one, but with the gradient operator acting on the roll-streak mode . The interactions involving wave modes , although not yielding a large forcing component (low amplitudes at the first two rows of figure 8), are seen to be present in the response map (third row of figure 8), implying that these modes efficiently drive the observable. For non-zero frequencies and 8, we observe that the contribution of streamwise-constant modes with decreases with increasing , whereas wave modes with drive an increasingly stronger response for higher frequencies, which may be attributed to the different frequency content of streamwise-constant and wavy modes, explored in figures 4 and 5.
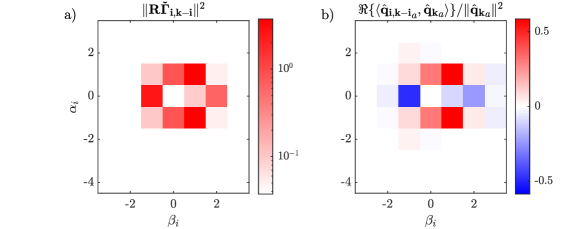
To investigate the overall contribution to the dominant mode via a given wavenumber pair and its complementary, we define the forcing mode, , obtained by summing over the frequency index, , i.e., adding the nonlinear interactions between all different frequency combinations, and compute its response via . Similar to the energy maps shown in figure 8, the map of is plotted in figure 9-a, which shows that the response generation is dominated by six interactions: two streamwise-constant, which are involving the roll-streak and roll-streak harmonic modes, and four streamwise-periodic over , which are involving wave modes. Note that here and in what follows, we use curly brackets for short hand notation of multiple modes. For instance, denotes the modes and .
Besides the magnitude of the response to a given triadic interaction, it is important to evaluate how it contributes to the overall response. As shown in Nogueira et al. (2021) and Morra et al. (2021), different forcing components can interfere destructively. In what follows we propose a measure to identify which interactions are constructive, amplifying a given mode, or destructive, saturating or damping it. As a measure of constructiveness/destructiveness of a given interaction, we calculate the inner product between the response to a single wall-attached interaction, , and the wall-attached velocity field, ,
| (15) |
An interaction map is obtained by calculating (15) for each wavenumber pair and normalising the result with , which shows a normalised projection, and thus the constructive/destructive role of each triadic interaction in generating the wall-attached response. The resulting map is shown in figure 9-b. Note that the interaction map should sum up to 1, i.e., the sum of all destructive and constructive interactions lead to the mode observed in the system. The analysis reveals that the contributions from the interactions decrease the response energy, implying a destructive interference between these interactions and the remaining ones. The interactions involving wave modes , on the other hand, cause the response energy to increase, implying a constructive effect.
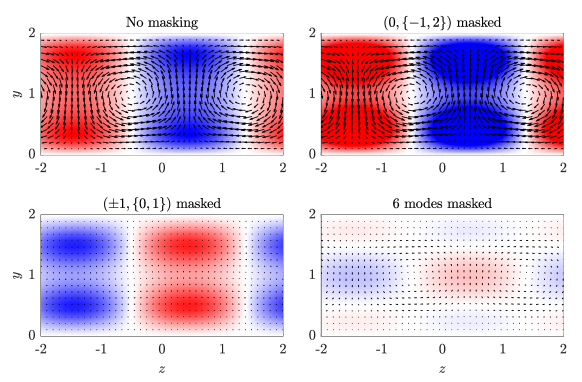
The effect of these interactions on the response field is shown in figure 10 by masking these interactions, i.e., subtracting the contributions from the designated interactions from the overall response computed by the resolvent. We see that masking the interactions mainly affects the streaks causing an increase in their amplitude, while the roll remains nearly unchanged. Masking the interactions almost completely eliminates the streamwise vortices, which also causes the lift-up effect to be eliminated. This results in streaks with smaller amplitude and reversed phase. This result is consistent with models of self-sustaining process in wall turbulence, where rolls are excited by non-linear interactions involving waves with non-zero (Hamilton et al., 1995; Hall & Sherwin, 2010). Remember that in the RESPOD forcing mode shown in figure 6, the streamwise component counteracts the lift-up mechanism forced by the spanwise components. These results, when combined, imply that the streamwise and spanwise components in the RESPOD forcing mode, , are mainly constructed by the nonlinear interaction groups and , respectively. Masking causes the lift-up mechanism, which is an efficient means to generate streaks via streamwise vortices, to disappear. The remaining streamwise component in is mainly constructed by and generates streaks with negative phase, reducing the amplitude of the streaks generated by the lift-up mechanism. This elucidates the destructive interference among components observed by Nogueira et al. (2021). The present results show that such destructive interference occurs among different triadic interactions. Masking all six modes almost entirely eliminates the response as seen in figure 10.
4.2 Energy transfer via triadic interactions
The interaction map shown in figure 9-b can also be interpreted in terms of energy exchange between different modes via nonlinear interactions. Symon et al. (2021) investigated, by employing the spectral form of the transport equation of turbulent kinetic energy (TKE), the overall relation between production, dissipation and the transfer of energy for individual wavenumber pairs in parallel, stationary turbulent flows. The spectral TKE equation is given, using indicial notation for the last two terms for convenience, as
| (16) |
where indicates the real part, the hat in this equation denotes, by abuse of notation, Fourier transformed quantities in the stremwise and spanwise directions, is the spectral TKE of a given wavenumber pair, the superscript * denotes complex conjugate, and denote that the vector indices, is the component of the forcing vector (see Symon et al. (2021) for derivation of (16)). Here, we assume that the Couette flow is stationary in the time interval we investigate, which renders
| (17) |
The three terms on the right-hand side of (16) correspond to the production, dissipation and nonlinear transfer of the turbulent kinetic energy, respectively, which, thanks to (17), sum up to zero for a given wavenumber pair. One can write (16) in the frequency domain by Fourier transforming in the time domain each term on the right-hand side and Welch averaging (Jin et al., 2021), which still satisfies the energy balance for any wavenumber-frequency triplet as,
| (18) |
The contributions of production, dissipation and nonlinear transfer to the energy balance for different wavenumber pairs at zero frequency are illustrated in figure 11. We see that the roll-streak mode (0,1) draws the most energy from the mean flow to produce TKE, and is the only mode to transfer this energy to other modes via nonlinear transfer. All the modes are seen to lose energy via dissipation as expected. Note that the energy balance map is symmetric in the axis, which is not shown for better readability of the plot.
Cho et al. (2018) computed the nonlinear energy transfer via each triadic interaction by expanding the convolution in the third term on the right-hand side of (16) as in (6). Here, we do a similar analysis for the nonlinear transfer term in the frequency-domain energy balance equation given in (18). The resulting energy transfer map for (0,1,0) mode is shown in figure 12-a, where blue and red colors indicate losing and gaining energy, respectively, via the corresponding interaction. We see that roll-streak mode (0,1,0) mostly transfer energy via the interactions and with being the dominant one. It is also seen to gain energy via a number of interactions but the incoming energy rate is negligible compared to outgoing rate, and hence, is not discussed here. For the triadic interaction , we calculated that the transfer from the interaction is -0.06, which constitutes half of the transfer from all the frequencies. Since the flow is symmetric in the spanwise direction, the modes and are complex conjugates of each other. Thus, we can say that the mode (0,1,0) is transferring energy to roll-streak harmonic mode (0,2,0) via a triadic interaction involving its conjugate mode, making the mode the second-most energetic with a peak at zero frequency (see figure 4). This sort of transfer can be associated to the energy cascade in turbulence from large to small scales observed in high- flows.
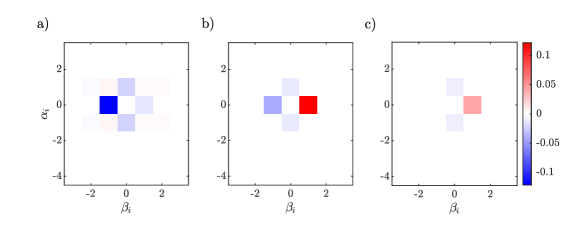
Combining the results obtained inspecting the energy transfer and the findings of the previous subsection indicate that the mode (0,1,0) gains almost all of its energy from the mean flow via the lift-up mechanism and transfers some of this energy via nonlinear transfer to streamwise-constant modes as the onset of energy cascade. This nonlinear transfer appears as a streak with opposite phase (see bottom left plot in figure 10). This will be further discussed below. The response seen in (0,1,0) mode is a result of the destructive relation between the lift-up mechanism, excited by the wave modes, and the nonlinear transfer associated to roll-streak modes.
We have seen that (0,2,0) mode receives its energy via a nonlinear transfer mechanism according to the energy budget plot given in figure 11. The nonlinear transfer via each triadic interaction contributing to (0,2,0) mode is shown in figure 12-b. The map reveals that (0,2,0) mode receives energy via the interactions at a rate similar to the energy transfer in (0,1,0) mode via the interactions . Some of the energy that (0,2,0) mode receives is transferred to the next harmonic via the interaction . Looking at the nonlinear transfer map for (0,3,0) mode in figure 12-c, we see that energy is transferred via the interaction , once again, at a rate similar to the transfer from (0,2,0) shown in figure 12-b. One can trace the energy cascade for the negative modes in the same way, which yields the same transfer maps mirrored in the and axes. This suggests that the modes , once extracting energy from the mean and transferring it to harmonics , plays a role to transfer energy via the triadic interactions associated to higher , i.e., they provide a medium for the nonlinear transfer to higher modes without losing noticeable energy.
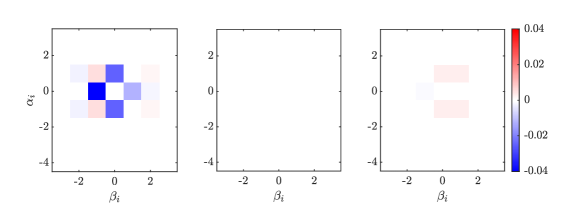
One can further analyse the nonlinear energy transfer by dissecting the contributions to the nonlinear energy transfer from -, - and -components, i.e., the terms , and . In figure 13, we show the map of nonlinear energy transfer to the roll-streak mode (0,1,0) via each spatial component. The three maps shown in this figure sum up to yield the nonlinear transfer map shown in figure 12-a. The energy in (0,1,0) mode is transferred to other modes mostly via the -component, i.e., the streaks. This is aligned with the results shown in 10, where it was shown that the response generated by the interactions responsible for nonlinear transfer yielded streaky structures. The roll-streak mode is seen to receive energy via the spanwise component of the triadic interactions involving wave modes , which can be associated to the amplification by the lift-up mechanism, consistent with the analysis done with 10. This positive energy transfer is nonetheless lower than the loss of energy via the streaks. No significant energy transfer occurs via the wall-normal component.
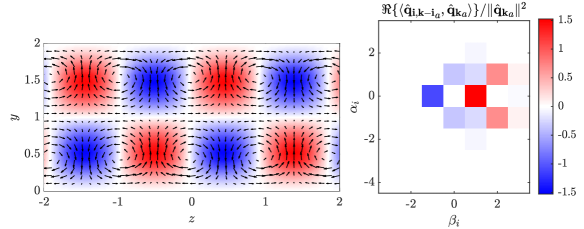
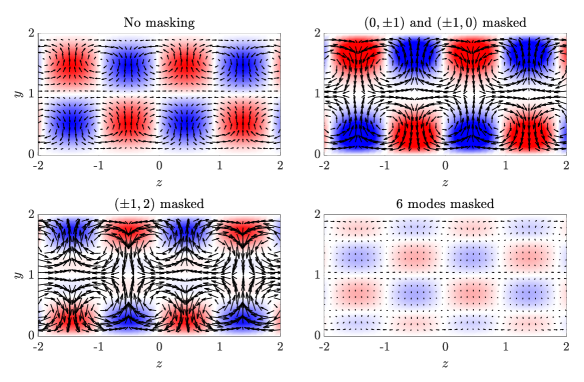
We now investigate whether a similar destructive relation takes place between the nonlinear transfer and the lift-up mechanism for roll-streak harmonic mode (0,2,0) as in roll-streak mode (0,1,0). In figure 14, we show the same interaction map given in figure 9-b for the mode together with the reconstruction of the mode in the - plane. Similar to the (0,1,0) mode, we see streamwise vortices and streaks in (0,2,0) with a halved period in the spanwise direction. The rolls and the streaks are in opposite phase compared to the (0,1,0), which implies that they are not directly associated to the lift-up mechanism. The interaction map indicates strong contribution to response generation from the interactions associated with the nonlinear energy transfer, i.e., the ones that appear in figure 12-b as well. Besides these interactions, we see some positive contributions from the interactions . To see the effect of these interactions on the response, we mask these interactions and observe the change in the response in figure 15. Masking the interactions associated to nonlinear transfer, we obtain a response field reminiscent of the lift-up mechanism. This partial response is due to the interactions . Masking these interactions, on the other hand, yields a response field with inverted streaks and vortices. Similar to the case of (0,1,0) mode, there exists a destructive interference between the nonlinear energy transfer and the lift-up mechanism. Masking both groups of interactions causes the response to be almost zero, indicating that these six interactions are the active ones for response generation.
5 Modelling coherent structures in triadic interactions
RESPOD provides the forcing mode that drives a desired SPOD mode of a given observable, and the individual triadic interactions that sum up to yield this forcing mode. However, a RESPOD forcing mode for a triadic interaction,
| (19) |
does not provide the modes associated to and that generate the observable-correlated forcing component . Predicting the structures that form the forcing modes that drive the most energetic structures in the observable is important, as it shows which structures are actually involved in nonlinear interactions, and may also help designing reduced-order models for turbulent flows. Note that these response modes are not unique as it is always possible to multiply one of them with a dummy vector, , and and the other by the inverse for elementwise multiplication, , respectively, which eventually yields the same forcing mode assuming that is finite. Among potential candidates to yield the forcing mode given in (19) are the optimal SPOD modes, and of and , respectively, and the extended SPOD (ESPOD) mode defined as
| (20) | ||||
| (21) |
where is the largest eigenvalue of , and is the associated eigenvector.
In figure 16, we compare the forcing modes for the triplet using the triadic interactions and , respectively, for different ’s. The triplets and in this figure are chosen such that the difference between the two forcing predictions manifests clearly. All the modes are normalised to have unit magnitude with respect to norm. The phase in the forcing modes obtained using SPOD modes is random, while the phases of the RESPOD forcing modes and the forcing predictions based on the ESPOD modes, , are both associated with the phase of the wall shear, and therefore, not random with respect to each other. In the following, we only compare the mode shapes.
Using the optimal SPOD modes yields forcing modes similar to the RESPOD forcing mode for the interactions among wave modes and , while the mode shapes significantly differ for the interactions and . Using the ESPOD modes, on the other hand, yields forcing modes that are similar to the RESPOD forcing modes for the latter two interactions, while it is not the case for the former two. This suggests that one may blend the two modes as
| (22) | ||||
to predict the response modes generating the RESPOD forcing mode, where and denote the blending coefficients. To be able to quantify the accuracy of the prediction, we define a similarity measure,
| (23) |
for a given mode pair and . We propose deciding the coefficients and regarding the correlation levels between the observable and the response and forcing structures, , and that are in a triadic interaction. Since the ESPOD and RESPOD modes yield the correlated parts of the response and forcing to the wall shear, respectively, the correlation levels can be computed as
| (24) | ||||
| (25) |
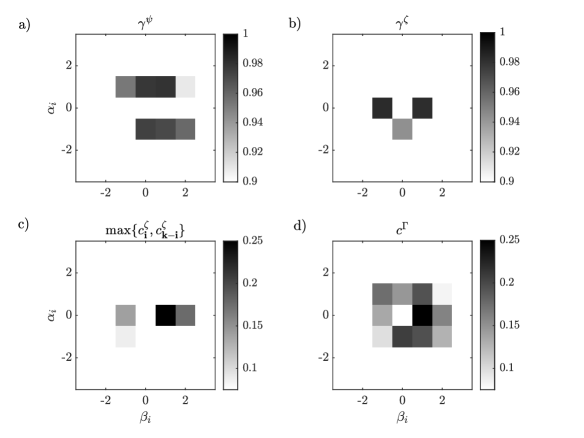
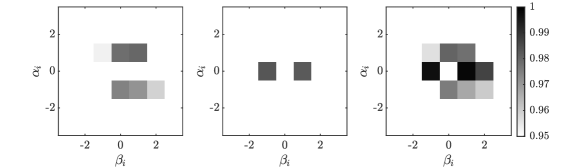
Figure 17 shows the values of , , and for a number of triplets and . We observe that the similarity measure is high when is not very small () and either of or is close to , i.e., the forcing structures and at least one of the response structures in the triadic interaction are correlated to the observed quantity. On the other hand, the similarity measure is high when is again not very small and and are close to zero, i.e., the forcing is correlated to the observable while the response structures in the triadic interaction are not. Note that neither of or is close to 1 when the correlation between the forcing and the observable, , is low as in the case of and shown in figure 17. However, this usually constitutes a case where accurate prediction of the forcing mode shape is not important due to its small contribution to response generation.
Based on these observations, we present the following empirical relation for the blending coefficients
| (26) |
The model in (22) provides a smooth blending of the ESPOD modes and SPOD modes depending on the maximum correlation level between the ESPOD modes and the observed quantity. The resulting modes are normalized afterwards using norm. We compare the similarity measures , and in figure 18. We see that the model improves the alignment everywhere compared to the alignment levels obtained using the SPOD and ESPOD modes separately. The improvement is more evident when comparing and for the interactions involving streamwise-constant modes, while the change is only marginal between and for the streamwise-periodic modes.
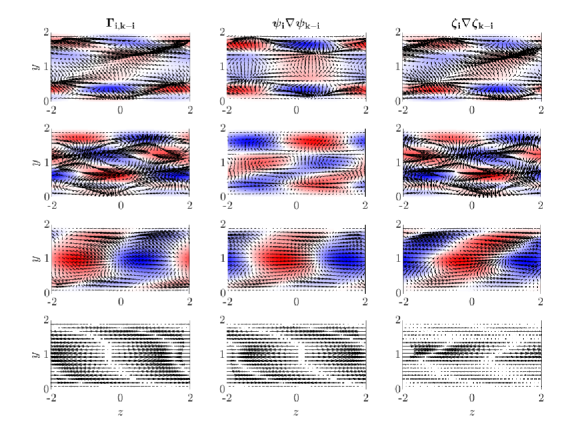
We present in figure 19 the predicted flow structures and which yield the triadic interactions shown in figure 16, together with the resulting forcing modes , which are compared to the RESPOD forcing modes . The predicted flow structures are seen to yield forcing predictions that are in good alignment with the actual RESPOD forcing modes present in the flow. For the streamwise-constant modes both the mode shape and phase are predicted accurately while a phase shift is observed in streamwise-periodic modes although the mode shapes are well predicted.
To understand the cumulative effect of the small imperfections in the predicted forcing modes obtained using (22), we replace the RESPOD forcing modes with these forcing predictions and investigate the change in the resulting response mode. The comparison of the resulting response structure against the response to the RESPOD forcing modes, is shown in figure 20 for the tuples shown in figure 4 at their peak-energy frequency. Note that the model is used to obtain the forcing mode shapes only, while the phase and the norm of the resulting modes are calibrated using the actual forcing data. The comparison reveals that the response generated by the modeled forcing matches the ESPOD mode with good accuracy for all the wavenumber-frequency pairs except the streamwise velocity component in the triplet, .
6 Conclusions
We have discussed a method to investigate the triadic interactions that underpin the generation of flow structures associated with a given observable. The method is based on the resolvent-based extended spectral proper orthogonal decomposition (RESPOD), used in Karban et al. (2022) to identify self-similar structures in a turbulent channel flow. A minimal Couette flow is here chosen as the test case, where the triadic interactions associated with spanwise wall-shear are investigated.
We identify the forcing modes correlated to the SPOD modes of an observable via RESPOD. These forcing modes generates the associated SPOD modes when applied to the resolvent operator. We show in this study that using RESPOD it is also possible to identify individual triadic interactions that are correlated to the observable. Summation of the correlated triadic interactions is by definition equal to the RESPOD forcing mode. This procedure allows identifying interactions that dominate generating the observable. For each of these interactions, we propose a model for the structures that from the triad, using a linear combination of the SPOD and ESPOD modes. The propose model shows higher coherence than when each of these modes is used individually.
The analysis reveals that the most energetic mode, , at its peak-energy frequency, , was mainly driven by six triadic interactions: four interactions involving modes periodic over in the streamwise direction, that generate small-in-amplitude but efficient forcing, and two interactions involving streamwise-constant modes that, although being less efficient, generate forcing structures with large amplitudes. The streamwise-periodic interactions generate a combined streak-streamwise vortex structure via the lift-up mechanism, while the streamwise-constant interactions counteract the streak generation by generating a streamwise forcing component in phase opposition to the lift-up mechanism. This explains in physical terms the destructive interference of forcing observed by Nogueira et al. (2021): forcing is composed of different triadic interactions with opposing effects in exciting streamwise vortices and streaks.
Our framework also allows us to investigate energy transfer between different modes via triadic interactions. We observe that the triadic interactions involving the (0,1) mode provide a constructive contribution to all the modes investigated. This is an expected result since it is the only mode with a negative nonlinear transfer rate of turbulent kinetic energy, as shown by the energy balance analysis we conducted following Symon et al. (2021). Investigating the nonlinear transfer for different modes via a range of triadic interactions, we observe the energy cascade mechanism transferring energy from (0,1) to (0,2) and then from (0,2) to (0,3). Comparing the interaction map and the map of nonlinear energy transfer revealed that the triadic interactions associated to the lift-up mechanism and the nonlinear transfer are in destructive interference for the modes (0,1,0) and (0,2,0).
The method we discuss provides a systematic means by which to understand mechanisms responsible for the generation of a given observable in a turbulent flow. It does not however provide the flow structures that form the forcing modes active in response generation. To predict these flow structures, we proposed an empirical model blending the SPOD and ESPOD modes based on the correlation between the ESPOD modes and the measured observable. We showed that the forcing structures predicted via this empirical approach generates a response very similar to the actual response, pointing towards its potential in the construction of reduced-order models.
[Funding]This work has received funding from the Clean Sky 2 Joint Undertaking under the European Union’s Horizon 2020 research and innovation programme under grant agreement No 785303. U.K. has received funding from TUBITAK 2236 Co-funded Brain Circulation Scheme 2 (Project No: 121C061).
[Declaration of interests]The authors report no conflict of interest.
References
- Amaral et al. (2021) Amaral, F. R., Cavalieri, A. V., Martini, E., Jordan, P. & Towne, A. 2021 Resolvent-based estimation of turbulent channel flow using wall measurements. Journal of Fluid Mechanics 927, A17.
- Bae et al. (2021) Bae, H. J., Lozano-Durán, A. & McKeon, B. J. 2021 Nonlinear mechanism of the self-sustaining process in the buffer and logarithmic layer of wall-bounded flows. Journal of Fluid Mechanics 914, A3.
- Borée (2003) Borée, J. 2003 Extended proper orthogonal decomposition: a tool to analyse correlated events in turbulent flows. Experiments in fluids 35 (2), 188–192.
- Brandt (2014) Brandt, L. 2014 The lift-up effect: The linear mechanism behind transition and turbulence in shear flows. European Journal of Mechanics, B/Fluids 47, 80–96.
- Bretheim et al. (2015) Bretheim, J. U., Meneveau, C. & Gayme, D. F. 2015 Standard logarithmic mean velocity distribution in a band-limited restricted nonlinear model of turbulent flow in a half-channel. Physics of Fluids 27 (1), 011702.
- Bretheim et al. (2018) Bretheim, J. U., Meneveau, C. & Gayme, D. F. 2018 A restricted nonlinear large eddy simulation model for high reynolds number flows. Journal of Turbulence 19 (2), 141–166, arXiv: https://doi.org/10.1080/14685248.2017.1403031.
- Cavalieri et al. (2019) Cavalieri, A. V. G., Jordan, P. & Lesshafft, L. 2019 Wave-Packet Models for Jet Dynamics and Sound Radiation. Applied Mechanics Reviews 71 (2), 020802.
- Cheung & Zaki (2014) Cheung, L. C. & Zaki, T. A. 2014 An exact representation of the nonlinear triad interaction terms in spectral space. Journal of Fluid Mechanics 748, 175–188.
- Cho et al. (2018) Cho, M., Hwang, Y. & Choi, H. 2018 Scale interactions and spectral energy transfer in turbulent channel flow. Journal of Fluid Mechanics 854, 474–504.
- Constantinou et al. (2014) Constantinou, N. C., Lozano-Durán, A., Nikolaidis, M.-A., Farrell, B. F., Ioannou, P. J. & Jiménez, J. 2014 Turbulence in the highly restricted dynamics of a closure at second order: comparison with DNS. Journal of Physics: Conference Series 506, 012004.
- Ellingsen & Palm (1975) Ellingsen, T. & Palm, E. 1975 Stability of linear flow. The Physics of Fluids 18 (4), 487–488.
- Farrell et al. (2017) Farrell, B. F., Gayme, D. F. & Ioannou, P. J. 2017 A statistical state dynamics approach to wall turbulence. Philosophical Transactions of the Royal Society A: Mathematical, Physical and Engineering Sciences 375 (2089), 20160081, arXiv: https://royalsocietypublishing.org/doi/pdf/10.1098/rsta.2016.0081.
- Farrell & Ioannou (1993) Farrell, B. F. & Ioannou, P. J. 1993 Optimal excitation of three‐dimensional perturbations in viscous constant shear flow. Physics of Fluids A: Fluid Dynamics 5 (6), 1390–1400.
- Farrell & Ioannou (2012) Farrell, B. F. & Ioannou, P. J. 2012 Dynamics of streamwise rolls and streaks in turbulent wall-bounded shear flow. Journal of Fluid Mechanics 708, 149–196.
- Hall & Sherwin (2010) Hall, P. & Sherwin, S. 2010 Streamwise vortices in shear flows: harbingers of transition and the skeleton of coherent structures. Journal of Fluid Mechanics 661, 178–205.
- Hamilton et al. (1995) Hamilton, J. M., Kim, J. & Waleffe, F. 1995 Regeneration mechanisms of near-wall turbulence structures. Journal of Fluid Mechanics 287, 317–348.
- Hoarau et al. (2006) Hoarau, C., Borée, J., Laumonier, J. & Gervais, Y. 2006 Analysis of the wall pressure trace downstream of a separated region using extended proper orthogonal decomposition. Physics of Fluids 18, 055107.
- Hussain & Reynolds (1970) Hussain, A. K. M. F. & Reynolds, W. C. 1970 The mechanics of an organized wave in turbulent shear flow. Journal of Fluid Mechanics 41 (2), 241–258.
- Hwang & Cossu (2010a) Hwang, Y. & Cossu, C. 2010a Amplification of coherent streaks in the turbulent couette flow: an input–output analysis at low reynolds number. Journal of Fluid Mechanics 643, 333–348.
- Hwang & Cossu (2010b) Hwang, Y. & Cossu, C. 2010b Linear non-normal energy amplification of harmonic and stochastic forcing in the turbulent channel flow. Journal of Fluid Mechanics 664, 51–73.
- Jin et al. (2021) Jin, B., Symon, S. & Illingworth, S. J. 2021 Energy transfer mechanisms and resolvent analysis in the cylinder wake. Phys. Rev. Fluids 6, 024702.
- Jordan & Colonius (2013) Jordan, P. & Colonius, T. 2013 Wave packets and turbulent jet noise. Annual Review of Fluid Mechanics 45 (1), 173–195.
- Jovanović & Bamieh (2005) Jovanović, M. R. & Bamieh, B. 2005 Componentwise energy amplification in channel flows. Journal of Fluid Mechanics 534, 145–183.
- Karban et al. (2022) Karban, U., Martini, E., Cavalieri, A., Lesshafft, L. & Jordan, P. 2022 Self-similar mechanisms in wall turbulence studied using resolvent analysis. Journal of Fluid Mechanics 939, A36.
- Kraichnan (1973) Kraichnan, R. H. 1973 Helical turbulence and absolute equilibrium. Journal of Fluid Mechanics 59 (4), 745–752.
- Kuhn et al. (2021) Kuhn, P., Soria, J. & Oberleithner, K. 2021 Linear modelling of self-similar jet turbulence. Journal of Fluid Mechanics 919, A7.
- Landahl (1980) Landahl, M. T. 1980 A note on an algebraic instability of inviscid parallel shear flows. Journal of Fluid Mechanics 98 (2), 243–251.
- Lesshafft et al. (2019) Lesshafft, L., Semeraro, O., Jaunet, V., Cavalieri, A. V. G. & Jordan, P. 2019 Resolvent-based modeling of coherent wave packets in a turbulent jet. Phys. Rev. Fluids 4, 063901.
- Malkus (1956) Malkus, W. V. R. 1956 Outline of a theory of turbulent shear flow. Journal of Fluid Mechanics 1 (5), 521–539.
- Martini et al. (2019) Martini, E., Cavalieri, A. V., Jordan, P. & Lesshafft, L. 2019 Accurate frequency domain identification of odes with arbitrary signals. arXiv: Signal Processing .
- Martini et al. (2020) Martini, E., Cavalieri, A. V. G., Jordan, P., Towne, A. & Lesshafft, L. 2020 Resolvent-based optimal estimation of transitional and turbulent flows. Journal of Fluid Mechanics 900, A2.
- McKeon & Sharma (2010) McKeon, B. J. & Sharma, A. S. 2010 A critical-layer framework for turbulent pipe flow. Journal of Fluid Mechanics 658, 336–382.
- Moffatt (2014) Moffatt, H. K. 2014 Note on the triad interactions of homogeneous turbulence. Journal of Fluid Mechanics 741, R3.
- Morra et al. (2021) Morra, P., Nogueira, P. A. S., Cavalieri, A. V. G. & Henningson, D. S. 2021 The colour of forcing statistics in resolvent analyses of turbulent channel flows. Journal of Fluid Mechanics 907, A24.
- Morra et al. (2019) Morra, P., Semeraro, O., Henningson, D. S. & Cossu, C. 2019 On the relevance of reynolds stresses in resolvent analyses of turbulent wall-bounded flows. Journal of Fluid Mechanics 867, 969–984.
- Nogueira et al. (2021) Nogueira, P. A. S., Morra, P., Martini, E., Cavalieri, A. V. G. & Henningson, D. S. 2021 Forcing statistics in resolvent analysis: application in minimal turbulent couette flow. Journal of Fluid Mechanics 908, A32.
- Padovan et al. (2020) Padovan, A., Otto, S. E. & Rowley, C. W. 2020 Analysis of amplification mechanisms and cross-frequency interactions in nonlinear flows via the harmonic resolvent. Journal of Fluid Mechanics 900, A14.
- Pickering et al. (2020) Pickering, E., Rigas, G., Nogueira, P. A. S., Cavalieri, A. V. G., Schmidt, O. T. & Colonius, T. 2020 Lift-up, kelvin–helmholtz and orr mechanisms in turbulent jets. Journal of Fluid Mechanics 896, A2.
- Pickering et al. (2021) Pickering, E., Rigas, G., Schmidt, O. T., Sipp, D. & Colonius, T. 2021 Optimal eddy viscosity for resolvent-based models of coherent structures in turbulent jets. Journal of Fluid Mechanics 917, A29.
- Rigas et al. (2021) Rigas, G., Sipp, D. & Colonius, T. 2021 Nonlinear input/output analysis: application to boundary layer transition. Journal of Fluid Mechanics 911, A15.
- Rosenberg et al. (2019) Rosenberg, K., Symon, S. & McKeon, B. J. 2019 Role of parasitic modes in nonlinear closure via the resolvent feedback loop. Phys. Rev. Fluids 4, 052601.
- Schmidt et al. (2018) Schmidt, O. T., Towne, A., Rigas, G., Colonius, T. & Brès, G. A. 2018 Spectral analysis of jet turbulence. Journal of Fluid Mechanics 855, 953–982.
- Sharma et al. (2017) Sharma, A. S., Moarref, R. & McKeon, B. J. 2017 Scaling and interaction of self-similar modes in models of high reynolds number wall turbulence. Philosophical Transactions of the Royal Society A: Mathematical, Physical and Engineering Sciences 375 (2089), 20160089, arXiv: https://royalsocietypublishing.org/doi/pdf/10.1098/rsta.2016.0089.
- Sipp & Marquet (2012) Sipp, D. & Marquet, O. 2012 Characterization of noise amplifiers with global singular modes: the case of the leading-edge flat-plate boundary layer. Theoretical and Computational Fluid Dynamics 2012 27:5 27, 617–635.
- Symon et al. (2021) Symon, S., Illingworth, S. J. & Marusic, I. 2021 Energy transfer in turbulent channel flows and implications for resolvent modelling. Journal of Fluid Mechanics 911.
- Symon et al. (2019) Symon, S., Sipp, D. & McKeon, B. J. 2019 A tale of two airfoils: resolvent-based modelling of an oscillator versus an amplifier from an experimental mean. Journal of Fluid Mechanics 881, 51–83.
- Thomas et al. (2014) Thomas, V. L., Lieu, B. K., Jovanović, M. R., Farrell, B. F., Ioannou, P. J. & Gayme, D. F. 2014 Self-sustaining turbulence in a restricted nonlinear model of plane couette flow. Physics of Fluids 26 (10), 105112, arXiv: https://doi.org/10.1063/1.4898159.
- Towne et al. (2015) Towne, A., Colonius, T., Jordan, P., Cavalieri, A. V. & Brès, G. A. 2015 Stochastic and nonlinear forcing of wavepackets in a Mach 0.9 jet.
- Towne et al. (2018) Towne, A., Schmidt, O. T. & Colonius, T. 2018 Spectral proper orthogonal decomposition and its relationship to dynamic mode decomposition and resolvent analysis. Journal of Fluid Mechanics 847, 821–867.
- Trefethen et al. (1993) Trefethen, L. N., Trefethen, A. E., Reddy, S. C. & Driscoll, T. A. 1993 Hydrodynamic stability without eigenvalues. Science 261 (5121), 578–584, arXiv: https://www.science.org/doi/pdf/10.1126/science.261.5121.578.
- Waleffe (1992) Waleffe, F. 1992 The nature of triad interactions in homogeneous turbulence. Physics of Fluids A: Fluid Dynamics 4 (2), 350–363.
- Zare et al. (2017) Zare, A., Jovanović, M. R. & Georgiou, T. T. 2017 Colour of turbulence. Journal of Fluid Mechanics 812, 636–680.