Reduced Reference Quality Assessment for Point Cloud Compression
Abstract
In this paper, we propose a reduced reference (RR) point cloud quality assessment (PCQA) model named R-PCQA to quantify the distortions introduced by the lossy compression. Specifically, we use the attribute and geometry quantization steps of different compression methods (i.e., V-PCC, G-PCC and AVS) to infer the point cloud quality, assuming that the point clouds have no other distortions before compression. First, we analyze the compression distortion of point clouds under separate attribute compression and geometry compression to avoid their mutual masking, for which we consider 5 point clouds as references to generate a compression dataset (PCCQA) containing independent attribute compression and geometry compression samples. Then, we develop the proposed R-PCQA via fitting the relationship between the quantization steps and the perceptual quality. We evaluate the performance of R-PCQA on both the established dataset and another independent dataset. The results demonstrate that the proposed R-PCQA can exhibit reliable performance and high generalization ability.
I Introduction
Recently, point cloud has emerged as a promising representation format in prevalent 3D applications (e.g., autonomous driving [1] and augmented reality [2]), for which the point cloud compression (PCC) is of great interest for providing efficient service in practices. Currently, the Moving Picture Experts Group (MPEG) has applied the separable measurements of geometry and attribute distortion in the course of lossy PCC. For the geometry distortion, MPEG proposes to use the point-to-point (p2point) [3], or point-to-plane (p2plane) [4] to quantify the spatial perturbation; while for the attribute part, the PSNRyuv is proposed to measure the differences between corresponding color channels. Besides these metrics which have already been applied in MPEG PCC standardization, some other metrics which consider more human visual characteristics and present better performance on public PCQA databases are also developed, such as [5, 6, 7, 8, 9, 10, 11, 12, 13, 14, 15]. However, they are full reference (FR) metrics which require both the reference and distorted samples and have high computational complexity for real-time quality prediction.
In many practical cases, e.g., transmission, the timely feedback is expected, and only the compressed samples and the meta data are available, in which the reduced reference (RR) PCQA metrics are indispensable. Only a few researches explore the RR methods for PCQA. [16] uses the statistical information (e.g., the luminance histogram) as the substitute for the complete samples, but still requires the backend processing. [17] applies the quantization parameters in V-PCC to estimate the quality of compressed samples and guide rate control, but other prevalent compression strategies (e.g., G-PCC) are ignored. Therefore, in this paper, we propose a general RR PCQA model for compression distortions named R-PCQA which only takes the attribute and geometry quantization steps of compression schemes (including V-PCC [18], G-PCC [19] and AVS [20], V-PCC and G-PCC are provided by MPEG while AVS is recommended by China Audio-Video Coding Standard) as variables, since the quality of compressed point clouds is highly related to the compression parameters. To fully study the relationship between the compression parameters and perceptual quality, we first establish a complete subjective database for PCC, named PCC quality assessment (PCCQA) database.
The reason why we establish PCCQA while many PCQA datasets [21, 7, 22, 23, 24] have been proposed is that current databases only consider the superimposed compression distortion, i.e. lossy-geometry (G)-lossy-attribute (A) compression, which is recommended in the Common Test Conditions (CTC) [25, 26, 27]. The separate compression strategies, i.e. lossless-G-lossy-A and lossy-G-lossless-A compression, which are not included in the CTC are often ignored. Considering the mutual masking between geometry and attribute distortions [28], they are useful for exploring the relationship between the perceptual quality and compression parameters. In PCCQA, the reference point clouds are compressed by V-PCC, G-PCC and AVS under lossless-G-lossy-A condition, lossy-G-lossless-A condition, and lossy-G-lossy-A condition respectively.
To model the relationship between the perceptual quality and the compression parameters, we first convert all the compression parameters to the quantization steps. Then, we model the relationship between the perceptual quality and the attribute/geometry quantization steps respectively via using the least square fitting. Finally, the proposed R-PCQA combines the attribute compression model and geometry compression model to predict the final quality scores.
II PCCQA database
To better explore the relationship between the perceptual quality and the attribute/geometry compression parameters, we first establish a database called PCCQA under several compression conditions.
Five reference point clouds are selected from MPEG and AVS point cloud datasets. These reference point clouds are ensured to have no holes and other distortions under 1080P presentation with size-2 primitives. The reference point clouds are then distorted with 3 compression algorithms, i.e. V-PCC [18], G-PCC [19] and AVS [20]. Each compression is conducted under 3 conditions, i.e. lossless-G-lossy-A, lossy-G-lossless-A, and lossy-G-lossy-A. The compression parameters are shown in Table I. In total, 225 compressed point clouds are generated.
| Conditions | Parameters | |||||||||||
|---|---|---|---|---|---|---|---|---|---|---|---|---|
|
|
|||||||||||
|
|
|||||||||||
|
|
To annotate the compressed point clouds, a subjective experiment is organized to collect the Mean Opinion Scores (MOS). We adopt the double stimulus method since it can obtain more stable results for minor impairments. The experiment process and environment setting strictly follow the ITU-R Recommendation BT. 500 [29]. Such a method for collecting subjective MOS is also adopted in other researches, such as [30, 31, 23, 32].
III Proposed Quality Assessment Model R-PCQA
III-A Unifying the Compression Parameters
The compression parameters with different meanings are used in V-PCC, G-PCC and AVS, but the used compression parameters can all be converted to the quantization steps. Thus, to better explore the relationship between the perceptual quality and the quantization, we first convert these compression parameters to quantization steps, denoted as , before proposing the R-PCQA.
In V-PCC, the parameters textureQP and geomQP, denoted as , are used to control the attribute compression and geometry compression respectively, which apply
| (1) |
where means converting a number to the nearest integer.
In attribute compression of G-PCC, the compression parameter qp has the same meaning as in V-PCC, following the same conversion formula in Eq. (1). The parameter positionQuantizationScale, denoted as , is used to control the geometry quantization, which can be converted to by
| (2) |
In AVS, the parameter attr_quant_param, denoted as , is used to control the attribute quantization, which can use the following formulation to convert it to
| (3) |
For the geometry compression of AVS, the parameter geom_quant_step shares the same meaning with the quantization step .
III-B Overall Quality Model
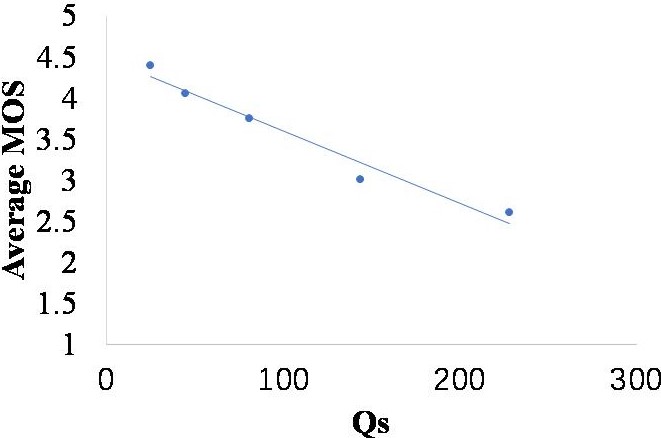
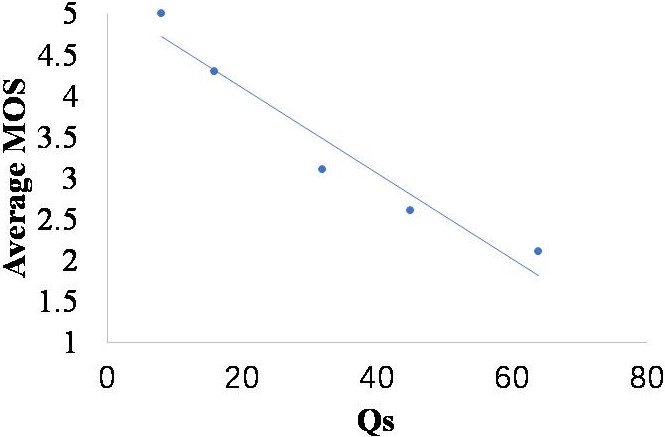
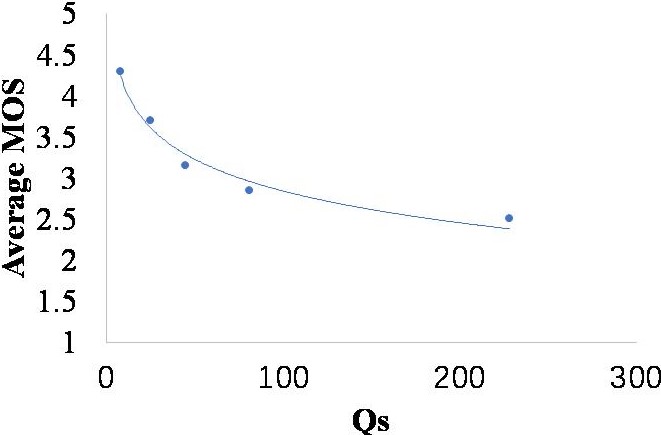
We use the average MOS in PCCQA to fit the mathematical model for quality prediction. The relationships between and under V-PCC lossless-G-lossy-A condition and V-PCC lossy-G-lossless-A condition are shown in Fig. 1. We can see that under the same compression condition, different samples share the fitting model with basically the same shape but are added to different additive factors. Therefore, we assume and satisfy the following relationship under a certain compression condition:
| (4) |
where denotes the fitting function which is related to the quantization step . denotes the additive factor which is related to the intrinsic characteristics of the point cloud .
On the whole, different samples share the same relationship model under a certain compression condition, but they are added to an additive sample factor. To deal with the additive sample factor, we use and average which is denoted as to build up the relationship model for each compression condition:
| (5) |
where is the final predicted quality score and denotes the average value of additive factors.
III-C Modeling the Attribute Compression
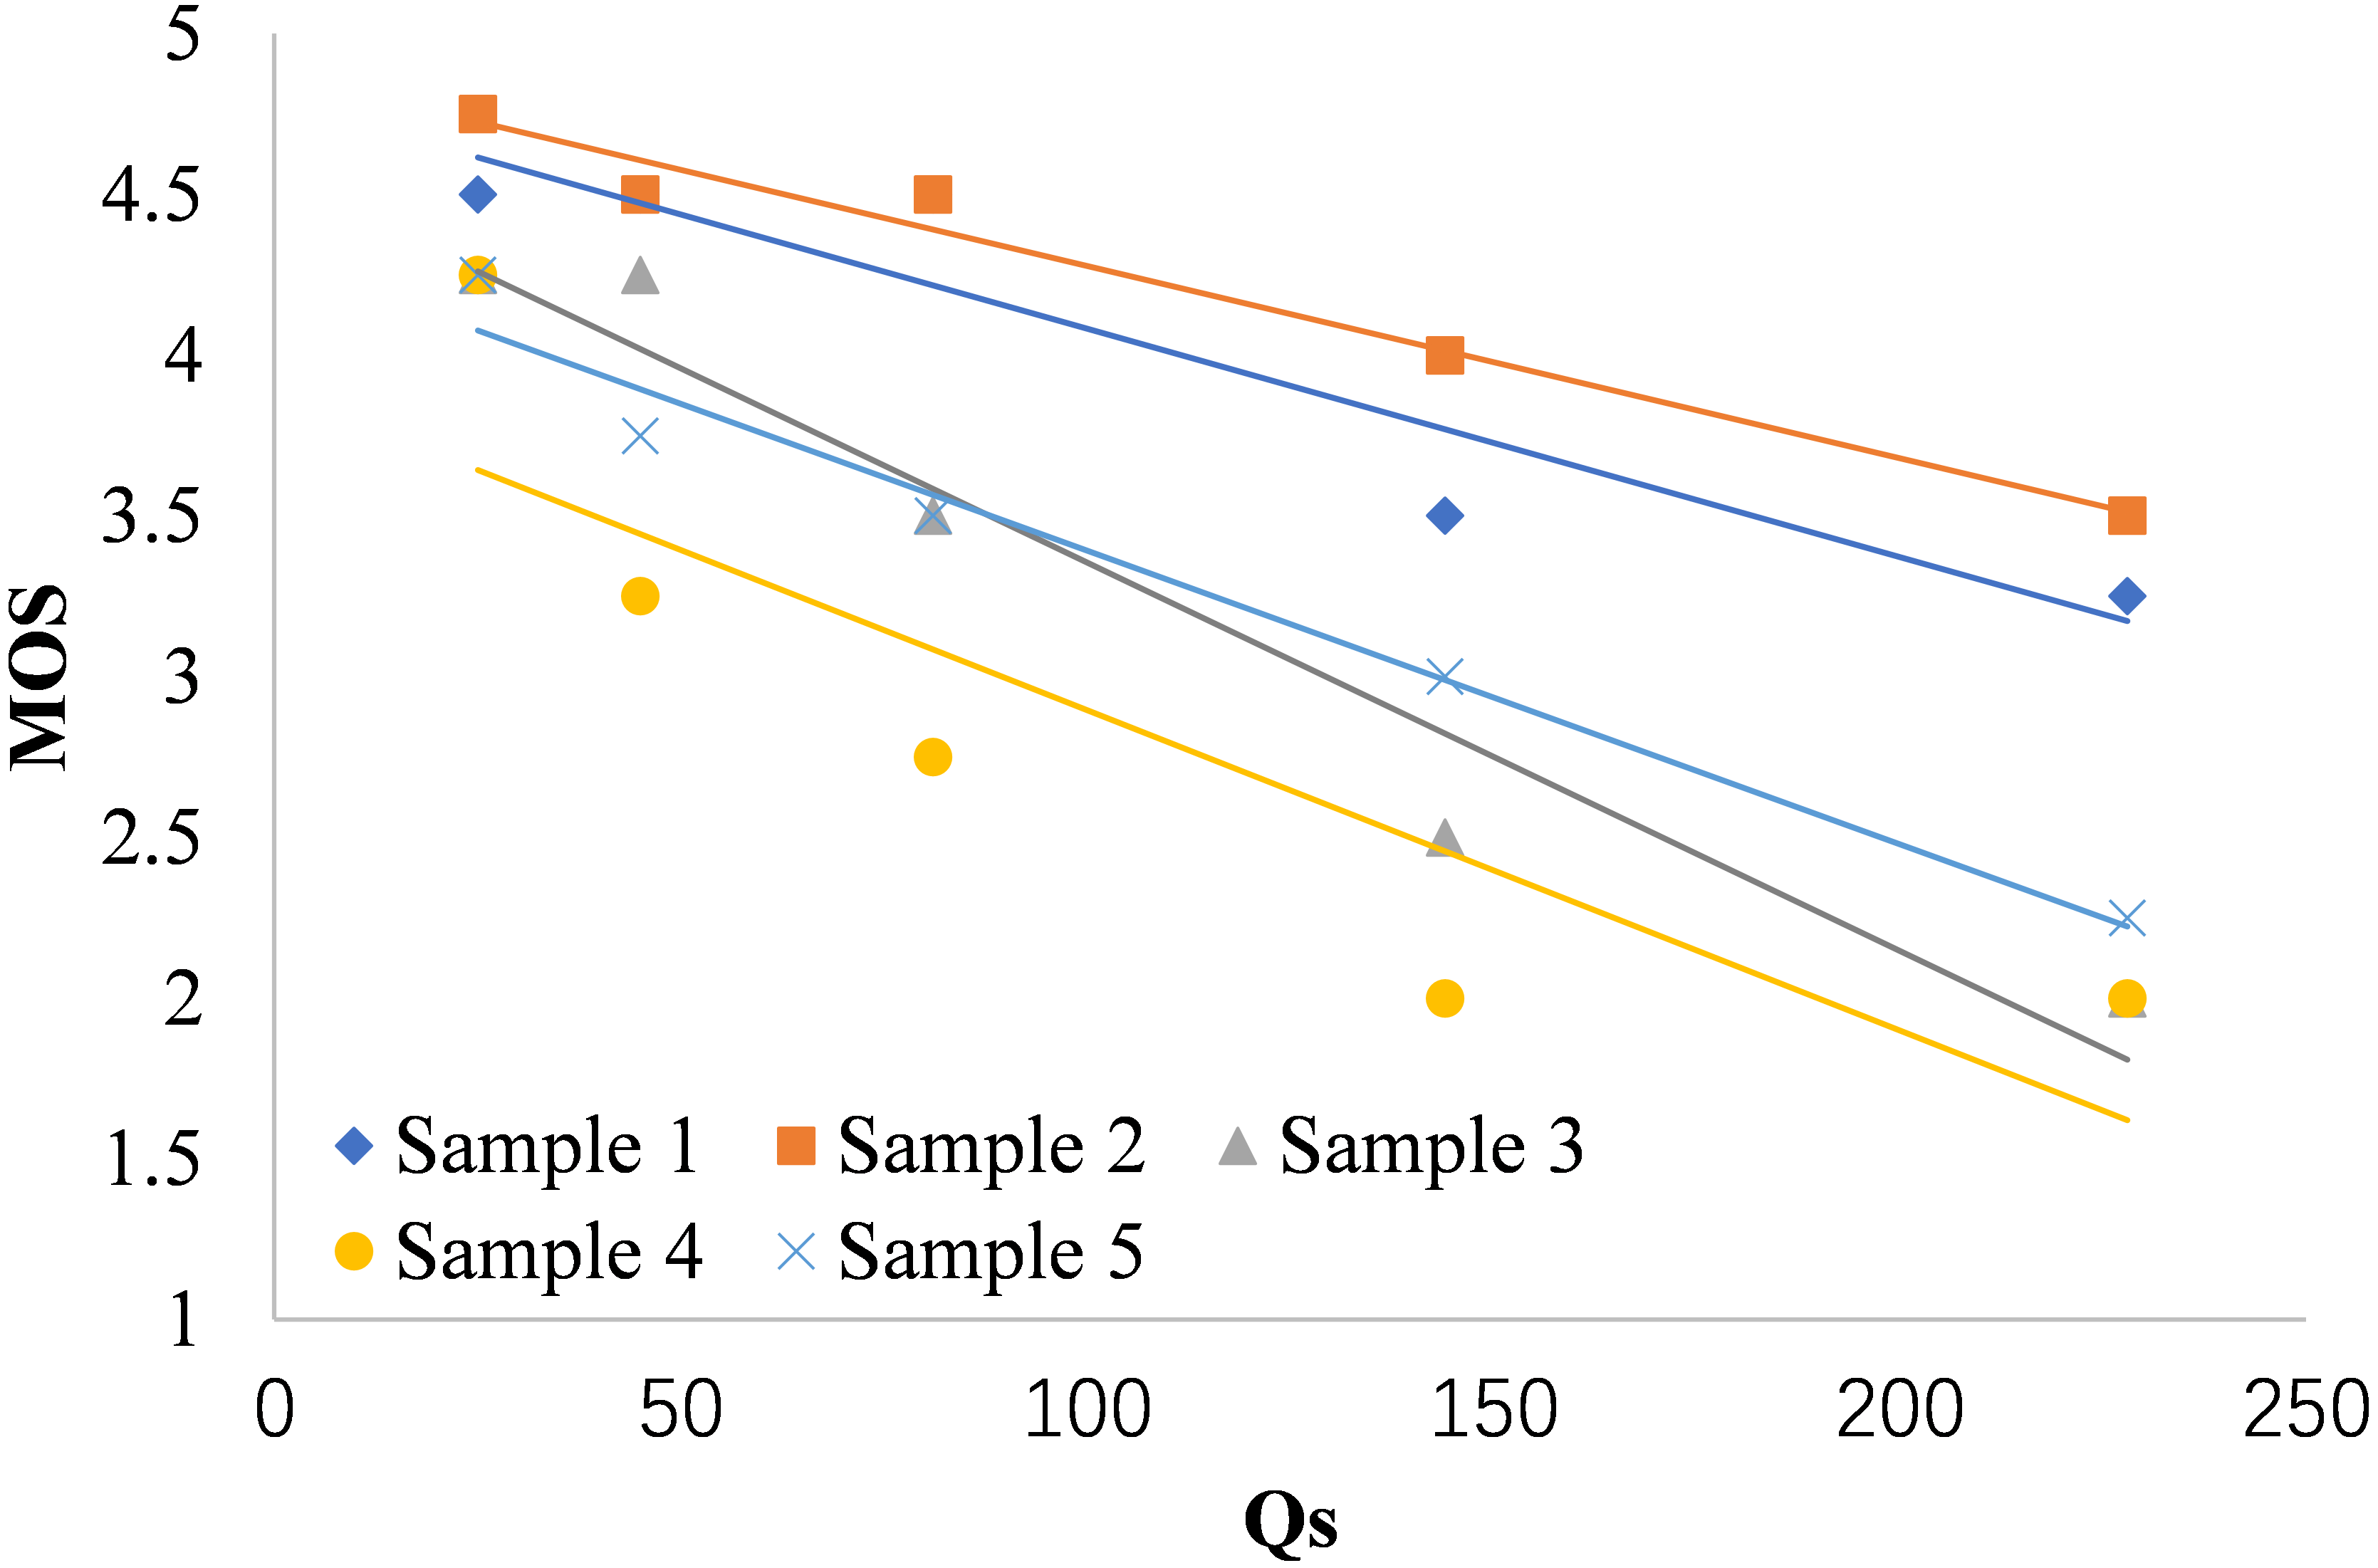
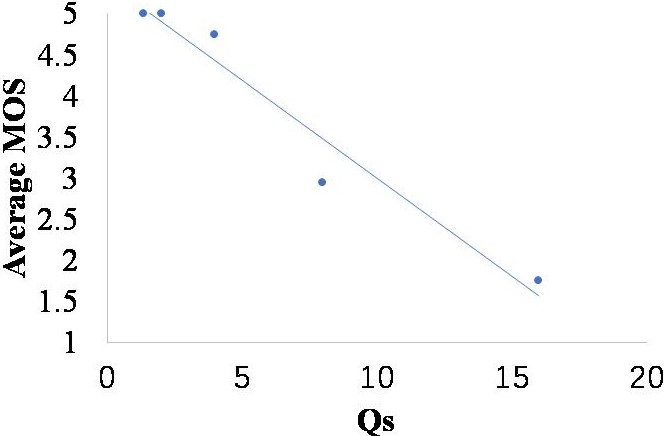
The relationships between and are illustrated in Fig. 2. For the attribute compression of all V-PCC, G-PCC and AVS compression algorithms, the relationship between and follows the linear model, i.e.,
| (6) |
where denotes the quantization steps for attribute compression. and are the model parameters, whose fitting values are shown in Table II.
| V-PCC | G-PCC | AVS | |
|---|---|---|---|
| c1,a | -0.0089 | -0.01 | -0.0519 |
| c2,a | 4.4862 | 5.3515 | 5.1337 |
III-D Modeling the Geometry Compression
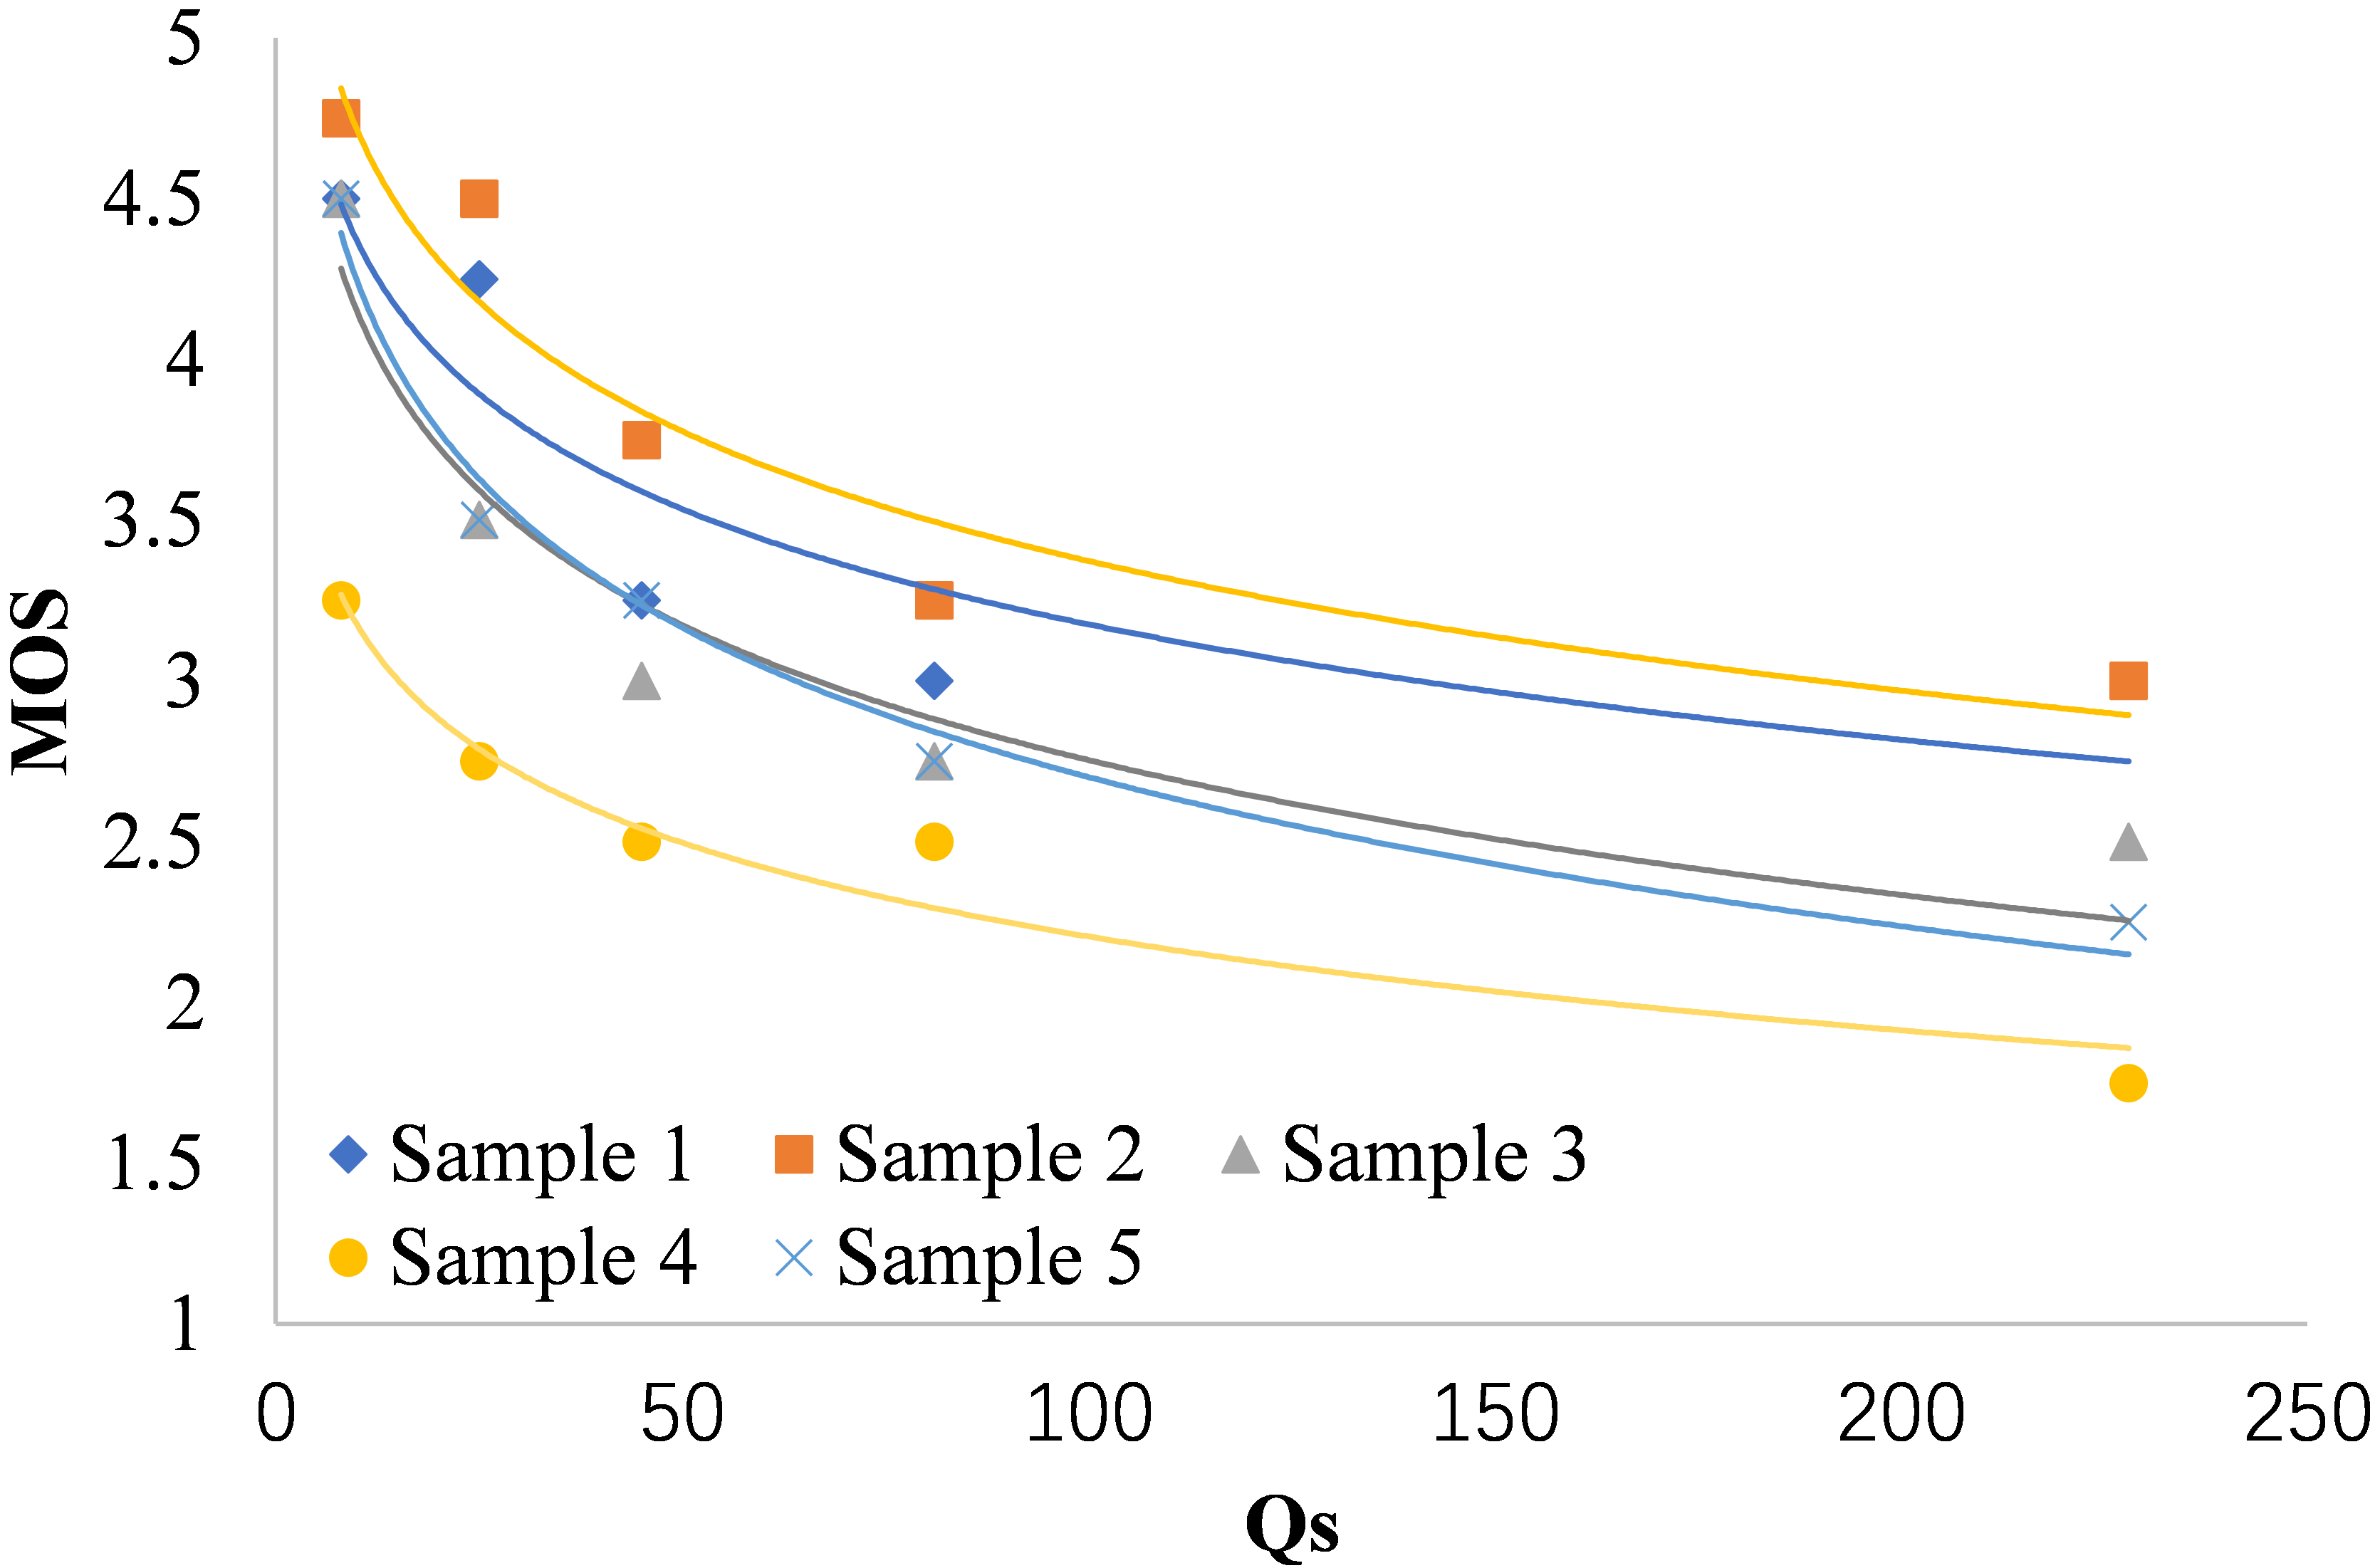
For geometry compression of V-PCC, the relationship between and follows the natural logarithm function, i.e.,
| (7) |
where denotes the quantization steps for geometry compression. and denote the model parameters.
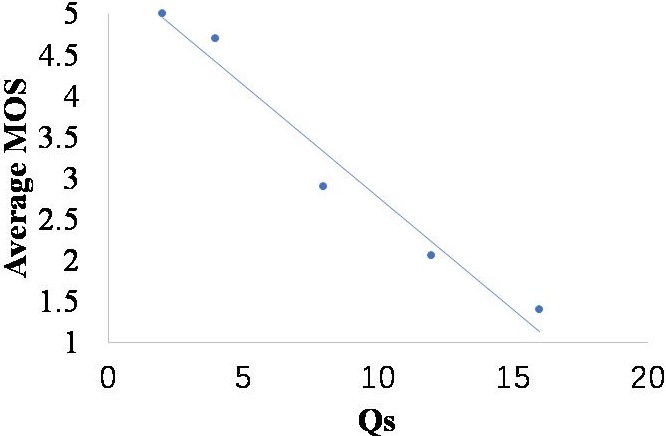
For geometry compression of G-PCC and AVS compression algorithms, the relationship between and follows the linear model, i.e.,
| (8) |
The fitted parameters in the geometry compression models are shown in Table III:
| V-PCC | G-PCC | AVS | |
|---|---|---|---|
| c1,g | -0.559 | -0.2381 | -0.273 |
| c2,g | 5.4165 | 5.3818 | 5.5034 |

III-E Combining the Attribute Model and Geometry Model
The point clouds are often compressed in both attribute and geometry, and the attribute degradation and geometry degradation are superimposed on the point clouds at the same time. As explored in Section IV-B, the linear combination of the attribute model and geometry model can accurately estimate the quality. We take the weighted summation of and to predict the final quality scores.
For V-PCC, the established model is
| (9) |
For G-PCC and AVS, the established model is
| (10) |
where is the predicted quality scores, is the quantization steps for attribute compression, and is the quantization steps for geometry compression. , , and to cast the predicted quality scores under the same range of subjective scores.
III-F Analysis
Some findings can be made in the experiment: i) Eq. 6 and Eq. 7 demonstrate that for the V-PCC distortion, the geometry distortion is more annoying compared with the attribute distortion, but the human eyes are more sensitive to the quantization change in the attribute compression; ii) for the geometry compression, the fitting curves of V-PCC and G-PCC are different, which derives from that the quantization of V-PCC is conducted on the projection while the quantization of G-PCC and AVS is conducted on octree; iii) for the attribute compression, all the three compression algorithms follow the linear model, since their quantization is all conducted on RGB, resulting in the similar perceptual pattern.
A potential concern is whether the obtained relation function is generic for different datasets. As discussed in Section III-B, the difference of reference samples will only affect the additive factors, as in Eq. 9 and Eq. 10 which is a predefined constant. Thus, the obtained relation function can still accurately predict the quality rank of samples in other datasets, which is demonstrated by the cross-dataset evaluation in Section IV-C.
IV Experiments
In this section, we evaluate the performance of the proposed R-PCQA on the established PCCQA and WPC [24] dataset. Specifically, we use PCCQA to fit the model parameters and evaluate the fitting errors. Then, we evaluate on WPC dataset as cross check to verify the performance of R-PCQA and its generalization ability.
IV-A Error Analysis
The proposed PCCQA consists of three parts, part 1: lossless-G-lossy-A, part 2: lossy-G-lossless-A and part 3: lossy-G-lossy-A. The proposed R-PCQA is fitted on the lossless-G-lossy-A and lossy-G-lossless-A parts, and we use the remaining lossy-G-lossy-A part to evaluate the performance. Especially, we note the former two parts as the training set and the latter part as the testing set. The mean, standard deviation and 95% quantile of fitting errors on the testing set are shown in Table IV. The correlation performance on the testing set is shown in Table V.
| Mean | Standard deviation | 95% quantile | |
|---|---|---|---|
| V-PCC | 0.0378 | 0.5885 | 0.7561 |
| G-PCC | -0.5794 | 0.5113 | 0.0969 |
| AVS | -0.1356 | 0.2845 | 0.2531 |
IV-B Combination Analysis
The correlation performance of four combination schemes of the attribute model and geometry model on the testing set is shown in Table V.
| PLCC | SROCC | RMSE | PLCC | SROCC | RMSE | |
| Linear Combination | Multiplicative Combination | |||||
| V-PCC | 0.8360 | 0.8554 | 0.5070 | 0.8360 | 0.8554 | 0.5070 |
| G-PCC | 0.9854 | 0.9582 | 0.2098 | 0.9853 | 0.9582 | 0.2100 |
| AVS | 0.9917 | 0.9854 | 0.1650 | 0.9913 | 0.9854 | 0.1691 |
| Combination | Combination | |||||
| V-PCC | 0.8351 | 0.8554 | 0.5082 | 0.8356 | 0.8554 | 0.5075 |
| G-PCC | 0.9444 | 0.9582 | 0.4046 | 0.9767 | 0.9582 | 0.2644 |
| AVS | 0.9881 | 0.9854 | 0.1978 | 0.9862 | 0.9854 | 0.2127 |
We can see from Table V that: i) the linear combination is determined due to its slightly better performance and simpler calculation for two relationship model mixing; ii) the combination schemes hardly affect the performance, which indicates that the obtained relationship models for attribute and geometry are independent. Due to the removal of mutual masking, it is not necessary to consider the interaction of attribute and geometry components in the mixing.
IV-C Cross-dataset Evaluation
After the model is established on the proposed dataset, we evaluate its generalization performance on another independent dataset, the V-PCC part of WPC [24], which contains 400 distorted samples derived from 16 reference point clouds with 25 different quantization parameters. The results are shown in Table VI.
| PLCC | SROCC | PLCC | SROCC | ||
|---|---|---|---|---|---|
| M-p2po (FR) [3] | 0.61 | 0.58 | H-PSNRyuv (FR) [33] | 0.29 | 0.23 |
| M-p2pl (FR) [34] | 0.63 | 0.59 | PCQM (FR) [12] | 0.74 | 0.75 |
| H-p2po (FR) [3] | 0.51 | 0.46 | GraphSIM (FR) [13] | 0.74 | 0.75 |
| H-p2pl (FR) [34] | 0.55 | 0.48 | MPED (FR) [35] | 0.60 | 0.59 |
| PSNRyuv (FR) [33] | 0.46 | 0.47 | |||
| PCM_RR (RR) [16] | 0.42 | 0.38 | R-PCQA (RR) | 0.88 | 0.88 |
We can see from Table VI that: i) for the compression distortions, the proposed R-PCQA exhibits the state-of-the-art performance which only needs the assistance of two compression parameters, even compared with the existing FR metrics; ii) the model parameters derived from PCCQA still exhibit robust performance on another independent dataset, which demonstrates the generalization ability of the proposed RR metric R-PCQA; iii) the massive increase in points after reconstruction may interfere with the measurement of point-wise FR metrics, resulting in the poor performance of some FR metrics.
V Conclusion
In this paper, we analyze the compression distortions of point clouds under separate attribute compression and geometry compression to avoid their mutual masking. Then by fitting the relationship between the quantization steps and the perceptual quality, we propose a RR PCQA model, called R-PCQA, for evaluating V-PCC, G-PCC and AVS distortions. The experiment results have demonstrated that the proposed R-PCQA exhibits reliable and robust performance.
VI Acknowledgement
This paper is supported in part by National Key R&D Program of China (2018YFE0206700), National Natural Science Foundation of China (61971282, U20A20185). The corresponding author is Yiling Xu (e-mail: yl.xu@sjtu.edu.cn).
References
- [1] Y. Li, L. Ma, Z. Zhong, F. Liu, M. A. Chapman, D. Cao, and J. Li, “Deep learning for lidar point clouds in autonomous driving: A review,” IEEE Transactions on Neural Networks and Learning Systems, vol. 32, no. 8, pp. 3412–3432, 2021.
- [2] S. Lim, M. Shin, and J. Paik, “Point cloud generation using deep local features for augmented and mixed reality contents,” in IEEE International Conference on Consumer Electronics, 2020, pp. 1–3.
- [3] P. Cignoni, C. Rocchini, and R. Scopigno, “Metro: measuring error on simplified surfaces,” in Computer Graphics Forum, vol. 17, no. 2. Wiley Online Library, 1998, pp. 167–174.
- [4] D. Tian, H. Ochimizu, C. Feng, R. Cohen, and A. Vetro, “Evaluation metrics for point cloud compression,” ISO/IEC JTC m74008, Geneva, Switzerland, Jan, 2017.
- [5] E. M. Torlig, E. Alexiou, T. A. Fonseca et al., “A novel methodology for quality assessment of voxelized point clouds,” Applications of Digital Image Processing XLI, vol. 10752, pp. 174–190, 2018.
- [6] E. Alexiou and T. Ebrahimi, “Point cloud quality assessment metric based on angular similarity,” in IEEE International Conference on Multimedia and Expo, 2018, pp. 1–6.
- [7] Q. Yang, H. Chen, Z. Ma et al., “Predicting the perceptual quality of point cloud: A 3d-to-2d projection-based exploration,” IEEE Transactions on Multimedia, vol. 23, pp. 3877–3891, 2021.
- [8] A. Javaheri, C. Brites, F. Pereira, and J. Ascenso, “Joint geometry and color projection-based point cloud quality metric,” arXiv preprint arXiv:2108.02481, 2021.
- [9] G. Meynet, J. Digne, and G. Lavoue, “PC-MSDM: A quality metric for 3D point clouds,” in International Conference on Quality of Multimedia Experience, 2019, pp. 1–3.
- [10] I. Viola, S. Subramanyam, and P. Cesar, “A color-based objective quality metric for point cloud contents,” in International Conference on Quality of Multimedia Experience, 2020, pp. 1–6.
- [11] E. Alexiou and T. Ebrahimi, “Towards a point cloud structural similarity metric,” in IEEE International Conference on Multimedia and Expo, 2020, pp. 1–3.
- [12] G. Meynet, Y. Nehme, and G. Lavoue, “PCQM: A full-reference quality metric for colored 3D point clouds,” in International Conference on Quality of Multimedia Experience, 2020, pp. 1–6.
- [13] Q. Yang, Z. Ma, Y. Xu, Z. Li, and J. Sun, “Inferring point cloud quality via graph similarity,” IEEE Transactions on Pattern Analysis and Machine Intelligence, pp. 1–1, 2020.
- [14] Y. Zhang, Q. Yang, and Y. Xu, “MS-GraphSIM: Inferring point cloud quality via multiscale graph similarity,” in ACM International Conference on Multimedia, 2021, p. 1230–1238.
- [15] A. Javaheri, C. Brites, F. Pereira, and J. Ascenso, “A point-to-distribution joint geometry and color metric for point cloud quality assessment,” in IEEE International Workshop on Multimedia Signal Processing, 2021, pp. 1–6.
- [16] I. Viola and P. Cesar, “A reduced reference metric for visual quality evaluation of point cloud contents,” IEEE Signal Processing Letters, vol. 27, pp. 1660–1664, 2020.
- [17] Q. Liu, H. Yuan, R. Hamzaoui et al., “Reduced reference perceptual quality model with application to rate control for video-based point cloud compression,” IEEE Transactions on Image Processing, vol. 30, pp. 6623–6636, 2021.
- [18] MPEG 3DG Subgroup, “Text of iso/iec cd 23090-5: Video-based point cloud compression,” Doc. ISO/IEC JTC1/SC29/WG11/N18030, Macau, China, Oct, 2018.
- [19] ——, “Text of iso/iec cd 23090-9 geometry-based point cloud compression,” Doc. ISO/IEC JTC1/SC29/WG11/N18478, Geneve, Switzerland, Mar, 2019.
- [20] AVS, “Avs codec description,” Doc. AVS N3246, Feb, 2021.
- [21] E. Alexiou, N. Yang, and T. Ebrahimi, “PointXR: A toolbox for visualization and subjective evaluation of point clouds in virtual reality,” in International Conference on Quality of Multimedia Experience, 2020, pp. 1–6.
- [22] A. Javaheri, C. Brites, F. Pereira, and J. Ascenso, “Point cloud rendering after coding: Impacts on subjective and objective quality,” IEEE Transactions on Multimedia, vol. 23, pp. 4049–4064, 2021.
- [23] Y. Liu, Q. Yang, Y. Xu, and L. Yang, “Point cloud quality assessment: Dataset construction and learning-based no-reference metric,” ACM Transactions on Multimedia Computing Communications and Applications, pp. 1–1, 2022.
- [24] H. Su, Z. Duanmu, W. Liu, Q. Liu, and Z. Wang, “Perceptual quality assessment of 3d point clouds,” in IEEE International Conference on Image Processing, 2019, pp. 3182–3186.
- [25] MPEG 3DG Subgroup, “Common test conditions for V3C and V-PCC,” Doc. ISO/IEC JTC1/SC29/WG7/N00038, Oct, 2020.
- [26] ——, “Common test conditions for G-PCC,” Doc. ISO/IEC JTC1/SC29/WG7/N00106, Apr, 2021.
- [27] AVS, “Common test conditions for avs,” Doc. AVS N3114, July, 2021.
- [28] A. Javaheri, C. Brites, F. Pereira, and J. Ascenso, “Point cloud rendering after coding: Impacts on subjective and objective quality,” IEEE Transactions on Multimedia, vol. 23, pp. 4049–4064, 2021.
- [29] “Methodology for the subjective assessment of the quality of television pictures,” Recommendation BT.500-13, ITU-R, Jan. 2012.
- [30] X. Wu, Y. Zhang, C. Fan, J. Hou, and S. Kwong, “Subjective quality database and objective study of compressed point clouds with 6DoF head-mounted display,” IEEE Transactions on Circuits and Systems for Video Technology, vol. 31, no. 12, pp. 4630–4644, 2021.
- [31] H. Su, Z. Duanmu, W. Liu, Q. Liu, and Z. Wang, “Perceptual quality assessment of 3D point clouds,” in IEEE International Conference on Image Processing, 2019, pp. 3182–3186.
- [32] Q. Yang, Y. Liu, S. Chen et al., “No-reference point cloud quality assessment via domain adaptation,” in IEEE Conference on Computer Vision and Pattern Recognition, 2022, pp. 1–1.
- [33] MPEG reference software. http://mpegx.int-evry.fr/software/MPEG/PCC/TM/mpeg-pcc-dmetric.
- [34] R. Mekuria, Z. Li, C. Tulvan, and P. Chou, “Evaluation criteria for point cloud compression,” ISO/IEC MPEG w16332, Geneva, Switzerland, Feb, 2016.
- [35] Q. Yang, Y. Zhang, S. Chen et al., “MPED: Quantifying point cloud distortion based on multiscale potential energy discrepancy,” arXiv preprint arXiv:2103.02850, 2021.