The Mars Orbiter Magnetometer of Tianwen-1: In-flight Performance and First Science Results
Abstract
Mars Orbiter MAGnetometer (MOMAG) is a scientific instrument onboard the orbiter of China’s first mission for Mars — Tianwen-1. It started to routinely measure the magnetic field from the solar wind to magnetic pile-up region surrounding Mars since November 13, 2021. Here we present its in-flight performance and first science results based on the first one and a half months’ data. By comparing with the magnetic field data in the solar wind from the Mars Atmosphere and Volatile EvolutioN (MAVEN), the magnetic field by MOMAG is at the same level in magnitude, and the same magnetic structures with the similar variations in three components could be found in MOMAG data. In the first one and a half months, we recognize 158 clear bow shock (BS) crossings from MOMAG data, whose locations statistically match well with the modeled average BS. We also identify 5 pairs of simultaneous BS crossings of the Tianwen-1’s orbiter and MAVEN. These BS crossings confirm the global shape of modeled BS as well as the south-north asymmetry of the Martian BS. Two presented cases in this paper suggest that the BS is probably more dynamic at flank than near the nose. So far, MOMAG performs well, and provides accurate magnetic field vectors. MOMAG is continuously scanning the magnetic field surrounding Mars. These measurements complemented by observations from MAVEN will undoubtedly advance our understanding of the plasma environment of Mars.
WANG ET AL. \titlerunningheadMars Orbiter Magnetometer of Tianwen-1
1 Introduction
Tianwen-1 is the first mission of China to explore and study Mars from its space environment to the surface (Wan et al., 2020; Zou et al., 2021). It consists of an orbiter, a lander and a rover, called Zhurong. Mars Orbiter MAGnetometer (MOMAG) is one of the scientific instruments onboard the orbiter(Liu et al., 2020). It investigates the magnetic field environment of Mars by measuring the local vector magnetic field, and therefore provides some key information for the understanding of the history and evolution of Mars.
The magnetic field surrounding Mars has two sources. One is the dynamic magnetic field resulted from the coupling between the solar wind and the Martian ionosphere, and the other is the static crustal magnetic field of Mars itself. Since Mars has no global intrinsic magnetic field, the solar wind carrying interplanetary magnetic field directly interacts with Martian ionosphere, and forms the bow shock (BS) and induced magnetosphere, which consists of magnetic pileup region (MPR) and wake region(e.g., Bertucci et al., 2004; Brain et al., 2006). Between the BS and MPR, there is magnetosheath separated from MPR with the magnetic pileup boundary (MPB)(e.g., Mazelle et al., 2004). The magnetic field in these regions influenced by solar wind is highly dynamic.
Escape of ions in Martian atmosphere is one of the core science issues of Tianwen-1, and is closely related to the magnetic environment. For example, the strong static crustal magnetic field on the southern hemisphere may reach upto a high altitude and reconnect with interplanetary magnetic field, causing the escape of ions(Brain et al., 2015), just like the behavior of Venus(Zhang et al., 2012). Besides, various waves in the ionosphere may heat particles, causing ion outflow(Ergun et al., 2006), and when these heated ions transport outside the MPB, they will interact with magnetic field carried by solar wind stream to further generate ion cyclotron wave, boosting the escape of the ions(Russell and Blanco-Cano, 2007). The escape rate during storm times will be one to two orders higher than that during quite time(Jakosky et al., 2015b).
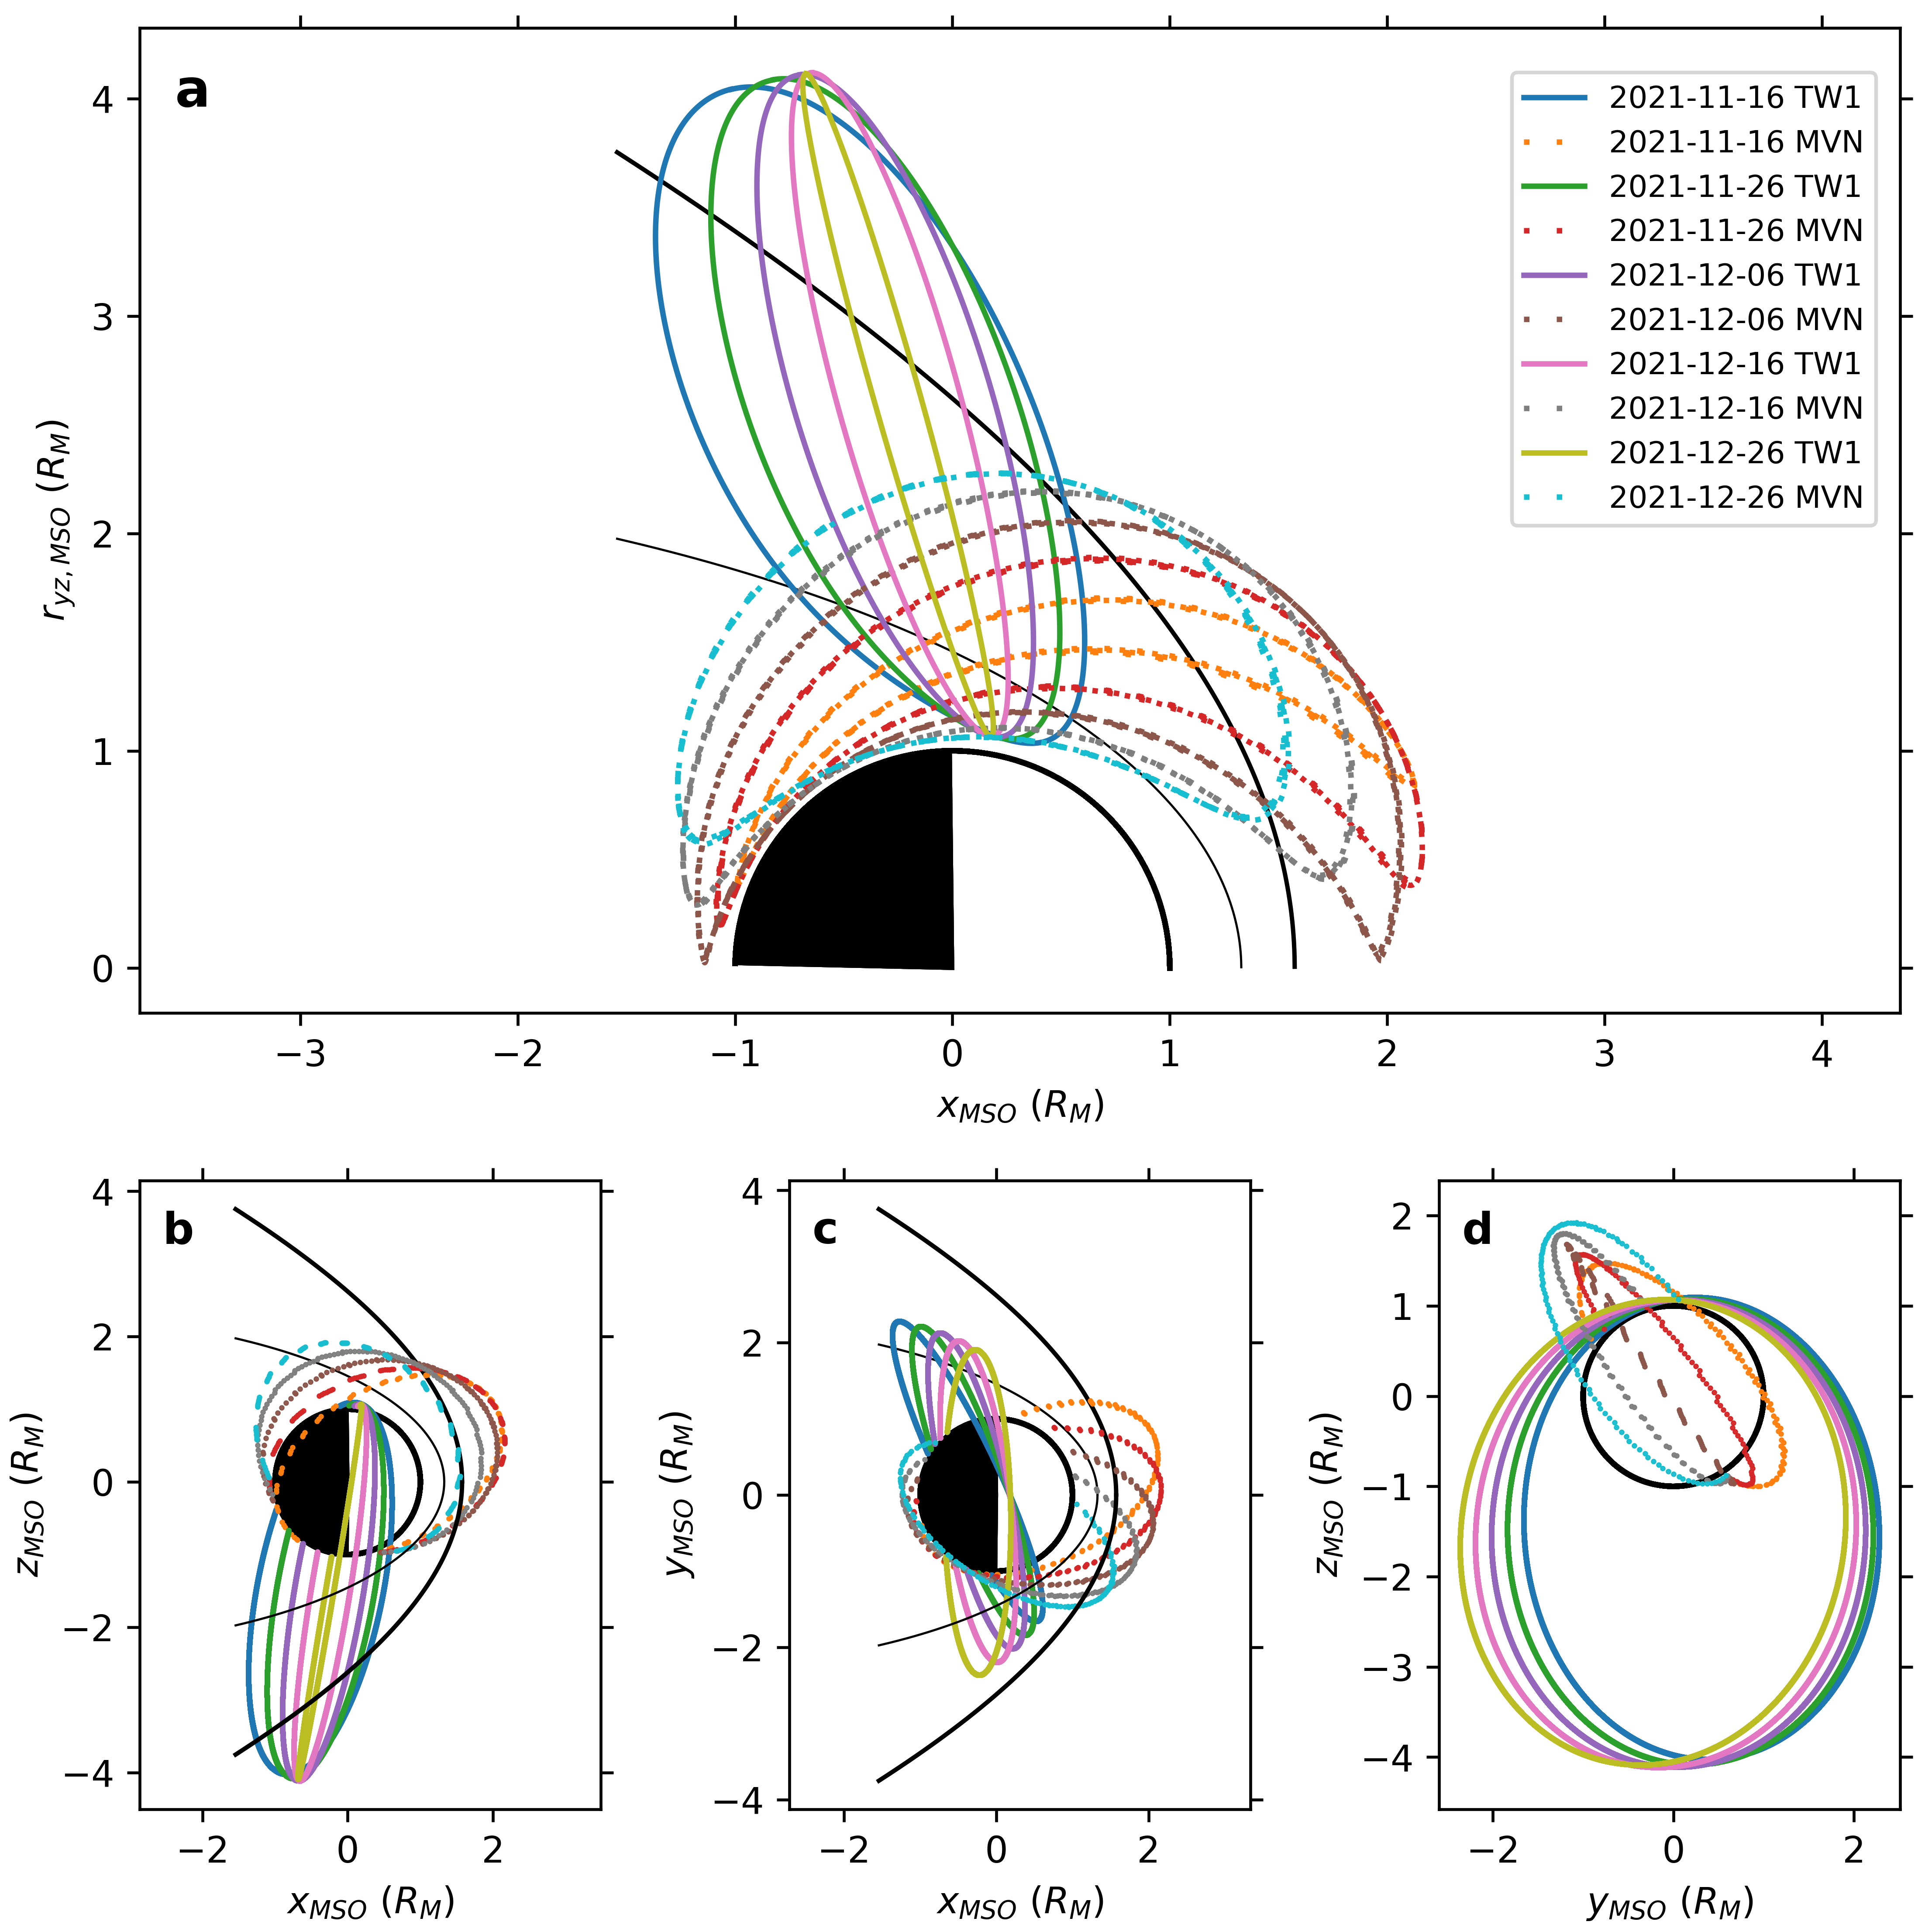
Tianwen-1 orbiter was running on a highly eccentric orbit with the periapsis of about 1.08 Mars radii () and the apoapsis of about 4.17 , and the orbital plane is highly inclined during November and December in 2021, as shown in Figure 1. During that period, the periapsis was right above the northern pole of Mars, the apoapsis far above the southern pole in the solar wind, and the orbital period was about 7.8 hr, with about 50% – 75% of time in solar wind. Thus, MOMAG mainly measured the magnetic field from solar wind to the MPR on the dawn-dusk side. Later, the inclination angle of the orbit will decrease to allow the orbiter detect the wake region of Mars. These data will help us understand the structure and evolution of Martian magnetic field environment and provide clues for ion escape. Since the Mars Atmosphere and Volatile EvolutioN (MAVEN, Jakosky et al. 2015a), which also carries a magnetometer (MAG, Connerney et al. 2015), is still working, the successful operation of MOMAG will make us for the first time to study Martian magnetic field environment from two points.
In this paper, we show and analyze the data during November 13 – December 31, 2021. In Section 2, we will describe the basic information and the current status of MOMAG, and present some measured magnetic field. Then we show the first results of MOMAG about Martian BS with the comparison with MAVEN/MAG data in Sections 3. In the last section, we summarize the paper.
2 In-flight Calibration and Performance
MOMAG contains two sensors mounted on a 3.19 m long boom. The outer sensor accommodates at the top of the boom and the inner sensor is 0.9 m away (see Liu et al. 2020 for details). Since the orbiter of Tianwen-1 does not have magnetic cleanliness control, the boom is actually not long enough to avoid the contaminations of the magnetic field from the orbiter. Thus, how to remove the magnetic interference based on the magnetic fields measured by the two separated sensors become pivotal.
The procedure of the mitigation of the orbiter’s magnetic field generally includes two steps, which is similar to the procedure applied on the magnetometer of Venus Express(Zhang et al., 2008; Pope et al., 2011). The first step is to remove the magnetic interference due to the operations of instruments. Such interferences behave as jumps in the magnetic field. If a real discontinuity in the solar wind passes the spacecraft, the amplitudes of the jump at the two sensors should be the same. However, since the distances of the two sensors from the instrument are different, an artificial jump will show different amplitudes at the two sensors, and therefore could be distinguished from real jumps. For these artificial jumps, we use the method of Pope et al. (2011) to remove them. The second step is to remove the static magnetic field of the orbiter and correct the offset of the fluxgate magnetometer. This step is mainly based on the property of Alfvénic waves, of which the magnetic field almost rotates in a plane without the change of magnitude(Wang and Pan, 2021). We process the raw data of MOMAG to the level 2 (or level C in China’s convention) data for scientific use through these steps. Based on the data of the first several months since November 13, 2021, when MOMAG started to formally operate, we iterate the procedure and reach the first version of the level 2 data, that have been released at the Planet Exploration Program Scientific Data Release System (http://202.106.152.98:8081/marsdata/). The data used in this paper and in our forthcoming papers will also be put on the official website of the MOMAG team at University of Science and Technology of China (USTC, http://space.ustc.edu.cn/dreams/tw1_momag/). A complete description of the in-flight calibration procedure as well as the demonstration of the reliability of the calibrated data is given in the separated paper by Zou et al. (2023).
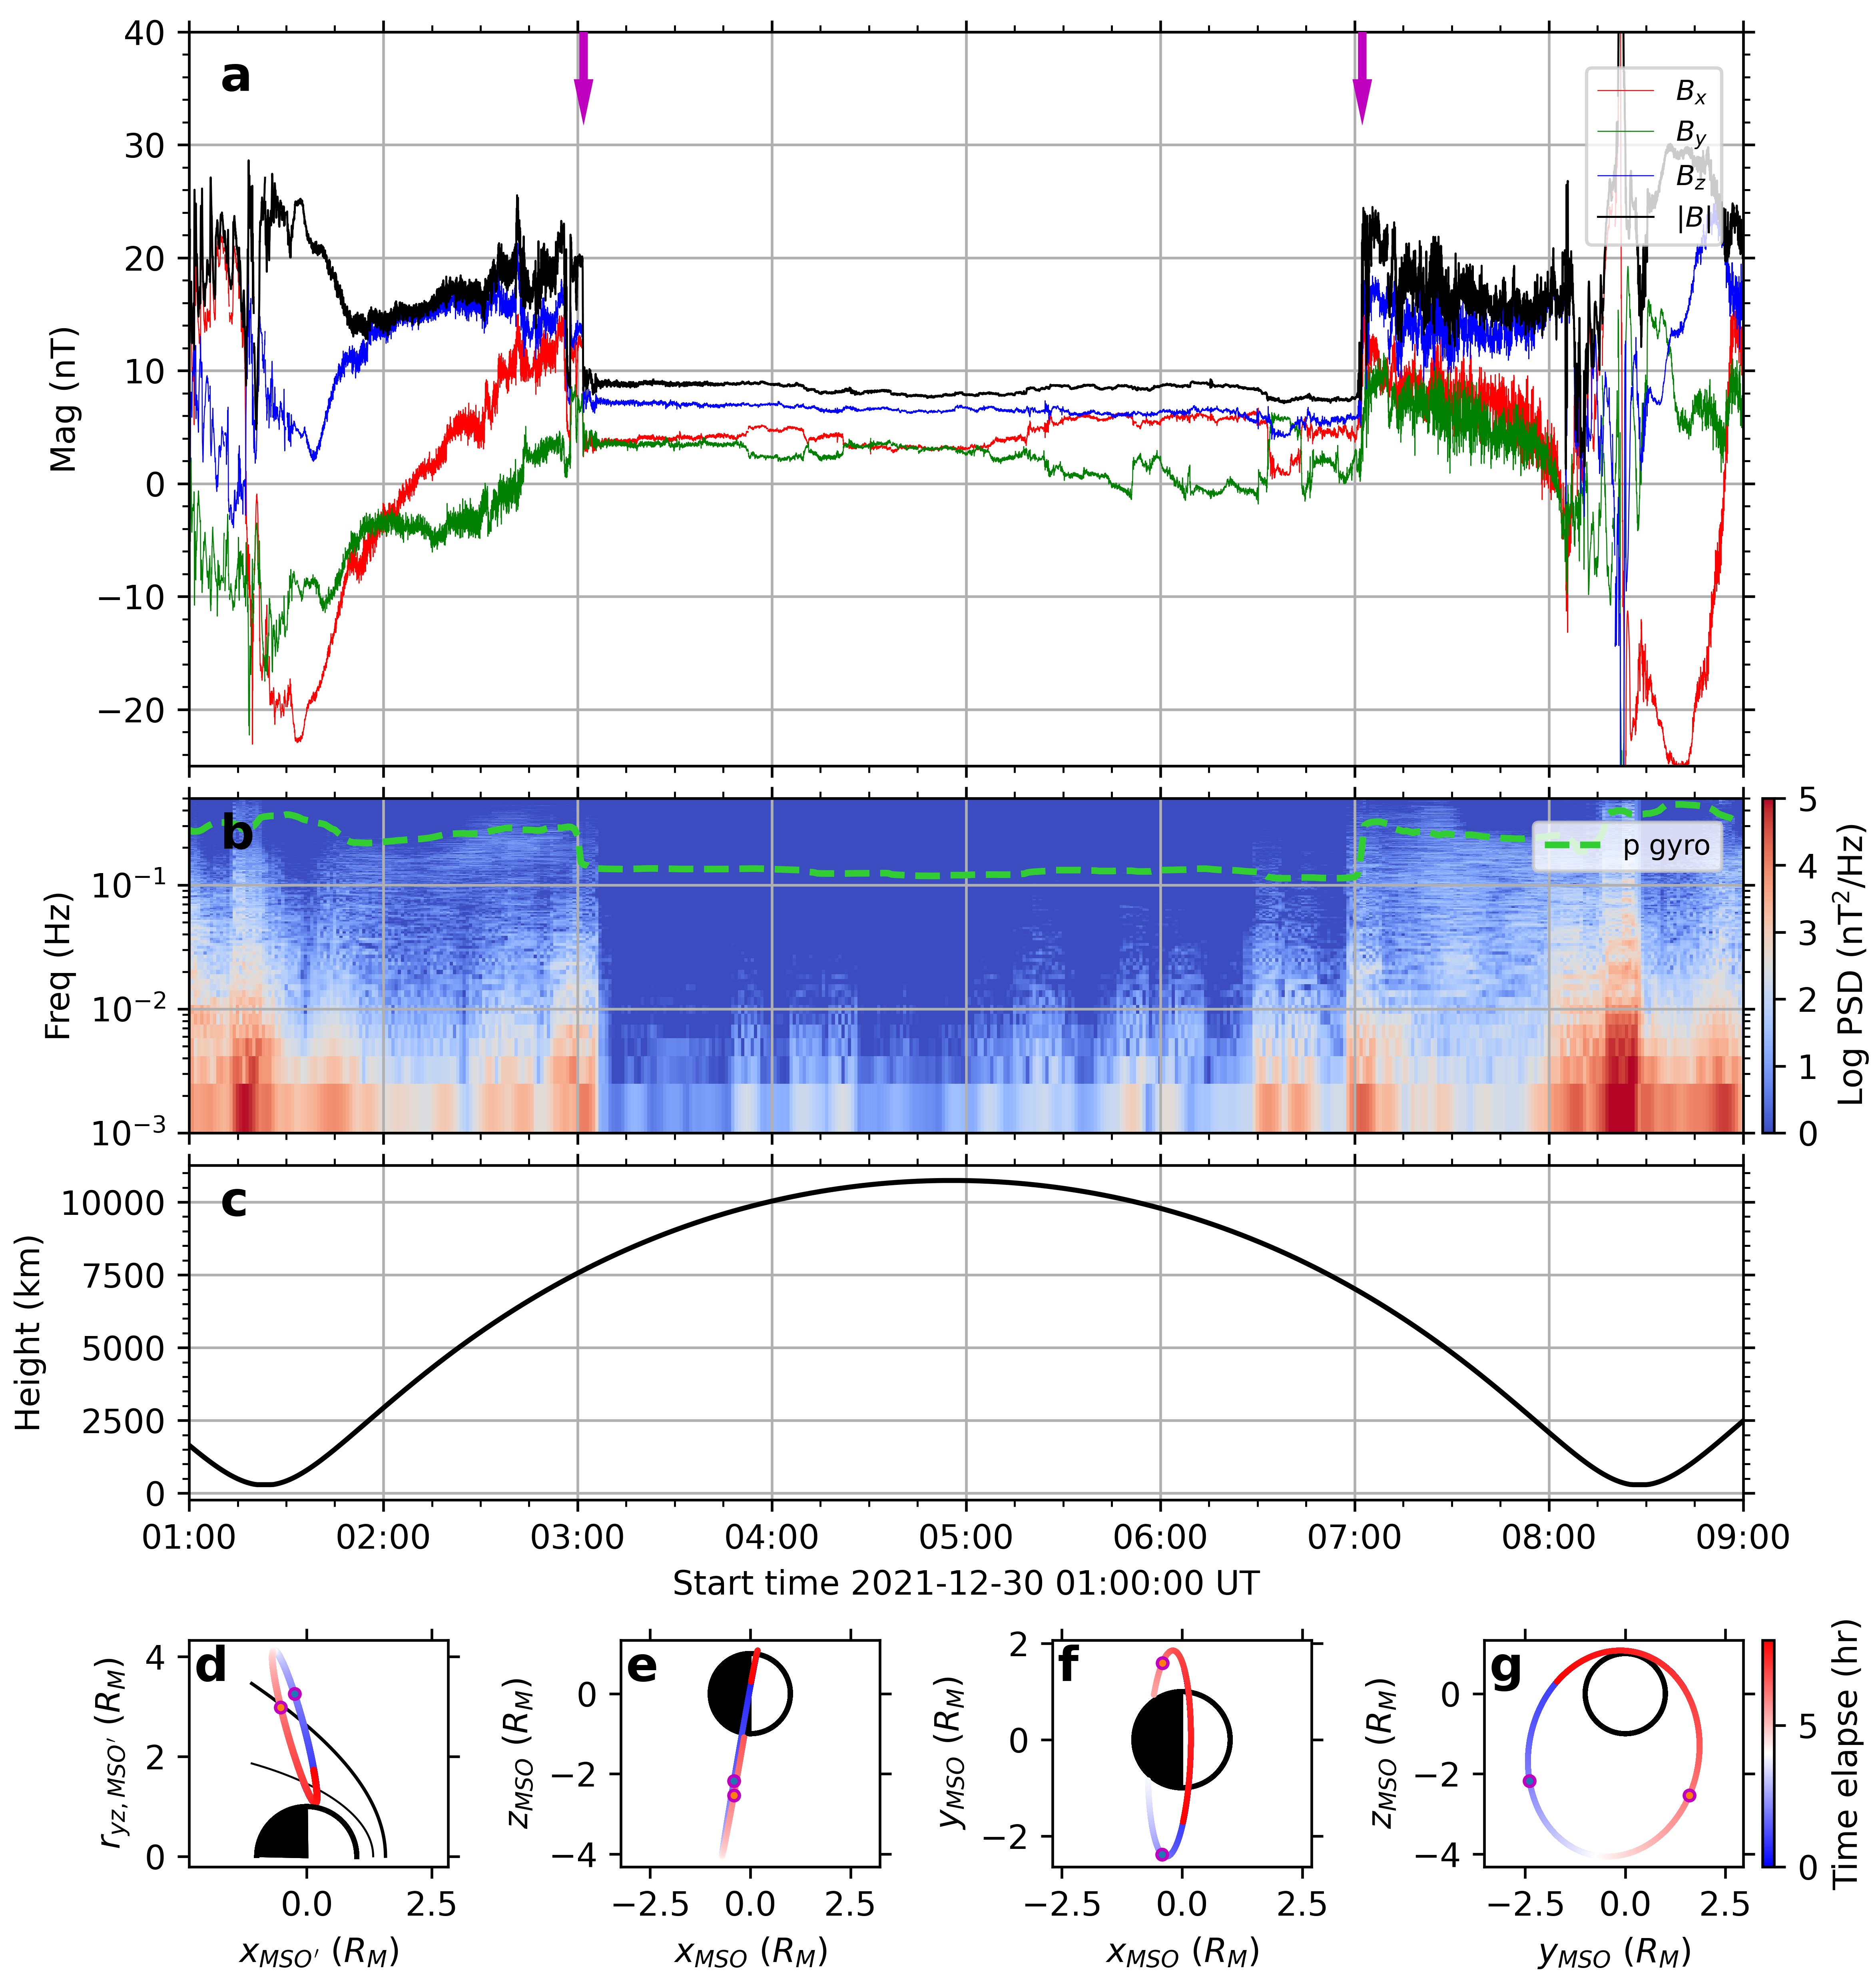
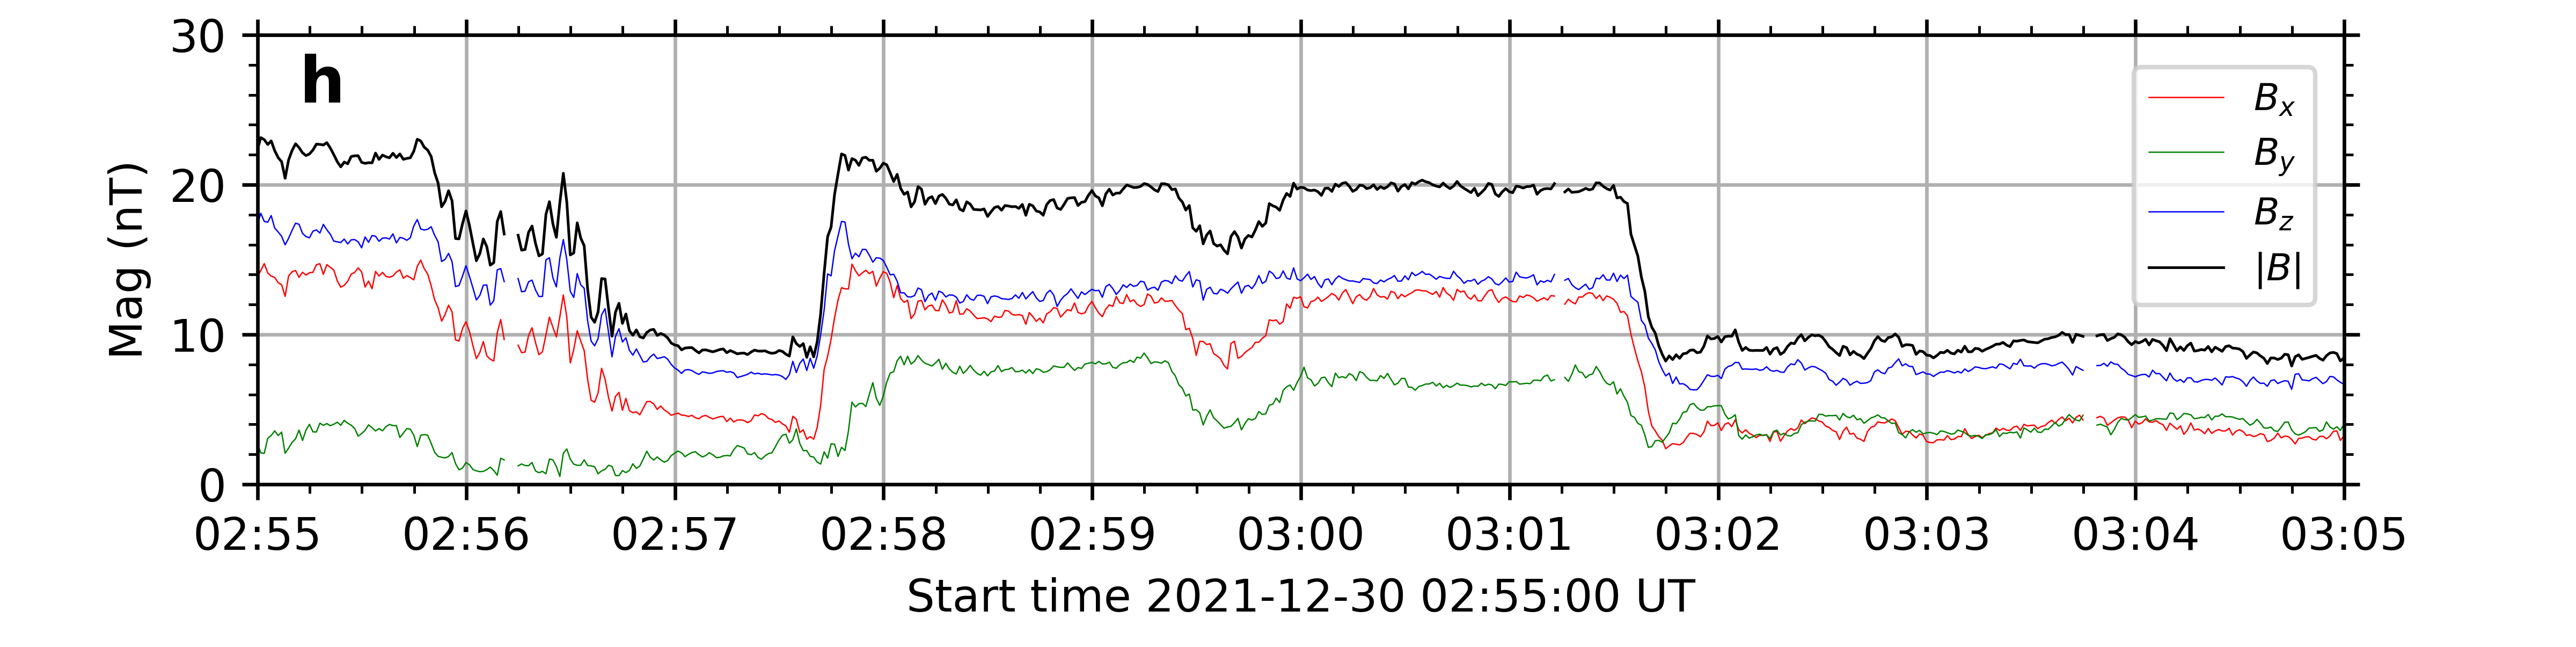
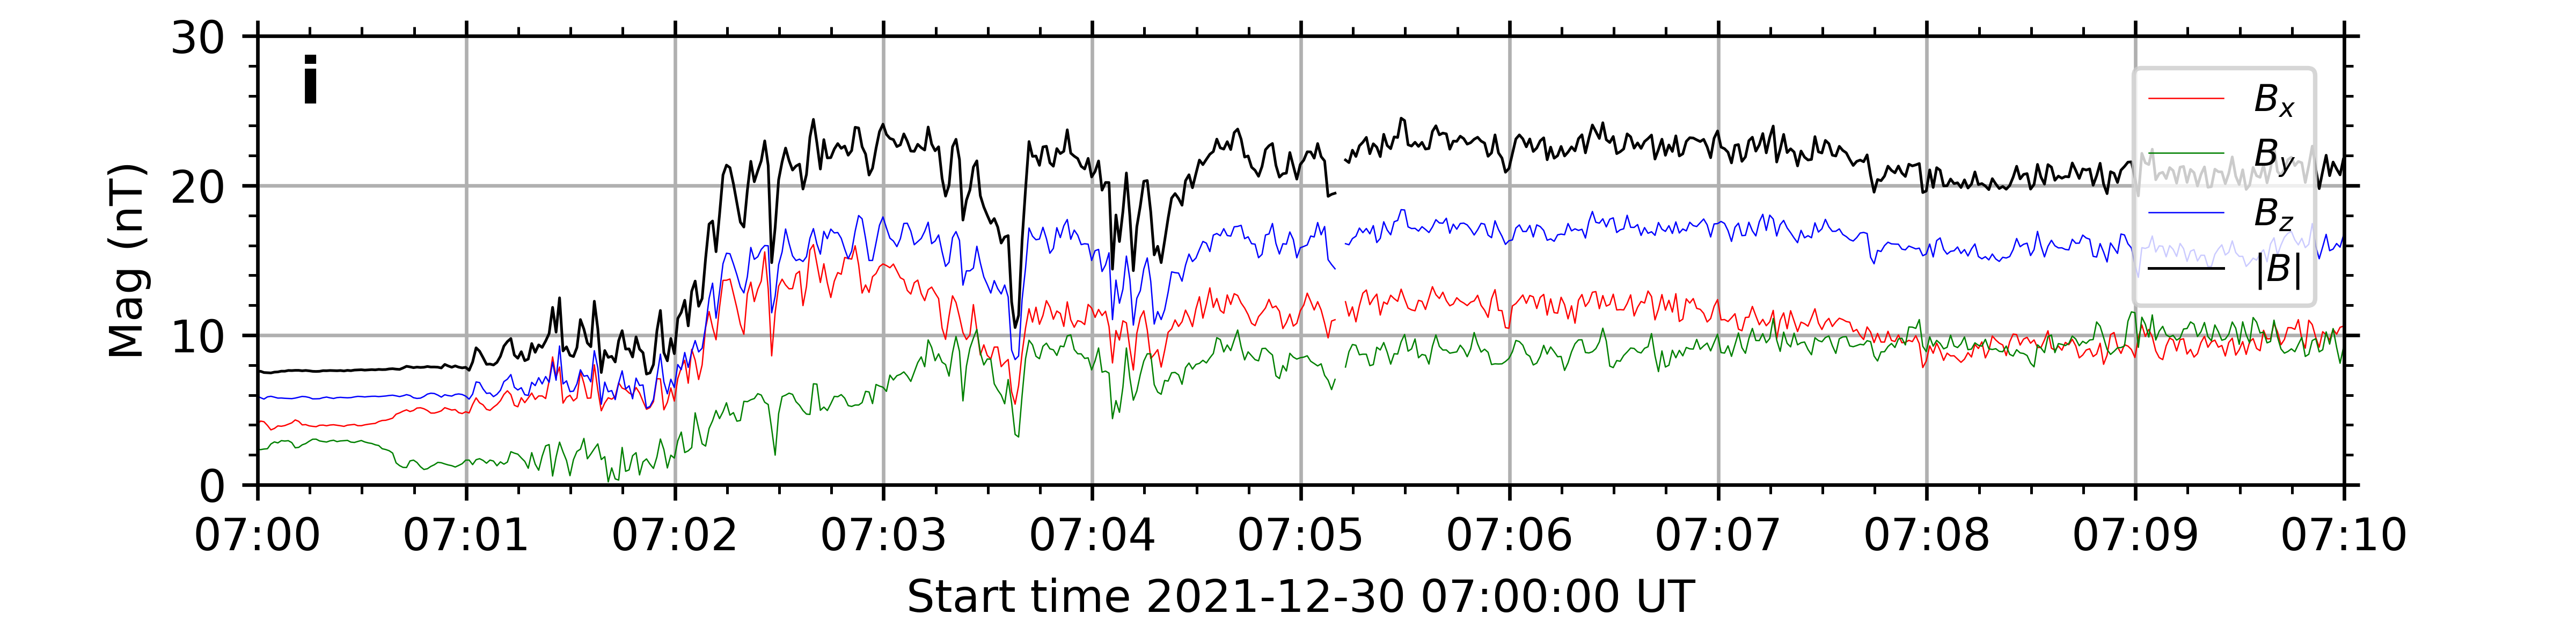
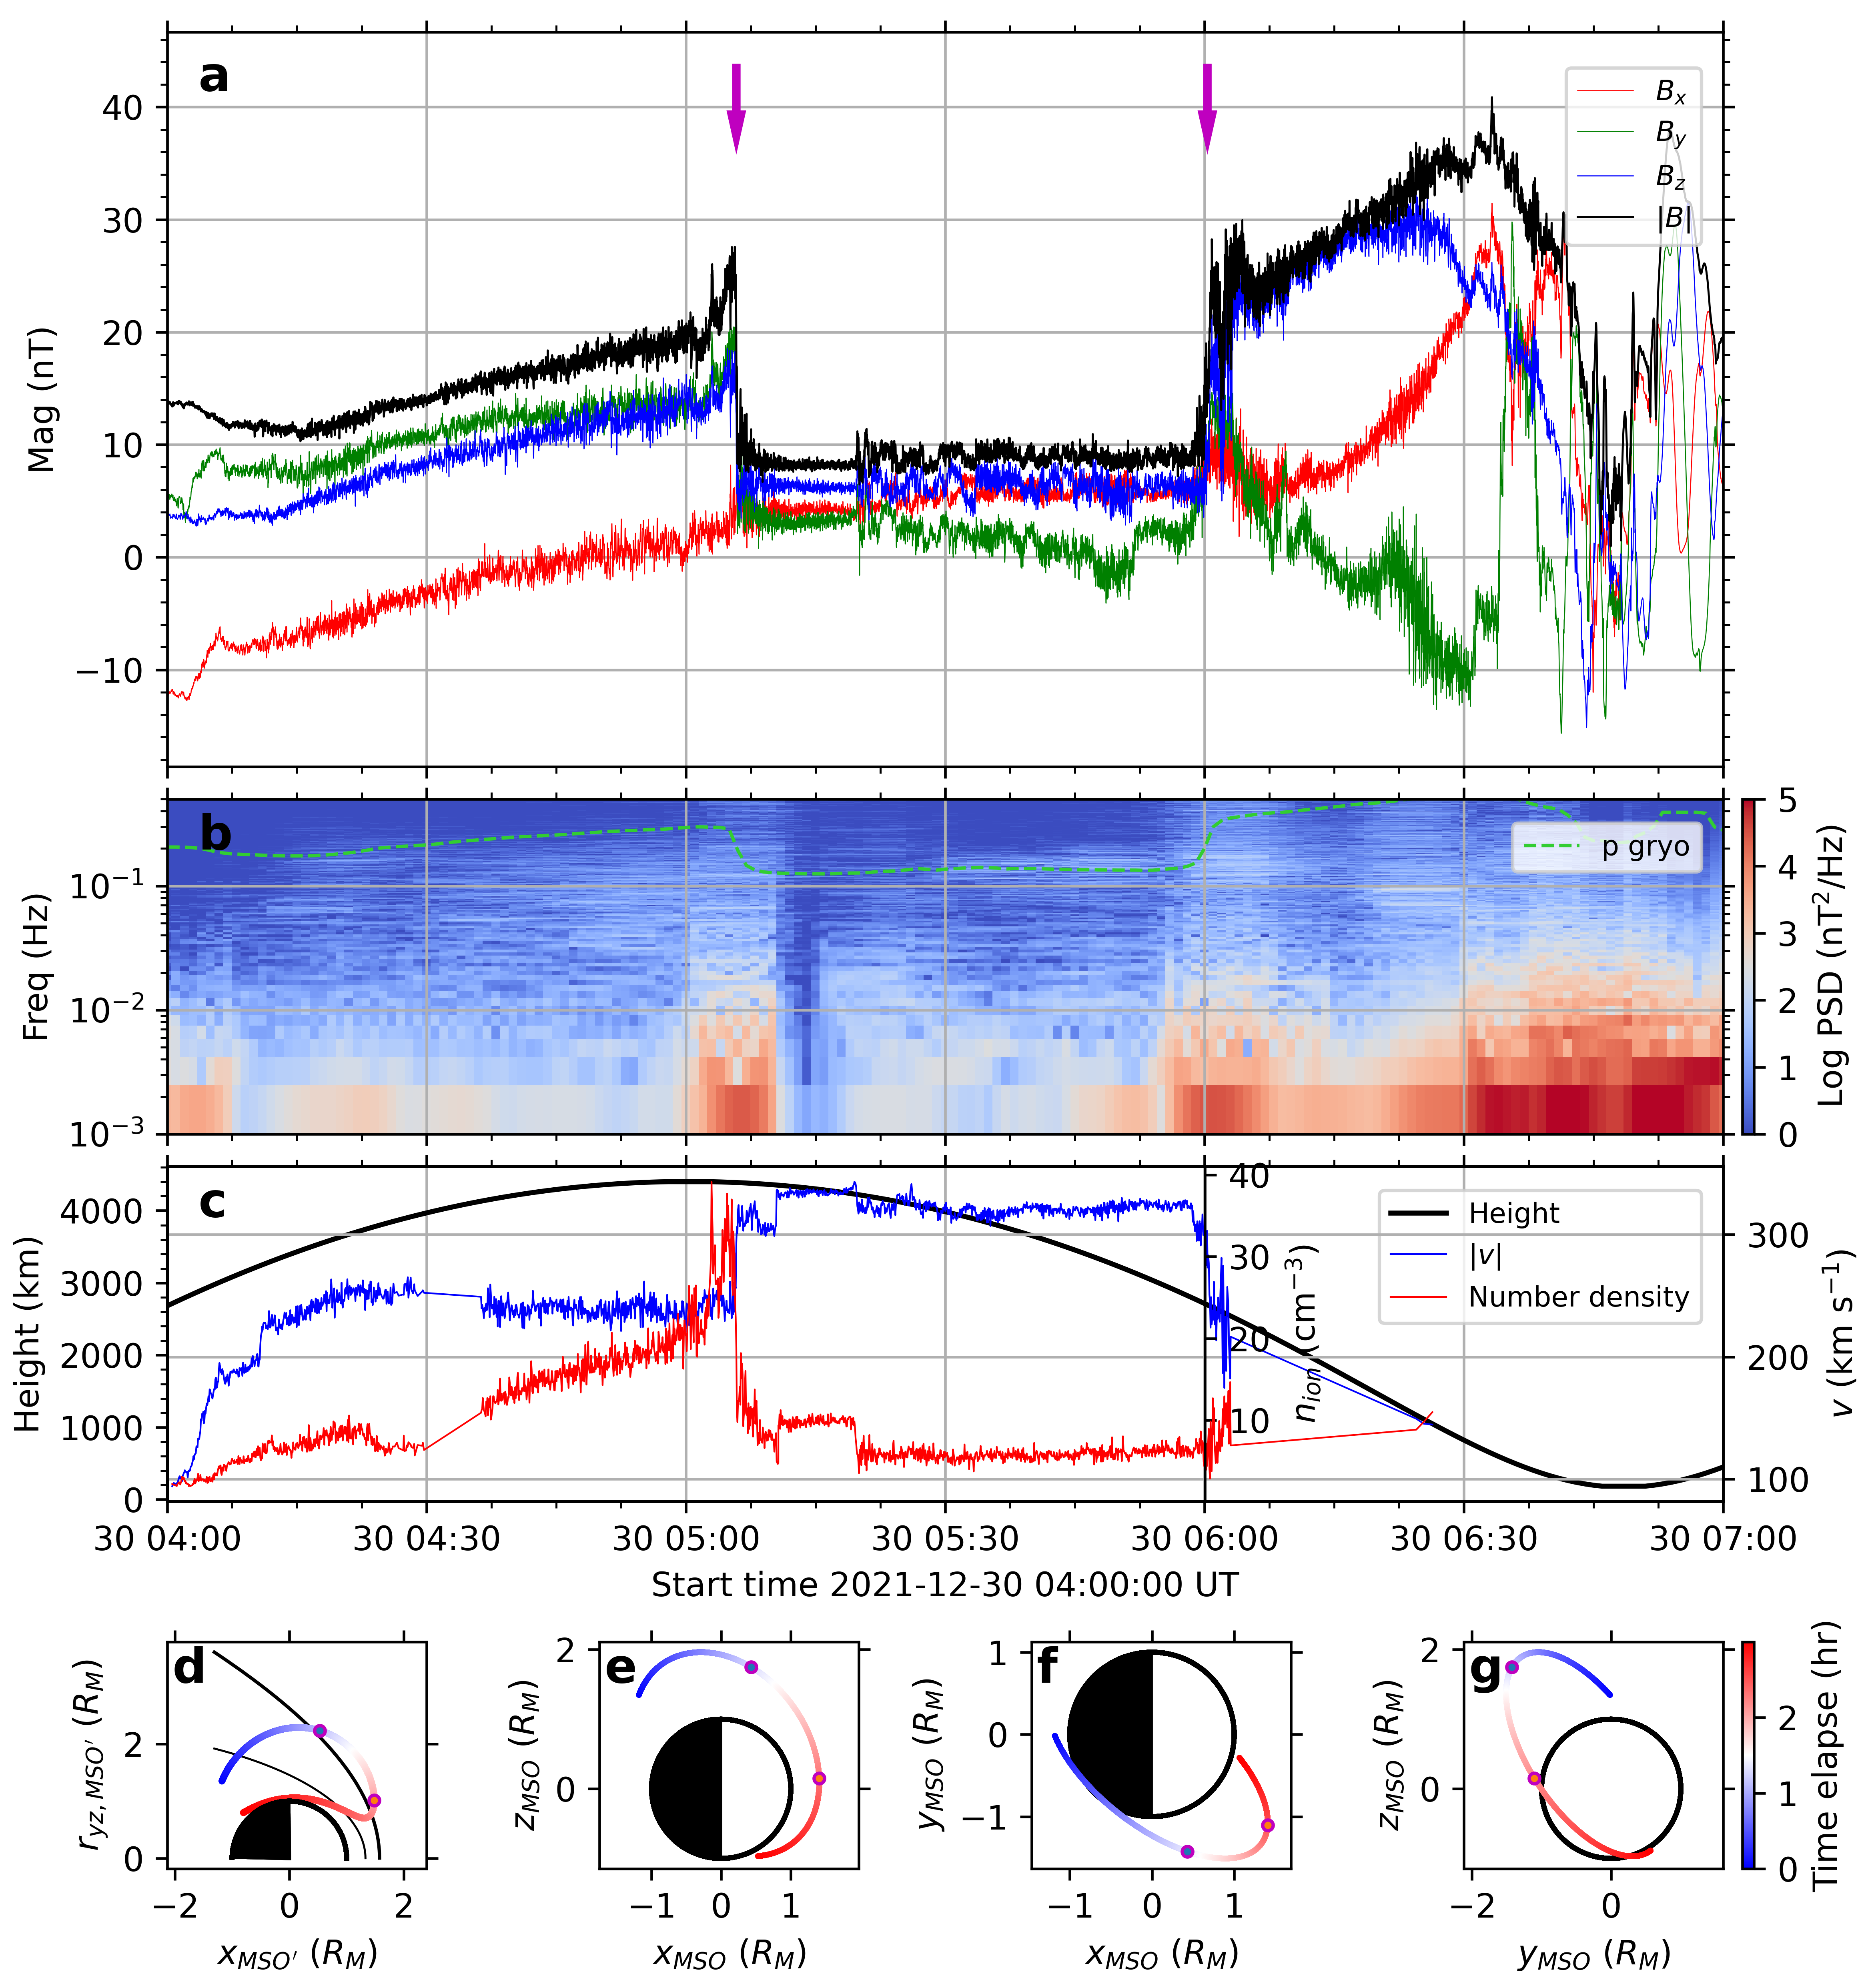
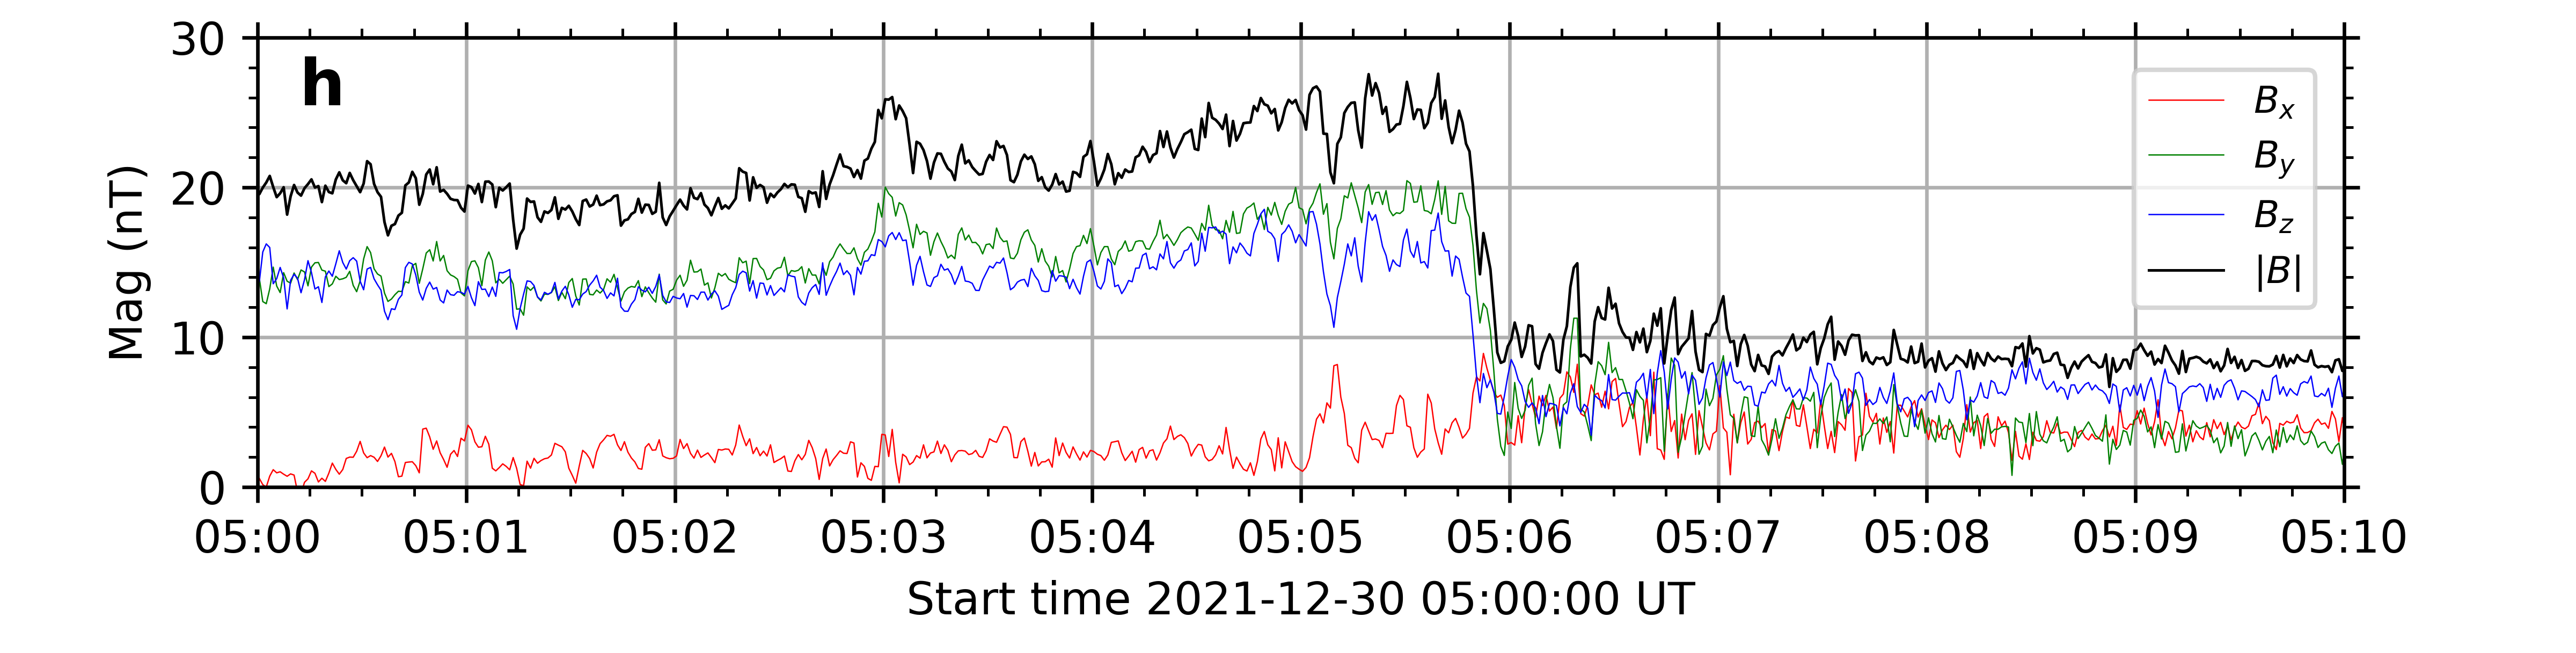
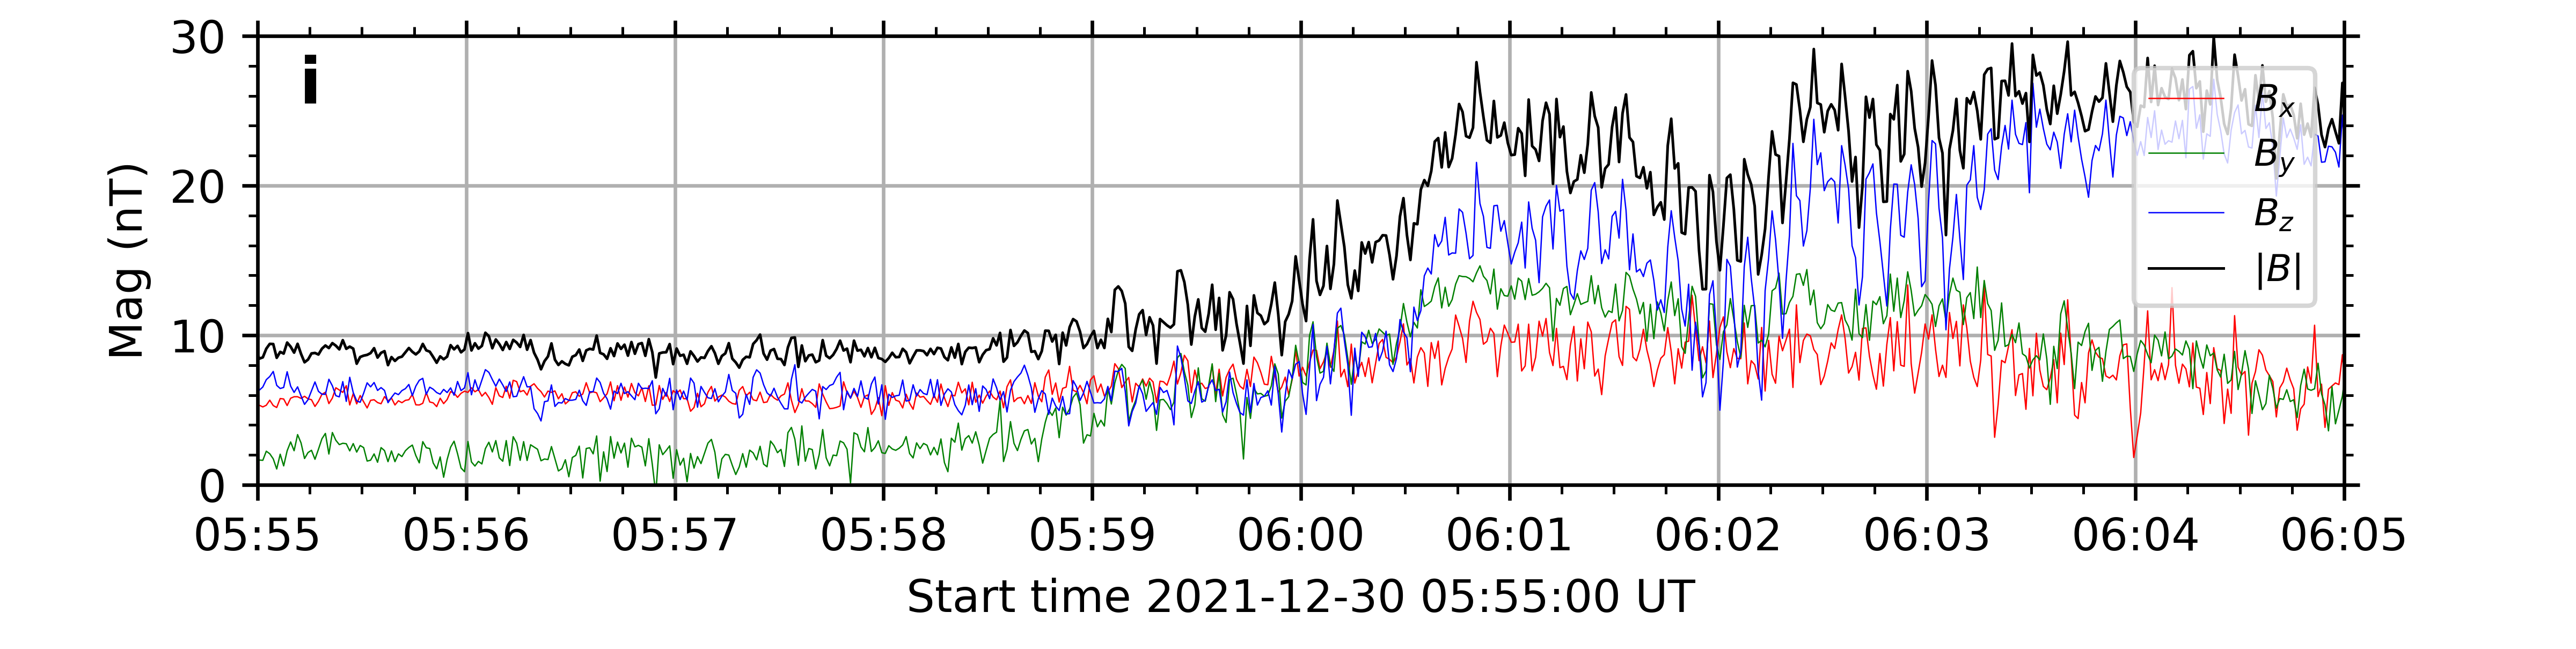
Figure 2a shows the magnetic field in the Mars-centered Solar Orbital (MSO) system measured by MOMAG during 01:00 – 09:00 UT on 2021 December 30. The orbiter was running in the magnetosheath before 02:55 UT, and at around 03:01:40 UT the orbiter crossed the BS where the amplitude of the magnetic field discontinuity was more than 10 nT (Fig.2h). After about four hours, the orbiter crossed the BS again where the amplitude of the magnetic field discontinuity was about 16 nT (Fig.2i). Around 08:20 UT, the orbiter even crossed the MPB. The BS during the second crossing was obviously stronger than that during the first crossing. The reason is that the BS was compressed during the second crossing, which can be seen from Figure 2d–g that the two BS crossings were on the south, the first crossing was outside and further away from the modeled averaged BS (Edberg et al., 2008) than the second BS crossing.
If we look into the details of the first BS crossing as shown in Figure 2h, it could be found that the orbiter crossed out the BS around 02:56:30 UT and crossed in again at 02:57:45 UT before it finally entered the solar wind. The magnetic field changes during these preceding crossings suggest that the BS was slightly stronger than the BS at 03:01:40 UT. This could also be explained as the compression of the BS. During these crossings, the orbiter was moving away from Mars as the indicated by the color-coded orbit in Figure 2d. The locations of the preceding crossings were closer to Mars than that of the final crossing at 03:01:40 UT.
The magnetic fields in the solar wind stayed around 9 – 10 nT, and were much less fluctuated than those in the magnetosheath. Figure 2b displays the power spectral density of the magnetic field. It is generated by using a 10-min window and 1-min running step. It can been seen that the solar wind was indeed quiet except at very low frequency, whereas in the magnetosheath the magnetic fluctuation was enhanced. Behind the bow shock, weak magnetic waves right below proton gyro-frequency appeared. In the solar wind, a small structure can be found between 05:15 and 06:35 UT. Though the total magnetic field only slightly enhanced, the most notable change occurred for , which decreased from about 4 nT to zero twice.
For comparison, Figure 3 shows the MAVEN measurements of the magnetic field and solar wind during 04:00 – 07:00 UT on the same day. MAVEN had a quite different orbit, of which the orbital period was shorter than 4 hours (Fig.3c–g). Within one hour, it crossed the BS twice, but the positions of the crossings were both closer to the shock nose than those of Tianwen-1. Since the two crossings stay close to the same modeled BS, suggesting the solar wind conditions during the two crossings are almost the same, the amplitudes of their magnetic field discontinuities were similar. We also show the detailed BS crossings in Figure 3h and i. No multiple BS crossings happened at MAVEN, probably suggesting the different behavior of BS at different locations.
Though the solar wind region that MAVEN detected was far away from that by Tianwen-1, a similar structure could be found between 05:20 and 05:55 UT (Fig.3a), which corresponds to the first dip recorded in MOMAG. During that time, the solar wind speed was about 310 km s-1 and the number density of protons was about 7 cm-3 (see the blue and red lines in Fig.3c). Different from MOMAG data, the magnetic field at MAVEN was highly fluctuated with a notable frequency at the proton gyro frequency (Fig.3b). This might be because MAVEN closer to Mars than Tianwen-1 when they fly in the solar wind, and the particles escaping from Martian atmosphere more easily interact with the solar wind and interplanetary magnetic field to generate such fluctuations at a closer distance. However, according to the statistical study of MAVEN data (Ruhunusiri et al., 2017), such a pattern seems not to be evident and needs further validation.
3 Bow Shock Crossings
Bow shock is one of the notable features in the Martian space environment. Its shape may reflect the upstream solar wind conditions and solar EUV intensity and the interaction processes between solar wind and Martian atmosphere (Mazelle et al., 2004; Ramstad et al., 2017; Hall et al., 2019). Thus, studying Martian BS is our first choice to show the science results of MOMAG. During 2021 November 13 – December 31, we recognize 158 BS crossings from MOMAG data by manually checking the magnetic field strength variation and the fluctuation level which is measured by the standard deviation of magnetic field within one minute. In principle, there should be more crossings, but Tianwen-1 mostly crossed the flank of the BS where the characteristic of a shock may be too weak to be recognized. During the same period, we recognize 454 BS crossings from MAVEN/MAG data.
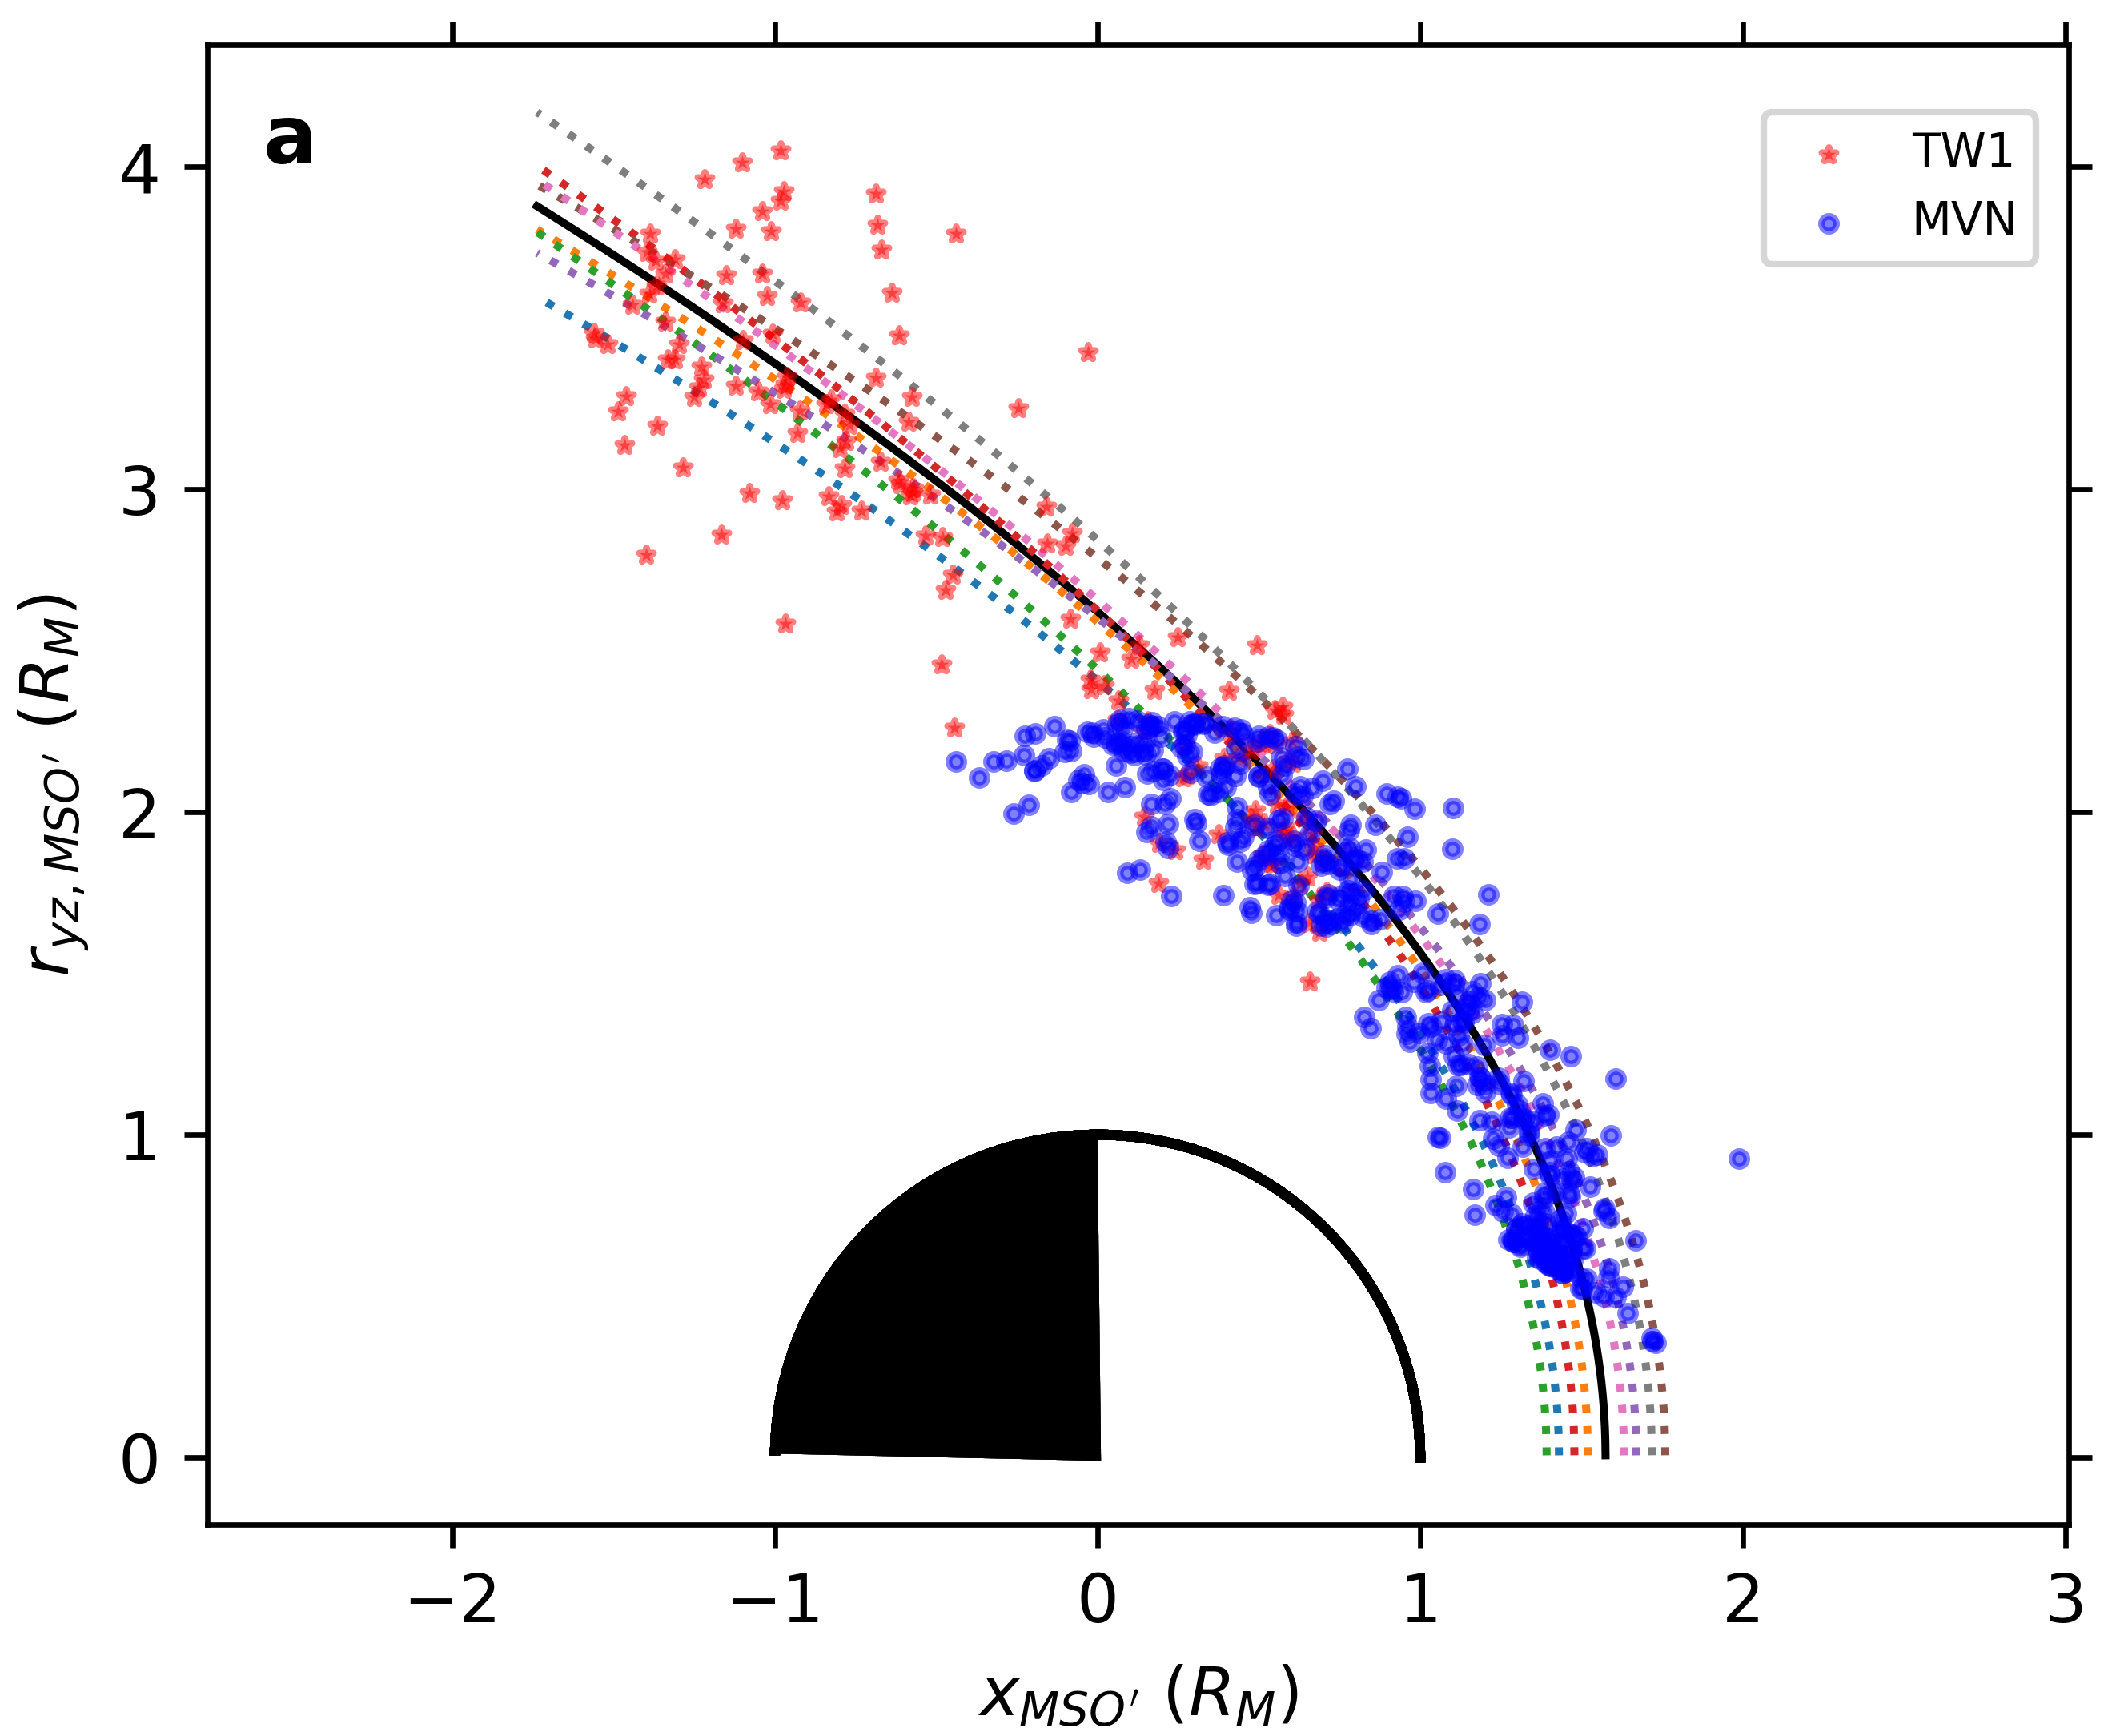
Figure 4a shows all of the BS crossings in the aberrated MSO coordinates (MSO coordinates are rotated by about the -axis to reduce the effect of the Mars orbital motion on the solar wind flow direction). Since the spatial coverage of the crossings is not wide enough, we do not try to fit these crossings to find the best-fit BS model, but instead to compare with the previously established BS model (Edberg et al., 2008). We can find in the figure that the crossings statistically match the model fairly well.
Martian BS position and global shape were derived from many single crossings. Now we can check this based on the joint magnetic field observations from Tianwen-1/MOMAG and MAVEN/MAG. By assuming that the BS remains unchanged within 2 minutes, we use two crossings of Tianwen-1 and MAVEN within 2 minutes to exam the BS global shape. We choose 2 minutes because the upstream solar wind conditions that determine the BS position and shape, i.e., the fast-mode Mach number and dynamic pressure, are usually stable within this time-scale as revealed by the following analysis.
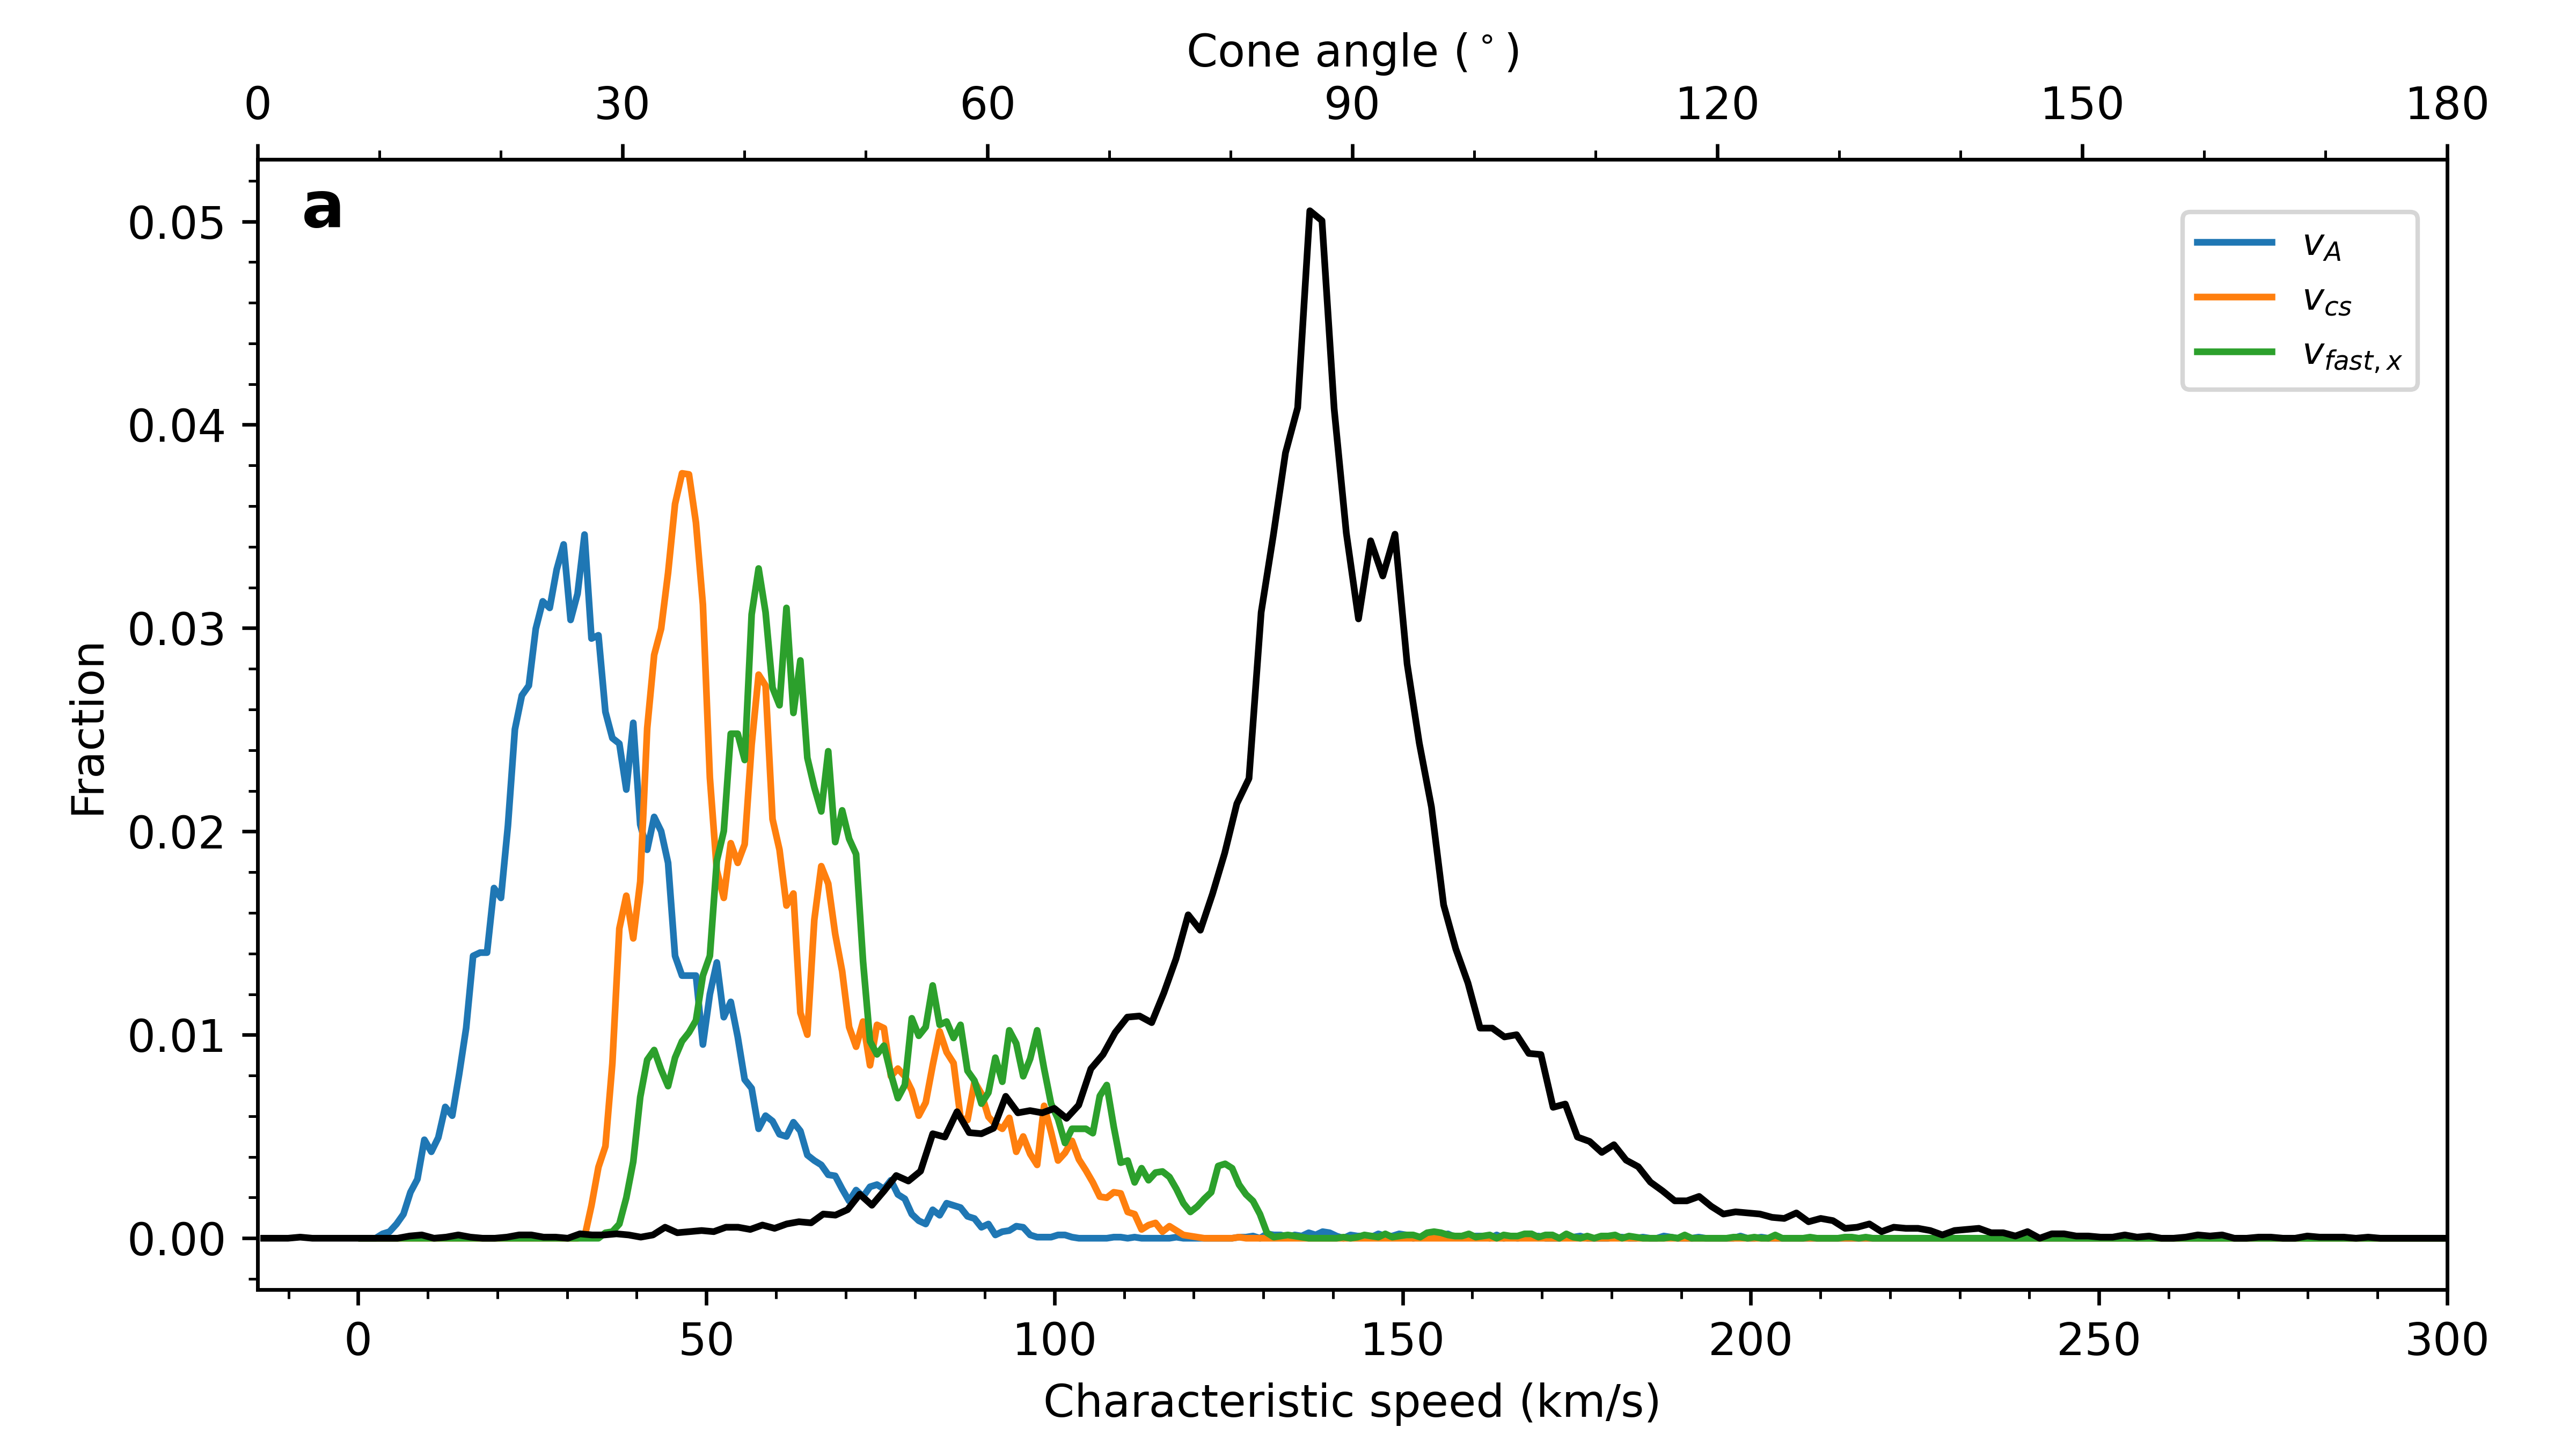
Figure 5a shows the characteristic speeds in the solar wind, which are calculated every minute based on the MAVEN/SWIA (Halekas et al., 2017) measurements of the solar wind velocity, ion density and temperature and MAVEN/MAG measurements of magnetic field during November 13 – December 31, 2021. The Alfvén speed, , ranges from almost zero to more than 100 km s-1 with the peak around 30 km s-1. Since Alfvén wave propagates along the magnetic field, if we take the direction of magnetic field, that mostly concentrates around 86∘ with respect to the -axis in MSO (as indicated by the black line in Fig.5a), into account, the Alfvén speed along the -axis approaches zero. The sound speed, , is overall larger than the Alfvén speed, and is rarely smaller than 30 km s-1. The fast-mode magnetoacoustic speed along the -axis, , is overall larger than both the Alfvén speed and the sound speed with its peak around 60 km s-1.
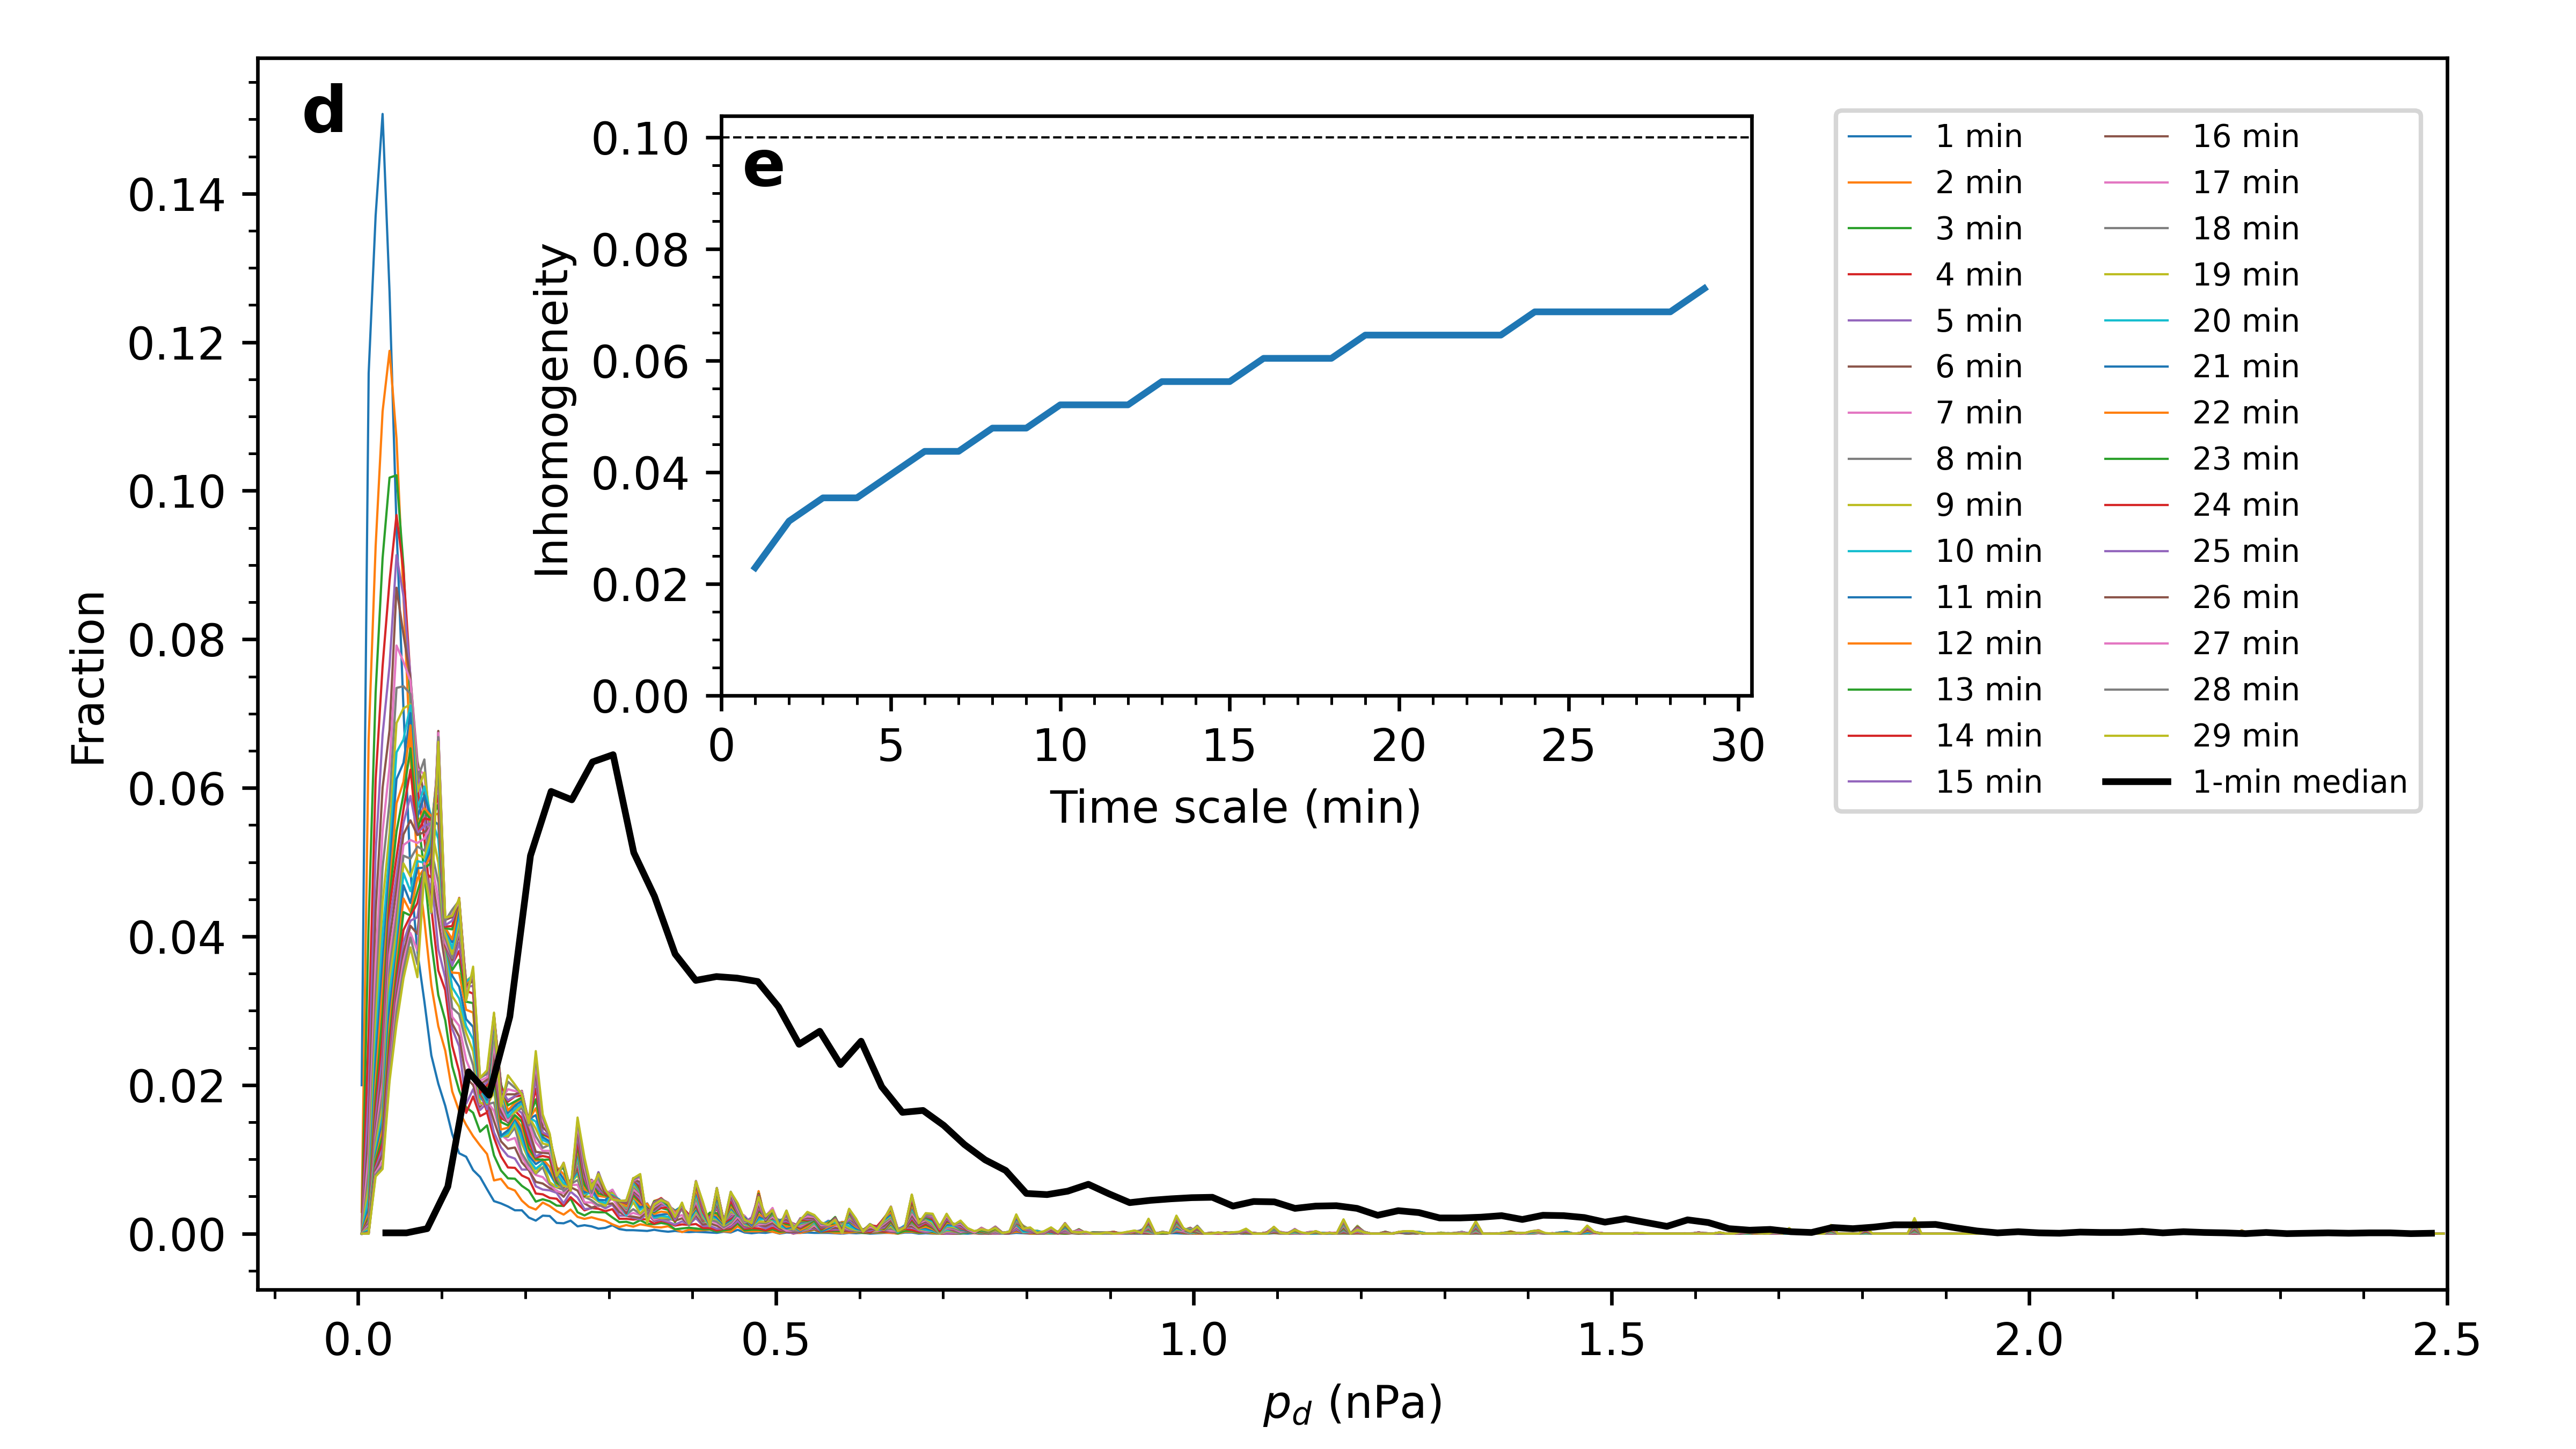
Since the solar wind propagates along the -axis and is the fastest among these characteristic speeds, the fast-mode Mach number in -axis, , is calculated. The black line in Fig.5b shows the median value of within one minute during the period of interest. We can read from the line that the dynamic range of is about 7, i.e., ranging from about 2 to 9 with the peak at about 6.2. We further exam the inhomogeneity of by calculating the difference between the maximum and minimum values of within a given time scale varying from one minute to 29 minutes as shown by the color-coded thin lines in Figure 5b. Each line presents the distribution of the difference or the range of the in a given time scale. We can see that these distributions extend toward large values with increasing time scales, suggesting the enhancement of the inhomogeneity in terms of . Then we determine the middle value of for each distribution, at which the distribution is divided equally, and define the inhomogeneity as the ratio of the middle value to the dynamic range of . The dependence of the inhomogeneity on the time scale is plotted in Figure 5c. If considering that inhomogeneity of 0.1 is an acceptable level for a stale solar wind, we may conclude that the time scale of stable solar wind is about 2 minutes in terms of .
The similar analysis is applied on the solar wind dynamic pressure, , as shown in Figure 5d and e. The dynamic pressure also shows a single-peak distribution ranging from about 0.01 nPa to nearly 2.5 nPa with the peak around 0.3 nPa. The inhomogeneity of also increases as the time scale increases. By setting the dynamic range of to be 2, we find that the inhomogeneity is less than 0.1 even at the time scale of 30 minutes. This suggests that is much more dynamic than in the upstream of Martian BS.
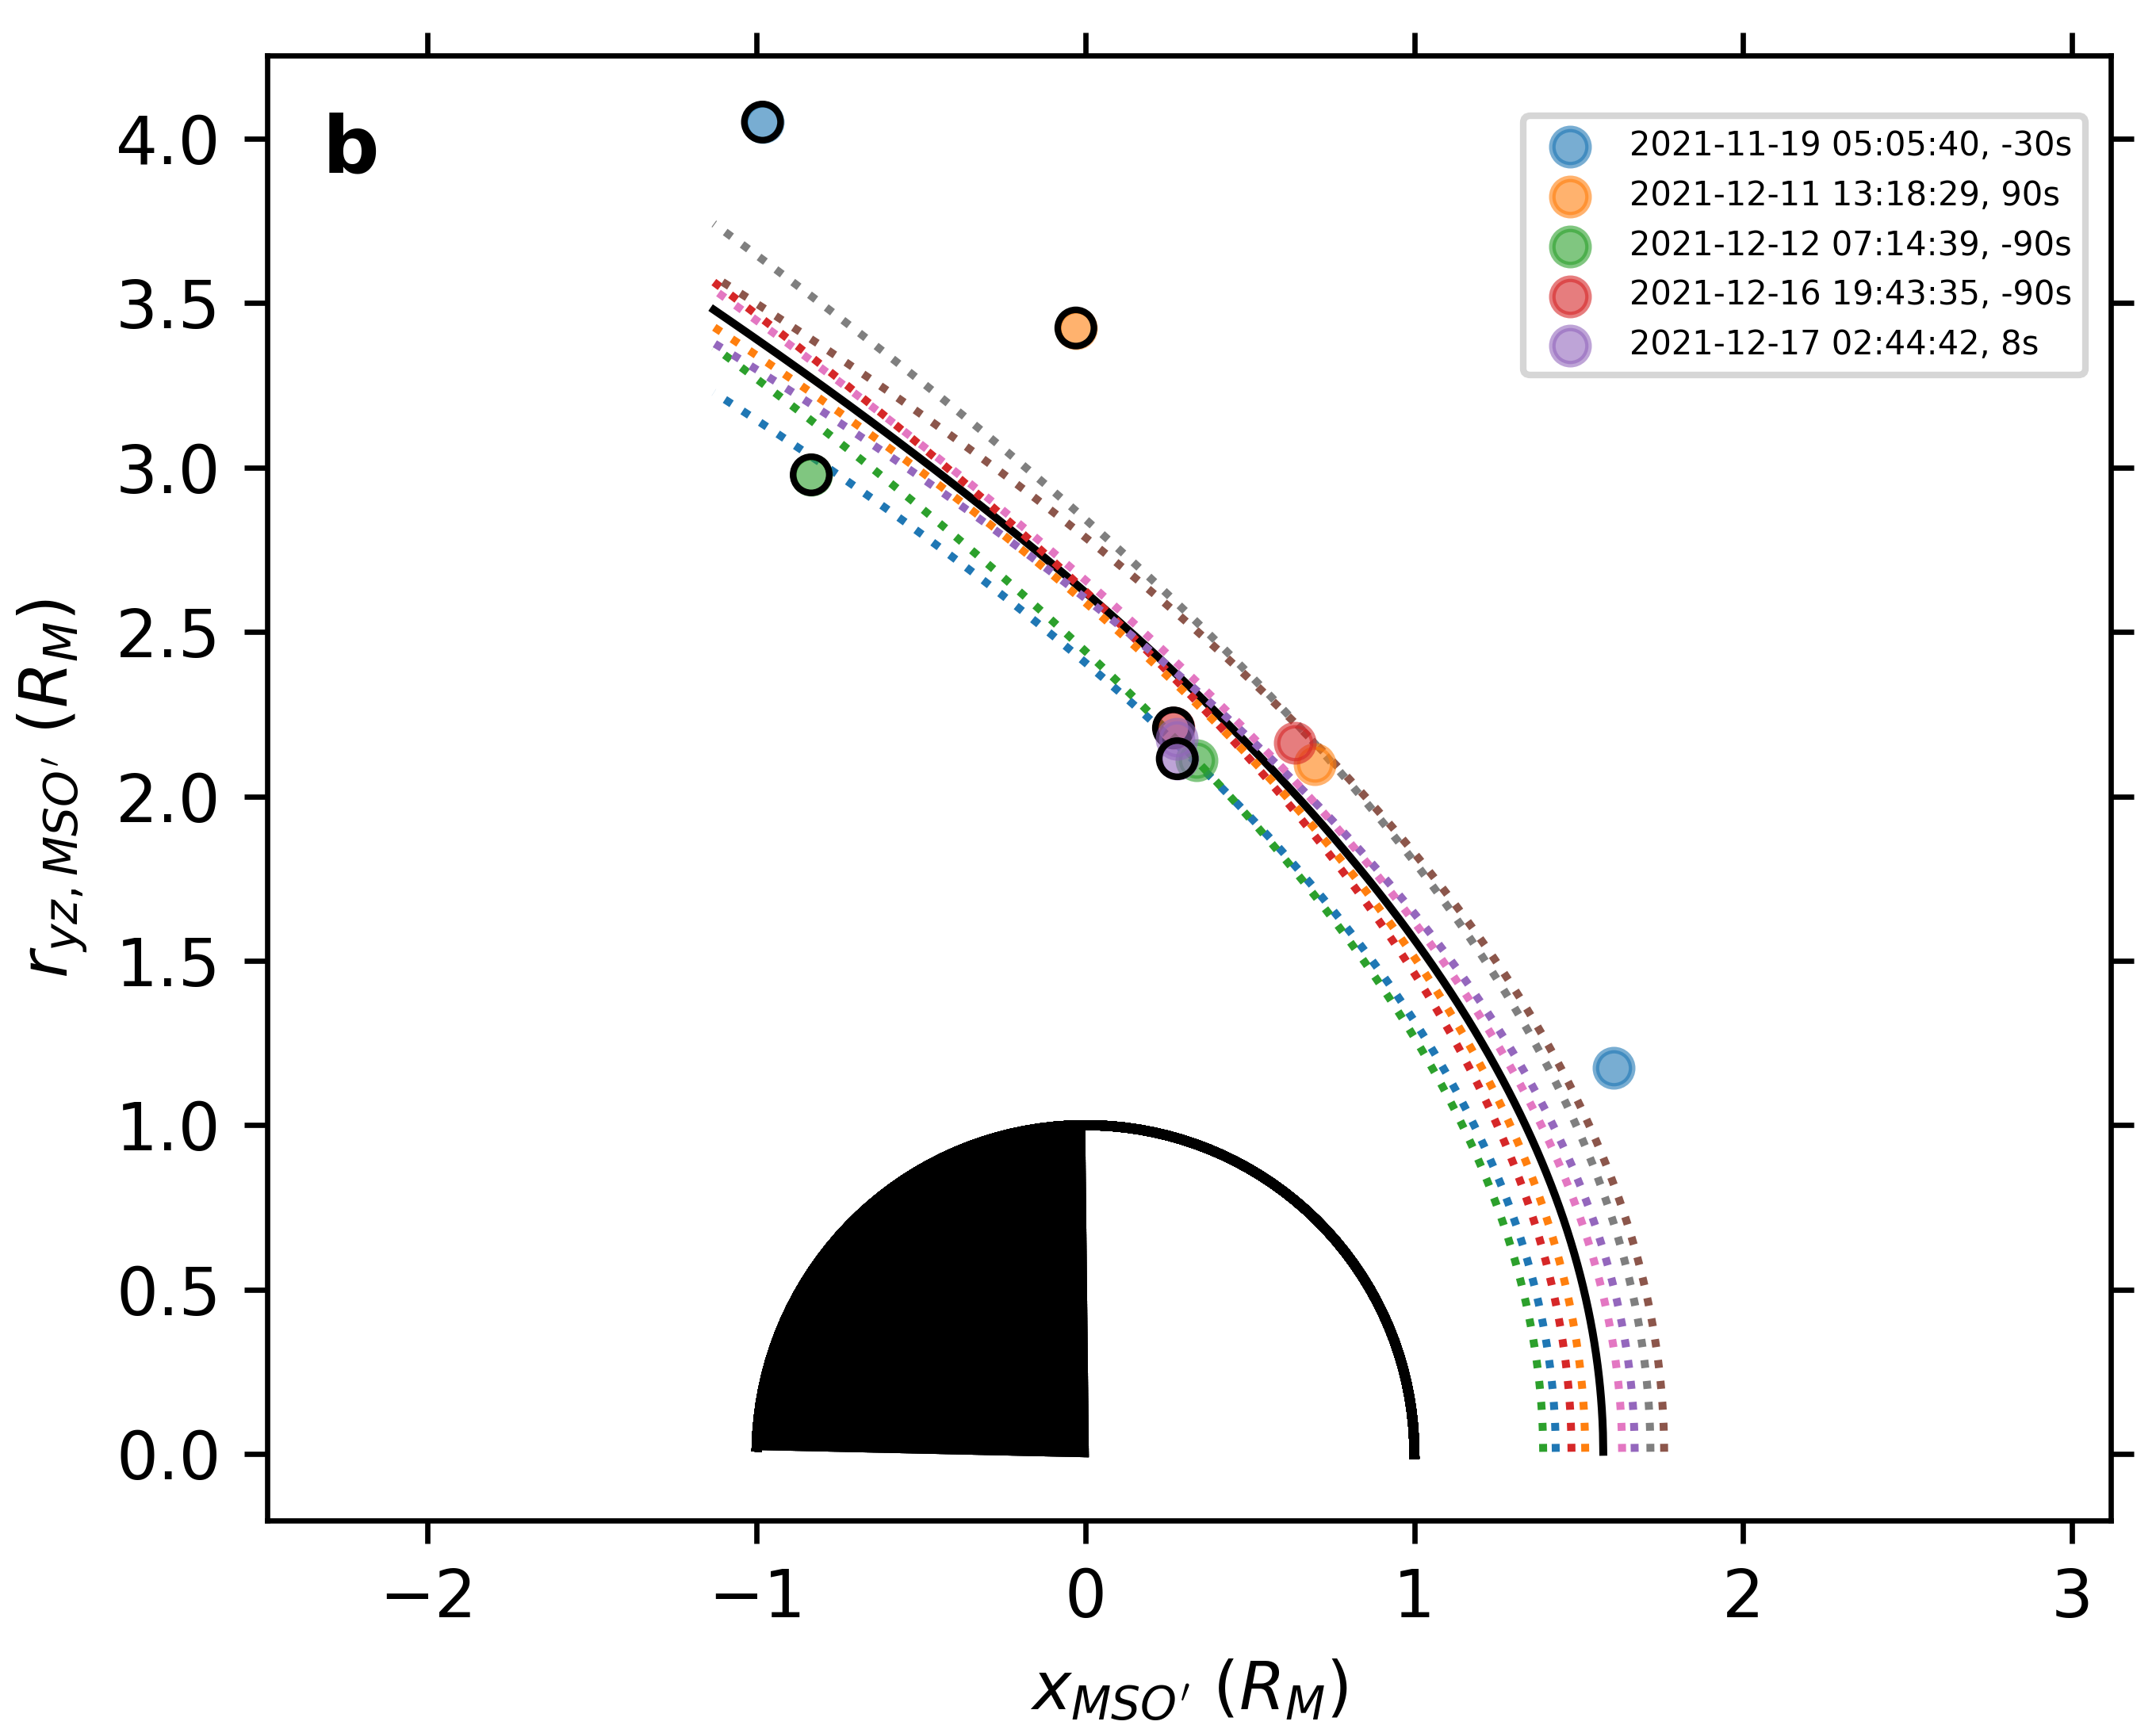
Based on the above analysis, we search the BS-crossing pairs of Tianwen-1 and MAVEN within 2 minutes in the period of interest, and plot the results in Figure 4b. A total of 5 pairs are found. A first impression is that the global shape of the BS is slightly more flattened than the model. But this just reflects the south-north asymmetry of the Martian BS(e.g., Edberg et al., 2008; Dubinin et al., 2008), as Tianwen-1 orbiter crossed the southern flank of the BS, while MAVEN crossed the BS at low latitude on the northern hemisphere.
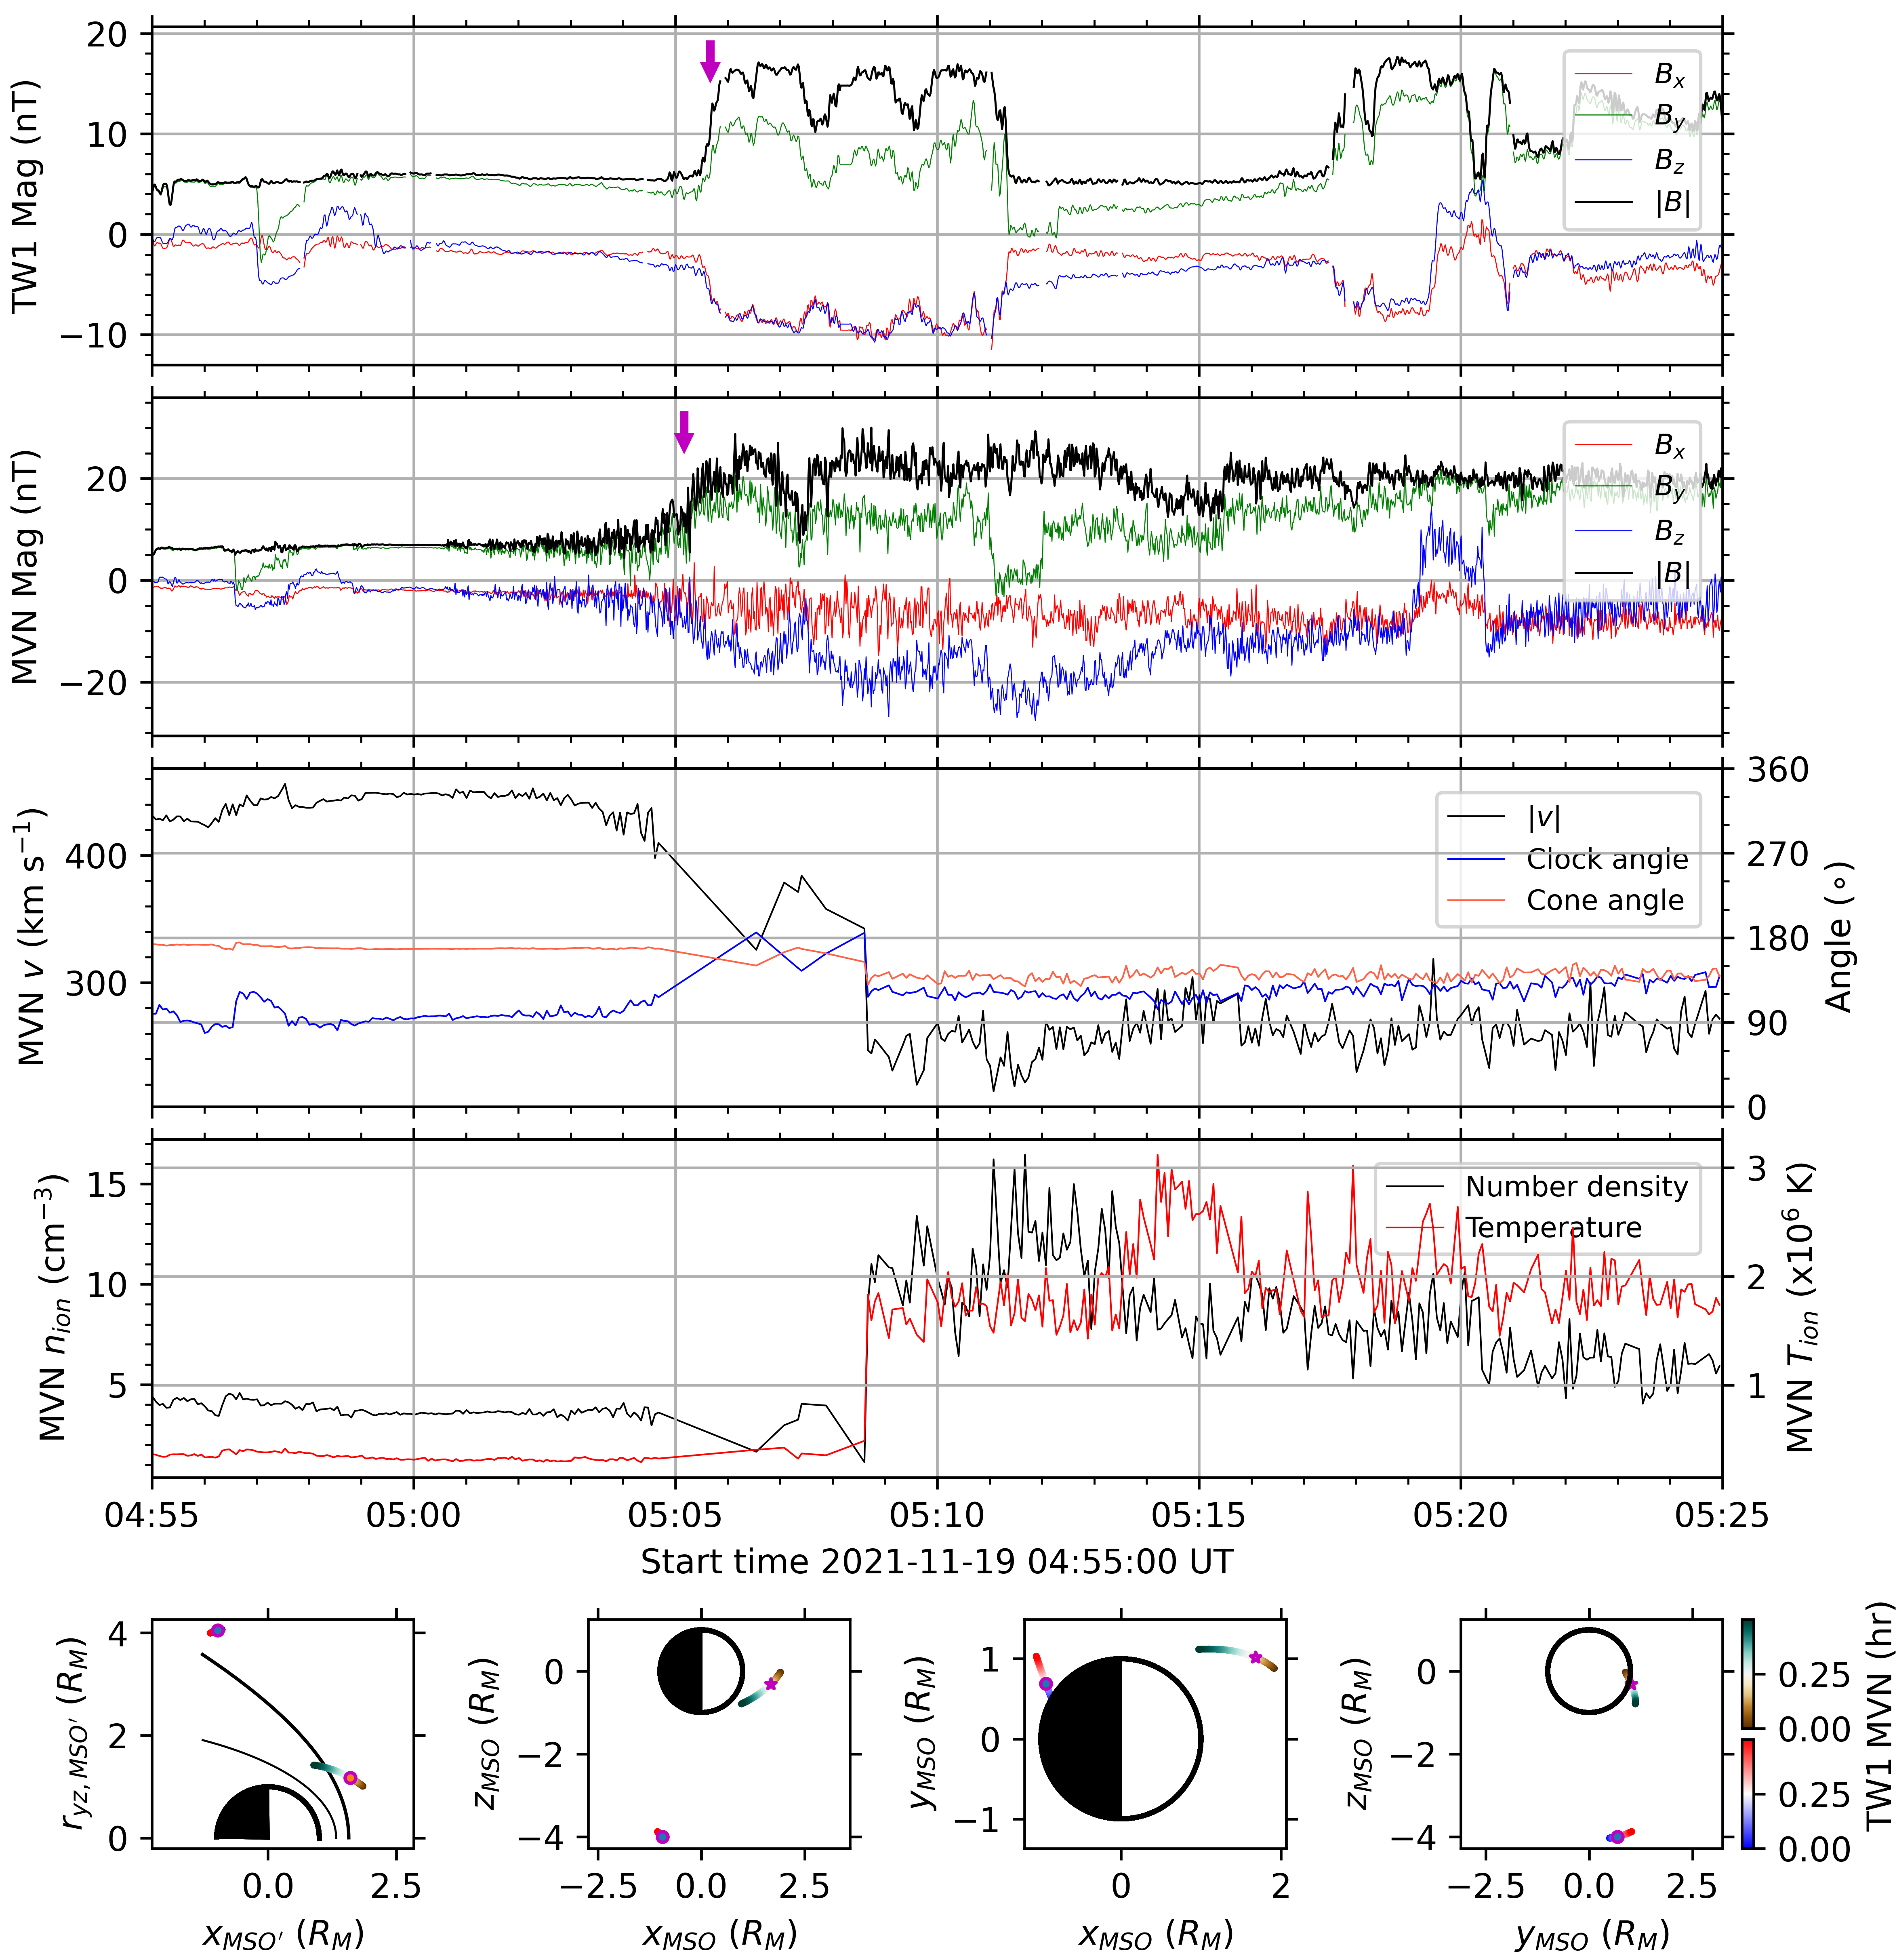
Figures 6–10 show the 5 pairs of the BS crossings. Around 05:05 UT on November 19, both spacecraft crossed the BS from the solar wind into magnetosheath, when Tianwen-1 orbiter was far above the southern pole of Mars and MAVEN was close to the BS nose (see Fig.6). The magnetic fields in the solar wind measured before they entered magnetosheath look quite similar. Between 04:56 and 05:00 UT, we can see the large variation patterns in the three components of the magnetic fields without a significant change in the total magnitude, which are probably the features of an Alfvén wave. This featured structure arrived at Tianwen-1 orbiter later than MAVEN by nearly 30 s, which was roughly the time spent by solar wind travelling from MAVEN to Tianwen-1.
The magnetic fields measured by the two spacecraft after they crossed the BS show different patterns. From the first panel of Figure 6, it seems that the Tianwen-1 orbiter crossed the BS three times within 7 minutes, finally returned back to solar wind at 05:11:30 UT, and at about 05:17:20 UT, the orbiter started to cross the BS again. Not like Tianwen-1, MAVEN stayed in the magnetosheath after the crossing except one turning back at around 05:07:30 UT. It is similar to the case shown in Figure 2h and 3h, of which the Tianwen-1 orbiter crossed the BS three times in 7 minutes, but MAVEN had only one clear crossing. These phenomena suggest that the Martian BS is very dynamic with the time scale even less than one minute, and the BS flank is more dynamic than the nose during this time period. Such multiple-crossings in minutes deserve further study, especially for events with Tianwen-1 orbiter crossing the BS and MAVEN staying in the solar wind to monitor the upstream condition.

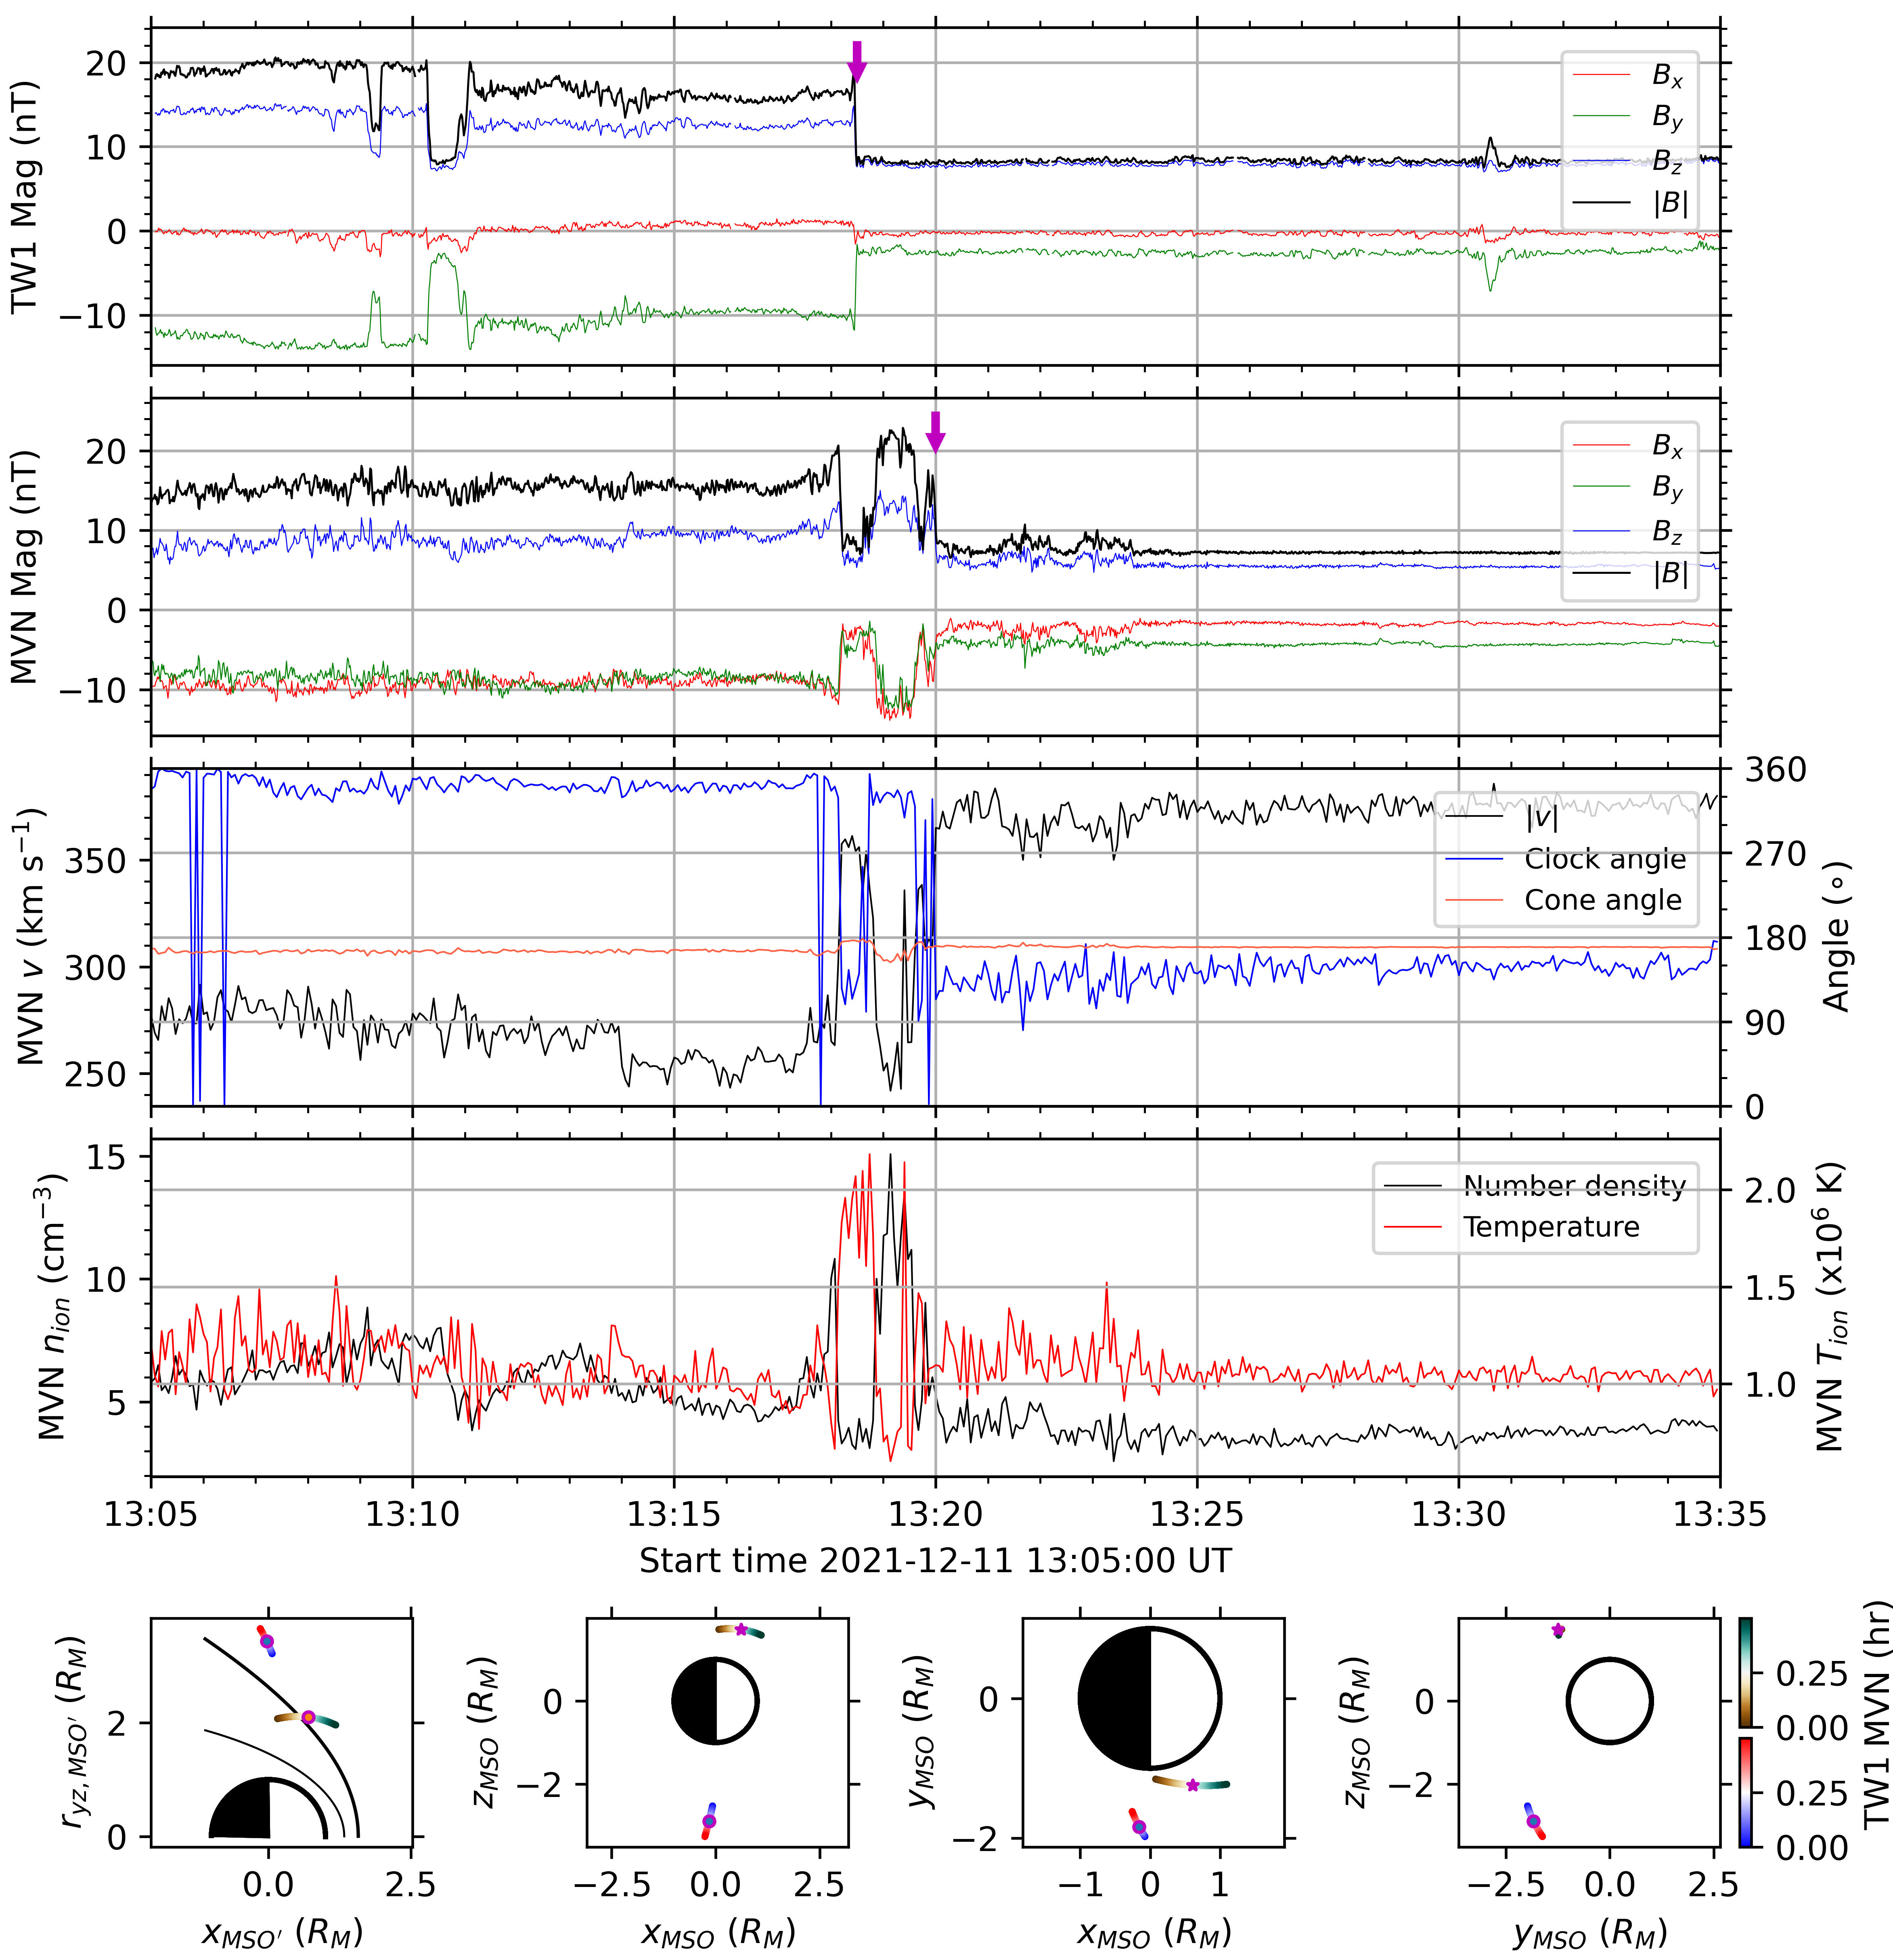
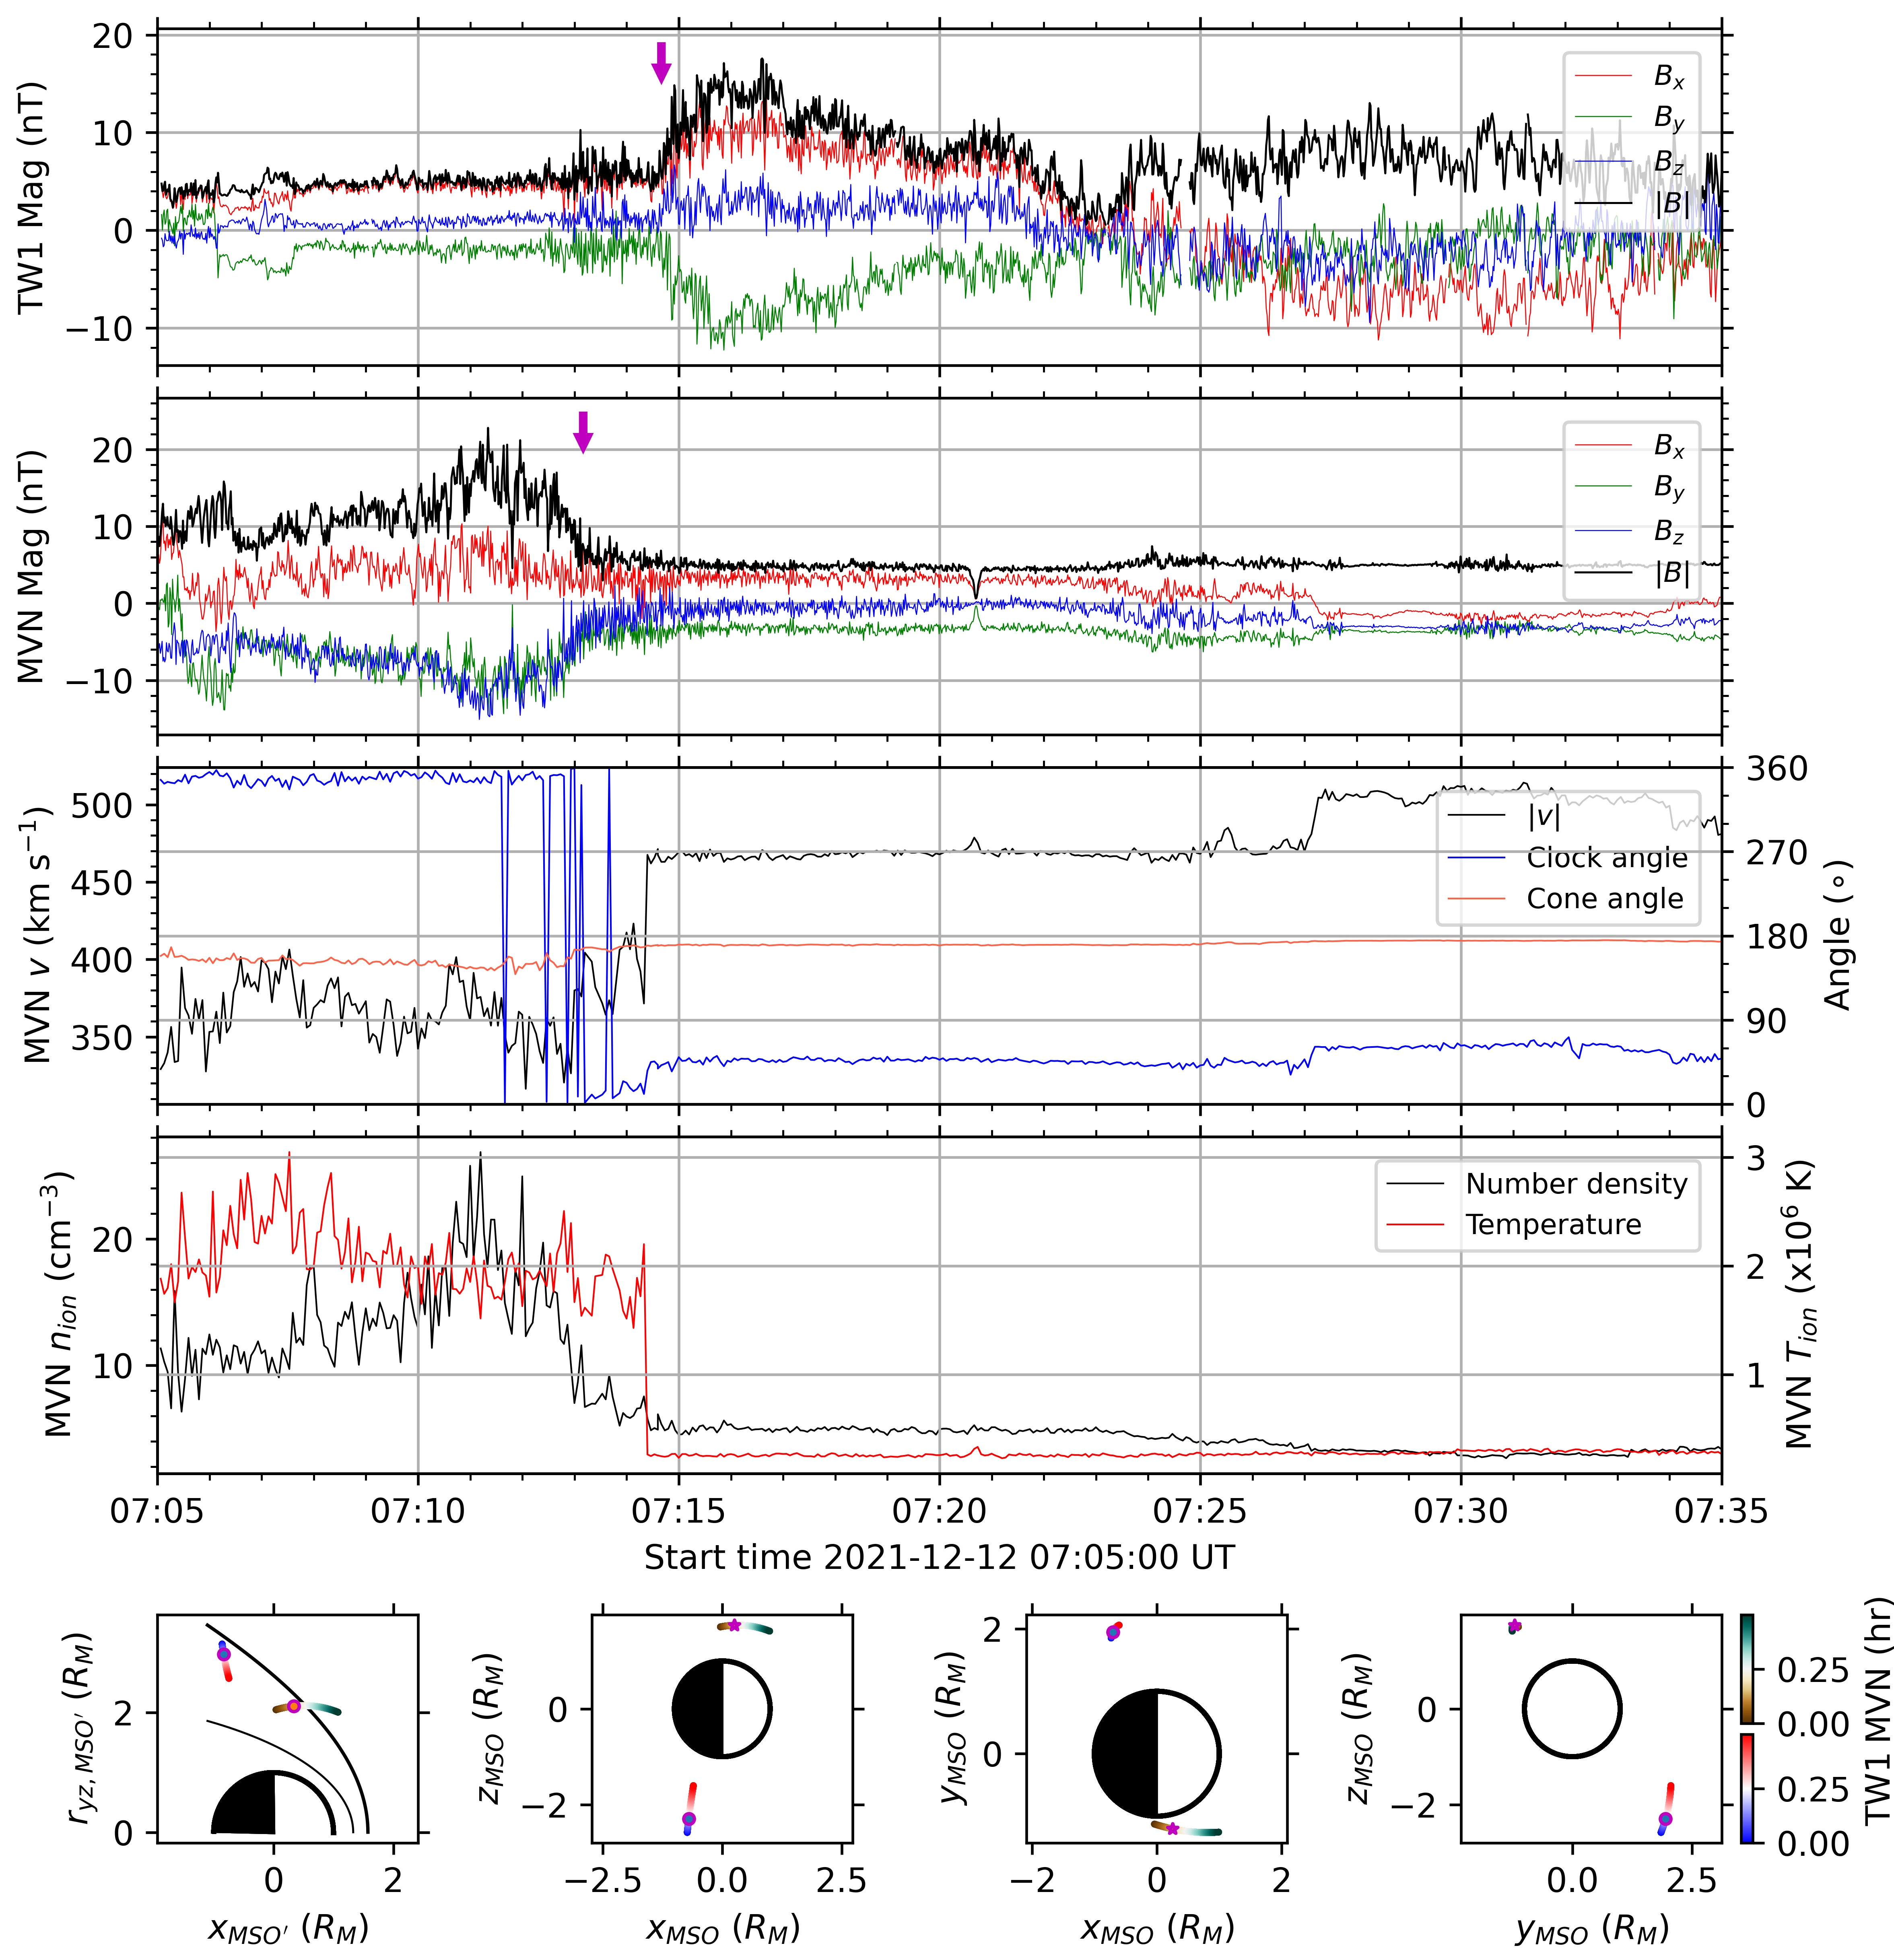
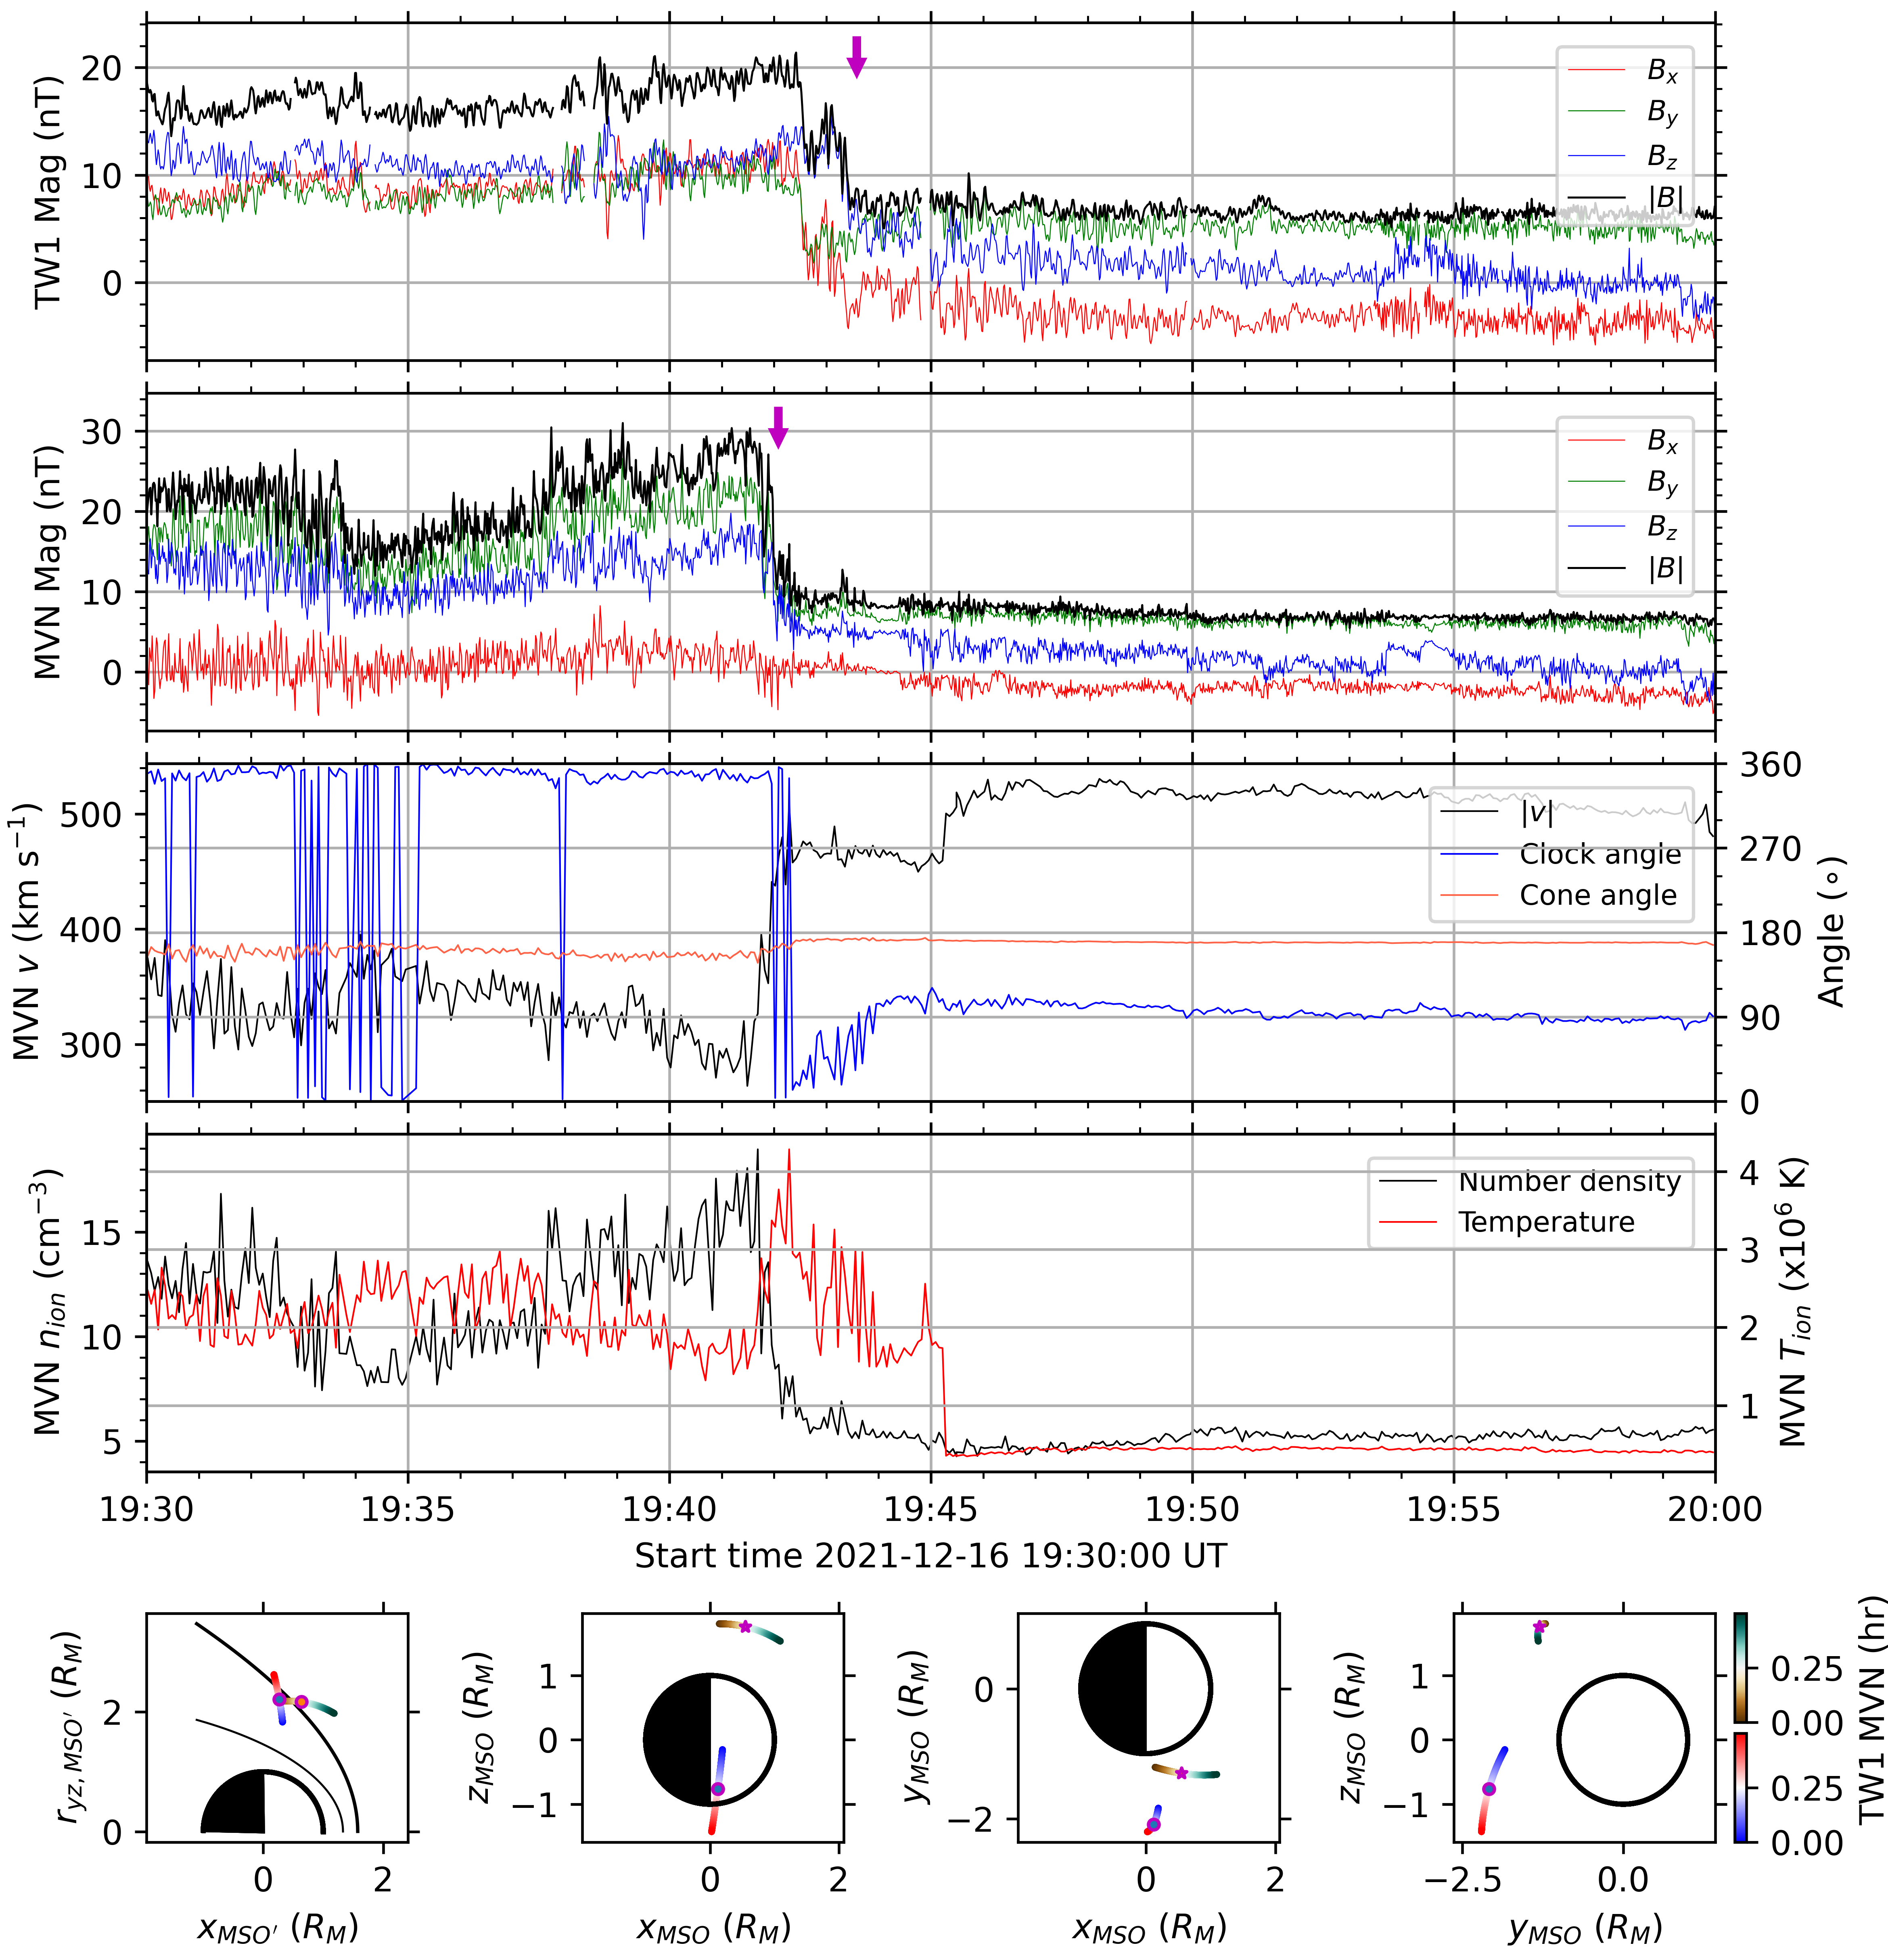
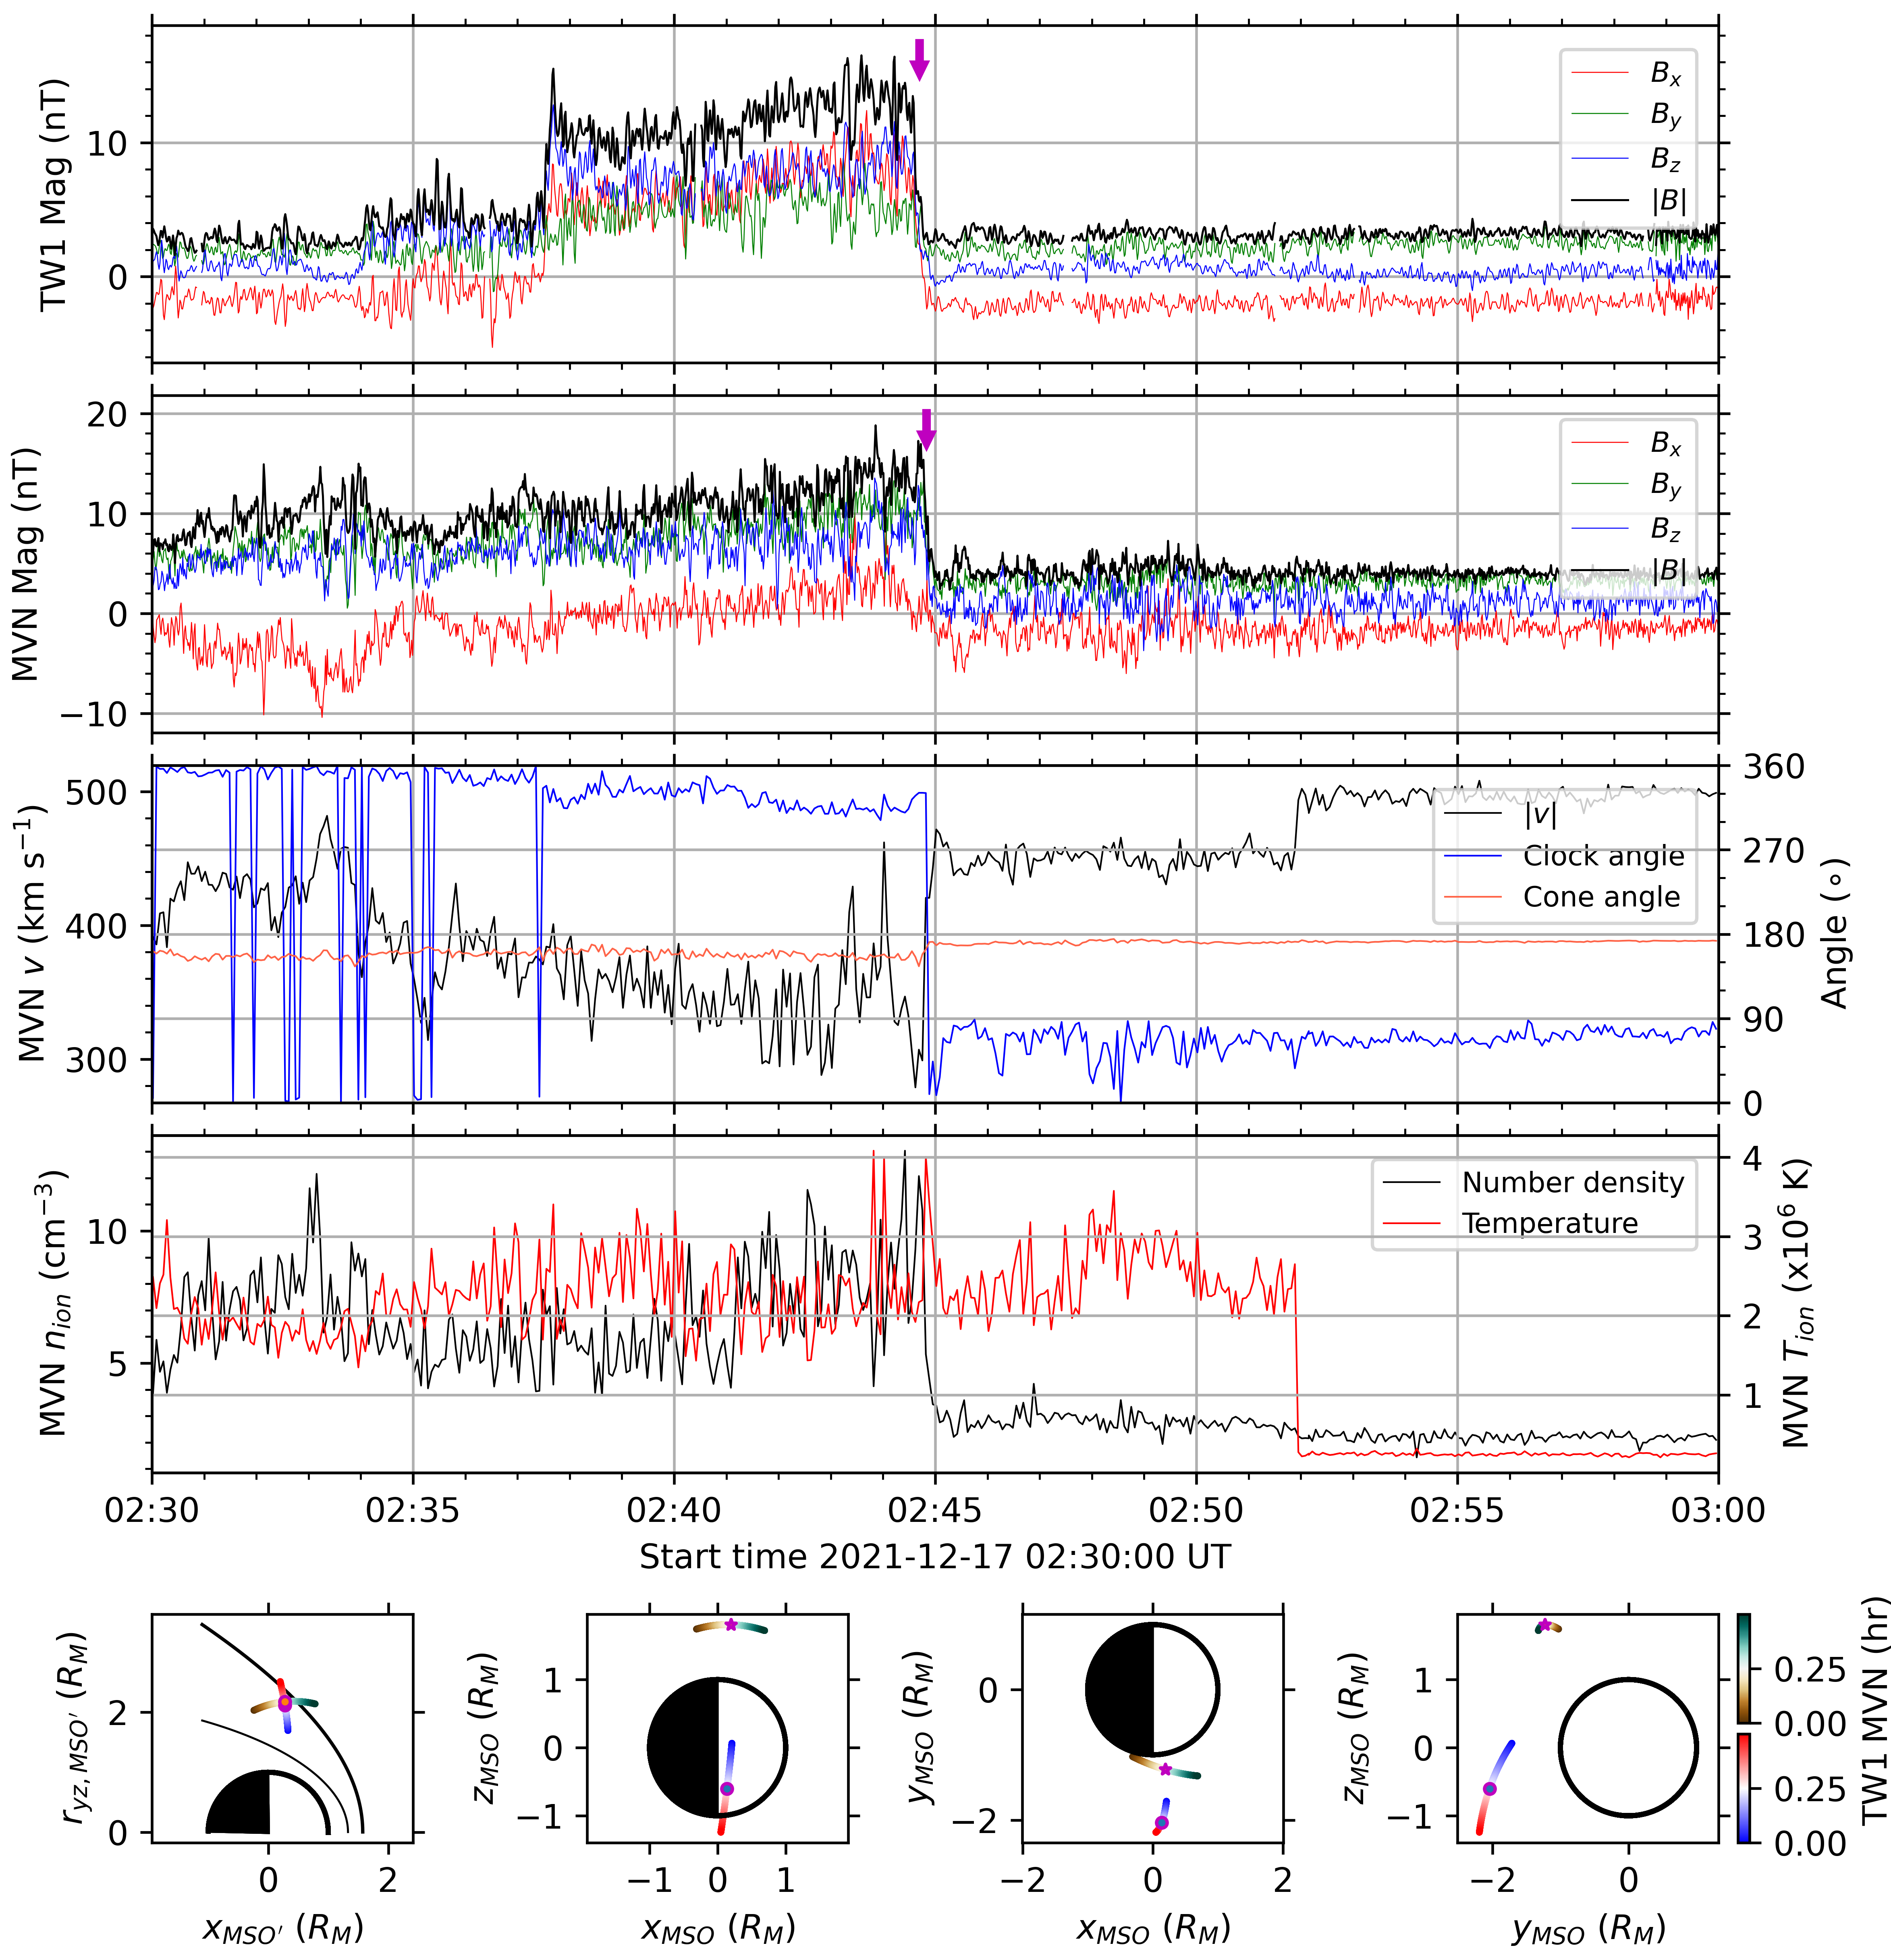
The second pair of the BS crossings is found around 13:19 UT on December 11 as shown in Figure 7. Both spacecraft were crossing the BS from magnetosheath to the solar wind. We can see a sharp jump at 13:18:30 UT in the MOMAG data, and a sharp jump at 13:20:00 UT in the MAVEN/MAG data. In both data, we also can find a large dip in the total magnetic field strength. It is hard to determine if they are correlated. The third pair was around 07:14 UT on December 12 with one crossing from the solar wind into magnetosheath and the other from magnetosheath into the solar wind (Fig.8). The fourth pair was around 19:43 UT on December 16. Both spacecraft travelled from the magnetosheath into the solar wind (Fig.9). The last pair is found around 02:45 UT on December 17. Both spacecraft also travelled from the magnetosheath into the solar wind (Fig.10). If looking at the total strengths of the magnetic fields in the magnetosheath for all the BS crossing pairs, we may find they are more or less similar no matter how large in distance the two spacecraft are apart, suggesting the consistency of the global magnetic structure surrounding Mars at the level of large scale.
4 Summary
we have presented the in-flight performance and first results of Tianwen-1/MOMAG with the focus on the most notable structure — Martian BS. Based on the first one and a half months’ data, we identified 158 clear BS crossings, whose locations are consistent with the BS model in statistics. The simultaneous BS crossings of the Tianwen-1 and MAVEN verified the south-north asymmetry of the BS, and also showed the similarity of magnetic field profiles from the two spacecraft. The first pair of the simultaneous BS crossings along with the BS crossing case on December 30 suggests that the BS is probably more dynamic at flank than near the nose. By comparing with the MAVEN observations, we also found similar structures propagating with the solar wind from MAVEN to the Tianwen-1 orbiter. We conclude that MOMAG shows an excellent performance and provides accurate measurements of magnetic field vectors. Now MOMAG has scanned the magnetic field in the MPR, magnetosheath and solar wind near the dawn-dusk side. These measurements along with the MAVEN data will help us better understand the plasma environment surrounding Mars.
Acknowledgements.
We acknowledge the use of the data from the MAG and SWIA onboard MAVEN spacecraft, which are obtained from NASA Planetary Data System (https://pds-ppi.igpp.ucla.edu/). One may apply for the Tianwen-1/MOMAG data at CNSA Data Release System (http://202.106.152.98:8081/marsdata/) or can just download the data used in this paper from the official website of the MOMAG team (http://space.ustc.edu.cn/dreams/tw1_momag/). The work is support by the NSFC (Grant Nos 42130204 and 42188101) and the Strategic Priority Program of the Chinese Academy of Sciences (Grant No. XDB41000000). Y.W. is particularly grateful to the support of the Tencent Foundation.References
- Bertucci et al. [2004] Bertucci, C., et al., MGS MAG/ER observations at the magnetic pileup boundary of mars: Draping enhancement and low frequency waves, Adv. Space Res., 33, 1938–1944, 10.1016/j.asr.2003.04.054, 2004.
- Brain et al. [2006] Brain, D. A., et al., On the origin of aurorae on Mars, Geophys. Res. Lett., 33, 10.1029/2005GL024782, 2006.
- Brain et al. [2015] Brain, D. A., et al., The spatial distribution of planetary ion fluxes near Mars observed by MAVEN, Geophys. Res. Lett., 42, 9142–9148, 10.1002/2015GL065293, 2015.
- Connerney et al. [2015] Connerney, J. E., J. Espley, P. Lawton, S. Murphy, J. Odom, R. Oliversen, and D. Sheppard, The MAVEN magnetic field investigation, Space Science Reviews, 195, 257–291, 10.1007/s11214-015-0169-4, 2015.
- Dubinin et al. [2008] Dubinin, E., et al., Structure and dynamics of the solar wind/ionosphere interface on Mars: MEX-ASPERA-3 and MEX-MARSIS observations, Geophys. Res. Lett., 35, 10.1029/2008GL033730, 2008.
- Edberg et al. [2008] Edberg, N. J. T., M. Lester, S. W. H. Cowley, and A. I. Eriksson, Statistical analysis of the location of the Martian magnetic pileup boundary and bow shock and the influence of crustal magnetic fields, J. Geophys. Res.: Space Phys., 113, A08,206, 10.1029/2008JA013096, 2008.
- Ergun et al. [2006] Ergun, R. E., L. Andersson, W. K. Peterson, D. Brain, G. T. Delory, D. L. Mitchell, R. P. Lin, and A. W. Yau, Role of plasma waves in Mars’ atmospheric loss, Geophys. Res. Lett., 33, 10.1029/2006GL025785, 2006.
- Halekas et al. [2017] Halekas, J. S., et al., Structure, dynamics, and seasonal variability of the Mars-solar wind interaction: MAVEN solar wind ion analyzer in-flight performance and science results, J. Geophys. Res.: Space Phys., 122, 547–578, 10.1002/2016JA023167, 2017.
- Hall et al. [2019] Hall, B. E., B. Sánchez-Cano, J. A. Wild, M. Lester, and M. Holmström, The Martian Bow Shock Over Solar Cycle 23–24 as Observed by the Mars Express Mission, J. Geophys. Res.: Space Phys., 124, 4761–4772, 10.1029/2018JA026404, 2019.
- Jakosky et al. [2015a] Jakosky, B. M., et al., The mars atmosphere and volatile evolution (MAVEN) mission, Space Sci. Rev., 195, 3–48, 2015a.
- Jakosky et al. [2015b] Jakosky, B. M., et al., MAVEN observations of the response of Mars to an interplanetary coronal mass ejection, Science, 350, aad0210, 10.1126/science.aad0210, 2015b.
- Liu et al. [2020] Liu, K., et al., Mars orbiter magnetometer of China’s first mars mission Tianwen-1, Earth & Planet. Phys., 4, 384–389, 2020.
- Mazelle et al. [2004] Mazelle, C., et al., Bow shock and upstream phenomena at Mars, Space Sci. Rev., 111, 115–181, 10.1023/B:SPAC.0000032717.98679.d0, 2004.
- Pope et al. [2011] Pope, S., T. Zhang, M. Balikhin, M. Delva, L. Hvizdos, K. Kudela, and A. Dimmock, Exploring planetary magnetic environments using magnetically unclean spacecraft: A systems approach to VEX MAG data analysis, Ann. Geophys., 29, 639–647, 10.5194/angeo-29-639-2011, 2011.
- Ramstad et al. [2017] Ramstad, R., S. Barabash, Y. Futaana, and M. Holmström, Solar wind- and EUV-dependent models for the shapes of the Martian plasma boundaries based on Mars Express measurements, J. Geophys. Res.: Space Phys., 122, 7279–7290, 10.1002/2017JA024098, 2017.
- Ruhunusiri et al. [2017] Ruhunusiri, S., et al., Characterization of turbulence in the mars plasma environment with MAVEN observations, J. Geophys. Res.: Space Phys., 122, 656–674, 10.1002/2016JA023456, 2017.
- Russell and Blanco-Cano [2007] Russell, C. T., and X. Blanco-Cano, Ion-cyclotron wave generation by planetary ion pickup, J. Atmos. Solar-Terres. Phys., 69, 1723–1738, 2007.
- Wan et al. [2020] Wan, W. X., C. Wang, C. L. Li, and Y. Wei, China’s first mission to Mars, Nat. Astron., 4, 721–721, 10.1038/s41550-020-1148-6, 2020.
- Wang and Pan [2021] Wang, G., and Z. Pan, A new method to calculate the fluxgate magnetometer offset in the interplanetary magnetic field, J. Geophys. Res.: Space Phys., 126, 10.1029/2020JA028893, 2021.
- Zhang et al. [2008] Zhang, T. L., et al., Initial Venus Express magnetic field observations of the Venus bow shock location at solar minimum, Planet. Space Sci., 56, 785–789, 10.1016/j.pss.2007.09.012, 2008.
- Zhang et al. [2012] Zhang, T. L., et al., Magnetic reconnection in the near Venusian magnetotail, Science, 336, 567–570, 10.1126/science.1217013, 2012.
- Zou et al. [2021] Zou, Y., et al., Scientific objectives and payloads of Tianwen-1, China’s first Mars exploration mission, Adv. Space Res., 67, 812–823, 2021.
- Zou et al. [2023] Zou, Z., et al., In-flight calibration of the magnetometer on the mars orbiter of tianwen-1, Sci. China Tech. Sci., submitted, 2023.