Charging dynamics of electric double layer nanocapacitors in mean-field
Abstract
An electric double layer capacitor (EDLC) stores energy by modulating the spatial distribution of ions in the electrolytic solution that it contains. We determine the mean-field time scales for planar EDLC relaxation to equilibrium, after a potential difference is applied. We tackle first the fully symmetric case, where positive and negative ionic species have same valence and diffusivity, and then the general, more complex, asymmetric case. Depending on applied voltage and salt concentration, different regimes appear, revealing a remarkably rich phenomenology relevant for nanocapacitors.
Two conductive surfaces separated by an ionic solution form an electric double layer capacitor (EDLC), that stores electrostatic energy by modulating the distribution of charged species in solution [1, 2]. Nanoporous conductive materials offer an optimized contact between the electrolyte and the electrode, where charge storage occurs, leading to specific capacities as large as /g of material [3]. Their ability to store and release charge much faster than in batteries, which involve electrochemical reactions [4], allows their use in applications requiring high powers, from the recovery of breaking energy to electrical public transportation means covering short distances and recharging during stops [5]. A promising use of so-called supercapacitors concerns the extraction of ”blue energy” from fresh and salty water, or conversely the desalination of water, using cycles of charge and discharge of capacitors [6, 7, 8, 9, 10]. Finally, it is now possible to use electrodes in nanocapacitors and nanofluidic devices to study extremely small volumes of electrolytes [11, 12, 13].
Predicting the charging dynamics of EDLCs is essential, because tuning the related characteristic time allows to maximize efficiency. For both aqueous solutions and ionic liquids, the effects of ion correlations and size on the charging dynamics have been described by density functional theories [14, 15, 16, 17], lattice models [18] and molecular simulations [19, 20, 21, 22, 23, 24, 25, 26, 27]. More fundamental studies rely on mean-field continuum models of the electrolyte [28, 29], in planar and non-planar geometries [30, 31, 32], which can also be simulated using lattice-based models to capture electrokinetic couplings [33]. In this context, particularly well studied is the linear regime (small applied voltage) for a symmetric electrolyte (cations and anions with same valence and diffusivity) [28, 29]. The large-voltage regime remains however elusive and the asymmetric electrolyte case is unexplored, even though it is in fact the rule rather than the exception. In addition, the non-linear effects emerging from the fact that the number of ions enclosed in real capacitors is fixed (rather than their chemical potential) are scarcely known. Here, we fill these gaps and identify how the time scales governing relaxation to equilibrium depend on the key parameters of the system: applied voltage, ion concentration and distance between electrodes. We find an unexpectedly rich regime diagram, highlighting the importance of finite system size and ion asymmetry.
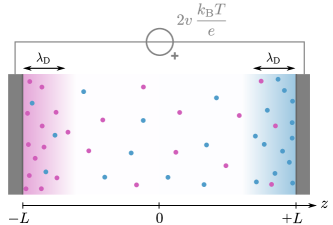
Our model system is represented in Fig. 1. The plates, distant from each other, are ideal conductors whose dielectric mismatch with the solution we neglect. To allow analytical and computational treatment, water is supposed to have constant permittivity and correlations between ions are neglected – a condition known as weak coupling [34]. The system is at equilibrium at zero potential difference () for times : the two ionic species, positive and negative, are homogeneously distributed, the solution is locally neutral everywhere and the plates are uncharged. At time we instantaneously switch on the potential , that we measure in units of thermal energy per elementary charge . The plates charge up and ionic concentration profiles change in response to this, obeying the Poisson-Nernst-Planck theory [35]. For two ionic species of valences and diffusion coefficients , this relates the electric potential to the ion densities :
| (1) | ||||
| (2) |
Here, is the electric charge density. Eq. (1) is a continuity equation, whose current has a drift and a diffusion term. Its equilibrium zero-current state retrieves the Poisson-Boltzmann distribution [35]. Eq. (2) is the Poisson equation.
We solve numerically Eqs. (1)-(2) via a flux-conservative finite-difference integration scheme, described in [36]. Boundary conditions are the desired potential difference and the vanishing of the ionic current at the electrodes. We work in the canonical ensemble, with no salt reservoir. We collect data for a range of applied voltages and salt concentrations spanning, respectively, 5 and 10 orders of magnitude. We quantify the initial densities through the dimensionless quantity , where and defines the Debye screening length. The salt concentration is . We analyse the time evolution of the surface charge density on the electrodes, (equal and opposite on the two sides, as the current entering the generator equals the exiting one) and of the ionic densities through the proxy to reduce dimensionality. We characterise the relaxation to the equilibrium values and by inspecting all curves for exponential or linear relaxation rates.
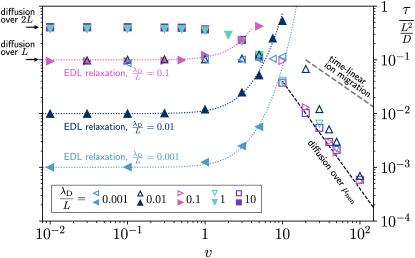
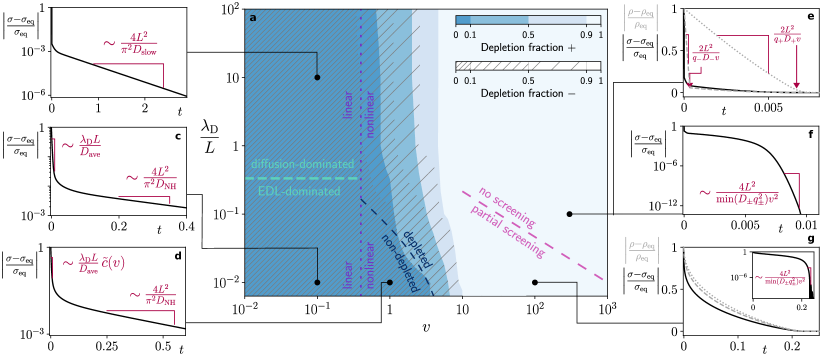
For the symmetric electrolyte case ( and ), relaxation times are summarised in Fig. 2 and are used to formulate the regime diagram of Fig. 3a. For small , the system is treatable analytically [28, 29] and presents an infinite series of exponential relaxation times. For , they all scale as , the largest being : this is the dominant time scale and the only one clearly visible (Fig. 3b) and it is a signature of ions diffusing over a length toward the oppositely charged plate. For , subdominant times are of order while the dominant one scales as (Fig. 3c). The exact expression of relaxation times in the linear regime was obtained by [29] and we present an alternative derivation in [36]. Interestingly, already from the linear regime, at small , a sign of nonlinearity appears, termed depletion: due to asymmetric accumulation in the electric double layers (EDL), the salt concentration decreases in the middle of the capacitor. Indeed, at equilibrium, for each species, the EDL next to the oppositely charged electrode is more populated than the other EDL is depopulated. After most of the EDL has built up, a neutral excess of ions remains around and diffuses away in a time . This diffusion, occurring on a length , is visible in Fig. 2 (, empty symbols, representing late-time relaxation) and in the long-time slope of Fig. 3c.
In Fig. 3a, defines the nonlinear regime. Depletion, quantified through the depletion fraction and indicated by shadings of blue, dramatically affects this regime. However, at small the ion concentration is large enough to make depletion a second order effect and a non-depleted, purely nonlinear regime is visible. Such a window is delimited by the condition (dark-blue dashed curve), matching the numerical calculations. This is obtained through the Grahame equation, relating potential and electrode charge [35, 37]. We impose that the latter is much less than the charge of all oppositely charged ions in the system: (see [36]). Relaxation, in Fig. 3d, is governed at short times by a new exponential time scale for EDL formation, increasing with as shown in Fig. 2 (symbols on dotted line). A RC-circuit equivalence shows that this time scale is (dotted lines) and reflects the increased charge, i.e. capacitance, of the nonlinear EDL. At late times, as in the linear regime, depletion manifests as a diffusive relaxation rate at late times, corresponding to the relaxation of the neutral excess of ions.
As increases further into the nonlinear regime, the system rapidly transitions to a fully depleted final state (depletion fraction , i.e. practically no ions in the bulk) and the physics changes drastically. To understand it, we focus first on the top-right part of Fig. 3a. For such strong voltages, ionic screening has a relatively small effect on the electrode charge, so that ions are pulled at constant velocity toward the oppositely charged wall. Charge density in the EDL grows linearly in time, as shown in Fig. 3e (gray). Also, since the applied voltage results from the sum of the electric fields due to the electrodes’ charge and to the ionic charge, the latter are linearly related. Because the non-neutral bulk portion increases linearly with time, the electric field due to the solution is parabolic in time, and so is (black). Once the two purely counterionic EDLs are formed, a final exponential relaxation occurs (Fig. 3f). The only meaningful length scale is now the Gouy-Chapman length, the distance over which an isolated counterion can be dragged away from the electrode, with an energy budget [35, 37]; it sets the extension of the double-layer in a salt-free regime. Since one electrode carries a larger charge than its counterions, this half-system is not electroneutral and the right Gouy-Chapman length reads , where nen stands for non-electroneutral and is the part of electrode charge not neutralised by counterions [36]. As , the late relaxation time is (dashed black line in Fig. 2).
We have just assumed that the ion dynamics do not perturb much the externally imposed electric field in the EDL (yet it sensibly affects electrode charge relaxation, as seen in Fig. 3e). This only occurs if is , which defines the region above the pink line in Fig. 3a. Below such line, ions partially screen the applied field, by an amount that varies during relaxation. In this regime the early-time relaxation dynamics is neither linear, nor quadratic or exponential (Fig. 3g). However, it ends as abruptly as in the unscreened regime and, at late times, the purely counterionic EDL relaxes exponentially over the Gouy-Chapman length (inset).
The general asymmetric case is described in Fig. 4. To obtain clear separations between the relevant time scales, we choose , , and call positive ions slow and negative ions fast; other choices lead to analogous results [36]. Several differences arise compared to the symmetric case described so far, making the phenomenology even richer. In the linear, large regime, the two ionic species are completely decoupled. Each of the infinitely many relaxation modes from the symmetric case splits into two, so that half of them are proportional to and half to ; the slowest mode concerns the diffusion of the slowest species over a length , so its characteristic time is , with (Fig. 4b). Valences do not affect relaxation times, but they play a role in determining the weight of each mode [36].
In constrast, at small (Fig. 4c) valences matter: as the bulk conductivities due to the two species are additive and each of them is proportional to , a simple RC-circuit analogy shows that the relevant diffusivity is , and the EDL forms on a timescale [36]. At late times, relaxation is due to the neutral excess diffusion governed instead by the Nernst-Hartley diffusivity [38], relevant also in the context of impedance spectroscopy [39, 40, 41]. Indeed, in relaxing the neutral excess by diffusion, positive and negative ions must move together, with the slow species slowing down the fast and the fast pulling the slow: this is reflected by a friction (inverse diffusivity) which is the average of the frictions of the two species. In the ion-symmetric case, relaxation of the neutral excess occurs over a length , from the exact centre to the electrodes, effectively forbidding a diffusive mode with wavelength ; ionic asymmetry relaxes this constraint, so that the late-time characteristic time is now . This neutral excess relaxation is a purely linear phenomenon and is not due to depletion (that still happens, but on a faster, hidden scale here). As the fast species tends to relax according to the instantaneous distribution assumed by the slow species, an overcrowding of carriers occurs at the electrode of same charge as the slow ions: these move away slowly, so that the fast ions, in the attempt to equilibrate the EDL, arrive in larger amounts than needed for equilibrum. Eventually, as the slow ions gradually move away, the overabundant fast ones also leave the EDL in the observed relaxation of the neutral excess by diffusion.
Macroscopic depletion, at large , now occurs at different voltages for the two species. This is shown by the mismatch between colour gradient and hatching patterns in Fig. 4a. The linear regime shrinks to the region . In the intermediate region , sharply defined for strong valence asymmetry, the depletion mismatch results in a rapid relaxation of the higher-charge (depleted) species, followed by a linear-regime-like relaxation of the smaller-charge (non-depleted) species [36]. At small , where nonlinear features emerge before bulk depletion, this effect disappears and the two species are equally depleted at given . The analytic expression for the onset of depletion (dashed blue line) is given in [36]: as depletion is measured at equilibrium, it depends on but not on .
The non-depleted nonlinear regime (Fig. 4d) confirms the importance of and . In particular, during early-time EDL build-up, the factor accounting for increased EDL capacitance in the symmetric case is replaced by , whose cumbersome expression we work out in [36]. For , asymmetry always enhances capacitance, thereby increasing the relaxation time compared to the case.
Finally, in the fully depleted, unscreened regime (Fig. 4e), the situation is analogous to the symmetric case, but the two trains of positive and negative ions are now dragged by the electric field at different velocities. This results in relaxing with different time scales at the two electrodes (dashed and dotted gray). The electrode charge (black) is piecewise quadratic. At late times, the only visible relaxation is due to the counterions of the slower EDL, each with its own . The characteristic time is then the largest one between the times , which in Fig. 4f is given by the slower and lower-charge species. Such relaxation process is also the last one to happen in the partially screened regime (Fig. 4g), while, again, early-time behavior is neither exponential nor linear.
In summary, we identified the dominant relaxation processes within mean-field and their often counter-intuitive characteristic times, for the whole parameter space. This work provides a long-missed, easy-access frame of comparison for all theories intended to incorporate steric effects and ionic correlations or aimed at describing ionic liquids. While some of these have pointed out the limits of mean-field, many have already confirmed its relevance for real physical systems [17]. Understanding the relaxation dynamics paves the way to optimisation strategies and design of supercapacitors.
Acknowledgements This work has received funding from the European Union’s Horizon 2020 research and innovation program under the Marie Skłodowska-Curie grant agreements Nos. 674979-NANOTRANS and 101034413. This project received funding from the European Research Council under the European Union’s Horizon 2020 research and innovation program (Grant Agreement No. 863473). B.R. acknowledges financial support from the French Agence Nationale de la Recherche (ANR) under Grant No. ANR-21-CE29-0021-02 (DIADEM).
References
- Salanne et al. [2016] M. Salanne, B. Rotenberg, K. Naoi, K. Kaneko, P.-L. Taberna, C. P. Grey, B. Dunn, and P. Simon, Efficient Storage Mechanisms for Building Better Supercapacitors, Nature Energy 1, 16070 (2016).
- Simon and Gogotsi [2020] P. Simon and Y. Gogotsi, Perspectives for electrochemical capacitors and related devices, Nature Materials 19, 1151 (2020).
- Merlet et al. [2012] C. Merlet, B. Rotenberg, P. A. Madden, P. L. Taberna, P. Simon, Y. Gogotsi, and M. Salanne, On the molecular origin of supercapacitance in nanoporous carbon electrodes, Nature Materials 11, 306 (2012).
- Sherrill et al. [2011] S. A. Sherrill, P. Banerjee, G. W. Rubloff, and S. B. Lee, High to ultra-high power electrical energy storage, Physical Chemistry Chemical Physics 13, 20714 (2011).
- Raghavendra et al. [2020] K. V. G. Raghavendra, R. Vinoth, K. Zeb, C. V. Muralee Gopi, S. Sambasivam, M. R. Kummara, I. M. Obaidat, and H. J. Kim, An intuitive review of supercapacitors with recent progress and novel device applications, Journal of Energy Storage 31, 101652 (2020).
- Brogioli [2009] D. Brogioli, Extracting renewable energy from a salinity difference using a capacitor, Physical Review Letters 103, 31 (2009).
- Boon and van Roij [2011] N. Boon and R. van Roij, ‘Blue energy’ from ion adsorption and electrode charging in sea and river water, Molecular Physics 109, 1229 (2011).
- Janssen et al. [2014] M. Janssen, A. Härtel, and R. van Roij, Boosting Capacitive Blue-Energy and Desalination Devices with Waste Heat, Physical Review Letters 113, 268501 (2014).
- Suss et al. [2015] M. E. Suss, S. Porada, X. Sun, P. M. Biesheuvel, J. Yoon, and V. Presser, Water desalination via capacitive deionization: What is it and what can we expect from it?, Energy & Environmental Science 8, 2296 (2015).
- Simoncelli et al. [2018] M. Simoncelli, N. Ganfoud, A. Sene, M. Haefele, B. Daffos, P.-L. Taberna, M. Salanne, P. Simon, and B. Rotenberg, Blue energy and desalination with nanoporous carbon electrodes: Capacitance from molecular simulations to continuous models, Physical Review X 8, 021024 (2018).
- Sun and Mirkin [2008] P. Sun and M. V. Mirkin, Electrochemistry of Individual Molecules in Zeptoliter Volumes, Journal of the American Chemical Society 130, 8241 (2008).
- Mathwig et al. [2012] K. Mathwig, D. Mampallil, S. Kang, and S. G. Lemay, Electrical Cross-Correlation Spectroscopy: Measuring Picoliter-per-Minute Flows in Nanochannels, Physical Review Letters 109, 118302 (2012).
- Rassaei et al. [2012] L. Rassaei, K. Mathwig, E. D. Goluch, and S. G. Lemay, Hydrodynamic Voltammetry with Nanogap Electrodes, The Journal of Physical Chemistry C 116, 10913 (2012).
- Kornyshev [2007] A. A. Kornyshev, Double-Layer in Ionic Liquids: Paradigm Change?, The Journal of Physical Chemistry B 111, 5545 (2007).
- Jiang et al. [2014] J. Jiang, D. Cao, D. E. Jiang, and J. Wu, Time-dependent density functional theory for ion diffusion in electrochemical systems, Journal of Physics Condensed Matter 26, 284102 (2014).
- Goodwin et al. [2017] Z. A. H. Goodwin, G. Feng, and A. A. Kornyshev, Mean-Field Theory of Electrical Double Layer In Ionic Liquids with Account of Short-Range Correlations, Electrochimica Acta 225, 190 (2017).
- Ma et al. [2022] K. Ma, M. Janssen, C. Lian, and R. van Roij, Dynamic density functional theory for the charging of electric double layer capacitors, The Journal of Chemical Physics 156, 084101 (2022).
- Lee et al. [2015] A. A. Lee, S. Kondrat, D. Vella, and A. Goriely, Dynamics of Ion Transport in Ionic Liquids, Physical Review Letters 115, 106101 (2015).
- Limmer et al. [2013] D. T. Limmer, C. Merlet, M. Salanne, D. Chandler, P. A. Madden, R. Van Roij, and B. Rotenberg, Charge fluctuations in nanoscale capacitors, Physical Review Letters 111, 106102 (2013).
- Kondrat et al. [2014] S. Kondrat, P. Wu, R. Qiao, and A. A. Kornyshev, Accelerating charging dynamics in subnanometre pores, Nature Materials 13, 387 (2014).
- Péan et al. [2014] C. Péan, C. Merlet, B. Rotenberg, P. A. Madden, P. L. Taberna, B. Daffos, M. Salanne, and P. Simon, On the dynamics of charging in nanoporous carbon-based supercapacitors, ACS Nano 8, 1576 (2014).
- Breitsprecher et al. [2018] K. Breitsprecher, C. Holm, and S. Kondrat, Charge me slowly, I am in a hurry: Optimizing charge-discharge cycles in nanoporous supercapacitors, ACS Nano 12, 9733 (2018).
- Noh and Jung [2019] C. Noh and Y. Jung, Understanding the charging dynamics of an ionic liquid electric double layer capacitor: Via molecular dynamics simulations, Physical Chemistry Chemical Physics 21, 6790 (2019).
- Lian et al. [2020] C. Lian, M. Janssen, H. Liu, and R. van Roij, Blessing and Curse: How a Supercapacitor’s Large Capacitance Causes its Slow Charging, Physical Review Letters 124, 076001 (2020).
- Scalfi et al. [2021] L. Scalfi, M. Salanne, and B. Rotenberg, Molecular simulation of electrode-solution interfaces, Annual Review of Physical Chemistry 72, 189 (2021).
- Minh et al. [2022] T. H. N. Minh, G. Stoltz, and B. Rotenberg, Frequency and field-dependent response of confined electrolytes from brownian dynamics simulations, arXiv:2212.09481 (2022).
- Jeanmairet et al. [2022] G. Jeanmairet, B. Rotenberg, and M. Salanne, Microscopic Simulations of Electrochemical Double-Layer Capacitors, Chemical Reviews 122, 10860 (2022).
- Bazant et al. [2004] M. Z. Bazant, K. Thornton, and A. Ajdari, Diffuse-charge dynamics in electrochemical systems, Physical Review E 70, 021506 (2004).
- Janssen and Bier [2018] M. Janssen and M. Bier, Transient dynamics of electric double-layer capacitors: Exact expressions within the Debye-Falkenhagen approximation, Physical Review E 97, 052616 (2018).
- Janssen and Bier [2019] M. Janssen and M. Bier, Transient response of an electrolyte to a thermal quench, Physical Review E 99, 042136 (2019).
- Yang et al. [2022] J. Yang, M. Janssen, C. Lian, and R. van Roij, Direct numerical simulations of the modified Poisson-Nernst-Planck equations for the charging dynamics of cylindrical electrolyte-filled pores, arXiv:2204.01384 (2022).
- Werkhoven et al. [2018] B. L. Werkhoven, J. C. Everts, S. Samin, and R. Van Roij, Flow-Induced Surface Charge Heterogeneity in Electrokinetics due to Stern-Layer Conductance Coupled to Reaction Kinetics, Physical Review Letters 120, 264502 (2018).
- Asta et al. [2019] A. J. Asta, I. Palaia, E. Trizac, M. Levesque, and B. Rotenberg, Lattice Boltzmann electrokinetics simulation of nanocapacitors, The Journal of Chemical Physics 151, 114104 (2019).
- Naji et al. [2013] A. Naji, M. Kanduč, J. Forsman, and R. Podgornik, Perspective: Coulomb fluids—Weak coupling, strong coupling, in between and beyond, The Journal of Chemical Physics 139, 150901 (2013).
- Hunter [2001] R. J. Hunter, Foundations of Colloid Science, 2nd ed. (Oxford University Press, 2001).
- [36] I. Palaia, A. J. Asta, P. B. Warren, B. Rotenberg, and E. Trizac, in preparation .
- Andelman [2006] D. Andelman, Introduction to electrostatics in soft and biological matter, in Soft Condensed Matter Physics in Molecular and Cell Biology, edited by W. C. K. Poon and D. Andelman (CRC Press, 2006) pp. 97–122.
- Robinson and Stokes [2002] R. A. Robinson and R. H. Stokes, Electrolyte solutions: Second Revised Edition (Dover Publications, 2002) pp. 286–292.
- Barbero and Evangelista [2005] G. Barbero and L. R. Evangelista, Adsorption Phenomena and Anchoring Energy in Nematic Liquid Crystals (CRC Press, 2005).
- Barbero and Lelidis [2007] G. Barbero and I. Lelidis, Evidence of the ambipolar diffusion in the impedance spectroscopy of an electrolytic cell, Physical Review E 76, 051501 (2007).
- Barbero et al. [2008] G. Barbero, F. Batalioto, and A. M. Figueiredo Neto, Theory of small-signal ac response of a dielectric liquid containing two groups of ions, Applied Physics Letters 92, 172908 (2008).