Minimum in the pressure dependence of the interfacial free energy between ice Ih and water
Abstract
Despite the importance of ice nucleation, this process has been barely explored at negative pressures. Here, we study homogeneous ice nucleation in stretched water by means of Molecular Dynamics Seeding simulations using the TIP4P/Ice model. We observe that the critical nucleus size, interfacial free energy, free energy barrier, and nucleation rate barely change between isobars from -2600 to 500 bar when they are represented as a function of supercooling. This allows us to identify universal empirical expressions for homogeneous ice nucleation in the pressure range from -2600 to 500 bar. We show that this universal behavior arises from the pressure dependence of the interfacial free energy which we compute by means of the mold integration technique finding a shallow minimum around -2000 bar. Likewise, we show that the change in the interfacial free energy with pressure is proportional to the excess entropy and the slope of the melting line, exhibiting the latter a reentrant behavior also at the same negative pressure. Finally, we estimate the excess energy and the excess entropy of the ice Ih-water interface.
∗christoph.dellago@univie.ac.at
I Introduction
Water crystallization is an essential phase transition in nature and technology.
However, in the cryopreservation of biological samples
Geidobler and Winter (2013); Xue et al. (2015),
ice formation can be disastrous.
The low temperature preserves the biological material
but causes the water within the sample to be in a metastable state subject to crystallization
Pegg (2009). Interestingly, by keeping the sample under
high pressure, ice nuclei are less likely to form keeping
water
liquid for a longer time Kanno et al. (1975); Kalichevsky et al. (1995); Martino et al. (1998).
The frequency of the nucleation process is mainly determined by the thermodynamic driving force
and the cost of creating the interface between the emerging nucleus and the metastable liquid.
The reason why high pressure slows down the nucleation process is
that the difference in chemical potential between ice and water, ,
which represents the thermodynamic driving force,
barely changes between isobars whereas the cost of creating the interface
notably increases Espinosa et al. (2016a). The interfacial free energy is the variable that
quantifies this cost. At coexistence, through a planar interface,
the interfacial free energy differs from the value for
a critical nucleus due to the curvature of the surface Tolman (1949).
Nevertheless, both notably increase at high pressure Espinosa et al. (2016a).
Homogeneous ice nucleation at standard and high pressure has
been extensively explored
Sanz et al. (2013); Koop et al. (2000); Espinosa et al. (2014); Niu et al. (2019); Espinosa et al. (2016b, a); Piaggi et al. (2022); Li et al. (2011); Laksmono et al. (2015); Amaya and Wyslouzil (2018); Jeffery and Austin (1997); Cheng et al. (2018).
However, ice nucleation in
water under negative pressure, i.e. stretched water, has
caught less attention
Marcolli (2017); Bianco et al. (2021); Rosky et al. (2022).
This process is relevant in porous media
containing water solutions Roedder (1967) and also in water transpiration inside plants Wheeler and Stroock (2008) where negative pressure occurs.
Creating and maintaining negative pressure over a sample
is non-trivial in experiments Caupin et al. (2012).
This is because a liquid at negative pressure is metastable
Debenedetti (2021); Imre (2007).
In general, this metastability is considered with respect to the vapor phase
Menzl et al. (2016); Caupin and Herbert (2006),
although at certain conditions, it can be also metastable with respect to ice.
Some ingenious approaches to create negative pressure in metastable water
include the use of a Berthelot tube Henderson and Speedy (1980),
centrifugation Briggs (1950),
and more recently the use of acoustic waves Caupin and Herbert (2006); Davitt et al. (2010); Caupin et al. (2012).
In contrast, in computer
simulations is straightforward to work under negative pressures.
In this work, we investigate
how ice nucleation properties are affected
by negative pressure at different degrees of supercooling.
In fact, we find
little effect when pressure changes from strongly negative
to moderately positive.
We investigate
the role of the interfacial free energy since it is a key property in determining
the phase behavior of water at high pressure Espinosa et al. (2016a).
We find that the slope of the melting line is
crucial to describe the change with pressure of the interfacial free energy
which
displays a shallow minimum at negative pressure.
Our study is based on molecular dynamics simulations
with the TIP4P/Ice model Abascal et al. (2005)
which has been extensively used to describe ice nucleation Sanz et al. (2013); Espinosa et al. (2016a); Bianco et al. (2021); Niu et al. (2019) and growth Weiss et al. (2011); Montero de Hijes et al. (2019a) as well as in supercooled
water Debenedetti et al. (2020); Lupi et al. (2021).
In particular, we employ
the seeding technique Sanz et al. (2013); Espinosa et al. (2016c)
to study nucleation and the mold integration
technique Espinosa et al. (2016d) to measure the interfacial
free energy at coexistence.
II Simulation methods
All simulations have been done with the GROMACS package (4.6.7-version in double precision)
with the TIP4P/Ice water model.
The simulations are performed in the
isothermal-isobaric (NpT) ensemble with
a time step of 2 fs using the Noose-Hoover
thermostat Nosé (1984); Hoover (1985) and the
Parrinello-Rahman barostat Parrinello and Rahman (1980) both with a relaxation time of
0.5 ps. Electrostatic interactions are accounted for via
the particle-mesh-Ewald summation
algorithm Essmann et al. (1995) with order 4 and a Fourier spacing of 0.1 nm.
The cutoff for the Lennard-Jones and the
Coulombic interactions is set to 0.9 nm and long-range corrections to the Lennard-Jones
part of the potential are included in energy and pressure.
To study nucleation we use the seeding technique Bai and Li (2005); Knott et al. (2012); Sanz et al. (2013)
which involves the combination of molecular dynamics
simulations and Classical Nucleation Theory (CNT) Kelton and Greer (2010); Kashchiev (2000).
This technique is based on the behavior of
a critical nucleus which has equal
probability of growing and melting
when surrounded by the metastable phase
at the critical pressure and temperature.
In practice, one inserts a spherical ice-Ih seed
in metastable water and then keeps track of the
time evolution of the size of the cluster.
One can vary ,
and the seed size in order to find at which conditions a certain
nucleus size is critical ().
Once
is known, CNT is used to find the interfacial free energy
, the barrier height , and the nucleation rate .
Our system sizes ranged between 80000 and
250000 water molecules in total.
The duration of the trajectories is
between 40 and 115 ns.
It is important to note
that in the Gibbsian description of
interfaces, one has two bulk phases separated by a dividing surface. However,
there is some arbitrariness in the location of the dividing surface which
also affects to
the interfacial free energy when the interface has curvature Kondo (1956); Rowlinson and Widom (2013); Tröster et al. (2012); Montero de Hijes et al. (2020).
Within the CNT framework, the relevant dividing surface
is the surface of tension Kashchiev (2020); Montero de Hijes and Vega (2022).
In order to find the surface of tension we employ an empirical approach
that has been successfully applied
in crystal nucleation for a large variety of systems Espinosa et al. (2016c); Montero de Hijes et al. (2019b); Espinosa et al. (2016d, a); Bianco et al. (2021); Espinosa et al. (2017).
In this approach,
the averaged Steinhardt bond order parameter Lechner and Dellago (2008),
is used in combination with
the mislabelling
criterion Sanz et al. (2013) to identify ice-like and
water-like molecules. Within a cutoff distance of 3.5 Å, we obtain
for each molecule. The molecules with above
a certain threshold are labeled as ice whereas those
below are labeled as liquid. This threshold depends weakly on the considered
thermodynamic range covering pressures from -2600 to -1000 bar and temperatures
from 250 to 270 K (see the supplementary material in
Ref. Bianco et al. (2021) for the isothermal
change in with pressure). In this work, the value changes between 0.365
for the highest temperature and pressure
to 0.385 for the lowest temperature and pressure.
Once is known, we employ the CNT equations Kelton and Greer (2010); Kashchiev (2000) to determine other important parameters. The interfacial free energy is given as
| (1) |
where is the size of the critical nucleus, is the number density of ice-Ih in the bulk at the metastable conditions at which the nucleus is critical, and is known as the driving force to nucleation, i.e. the difference in chemical potential between the liquid and ice phases at the conditions which cause the nucleus to be critical. This property can be obtained by thermodynamic integration along an isobar Vega et al. (2008),
| (2) |
where is the Boltzmann constant, is the
melting temperature, and the enthalpy, which can be
obtained from simulations of bulk ice-Ih
and bulk water along the isobar of interest.
Then, the free energy barrier is given as
| (3) |
which allows us to obtain the nucleation rate , the number of critical nuclei forming per unit of time and volume. According to CNT, is given as
| (4) |
where is the attachment rate which can be approximated through this expression Espinosa et al. (2016a); Bianco et al. (2021)
| (5) |
where is the diffusion coefficient of the
metastable liquid and is a characteristic
length, the typical distance that a water molecule covers in order to attach into the nucleus,
whose value is approximately 3.8 Å for water
Espinosa et al. (2016a); Bianco et al. (2021).
To find the ice-Ih-water interfacial free energy at coexistence for a planar interface, , we use the mold integration technique Espinosa et al. (2016d), which consists in computing the reversible work that is necessary to form a crystal slab within a liquid at coexistence. This work is related to the interfacial free energy at coexistence, , by where is the interfacial area and the number 2 accounts for the two interfaces of the slab. The slab formation is induced by switching on an attractive interaction between the mold of potential energy wells and the particles of the initial liquid. The wells are arranged in the equilibrium positions of the oxygen atoms in the ice facet under investigation at coexistence conditions, i.e. for temperatures and pressures located along the ice Ih-water equilibrium line for the TIP4P/Ice water model. First, one has to obtain , which is given as
| (6) |
where indicates the radius of the potential wells
and is their
energy (with maximum depth equal to
). is the number of wells in the mold and
is the average number of occupied wells at a given potential depth .
The integration needs to be reversible. To ensure this,
thermodynamic integration is performed for wells whose radius
is larger than a certain value . At the slab is fully formed and the
stability no longer depends on the mold-liquid interactions, hence, leading to potentially
irreversible ice growth.
However, since
this is the radius that
recovers the actual value of ,
thermodynamic integration is repeated for several values of
and then is extrapolated to its value at
giving Espinosa et al. (2016d).
III Results
III.1 Universality in ice nucleation variables at negative and moderate pressure
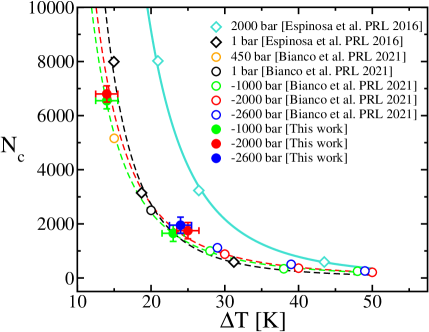
First, we study nucleation along the isobars of -2600, -2000, and -1000 bar by means of the seeding approach.
For pressures below -3000 bar we observed
spontaneous cavitation occurring within the time scale of the trajectories needed in the seeding method.
We obtain
the critical nucleus size ,
the driving force to nucleation ,
the interfacial free energy ,
the free energy barrier to nucleation
and the nucleation rate . These results are
presented in Table 1.
As can be seen, even though the pressure
significantly differs, the results are surprisingly similar
for nuclei of similar size for equivalent supercoolings.
This behaviour is considerably different from what has been found when comparing the nucleation scenario of normal vs. high pressure (i.e. 2000 bar; Ref. Espinosa et al. (2016a)), where the increase in pressure
brings down the ice nucleation rate.
| [K] | [K] | [bar] | [g/cm3] | [g/cm3] | [kJ/mol] | [mJ/m2] | [kJ/mol] | log [m-3s-1]) | |
| 1650 | 255 | 23 | -1000 | 0.9208 | 0.8999 | 0.367 | 21.62 | 303 | -24 |
| 7450 | 264 | 14 | -1000 | 0.9285 | 0.8985 | 0.237 | 23.03 | 883 | -136 |
| 1750 | 255 | 25 | -2000 | 0.8855 | 0.8916 | 0.367 | 21.87 | 321 | -28 |
| 7600 | 266 | 14 | -2000 | 0.8876 | 0.8894 | 0.224 | 21.74 | 850 | -128 |
| 1950 | 255 | 24 | -2600 | 0.8674 | 0.8866 | 0.340 | 20.89 | 332 | -30 |
a)
 b)
b)
To further understand this behavior, we connect our results with
those from previous works where nucleation
had been studied for the TIP4P/Ice model
at different pressures
including negative, moderate, and high pressure states Espinosa et al. (2016a); Bianco et al. (2021).
In Fig. 1 a) we show the critical nucleus size
as a function of supercooling for several isobars.
We provide results at moderate supercoolings at -2600, -2000, and -1000 bar.
For these same isobars as well as for the 1 bar isobar, we show the values reported in Ref.
Bianco et al. (2021). For the 1 bar isobar, we
also show the values given in Ref. Espinosa et al. (2016a),
which
also provides with the values at the 2000 bar isobar.
As can be seen, only the points corresponding to the 2000 bar
isobar Espinosa et al. (2016a)
exhibit a different trend. The isobars at
-2600, -2000, and -1000 bar from this work as well as from Ref. Bianco et al. (2021), and the 1 bar isobar from both Refs. Espinosa et al. (2016a); Bianco et al. (2021)
follow approximately the same curve.
Notice that even a point at 450 bar reported in
Ref. Bianco et al. (2021) was included being
in agreement with this group of isobars.
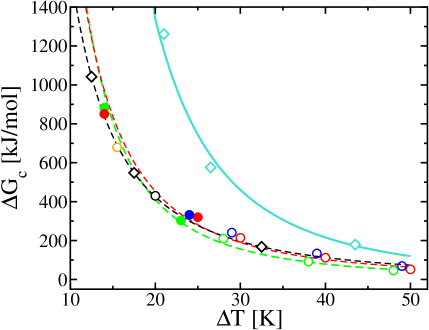
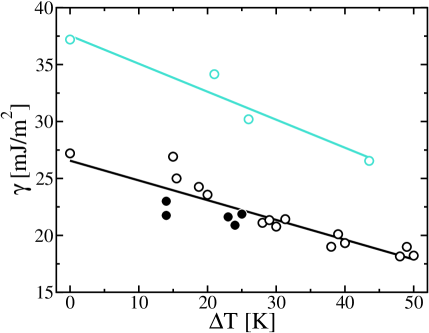
In fact, as shown in Fig. 1 b), pressure
hardly affects the nucleation free energy barrier
as a function of supercooling from -2600 bar to 450 bar.
Our results from Fig. 1 suggest that a similar nucleation behaviour as
a function of supercooling may take place
from -2600 to 450 bar.
That is a strikingly different behavior to the one observed when
increasing pressure to 2000 bar.
Thus, we propose
universal empirical expressions for the variation of
different homogeneous ice
nucleation properties with the
supercooling
independently of the pressure as long as it is within this regime.
Nevertheless, we first need to confirm
that what was observed for
and also applies to .
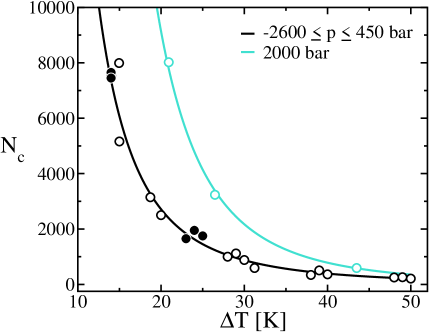
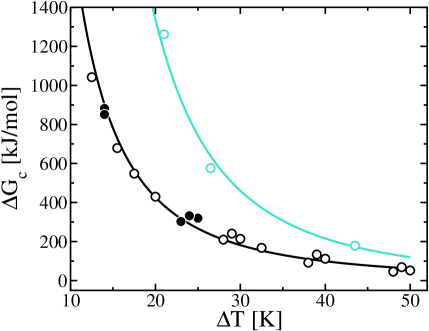
In Fig. 2
we show again a) and b) as well as c) and
d) . This time, for each
magnitude, we include
a common fit to
data from moderately positive to deeply negative pressure (including our own data and those from Refs. Espinosa et al. (2016a); Bianco et al. (2021)) along a separate fit
at high pressure Espinosa et al. (2016a).
In
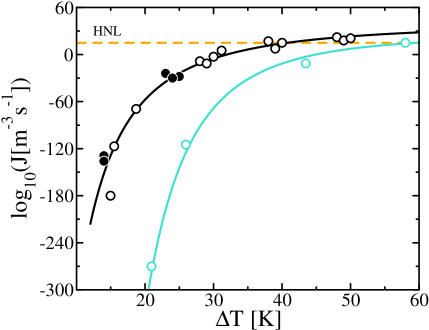
c) we show which exhibits higher variance.
Finally, in d), we show how very different pressures
(from largely negative
to moderately positive)
lead to approximately the same nucleation rate
as a function of supercooling, . The values of
are given in Table 2. Hence,
we can use the respective common fit
as universal
empirical expressions to describe the change with supercooling within this broad range of pressures.
For we obtain
| (7) |
and for (in kJ/mol)
| (8) |
where equals 1 K for correctness of units. For in mJ/m2, we obtain
| (9) |
and, finally, for in m-3 s-1, one should use Eq. 4 along with Eq. 8 (after converting into in units), and 1036 m-3s-1
as the prefactor
.
a)
 b)
b)
 c)
c)
 d)
d)
The results shown in Fig. 2 have interesting consequences. First, taking into account that
and (panels a) and c) respectively) are roughly independent of
when it goes from largely negative to moderately positive pressures, the isobaric Tolman length which determines the change
in with the inverse of the radius of curvature of the cluster along an isobar Tolman (1949); Schmelzer et al. (2019); Baidakov and Protsenko (2019)
is roughly constant too and equal to 0.24(5) nm, where the parenthesis indicates
uncertainty in the last digit. This result is in agreement with previous work Montero de Hijes et al. (2019b).
Second, in panel
d) one can see that from strongly negative to
moderately positive pressure we obtain the same nucleation rate with respect
to the supercooling which means that the homogeneous nucleation
line (HNL) should be at a constant distance to the melting
line in this regime
as predicted recently for this water model Bianco et al. (2021) as well
as for the mW model Molinero and Moore (2009) in Ref. Rosky et al. (2022). In Fig. 3
we show the estimates for the model Espinosa et al. (2016a); Bianco et al. (2021) assuming that the
HNL corresponds to an iso-nucleation rate of /(m-3s-1) = 15 and we compare it to the experimental HNL Kanno et al. (1975). Also,
the coexistence lines of the model Bianco et al. (2021) and the experimental one Marcolli (2017)
are presented showing how the distance between
the coexistence line and the HNL is roughly constant
until pressure increases enough such that the required supercooling
to reach becomes larger.
However, even though this result might be useful,
a physical explanation is still missing.
In order to answer this question, we look at the
pressure-induced deceleration of ice nucleation. In 2016,
Espinosa et al. Espinosa et al. (2016a) showed that the origin of this
phenomenon arises from the increase with pressure of
the interfacial
free energy both at coexistence and for nucleation ( at
a given supercooling ) while the difference in chemical potential does not change
so much with . Thus, one needs a larger to obtain
the same at high pressure.
In this work, we observe approximately the same
as a function of from strongly negative to moderately positive pressure.
Since we obtain roughly the same as a function of at different
negative pressures, we expect also to barely change
with . The term refers to a planar interface between
ice and water at certain conditions along the coexistence line whereas the term
refers to a curved interface between a critical nucleus of ice and water at a certain supercooling
along an isobar. In both cases, thermodynamic equilibrium holds.
However, when the interface is planar then the pressure is equal in both phases while
in a spherical interface the pressure changes between
phases following the Young-Laplace equation. Then, we compute for several points.
In addition to the negative pressure isobars,
we compute two points at 1000 bar and 2000 bar respectively.
We study only the basal
plane as we do not
expect severe anisotropy (as much as 10) with the prismatic ones Handel et al. (2008); Davidchack et al. (2012); Rozmanov and Kusalik (2012); Espinosa et al. (2016d). The results are presented in Table 2
and in Fig. 4.
As shown, barely
changes along the coexistence line when varies from strongly negative to
moderately positive. Interestingly, displays a shallow minimum.
Thus, as long as does not change significantly
with at negative ,
one can explain why
in Fig.
2, , , ,
and seem to be independent of against the supercooling when is
negative or moderate.
In order to
confirm this, we
evaluate the effect of on
as a function of supercooling by
comparing with the value at 1 bar.
To do so, we compute
for the different isobars -2600, -2000, -1000, 1, 2000 bar as a function of (for 1 and 2000 bar we use the data from Ref. Espinosa et al. (2016a)).
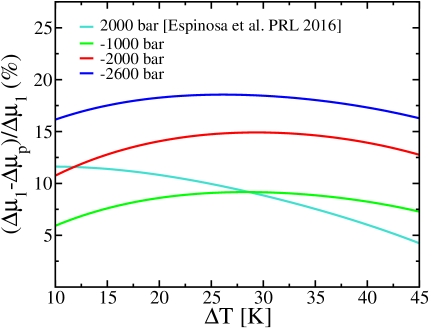
As can be seen in Fig. 5 a),
the 2000 bar isobar is very similar to the -1000 bar one
in terms of with respect to ,
and the -2600 bar is the one that deviates the most
with up to 18. This deviation is however
compensated in which is
rather dispersed and in the end ,
, and are very well
described by universal empirical expressions.
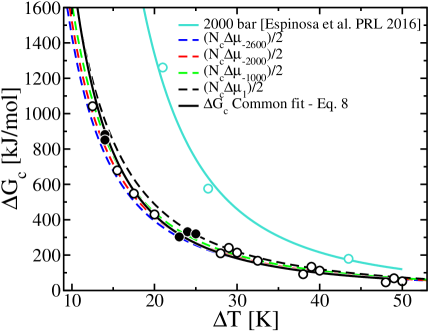
Moreover, in Fig. 5 b),
we show obtained as
by setting
to the common fit of
Eq. 7 and changing to that
of the different isobars.
As can be seen,
from strongly
negative to moderately positive
pressure, the change in does not
significantly affect the free energy barrier for
isobars between -2600 to 450 bar.
Thus, we confirm that the universality in nucleation properties presented
in Fig. 1 and Fig. 2 is the consequence of the
small variation with
of the difference in chemical
potential as well as in
the interfacial free energy both at coexistence
and for the nucleation at a given .
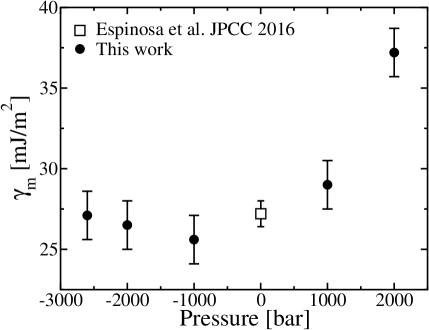
| [bar] | [K] | [mJ/m2] |
|---|---|---|
| -2600 | 279.0 | 27.1(1.5) |
| -2000 | 280.0 | 26.5(1.5) |
| -1000 | 278.0 | 25.6(1.5) |
| 1 | 270.0 | 27.2 (0.8) |
| 1000 | 260.0 | 29.0(1.5) |
| 2000 | 246.5 | 37.2(1.5) |
a)
 b)
b)
III.2 Interfacial free energy and melting line of the ice Ih-water interface
We now understand the small variability with pressure of the nucleation properties as a function of supercooling at negative and moderate pressure. In order to understand why displays a shallow minimum, we use the thermodynamic formalism of Gibbs for interfaces Gibbs (1928); Rowlinson and Widom (2013). The interfacial Gibbs-Duhem relation is given by,
| (10) |
where is the surface excess density, also called adsorption, and is the excess contribution to the entropy. Since the location of the dividing surface is arbitrary, excess functions depend also on this choice with the exception of . For a planar interface, does not change with the location of the dividing surface unlike in the case of curved interfaces, where does change with its location Rowlinson and Widom (2013); Montero de Hijes et al. (2020); Montero de Hijes and Vega (2022). The choice that most simplifies the thermodynamic treatment in our case is the equimolar dividing surface, usually denoted as the Gibbs dividing surface, where the excess components is zero, and so is (see Appendix for a general dividing surface treatment). Hence, we can write
| (11) |
where the superscript denotes the equimolar dividing surface. Equation 11 provides us with the temperature dependence of the interfacial free energy. It is crucial to note that this derivative must be taken along the coexistence line so that is not constant. In fact, we can change Eq. 11 to describe the change of with pressure along the melting line as,
| (12) |
In our case, Eq. 12 is
more convenient due to the reentrant behavior of the melting curve,
i.e. for each one has two values of
whereas for each there is only one value of (see solid red curve in Fig. 3).
From Eq. 12, one can see that the change in with
is determined by the slope of the melting line
and the value of the excess entropy per area at the
equimolar dividing surface, .
This means that
if there is reentrant behavior for the melting point, there must be
reentrant behavior also for as a function of pressure exactly
at the same , because must be finite.
In fact, Bianco et al. Bianco et al. (2021) reported
reentrant behavior in the ice Ih-liquid coexistence
line of TIP4P/Ice, whose turning point occurred at -2000 bar.
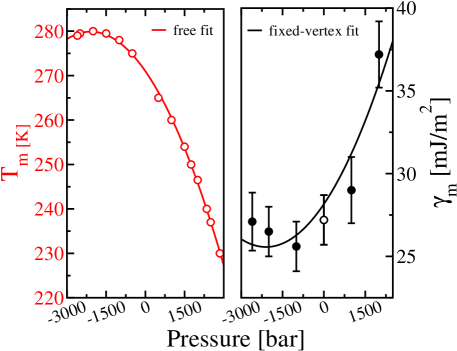
Next, we want to confirm that the maximum in
the melting line is consistent with the
minimum in that we have
obtained from the mold integration technique. Thus,
we fit the data for
from mold integration with a quadratic fit
with the constraint of having the vertex at the same
(-2000 bar) as the quadratic
fit for . The latter,
has the parameters 271 K, K/bar, and K/bar2.
In this way, we
assume that is constant.
The result is shown
in Fig. 6. In the left panel, we show
the melting line with points from the direct
coexistence simulations of Ref. Bianco et al. (2021)
and the quadratic fit. On the right panel,
we show the points of from mold integration
from this work and Ref. Espinosa et al. (2016d)
as well as the quadratic fit.
As can be seen in the right panel, the fit is
fairly good even though we impose constant and quadratic fits with the
constraint of having the vertex at the same .
Therefore, assuming that
is constant seems to be a reasonable
approximation.
At this level of approximation,
is found to be 0.32 mJm2K. Notice that
as expected from Eq. 12.
For instance, from 1 bar to 2000 bar, decreases from 270 K to 246.5 K,
and increases from 27.2 mJ/m2 to 37.2 mJ/m2.
Therefore, 0 and 0, which
means that is positive. On the other side
of the vertex, from -2600 bar to -2000 bar, increases from 279 K to 280K while
decreases from 27.1 mJ/m2 to 26.5 mJ/m2. Hence, 0 and 0
so that the same sign in holds.
Notice that Eq. 11
is only valid for planar interfaces along the melting line.
If one tries to apply this equation away from of this line
as was done in previous works Espinosa et al. (2016a); Qiu et al. (2018); Piaggi et al. (2022),
probably one should incorporate terms that account for the change in
due to curvature.
Notice also that the empirical relation proposed by Turnbull which
states that is
proportional to the change in melting enthalpy does not
describe well at high pressure.
From 1 to 2000 bar,
decreases from 1.44 kcal/mol
to almost 1
kcal/mol in experiments Eisenberg and Kauzmann (2005) and
from 1.29 kcal/mol
to approximately 1 kcal/mol Abascal et al. (2009)
for the TIP4P/Ice model.
Thus, the Turnbull relation predicts a
decreasing , which is not supported by our direct
calculations via the mold integration technique.
As can be seen in Fig. 6, the knowledge of the equilibrium melting curve, and the assumption of a constant value for the interfacial excess entropy is sufficient to understand the complex variation of along the melting line. Another relevant excess variable which depends on , , and is the excess energy ,
| (13) |
The excess energy is the difference in energy between the actual system having an interface and a virtual system where the two phases remain unchanged up to the dividing surface (the equimolar one in this case). As a result of Eq. 12, the following relation holds,
| (14) |
so that if is constant, then must
be constant as well. If we approximate as constant with the value of 0.32 mJ/m2K,
we find 115 mJ/m2.
IV Conclusions
In conclusion, we perform seeding simulations to study ice nucleation at negative pressures. Such conditions can be relevant in porous media and water transport in plants, where supercooled water can be at negative pressure. By comparing with previous results, we show that universal empirical expressions describe , , , and , as a function of supercooling for isobars in the regime from strongly negative (-2600 bar) to moderately positive pressures (500 bar). Only when pressure is high (2000 bar), these relations break down. In the regime where pressure hardly plays any role, the isobaric Tolman length is predicted to be positive and roughly constant with the value of 0.24 nm. Also, our results suggest that the homogeneous nucleation line should be parallel to the coexistence line when pressure is below approximately 500 bar (while at higher pressure they are not). We explain this result by inspecting how the interfacial free energy at coexistence changes with pressure. We evaluate the interfacial free energy at coexistence at different states from strongly negative to high pressure by means of the mold integration technique. We show that the interfacial free energy at coexistence barely changes with pressure as long as the system is below 500 bar. In fact, a shallow minimum is reported at negative pressure suggesting that the minimum interfacial free energy between ice Ih and water is around 26 1 mJ/m2 for the basal plane expanding for a broad range of pressure centered around -2000 bar. Then, we use the Gibbsian formalism to explain that this minimum in the interfacial free energy is connected to a maximum in the melting temperature as a function of pressure. In particular, we show that the change in the interfacial free energy with pressure is proportional to the excess entropy and to the slope of the melting line. Thus, the reentrance in the interfacial free energy occurs because of the reentrance in the melting line, which happens due to the cross-over in density between ice and water. Finally, we estimate the excess entropy and the excess energy of the ice Ih-water interface. We suggest that a constant value of 0.32mJ/m2K and 115 mJ/m2 respectively is enough to provide a good description of the thermodynamics of the ice Ih-water interface.
V Acknowledgments
The authors thank Eduardo Sanz and Salvatore Romano for fruitful discussions. PMdH ackowledges support from the SFB TACO (project nr. F81-N) funded by the Austrian Science Fund. JRE acknowledges funding from the Oppenheimer Fellowship, the Roger Ekins Fellowship from Emmanuel College, and a Ramon y Cajal Fellowship (RYC2021‐030937‐I). CV acknowledges support from project PID2019-105898GB-C21 of the Ministerio de Educacion y Cultura. This work has been performed using resources provided by the Spanish Supercomputing Network (RES), the Vienna Scientific Cluster (VSC), and the Cambridge Tier-2 system operated by the University of Cambridge Research Computing Service (http://www.hpc.cam.ac.uk) funded by EPSRC Tier-2 capital grant EP/P020259/1.
VI Author declarations
VI.1 Conflict of Interest
The authors have no conflicts to disclose.
VI.2 Data availability
The data that support the findings of this study are available from the corresponding author upon reasonable request.
VII Appendix: Interfacial free energy along the melting line for a general dividing surface
In this work we used the equimolar dividing surface for simplicity. However, Eqs. 11 and 12 can be generalized for any choice of the dividing surface. To do so, it is necessary to involve not only the interfacial Gibbs-Duhem relation (10), but also the ice and liquid Gibbs-Duhem relations. Respectively, these are,
| (15) |
| (16) |
where is the volume per molecule (the inverse of the number density) and is the entropy per molecule. Since phase equilibrium holds, , , and are common in all phases. Notice that from Eq. 15 and Eq. 16, one can obtain the Clausius-Clapeyron relation that explains the slope of the melting line.
| (17) |
By including also Eq. 10 in the relation, one can obtain the temperature and pressure dependence of the interfacial free energy without imposing a specific dividing surface. For the temperature, one obtains,
| (18) |
whereas for the pressure, one finds
| (19) |
References
- Geidobler and Winter (2013) R. Geidobler and G. Winter, European Journal of Pharmaceutics and Biopharmaceutics 85, 214 (2013).
- Xue et al. (2015) X. Xue, H.-L. Jin, Z.-Z. He, and J. Liu, Journal of Heat Transfer 137, 091020 (2015).
- Pegg (2009) D. E. Pegg, Preservation of Human oocytes CRC Press (2009).
- Kanno et al. (1975) H. Kanno, R. Speedy, and C. Angell, Science 189, 880 (1975).
- Kalichevsky et al. (1995) M. Kalichevsky, D. Knorr, and P. Lillford, Trends in Food Science & Technology 6, 253 (1995).
- Martino et al. (1998) M. N. Martino, L. Otero, P. Sanz, and N. Zaritzky, Meat Science 50, 303 (1998).
- Espinosa et al. (2016a) J. R. Espinosa, A. Zaragoza, P. Rosales-Pelaez, C. Navarro, C. Valeriani, C. Vega, and E. Sanz, Physical Review Letters 117, 135702 (2016a).
- Tolman (1949) R. C. Tolman, The journal of Chemical Physics 17, 333 (1949).
- Sanz et al. (2013) E. Sanz, C. Vega, J. Espinosa, R. Caballero-Bernal, J. Abascal, and C. Valeriani, Journal of the American Chemical Society 135, 15008 (2013).
- Koop et al. (2000) T. Koop, B. Luo, A. Tsias, and T. Peter, Nature 406, 611 (2000).
- Espinosa et al. (2014) J. Espinosa, E. Sanz, C. Valeriani, and C. Vega, The Journal of Chemical Physics 141, 18C529 (2014).
- Niu et al. (2019) H. Niu, Y. I. Yang, and M. Parrinello, Physical Review Letters 122, 245501 (2019).
- Espinosa et al. (2016b) J. Espinosa, C. Navarro, E. Sanz, C. Valeriani, and C. Vega, The Journal of Chemical Physics 145, 211922 (2016b).
- Piaggi et al. (2022) P. M. Piaggi, J. Weis, A. Z. Panagiotopoulos, P. G. Debenedetti, and R. Car, Proceedings of the National Academy of Sciences 119 (2022).
- Li et al. (2011) T. Li, D. Donadio, G. Russo, and G. Galli, Physical Chemistry Chemical Physics 13, 19807 (2011).
- Laksmono et al. (2015) H. Laksmono, T. A. McQueen, J. A. Sellberg, N. D. Loh, C. Huang, D. Schlesinger, R. G. Sierra, C. Y. Hampton, D. Nordlund, M. Beye, et al., The Journal of Physical Chemistry Letters 6, 2826 (2015).
- Amaya and Wyslouzil (2018) A. J. Amaya and B. E. Wyslouzil, The Journal of Chemical Physics 148, 084501 (2018).
- Jeffery and Austin (1997) C. Jeffery and P. Austin, Journal of Geophysical Research: Atmospheres 102, 25269 (1997).
- Cheng et al. (2018) B. Cheng, C. Dellago, and M. Ceriotti, Physical Chemistry Chemical Physics 20, 28732 (2018).
- Marcolli (2017) C. Marcolli, Scientific reports 7, 1 (2017).
- Bianco et al. (2021) V. Bianco, P. M. de Hijes, C. P. Lamas, E. Sanz, and C. Vega, Physical Review Letters 126, 015704 (2021).
- Rosky et al. (2022) E. Rosky, W. Cantrell, T. Li, and R. A. Shaw, Chemical Physics Letters 789, 139289 (2022).
- Roedder (1967) E. Roedder, Science 155, 1413 (1967).
- Wheeler and Stroock (2008) T. D. Wheeler and A. D. Stroock, Nature 455, 208 (2008).
- Caupin et al. (2012) F. Caupin, A. Arvengas, K. Davitt, M. E. M. Azouzi, K. I. Shmulovich, C. Ramboz, D. A. Sessoms, and A. D. Stroock, Journal of Physics: Condensed Matter 24, 284110 (2012).
- Debenedetti (2021) P. G. Debenedetti, in Metastable Liquids (Princeton university press, 2021).
- Imre (2007) A. R. Imre, Physica status solidi (b) 244, 893 (2007).
- Menzl et al. (2016) G. Menzl, M. A. Gonzalez, P. Geiger, F. Caupin, J. L. Abascal, C. Valeriani, and C. Dellago, Proceedings of the National Academy of Sciences 113, 13582 (2016).
- Caupin and Herbert (2006) F. Caupin and E. Herbert, Comptes Rendus Physique 7, 1000 (2006).
- Henderson and Speedy (1980) S. Henderson and R. Speedy, Journal of Physics E: Scientific Instruments 13, 778 (1980).
- Briggs (1950) L. J. Briggs, Journal of Applied Physics 21, 721 (1950).
- Davitt et al. (2010) K. Davitt, E. Rolley, F. Caupin, A. Arvengas, and S. Balibar, The Journal of Chemical Physics 133, 174507 (2010).
- Abascal et al. (2005) J. Abascal, E. Sanz, R. García Fernández, and C. Vega, The Journal of Chemical Physics 122, 234511 (2005).
- Weiss et al. (2011) V. C. Weiss, M. Rullich, C. Köhler, and T. Frauenheim, The Journal of Chemical Physics 135, 034701 (2011).
- Montero de Hijes et al. (2019a) P. Montero de Hijes, J. Espinosa, C. Vega, and E. Sanz, The Journal of Chemical Physics 151, 044509 (2019a).
- Debenedetti et al. (2020) P. G. Debenedetti, F. Sciortino, and G. H. Zerze, Science 369, 289 (2020).
- Lupi et al. (2021) L. Lupi, B. Vázquez Ramírez, and P. Gallo, The Journal of Chemical Physics 155, 054502 (2021).
- Espinosa et al. (2016c) J. R. Espinosa, C. Vega, C. Valeriani, and E. Sanz, The Journal of Chemical Physics 144, 034501 (2016c).
- Espinosa et al. (2016d) J. R. Espinosa, C. Vega, and E. Sanz, The Journal of Physical Chemistry C 120, 8068 (2016d).
- Nosé (1984) S. Nosé, The Journal of Chemical Physics 81, 511 (1984).
- Hoover (1985) W. G. Hoover, Physical review A 31, 1695 (1985).
- Parrinello and Rahman (1980) M. Parrinello and A. Rahman, Physical Review Letters 45, 1196 (1980).
- Essmann et al. (1995) U. Essmann, L. Perera, M. L. Berkowitz, T. Darden, H. Lee, and L. G. Pedersen, The Journal of Chemical Physics 103, 8577 (1995).
- Bai and Li (2005) X. M. Bai and M. Li, The Journal of Chemical Physics 122, 224510 (2005).
- Knott et al. (2012) B. C. Knott, V. Molinero, M. F. Doherty, and B. Peters, Journal of the American Chemical Society 134, 19544 (2012).
- Kelton and Greer (2010) K. F. Kelton and A. L. Greer, Nucleation in condensed matter: applications in materials and biology (Elsevier, 2010).
- Kashchiev (2000) D. Kashchiev, Nucleation (Elsevier, 2000).
- Kondo (1956) S. Kondo, The Journal of Chemical Physics 25, 662 (1956).
- Rowlinson and Widom (2013) J. S. Rowlinson and B. Widom, Molecular theory of capillarity (Courier Corporation, 2013).
- Tröster et al. (2012) A. Tröster, M. Oettel, B. Block, P. Virnau, and K. Binder, The Journal of Chemical Physics 136, 064709 (2012).
- Montero de Hijes et al. (2020) P. Montero de Hijes, K. Shi, E. G. Noya, E. Santiso, K. Gubbins, E. Sanz, and C. Vega, The Journal of Chemical Physics 153, 191102 (2020).
- Kashchiev (2020) D. Kashchiev, The Journal of Chemical Physics 153, 124509 (2020).
- Montero de Hijes and Vega (2022) P. Montero de Hijes and C. Vega, The Journal of Chemical Physics 156, 014505 (2022).
- Montero de Hijes et al. (2019b) P. Montero de Hijes, J. R. Espinosa, E. Sanz, and C. Vega, The Journal of Chemical Physics 151, 144501 (2019b).
- Espinosa et al. (2017) J. R. Espinosa, G. D. Soria, J. Ramirez, C. Valeriani, C. Vega, and E. Sanz, The Journal of Physical Chemistry Letters 8, 4486 (2017).
- Lechner and Dellago (2008) W. Lechner and C. Dellago, The Journal of Chemical Physics 129, 114707 (2008).
- Vega et al. (2008) C. Vega, E. Sanz, J. Abascal, and E. Noya, Journal of Physics: Condensed Matter 20, 153101 (2008).
- Schmelzer et al. (2019) J. W. Schmelzer, A. S. Abyzov, and V. G. Baidakov, Entropy 21, 670 (2019).
- Baidakov and Protsenko (2019) V. G. Baidakov and K. R. Protsenko, The Journal of Physical Chemistry B 123, 8103 (2019).
- Molinero and Moore (2009) V. Molinero and E. B. Moore, The Journal of Physical Chemistry B 113, 4008 (2009).
- Handel et al. (2008) R. Handel, R. L. Davidchack, J. Anwar, and A. Brukhno, Physical Review Letters 100, 036104 (2008).
- Davidchack et al. (2012) R. L. Davidchack, R. Handel, J. Anwar, and A. V. Brukhno, Journal of Chemical Theory and Computation 8, 2383 (2012).
- Rozmanov and Kusalik (2012) D. Rozmanov and P. G. Kusalik, The Journal of chemical physics 137, 094702 (2012).
- Gibbs (1928) J. W. Gibbs, The collected works of J. Willard Gibbs, volume I: thermodynamics (Yale University Press, 1928).
- Qiu et al. (2018) Y. Qiu, L. Lupi, and V. Molinero, The Journal of Physical Chemistry B 122, 3626 (2018).
- Eisenberg and Kauzmann (2005) D. Eisenberg and W. Kauzmann, The structure and properties of water (OUP Oxford, 2005).
- Abascal et al. (2009) J. L. Abascal, E. Sanz, and C. Vega, Physical Chemistry Chemical Physics 11, 556 (2009).