Broad emission lines in optical spectra of hot dust-obscured galaxies can contribute significantly to JWST/NIRCam photometry
Abstract
Selecting the first galaxies at from JWST surveys is complicated by contaminants with degenerate photometry. For example, strong optical nebular emission lines at may mimic JWST/NIRCam photometry of Lyman Break Galaxies (LBGs). Dust-obscured galaxies in particular are potentially important contaminants, and their faint rest-optical spectra have been historically difficult to observe. A lack of optical emission line and continuum measures for dusty galaxies now makes it difficult to test their expected JWST/NIRCam photometry for degenerate solutions with NIRCam dropouts. Towards this end, we quantify the contribution by strong emission lines to NIRCam photometry in a physically motivated manner by stacking 21 Keck II/NIRES spectra of hot, dust-obscured, massive () and infrared (IR) luminous galaxies at . We derive an average spectrum and measure strong narrow (broad) [OIII]5007 and H features with equivalent widths of Å (Å) and Å (Å) respectively. These features can increase broadband NIRCam fluxes by factors of (mag). Due to significant dust-attenuation (), we find H+[NII] to be significantly brighter than [OIII]+H, and therefore find that emission-line dominated contaminants of high galaxy searches can only reproduce moderately blue perceived UV continua of with and . While there are some redshifts () where our stack is more degenerate with the photometry of LBGs between m, redder filter coverage beyond m and far-IR/sub-mm follow-up may be useful for breaking the degeneracy and making a crucial separation between two fairly unconstrained populations, dust-obscured galaxies at z and LBGs at z.
revtex4-1Repair the float
1 Introduction
A major objective baked into the design of JWST is detecting the light from the first galaxies residing at ultra-high redshifts (). Delivering on its promise, more than 30 galaxy candidates with photometric redshift solutions favoring were identified within the first months of publicly available data (Bradley et al., 2022; Donnan et al., 2022; Naidu et al., 2022a; Harikane et al., 2022; Finkelstein et al., 2022a; Yu-Yang Hsiao et al., 2022). Assessing the fidelity of these samples is critical, particularly because the statistics assuming current candidates are real may or may not violate CDM predictions (Naidu et al., 2022a; Boylan-Kolchin, 2022; Labbe et al., 2022; Maio & Viel, 2022).
Spectroscopic confirmation is needed to verify these redshifts. However, some early attempts at spectroscopic follow-up using facilities such as ALMA have yielded upper limits or tentative low-SNR detections (e.g., Bakx et al., 2022; Kaasinen et al., 2022; Yoon et al., 2022; Fujimoto et al., 2022). JWST/NIRSpec has proven capable of spectroscopically detecting the rest-frame optical light from galaxies up to (Carnall et al., 2022; Roberts-Borsani et al., 2022), but this might not be well-suited for rapidly validating redshifts in statistical samples. A complimentary approach, born from similar rest-frame optical colors of Lyman Break Galaxies (LBGs) and dusty galaxies (Howell et al., 2010; Casey et al., 2014), is to use far-IR/sub-mm followup observations of cold dust continuum (Zavala et al., 2022) and/or far-IR cooling lines (Fujimoto et al., 2022) to identify or rule out IR-luminous galaxies lurking within candidate catalogs. Dusty sources have posed a problem to the fidelity of high galaxy catalogs since selection from Hubble Space Telescope (HST) extragalactic deep fields (e.g., Dunlop et al., 2007). HST samples at were contaminated by dusty, star-forming galaxies. Now, dusty galaxies may be contaminating JWST samples. A contributing factor to this contamination is that both populations have similar, and uncertain, number densities: dusty star-forming galaxies at have volume number densities (Michałowski et al., 2017; Koprowski et al., 2017; Rowan-Robinson et al., 2018; Dudzevičiūtė et al., 2020; Gruppioni et al., 2020; Manning et al., 2022; Long et al., 2022), similar to early measurements of bright LBGs (Finkelstein et al., 2022a; Naidu et al., 2022a; Harikane et al., 2022; Bouwens et al., 2022). Disentangling these two populations is therefore also crucial for reducing uncertainties in their respective number densities, which are currently inflated by sample purity (e.g., Bouwens et al., 2022).
Of particular concern within the rest-frame optical/near-IR spectra of IR-luminous galaxies is the relative contribution of strong narrow and broad emission lines to broadband filter fluxes, which could mask red continuum slopes produced by dust attenuation. Strong nebular lines can change JWST/NIRCam colors (Zackrisson et al., 2008; Schaerer & de Barros, 2009; Stark et al., 2013; Wilkins et al., 2013, 2020, 2022). This may be a promising tool for pseudo-spectroscopy of lower redshift galaxies using narrow-band filters, but in this particular instance is a source of potential population confusion for broadband high-redshift surveys. Indeed, some of the hottest and most luminous dusty galaxies at exhibit very high rest-frame optical line equivalent widths (EWs) (Finnerty et al., 2020). These arise from a combination of low dust-attenuated continuum levels with bright lines emergent from less obscured regions, as well as ionized outflows driven by Active Galactic Nuclei (AGN). To what extent do these strong lines contribute to JWST photometry?
In this letter, we take an empirically-grounded approach and quantify the contamination from emission lines from hot dust-obscured galaxies to JWST/NIRCam photometry. In Section 2 we describe Keck II/NIRES observations of a sample of 4 luminous, IR galaxies () and 17 hot dust, obscured galaxies (DOGs, ) between , which we stack to derive an average optical spectrum (Section 3). We quantify the contribution of strong and broad optical emission lines to NIRCam fluxes in Section 4, and discuss their impact on distinguishing between such sources at and LBGs. Section 5 summarizes our main findings. Throughout this work we adopt a CDM cosmology with and .
2 Sample and Data
Hot DOGs were originally selected from WISE photometry as W1W2-dropouts and include the most-luminous galaxies in the Universe (Eisenhardt et al., 2012; Wu et al., 2012). This extreme population is experiencing a rapid phase of both supermassive black-hole and stellar mass assembly (Eisenhardt et al., 2012), and are mostly found at with (Wu et al., 2012; Assef et al., 2015; Tsai et al., 2015). Most hot DOGs exhibit strong ionized outflows in optical spectroscopy (Wu et al., 2018; Finnerty et al., 2020; Jun et al., 2020), as implied by broad line components likely driven by radiative AGN feedback Wu et al. (2018). These sources are rare with only over the full WISE All-sky survey (Cutri & et al., 2012).
The Hot DOG spectra were previously described in Finnerty et al. (2020). In brief, we obtained simultaneous spectra at with Keck II/NIRES (Wilson et al., 2004) and reduced the data using SPEXTOOL (Cushing et al., 2004). Flux calibration was performed by comparing the integrated flux with photometry, see Finnerty et al. (2020) for details. Our stacked spectrum uses the 17 sources with detections of [OIII], H and/or [NII], H.
In addition to the hot DOGs, we include in our analysis previously unpublished Keck II/NIRES spectra of four galaxies with and : GS 3 (, RA/DEC = 03:32:08.66, -27:47:34.4), GS 7 (, RA/DEC = 03:32:26.49, -27:40:35.7), GN 1 (, RA/DEC = 12:36:45.83, +62:07:54.0), and GN 40 (, RA/DEC = 12:36:49.65, +62:07:38.6). These targets were selected for existing Spitzer/IRS mid-infrared spectroscopy and bright IRAC Ch. 1 photometry from a 24m-selected parent sample (Kirkpatrick et al., 2012, 2015). GS 3, GS 7, and GN 40 are mid-IR AGN (Kirkpatrick et al., 2015), and GN 1 is a composite source with a mid-IR AGN fraction of 50%. These sources have LIR on-average an order of magnitude lower than those of the hot DOGs. We reduce the data for this sub-sample following the exact same procedures as the hot DOGs described in Finnerty et al. 2020. [O II], [OIII], H and [NII], H are individually detected with EWs on-average lower than those of the hot DOGs but within their range.
3 Analysis
In this work we compute synthetic photometry in broadband JWST/NIRCam filters for the rest-frame optical spectrum of our stacked spectrum redshifted between . While we do not claim our sample to be definitively representative of all dusty systems owing to the extreme nature of hot DOGs, the final stack is derived from empirical data with no modelling required. While a more detailed study exploring a range of continuum templates with added nebular lines is warranted, such analysis is beyond the scope of this work given the current lack of constraint on rest-frame optical spectra of dusty galaxies beyond . To supplement our analysis of very luminous, massive hot DOGs, we also compute synthetic photometry for the average dusty, star-forming galaxy (DSFG) spectrum from Casey et al. 2017. The Casey et al. 2017 stack is constructed from Keck/MOSFIRE spectra of 20 LIRGs and ULIRGs with , a more typical IR-bright galaxy population selected from ground-based single dish sub-mm surveys (Casey et al., 2013).
3.1 Stacking
Prior to stacking the data, we convert the observed wavelength range of each spectrum to the rest-frame with spectroscopic redshifts derived from optical lines with low errors (, Finnerty et al. 2020). Next, we rebin the spectra to a common wavelength grid corresponding to the lowest rest-frame spectral resolution (R ). Finally, we calculate the sigma-clipped mean continuum flux from line-free regions which we use to normalize each spectra in the stack.
We tested multiple stacking procedures and found that a mean noise-weighted continuum stack produced the cleanest continuum and highest line SNRs. In the stack, the input spectrum is first normalized by its sigma-clipped mean flux and then weighted by the spectral uncertainty per channel. This ensures that the stack is not dominated by particularly noisy spectral regions and/or the brightest spectra. As the goal of this analysis is the relative contribution of strong emission lines to photometry, we are not concerned with absolute normalization of the spectrum. To quantify the uncertainty on the continuum and line profiles, we repeat the stacking analysis 1000 times, using in each iteration 21 random samples of the input spectra with replacement (“bootstrapping”). From the bootstrapped uncertainties we determine that our final stacked spectrum is reliable between m.
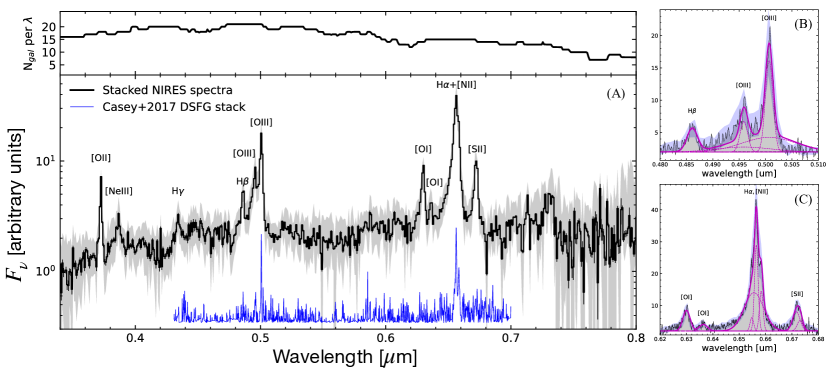
The final stacked spectrum is shown in Figure 1. We detect strong [OIII], H, [NII], H emission lines, as well as [S II], [O II], [O I], [Ne III] and H. The [O I]6300/H line ratio is , which is on the high end of the distribution measured for Seyfert galaxies in the Swift-BAT AGN Spectroscopic Survey (Koss et al., 2017). EWs for the strong lines around the [OIII], H and [NII], H complexes are listed in Table 1. Quoted uncertainties correspond to the standard deviation of EWs measured for 100 realizations of the spectrum perturbed by the spectral uncertainty per channel, and assuming a 10% error on the continuum (uncertainties increase by a factor of assuming a 20% error on the continuum).
We also compare our stacked spectrum to the stack from Casey et al. 2017 derived from MOSFIRE spectra of DSFGs.111Available at http://www.as.utexas.edu/~cmcasey/downloads.html The stack of Casey et al. 2017 exhibits narrower emission lines than our spectrum, and does not contain the broad outflow signatures founds in hot DOG rest-frame optical spectra (Finnerty et al., 2020; Wu et al., 2018).
3.2 Synthetic Photometry
To test the effect of emission lines on JWST/NIRCam photometry, we subtract strong spectral features from the stack to produce a line-free continuum spectrum. To do so, we subtract the gaussian model fits from the stack. These lines include all shown in Figure 1 (B, C) and include the range of velocity components required to fit individual hot DOGs, namely: broad [O III] and H emission, narrow [O I], [O III], [S II], H, and H (Finnerty et al., 2020). We do not mask out [OII], [NeIII] and H in this exercise as their lower EWs correspond to significantly less increase in broadband fluxes relative to [OIII]+H and [NII]+H. Following Finnerty et al. 2020, we assume narrow and broad profiles across different lines arise from the same kinematic components. This amounts to fixing [N II] widths to that of the corresponding H component. We also fix the [N II]Å ratio to 0.338 and the [O III]Å ratio to 0.335. In addition to the line-free stacked spectrum, we also compute a broad-line only spectrum (continuum broad line emission).
We calculate synthetic JWST/NIRCam photometry using the filter response profiles provided by the JWST User Documentation. We convolve each filter with both the stacked spectrum and line-subtracted stack for a range in redshift between in steps of . We then take the ratio of filter flux between the line stack and line-subtracted (or broad line only) stack to infer the increase in flux attributed to emission lines as a function of redshift.
3.2.1 Composite DSFG spectrum from Casey et al. (2017)
As both a check against our stack and a test for systems at lower LIR than the hot DOGs, we repeat our synthetic photometry calculations for the composite DSFG spectrum from Casey et al. 2017. We scale their continuum-subtracted H flux in their stack to the equivalent of 100 in star-formation rate using the FHα calibration of Murphy et al. (2011). As the change in flux density due to nebular emission is a function of the relative strength between lines and continuum, we add the scaled DSFG spectrum to the empirically-derived rest-frame m mean DSFG SED from Casey et al. 2014. For the line-free calculation we simply mask H, [O III] and H from the stack prior to performing synthetic photometry, equivalent to computing fluxes for the continuum DSFG SED without adding the lines.
| Line | EW (Å) | FWHM (km s-1) |
|---|---|---|
4 Results and Discussion
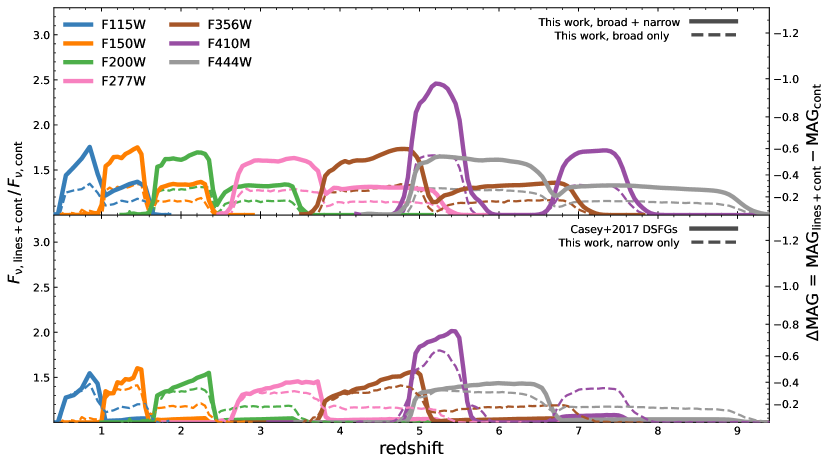
The results of our synthetic photometry are shown in Figure 2, which gives the flux ratio between our fiducial and line-subtracted stacked spectrum and the DSFG stack from Casey et al. (2017). For the former, we also show the increase in flux seperated between the narrow and broad velocity components. On average, strong narrowbroad rest-frame optical lines increase NIRCam fluxes by factors of , with corresponding change in apparent magnitude by . The maximal increase in flux occurs when any particular wide-band filter is centered on the strong [NII]+H complex. The [OIII] and H lines collectively increase the wide-band flux maximally by 20%. Their broad components and those of [NII] and H increase synthetic flux densities by on average, accounting for of the boost for [OIII]+H and for [NII]+H. Medium-band filters are more affected by the presence of strong emission lines and can be dominated by factors of ( mag) by emission lines when redshifted to the line’s rest wavelength. For example, the F410M flux is increased by a factor of at . In fact, is a special regime where a boost in flux density is seen for all NIRCam LW filters. While we do not show the increase in flux attributed to the relatively weaker [OII] line on Fig. 2, this effect is maximally if we mask the line following the methods outlined for [OIII]+H and [NII]+H.
The strong lines in the DSFG stack from Casey et al. 2017 which we have scaled to an H SFR of (see section 3.2.1) increase broadband fluxes by up to a factor of . Such boosting occurs over similar ranges in redshift and to the same degree as found for the narrow line components in the hot DOG stack. This demonstrates that significant line contamination can be present in the NIRCam photometry for IR-luminous galaxies more normal than the relatively extreme hot DOGs.
Given extreme levels of attenuation in massive dust-obscured galaxies at high-redshift, their rest-frame optical spectra contain a combination of significantly reddened continuum with of the total un-obscured light escaping from the least obscured regions (Chapman et al., 2005; Howell et al., 2010). With a combination of strong lines emergent from less obscured regions on top of the very red continuum, m photometry of dusty galaxies can mimic that of ultra-high redshift LBG candidates in large surveys (Zavala et al., 2022; Fujimoto et al., 2022). To quantify the parameter space where this confusion is significant, we fit an LBG template to the synthetic NIRCam flux densities derived from our stacked spectrum. We first normalize the stack to a continuum flux on the order of nJy over m, and assume it to be undetected in F115W and F150W. This represents a plausible scenario given the relative filter depths of JWST Cycle 1 extragalactic deep fields (Bagley et al., 2022; Finkelstein et al., 2022b; Casey et al., 2022), and is similar to CEERS-93316 (Donnan et al., 2022) (CEERS2_2159, Finkelstein et al. 2022b) a LBG candidate selected from CEERS (Finkelstein et al., 2022a; Bagley et al., 2022). CEERS-93316 has a tentative 2.6 SCUBA-2 detection (Zavala et al., 2022) and environmental evidence (Naidu et al., 2022b) both indicating a possible lower redshift solution at .
Figure 3 (Left) shows the 2D posterior distribution in redshift and UV slope for LBG template fits to our stacked spectrum’s synthetic NIRCam flux densities. We repeat the fitting analysis 1000 times after perturbing the input spectrum by the spectral uncertainty, and in three redshift ranges for the stack: , , and . The cumulative EW of H+[NII] is greater than EW([OIII]+H) by a factor of which precludes LBG fits with when the stack is redshifted to . This is because both features fall within a broadband filter and so the strong lines do not mask the red continuum in the stack. At F277W picks up the strong H+[NII] emission while [OIII]+H is missed by F200W. This produces degenerate photometry with LBGs. At , the Lyman break falls halfway between F200W mimicking the red slope of the dusty galaxy stack while the very blue continuum mimics the F277W flux density of the line-contaminated stack. In summary, the hot DOG stack can reproduce very blue UV slopes for but not for . This supports the purity of the very blue NIRCam samples of Cullen et al. 2022 and Topping et al. 2022, which predominantly have and .
As further demonstration of the confusion between our stack at and LBGs, we show in Figure 3 (Right) the LBG fit to our stack’s JWST/NIRCam flux densities. At we find a best-fit LBG solution with and UV spectral index . Lower redshift () solutions with red continuum slopes and flux densities dominated by strong emission lines should be considered when fitting the very blue () spectral energy distributions (SEDs) of candidates. The lower redshift solutions could be ruled out with medium-band filters, longer wavelength sampling using NIRCam’s redder filters, MIRI observations, and/or far-IR/sub-mm follow-up to detect cold dust continuum and fine-structure lines (Fujimoto et al., 2022). Measurements that strongly rule out UV spectral indices and only allow lower solutions at should be particularly constraining against massive, IR-luminous interlopers with strong optical lines provided they sample the SED with more than three filters.
Based on the first analysis of JWST deep field observations at 5 point-source depths between MAG, the projected sky density of candidates at is approximately (Donnan et al., 2022; Finkelstein et al., 2022a; Naidu et al., 2022a; Harikane et al., 2022). Although preliminary, these source counts represent the population which could potentially be contaminated by low dusty interlopers. In contrast, the sky density of luminous IR galaxies with and is () (Casey et al., 2018; Zavala et al., 2021). If we assume the samples of Finnerty et al. (2020) and Casey et al. (2017) include a range of physically possible rest-frame optical properties for IR-bright galaxies (), then their similar number counts to ultra high-redshift LBG candidates may be reason to be concerned about contamination. The fainter dusty galaxy population with are much more numerous based on the general shape of 1 mm number counts (Fujimoto et al., 2016; González-López et al., 2020), and may also be an important source of contamination as galaxies fainter in the IR are less likely to be significantly obscured in the rest-frame optical. Further spectroscopic follow up is required to assess the purity of ultra-high redshift catalogs. In the meantime, F150W dropouts () with and no/poor SED constraint above NIRCam/F356W should be checked against possible intermediate-redshift dusty galaxy solutions.
5 Summary and Conclusion
In this Letter we test the response of JWST NIRCam filters over broad rest-frame optical emission lines in the average spectrum of hot, dust-obscured galaxies at and dusty, star-forming galaxies. As an empirical approach, we stack a sample of IR luminous galaxies with rest-frame optical spectra from Keck II/NIRES which we then compute synthetic photometry for between . Our main results are as follows:
-
1.
We measure broad rest-frame optical emission lines in the stack of hot, dust-obscured galaxies. In particular, we measure [OIII] and H EWs between Å which are high relative to normal star-forming galaxies at high-redshift.
-
2.
After masking out strong emission features from the spectrum, we measure synthetic NIRCam photometry with and without the lines. Narrow and broad components for [OIII] and H increase the measured filter flux by , and H[NII] by on average. Narrowband filters such as F410M can have their flux increased by a factor of ( MAG).
-
3.
Rest-frame optical photometry of dusty galaxies with strong nebular lines at could be important contaminants in F150W dropout ( candidate) catalogs as the strong lines can help mask red UV spectral indices. However, UV spectral indices are difficult for our stacked spectrum to reproduce for interloper redshifts .
Distinguishing between different galaxy populations with JWST imaging is a key first step towards testing various aspects of galaxy formation. While this work has focused just on JWST’s NIRCam filters, the inclusion of deep MIRI photometry extending to longer wavelengths will add significant constraint on various redshift solutions to photometric fitting codes. In the absence of high SNR coverage in redder filters, far-IR/sub-mm followup can help identify dusty galaxies. On the near horizon, ToLTEC on the Large Millimeter Telescope (LMT) Alfonso Serrano will map multiple extragalactic fields (COSMOS, UDS, GOODS-S) down to the LIRG limit at 1.1, 1.4, and 2 mm as part of “The TolTEC Ultra-Deep Galaxy Survey,” a public legacy program. These public data sets are well suited to quickly identify sub-mm bright DSFG counterparts to JWST sources.
References
- Assef et al. (2015) Assef, R. J., Eisenhardt, P. R. M., Stern, D., et al. 2015, ApJ, 804, 27, doi: 10.1088/0004-637X/804/1/27
- Bagley et al. (2022) Bagley, M. B., Finkelstein, S. L., Koekemoer, A. M., et al. 2022, arXiv e-prints, arXiv:2211.02495. https://arxiv.org/abs/2211.02495
- Bakx et al. (2022) Bakx, T. J. L. C., Zavala, J. A., Mitsuhashi, I., et al. 2022, arXiv e-prints, arXiv:2208.13642. https://arxiv.org/abs/2208.13642
- Bouwens et al. (2022) Bouwens, R., Illingworth, G., Oesch, P., et al. 2022, arXiv e-prints, arXiv:2212.06683. https://arxiv.org/abs/2212.06683
- Boylan-Kolchin (2022) Boylan-Kolchin, M. 2022, arXiv e-prints, arXiv:2208.01611. https://arxiv.org/abs/2208.01611
- Bradley et al. (2022) Bradley, L. D., Coe, D., Brammer, G., et al. 2022, arXiv e-prints, arXiv:2210.01777. https://arxiv.org/abs/2210.01777
- Carnall et al. (2022) Carnall, A. C., Begley, R., McLeod, D. J., et al. 2022, MNRAS, doi: 10.1093/mnrasl/slac136
- Casey et al. (2013) Casey, C. M., Chen, C.-C., Cowie, L. L., et al. 2013, MNRAS, 436, 1919, doi: 10.1093/mnras/stt1673
- Casey et al. (2014) Casey, C. M., Scoville, N. Z., Sanders, D. B., et al. 2014, ApJ, 796, 95, doi: 10.1088/0004-637X/796/2/95
- Casey et al. (2017) Casey, C. M., Cooray, A., Killi, M., et al. 2017, ApJ, 840, 101, doi: 10.3847/1538-4357/aa6cb1
- Casey et al. (2018) Casey, C. M., Zavala, J. A., Spilker, J., et al. 2018, ApJ, 862, 77, doi: 10.3847/1538-4357/aac82d
- Casey et al. (2022) Casey, C. M., Kartaltepe, J. S., Drakos, N. E., et al. 2022, arXiv e-prints, arXiv:2211.07865. https://arxiv.org/abs/2211.07865
- Chapman et al. (2005) Chapman, S. C., Blain, A. W., Smail, I., & Ivison, R. J. 2005, ApJ, 622, 772, doi: 10.1086/428082
- Cullen et al. (2022) Cullen, F., McLure, R. J., McLeod, D. J., et al. 2022, arXiv e-prints, arXiv:2208.04914. https://arxiv.org/abs/2208.04914
- Cushing et al. (2004) Cushing, M. C., Vacca, W. D., & Rayner, J. T. 2004, PASP, 116, 362, doi: 10.1086/382907
- Cutri & et al. (2012) Cutri, R. M., & et al. 2012, VizieR Online Data Catalog, II/311
- Donnan et al. (2022) Donnan, C. T., McLeod, D. J., Dunlop, J. S., et al. 2022, arXiv e-prints, arXiv:2207.12356. https://arxiv.org/abs/2207.12356
- Dudzevičiūtė et al. (2020) Dudzevičiūtė, U., Smail, I., Swinbank, A. M., et al. 2020, MNRAS, 494, 3828, doi: 10.1093/mnras/staa769
- Dunlop et al. (2007) Dunlop, J. S., Cirasuolo, M., & McLure, R. J. 2007, MNRAS, 376, 1054, doi: 10.1111/j.1365-2966.2007.11453.x
- Eisenhardt et al. (2012) Eisenhardt, P. R. M., Wu, J., Tsai, C.-W., et al. 2012, ApJ, 755, 173, doi: 10.1088/0004-637X/755/2/173
- Finkelstein et al. (2022a) Finkelstein, S. L., Bagley, M. B., Arrabal Haro, P., et al. 2022a, arXiv e-prints, arXiv:2207.12474. https://arxiv.org/abs/2207.12474
- Finkelstein et al. (2022b) Finkelstein, S. L., Bagley, M. B., Ferguson, H. C., et al. 2022b, arXiv e-prints, arXiv:2211.05792. https://arxiv.org/abs/2211.05792
- Finnerty et al. (2020) Finnerty, L., Larson, K., Soifer, B. T., et al. 2020, ApJ, 905, 16, doi: 10.3847/1538-4357/abc3bf
- Fujimoto et al. (2016) Fujimoto, S., Ouchi, M., Ono, Y., et al. 2016, ApJS, 222, 1, doi: 10.3847/0067-0049/222/1/1
- Fujimoto et al. (2022) Fujimoto, S., Finkelstein, S. L., Burgarella, D., et al. 2022
- González-López et al. (2020) González-López, J., Novak, M., Decarli, R., et al. 2020, ApJ, 897, 91, doi: 10.3847/1538-4357/ab765b
- Gruppioni et al. (2020) Gruppioni, C., Béthermin, M., Loiacono, F., et al. 2020, A&A, 643, A8, doi: 10.1051/0004-6361/202038487
- Harikane et al. (2022) Harikane, Y., Ouchi, M., Oguri, M., et al. 2022, arXiv e-prints, arXiv:2208.01612. https://arxiv.org/abs/2208.01612
- Howell et al. (2010) Howell, J. H., Armus, L., Mazzarella, J. M., et al. 2010, ApJ, 715, 572, doi: 10.1088/0004-637X/715/1/572
- Jun et al. (2020) Jun, H. D., Assef, R. J., Bauer, F. E., et al. 2020, ApJ, 888, 110, doi: 10.3847/1538-4357/ab5e7b
- Kaasinen et al. (2022) Kaasinen, M., van Marrewijk, J., Popping, G., et al. 2022, arXiv e-prints, arXiv:2210.03754. https://arxiv.org/abs/2210.03754
- Kirkpatrick et al. (2015) Kirkpatrick, A., Pope, A., Sajina, A., et al. 2015, ApJ, 814, 9, doi: 10.1088/0004-637X/814/1/9
- Kirkpatrick et al. (2012) Kirkpatrick, A., Pope, A., Alexander, D. M., et al. 2012, ApJ, 759, 139, doi: 10.1088/0004-637X/759/2/139
- Koprowski et al. (2017) Koprowski, M. P., Dunlop, J. S., Michałowski, M. J., et al. 2017, MNRAS, 471, 4155, doi: 10.1093/mnras/stx1843
- Koss et al. (2017) Koss, M., Trakhtenbrot, B., Ricci, C., et al. 2017, ApJ, 850, 74, doi: 10.3847/1538-4357/aa8ec9
- Labbe et al. (2022) Labbe, I., van Dokkum, P., Nelson, E., et al. 2022, arXiv e-prints, arXiv:2207.12446. https://arxiv.org/abs/2207.12446
- Long et al. (2022) Long, A. S., Casey, C. M., Lagos, C. d. P., et al. 2022, arXiv e-prints, arXiv:2211.02072. https://arxiv.org/abs/2211.02072
- Maio & Viel (2022) Maio, U., & Viel, M. 2022
- Manning et al. (2022) Manning, S. M., Casey, C. M., Zavala, J. A., et al. 2022, ApJ, 925, 23, doi: 10.3847/1538-4357/ac366a
- Michałowski et al. (2017) Michałowski, M. J., Dunlop, J. S., Koprowski, M. P., et al. 2017, MNRAS, 469, 492, doi: 10.1093/mnras/stx861
- Murphy et al. (2011) Murphy, E. J., Chary, R. R., Dickinson, M., et al. 2011, ApJ, 732, 126, doi: 10.1088/0004-637X/732/2/126
- Naidu et al. (2022a) Naidu, R. P., Oesch, P. A., van Dokkum, P., et al. 2022a, arXiv e-prints, arXiv:2207.09434. https://arxiv.org/abs/2207.09434
- Naidu et al. (2022b) Naidu, R. P., Oesch, P. A., Setton, D. J., et al. 2022b, arXiv e-prints, arXiv:2208.02794. https://arxiv.org/abs/2208.02794
- Roberts-Borsani et al. (2022) Roberts-Borsani, G., Treu, T., Chen, W., et al. 2022, arXiv e-prints, arXiv:2210.15639. https://arxiv.org/abs/2210.15639
- Rowan-Robinson et al. (2018) Rowan-Robinson, M., Wang, L., Farrah, D., et al. 2018, A&A, 619, A169, doi: 10.1051/0004-6361/201832671
- Schaerer & de Barros (2009) Schaerer, D., & de Barros, S. 2009, A&A, 502, 423, doi: 10.1051/0004-6361/200911781
- Stark et al. (2013) Stark, D. P., Schenker, M. A., Ellis, R., et al. 2013, ApJ, 763, 129, doi: 10.1088/0004-637X/763/2/129
- Topping et al. (2022) Topping, M. W., Stark, D. P., Endsley, R., et al. 2022, arXiv e-prints, arXiv:2208.01610. https://arxiv.org/abs/2208.01610
- Tsai et al. (2015) Tsai, C.-W., Eisenhardt, P. R. M., Wu, J., et al. 2015, ApJ, 805, 90, doi: 10.1088/0004-637X/805/2/90
- Wilkins et al. (2013) Wilkins, S. M., Coulton, W., Caruana, J., et al. 2013, MNRAS, 435, 2885, doi: 10.1093/mnras/stt1471
- Wilkins et al. (2020) Wilkins, S. M., Lovell, C. C., Fairhurst, C., et al. 2020, MNRAS, 493, 6079, doi: 10.1093/mnras/staa649
- Wilkins et al. (2022) Wilkins, S. M., Vijayan, A. P., Lovell, C. C., et al. 2022, MNRAS, 517, 3227, doi: 10.1093/mnras/stac2548
- Wilson et al. (2004) Wilson, J. C., Henderson, C. P., Herter, T. L., et al. 2004, in Society of Photo-Optical Instrumentation Engineers (SPIE) Conference Series, Vol. 5492, Ground-based Instrumentation for Astronomy, ed. A. F. M. Moorwood & M. Iye, 1295–1305
- Wu et al. (2012) Wu, J., Tsai, C.-W., Sayers, J., et al. 2012, ApJ, 756, 96, doi: 10.1088/0004-637X/756/1/96
- Wu et al. (2018) Wu, J., Jun, H. D., Assef, R. J., et al. 2018, ApJ, 852, 96, doi: 10.3847/1538-4357/aa9ff3
- Yoon et al. (2022) Yoon, I., Carilli, C. L., Fujimoto, S., et al. 2022, arXiv e-prints, arXiv:2210.08413. https://arxiv.org/abs/2210.08413
- Yu-Yang Hsiao et al. (2022) Yu-Yang Hsiao, T., Coe, D., Abdurrouf, et al. 2022, arXiv e-prints, arXiv:2210.14123. https://arxiv.org/abs/2210.14123
- Zackrisson et al. (2008) Zackrisson, E., Bergvall, N., & Leitet, E. 2008, ApJ, 676, L9, doi: 10.1086/587030
- Zavala et al. (2021) Zavala, J. A., Casey, C. M., Manning, S. M., et al. 2021, ApJ, 909, 165, doi: 10.3847/1538-4357/abdb27
- Zavala et al. (2022) Zavala, J. A., Buat, V., Casey, C. M., et al. 2022, arXiv e-prints, arXiv:2208.01816. https://arxiv.org/abs/2208.01816