Don’t throw that video away!
Reference Frames can fix Video Analysis with a Moving Camera
Abstract
One common source of error in video analysis is camera movement. The paper describes a simple frame of reference correction that students can employ to salvage otherwise corrupted video analysis data. Two examples are provided.
I Introduction
Video analysis is a convenient and fun way to collect kinematic position-time information for a motion that may not be otherwise accessible in the introductory lab. The general procedure is to track the successive motion of an object via it’s x and y pixel position over multiple frames of a video.
One curriculum that uses video analysis as a learning support to construct and test ideas is Eugenia Etkina’s ISLE approach to learning physics [1]. For example, in the 2-D Projectile motion unit, one video [2], involves Dr. Etkina tossing a ball vertically while rolling across the room on rollerblades. If you are reading the paper on a computer, you might watch the video now http://islevideos.net/experiment.php?topicid=2&exptid=95.
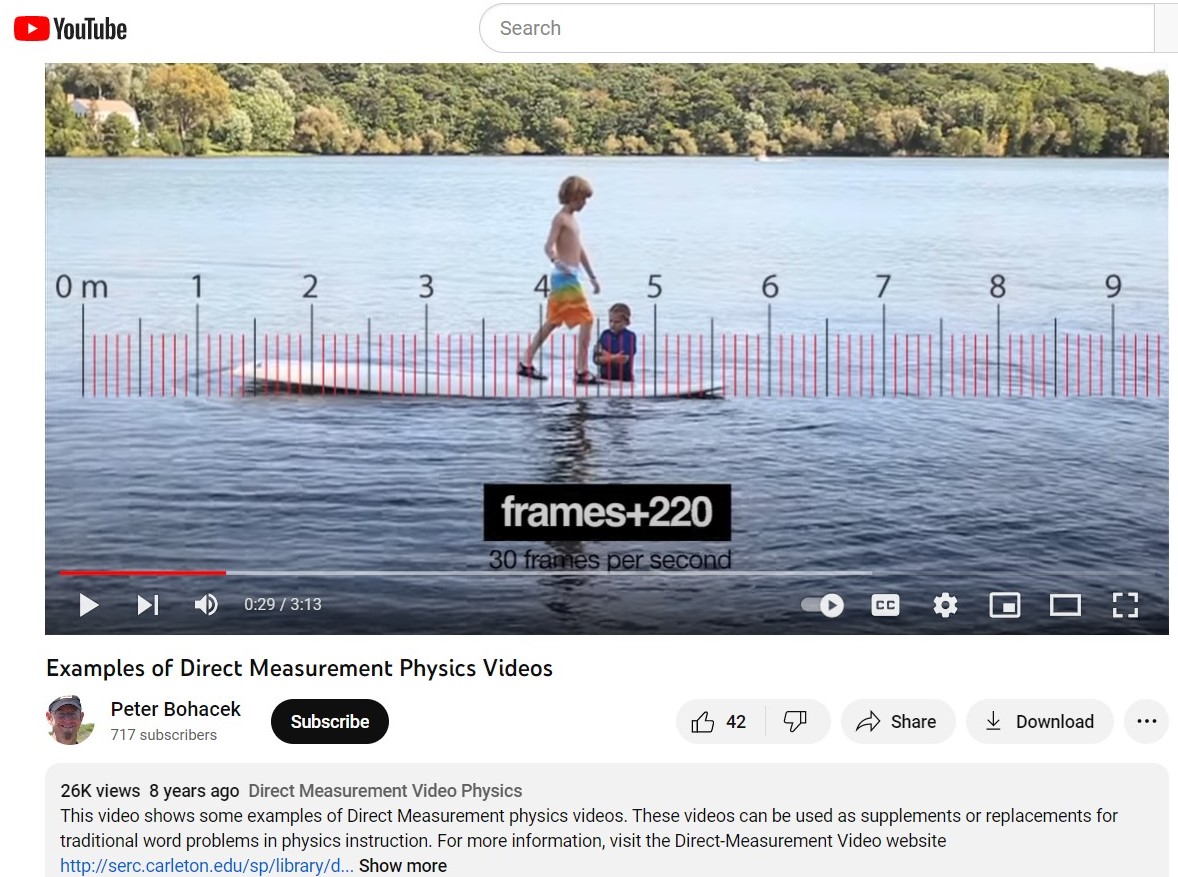
Another set of teaching videos is Peter Bohacek’s Direct Measurement Physics Videos, [4] . These videos usually show physics in a “real” setting (outside the classroom) and are again powerful and engaging tools.
In both of these examples, students are presented with videos that can be analyzed frame by frame at constant time intervals, typically . Horizontal and vertical positions are available by either marks on a chalkboard (Etkina) or a computer drawn overlay (Bohacek).
There are also a number of video analysis software programs that allow students to analyze any old video they find or record with their cellphones. “Tracker”, [5], is a free tool that works on a variety of platforms. Vernier’s Logger Pro, [6], often used for data acquisition, also contains video analysis software.
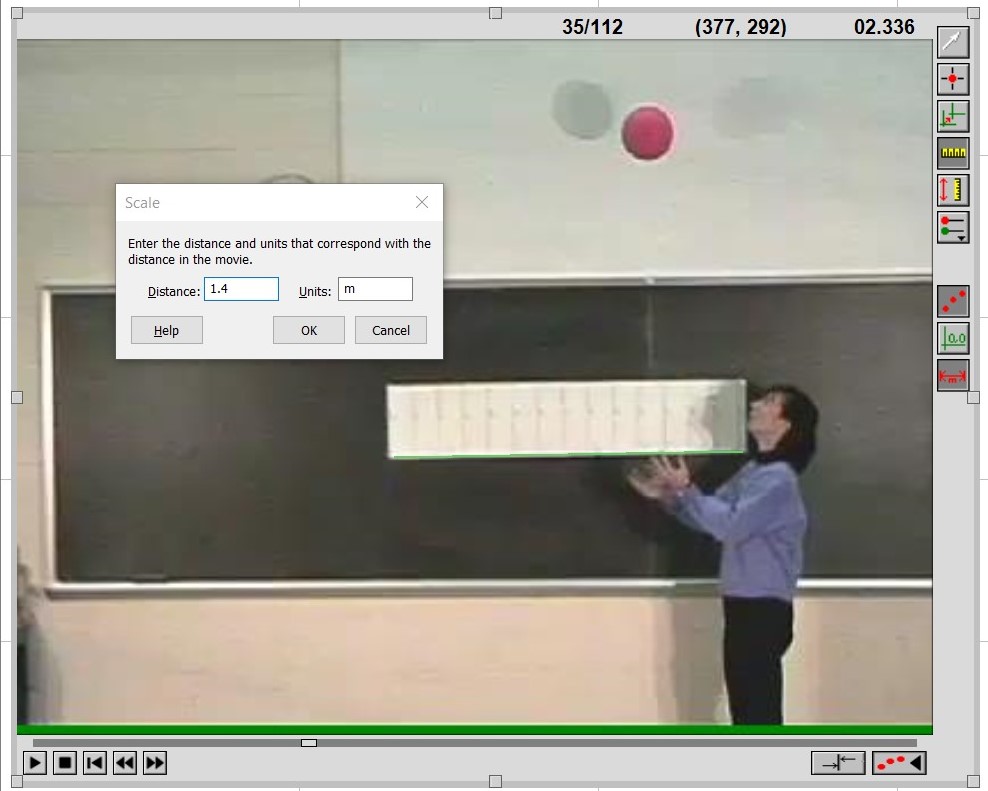
In both of these packages, students repeatedly click on an object of interest and the software then collects time and 2D position data in spreadsheet form. However, the data collected is in units of an x,y pixel pair. Conversion from pixel to physical dimension is a student task, and the quality of student results can depend on the “calibration stick”[7] they employ.
II Fixing moving camera motion
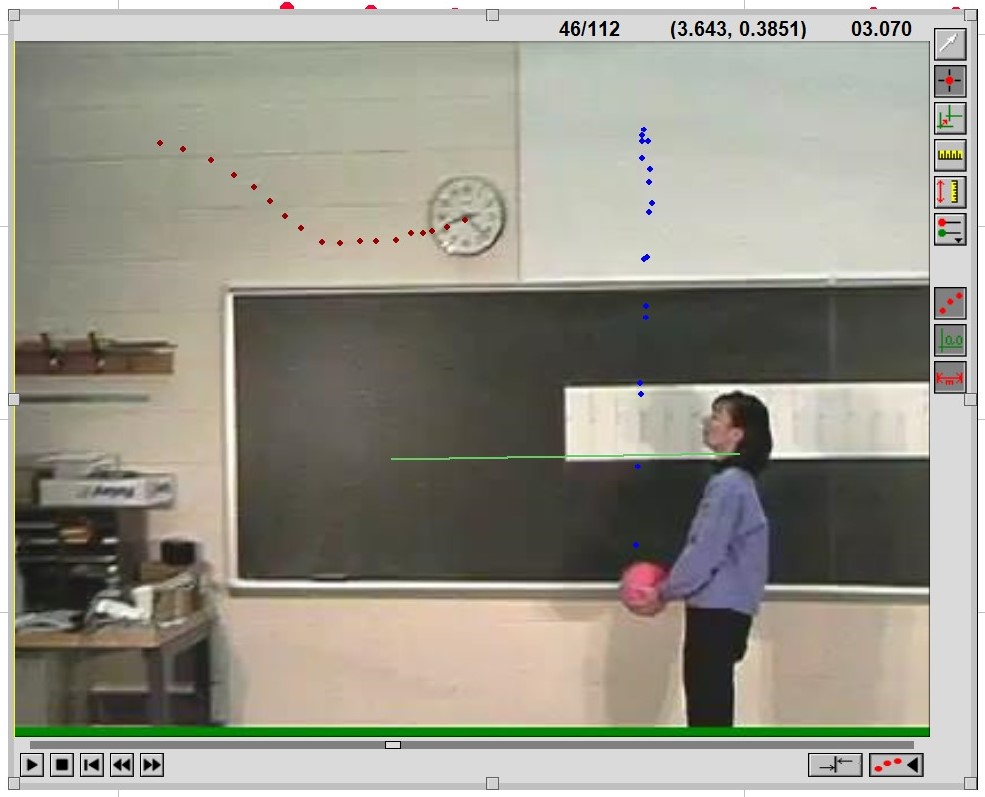
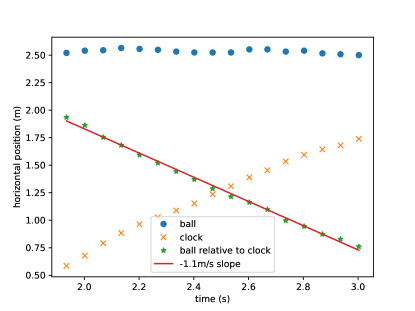
Figures 1 and 3 show the analysis process for the video in which Dr. Etkina throws a ball vertically while rollerblading across the classroom. The video of this event was taken by a camera that followed Etkina, so via direct tracking of the ball, the horizontal component is lost.
However, if a student also tracks the motion of a seemingly immobile object, for example the center seam of the chalkboard, the center of the clock, a corner of the calibration sheets, etc, the student can recover the horizontal motion of the ball via vector subtraction. Specifically, if you write the ball’s position relative to the classroom wall as, , you can then express this position as a difference.
This subtraction can be accomplished in LoggerPro as a “calculated column” or the data can be exported to a spreadsheet and the operation performed there.
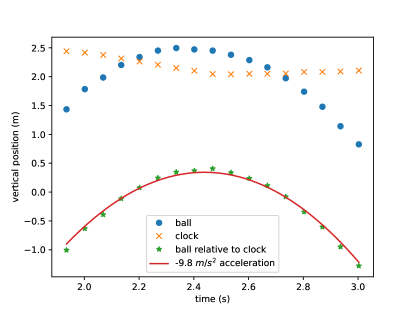
Results from this change of reference frame are shown in figures 4 and 5 . In the introductory curriculum, frames of reference sometimes seems dry or contrived, but in video analysis projects with a moving camera, thinking about the movement of a seemingly immobile reference frame can be a magic bullet.
III Example: a bear falls out of a tree
To further illustrate how useful this approach can be, consider this 2003 video of a bear being removed from a tree in Missoula Montana via a tranquilizer gun and a trampoline. https://www.youtube.com/watch?v=9KiJnTGoPPI [8]. There are quite a few different application topics available in the video, and some of my students are outraged that the bear was so made fun of by the Missoula fire, wildlife, and police departments.
So, an ethical question: “Assuming the bear had to be removed from the tree, was bouncing it off a trampoline a humane thing to do?” With encouragement, the students can develop this question into a quantifiable measure, eg, “What would the bear’s speed be if there was no trampoline in place?” There are many graphs online that show the fatality risk for pedestrians who are struck by cars at different speeds, for example [9], and it seems realistic to extrapolate this to a decrease in harm to the bear if its final velocity is reduced.
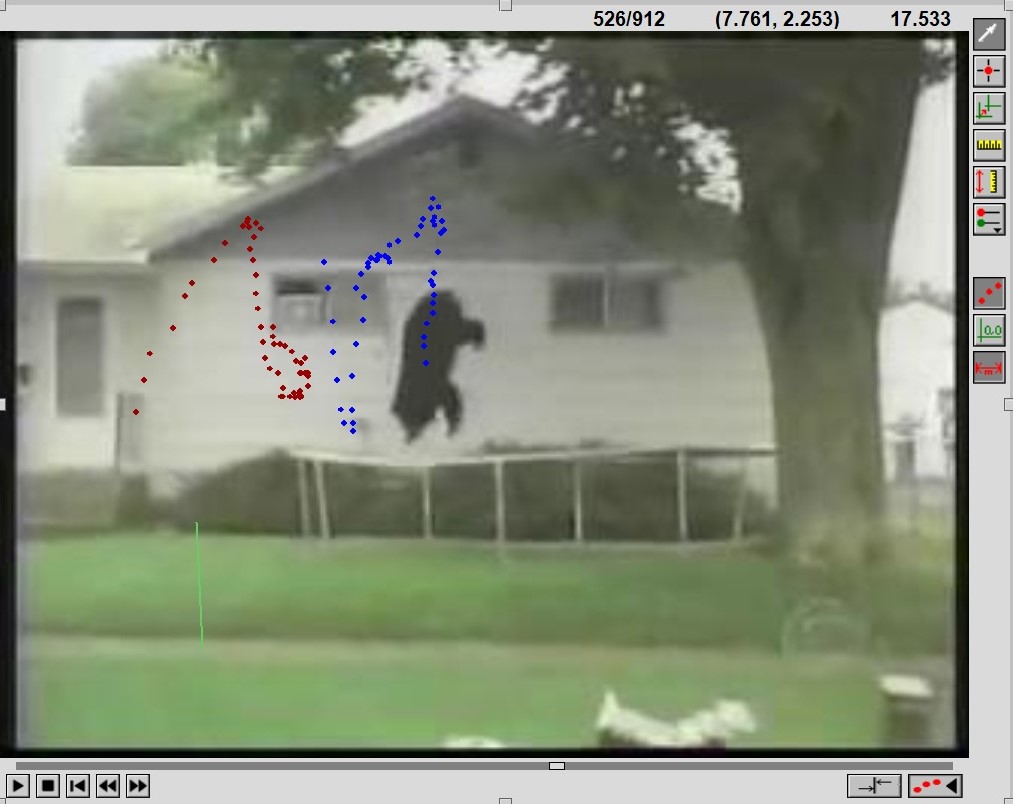
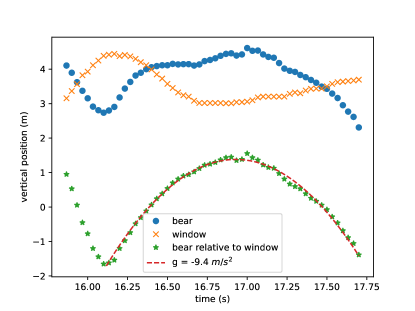
The bear video was shot by a professional videographer, Mark Hoyoak, and the focus of the camera follows the bear. Ignoring the early parts of the bear’s fall when the zoom level changes, the video provides a falling body, tracked by a moving camera. If you consider one of the house’s transom windows to be a static reference, camera movement can be removed.
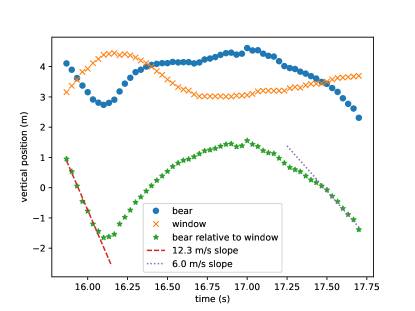
This analysis is shown in figures 6, 7, and 8. The analysis assumes a trampoline leg height of meter, which, based on the extracted gravitational acceleration values, is probably inaccurate.
Straight-line fits to the bear’s vertical position give speeds of as the bear hits the trampoline, and at about the same altitute after bouncing off the trampoline. Based on the data in Figure 1b of [9] this corresponds to a reduction of pedestrian fatality risk from to less than . Extrapolating from vehicle fatality data, one could arge that in addition to being good comedy, using a trampoline in this case is humane wildlife management.
IV Conclusion
Cellphone video is everywhere in a way that was unimaginable 20 years ago. Most of the videos that students might take for a kinematics assignment won’t be shot from a tripod with a constant depth of field. Accordingly, talking about how to use topics from Physics to correct “errors” in video data collection can be empowering for students. If there’s a fixed reference, a student no longer needs to be told, “That video is bad, go take it again…”.
Acknowledgements.
The work would not have been possible without Mark Hoyoak’s excellent videography. Thanks also to Eugenia Etkina for introducing me to video analysis many years ago. Thanks also to Peter Bohacek for his inspiring talks and amazing Direct Motion Video examples.References
- [1] The ISLE approach to learning physics is described in E. Etkina, Millikan award lecture: Students of physics—Listeners, observers, or collaborative participants in physics scientific practices? Am. J. Phys. 83(8), 669 (2015). and D. T. Brookes and E. Etkina Physical Phenomena in real time, Science 330, 605 (2010). Here is a pointer to the video archive I’m using http://islevideos.net/ .
- [2] The ball toss video used in the first part of the paper is available for download at http://islevideos.net/experiment.php?topicid=2&exptid=95 .
- [3] See the excellent introduction at https://www.youtube.com/watch?v=QsGMKv8Lrew .
- [4] Peter Bohacek’s YouTube channel contains a large number of these videos https://www.youtube.com/user/bohacekphysics. A nice overview of the approach he takes is given in https://www.youtube.com/watch?v=QsGMKv8Lrew. These videos are available as a commercial curriculum at https://www.pivotinteractives.com/ .
- [5] Tracker is a free, open-source tool that you can install on your computer or run in a web browser. It is available online at https://physlets.org/tracker/ .
- [6] Vernier’s LoggerPro is typically used for lab data acquisition but it contains an excellent video analysis tool that this paper employs. https://www.vernier.com/product/logger-pro-3/
- [7] Here is the help page for calibration sticks in Tracker https://physlets.org/tracker/help/frameset.html. The process in LoggerPro is similar.
- [8] There are many copies of this video on the web. It seems that the original video was taken by Mark Hoyoak of KPAX News in Montana on September 9, 2003. The clip was subsequently featured on national news and comedy programs. For an overview, see https://www.youtube.com/watch?v=jB47Vucoj2o .
- [9] E. Rosén and U. Sander, Pedestrian fatality risk as a function of car impact speed, Accident Analysis and Prevention 41(3) 536 (2009).