Evaluating Glyph Design for Showing Large-Magnitude-Range Quantum Spins
Abstract
We present experimental results to explore a form of bivariate glyphs for representing large-magnitude-range vectors. The glyphs meet two conditions: (1) two visual dimensions are separable; and (2) one of the two visual dimensions uses a categorical representation (e.g., a categorical colormap). We evaluate how much these two conditions determine the bivariate glyphs’ effectiveness. The first experiment asks participants to perform three local tasks requiring reading no more than two glyphs. The second experiment scales up the search space in global tasks when participants must look at the entire scene of hundreds of vector glyphs to get an answer. Our results support that the first condition is necessary for local tasks when a few items are compared. But it is not enough for understanding a large amount of data. The second condition is necessary for perceiving global structures of examining very complex datasets. Participants’ comments reveal that the categorical features in the bivariate glyphs trigger emergent optimal viewers’ behaviors. This work contributes to perceptually accurate glyph representations for revealing patterns from large scientific results. We release source code, quantum physics data, training documents, participants’ answers, and statistical analyses for reproducible science at .
Index Terms:
Separable and integral dimension pairs, bivariate glyph, 3D glyph, quantitative visualization, large-magnitude-range.1 Introduction
Bivarate glyph visualization is a common form of visual design in which a dataset is depicted by two visual variables, often chosen from a set of perceptually independent graphical dimensions of shape, color, texture, size, orientation, curvature, and so on [1, 2]. A bivariate glyph design [3] has been broadly applied to reveal atom spin behaviors for quantum physicists at National Institute of Standards and Technology (NIST) to examine experimental results; thanks to their team’s Nobel-prize-winning simulations [4]. Quantum physicists world-wide can now manipulate many individual quantum systems to study complex atom and sub-atom interactions. Because atoms can be in multiple states simultaneously and because these spin magnitudes are large in range and often vary greatly in local regions, computational solutions still do not exist to characterize the spin behaviors. Today’s quantum physicists rely on visualization to interpret simulation results.
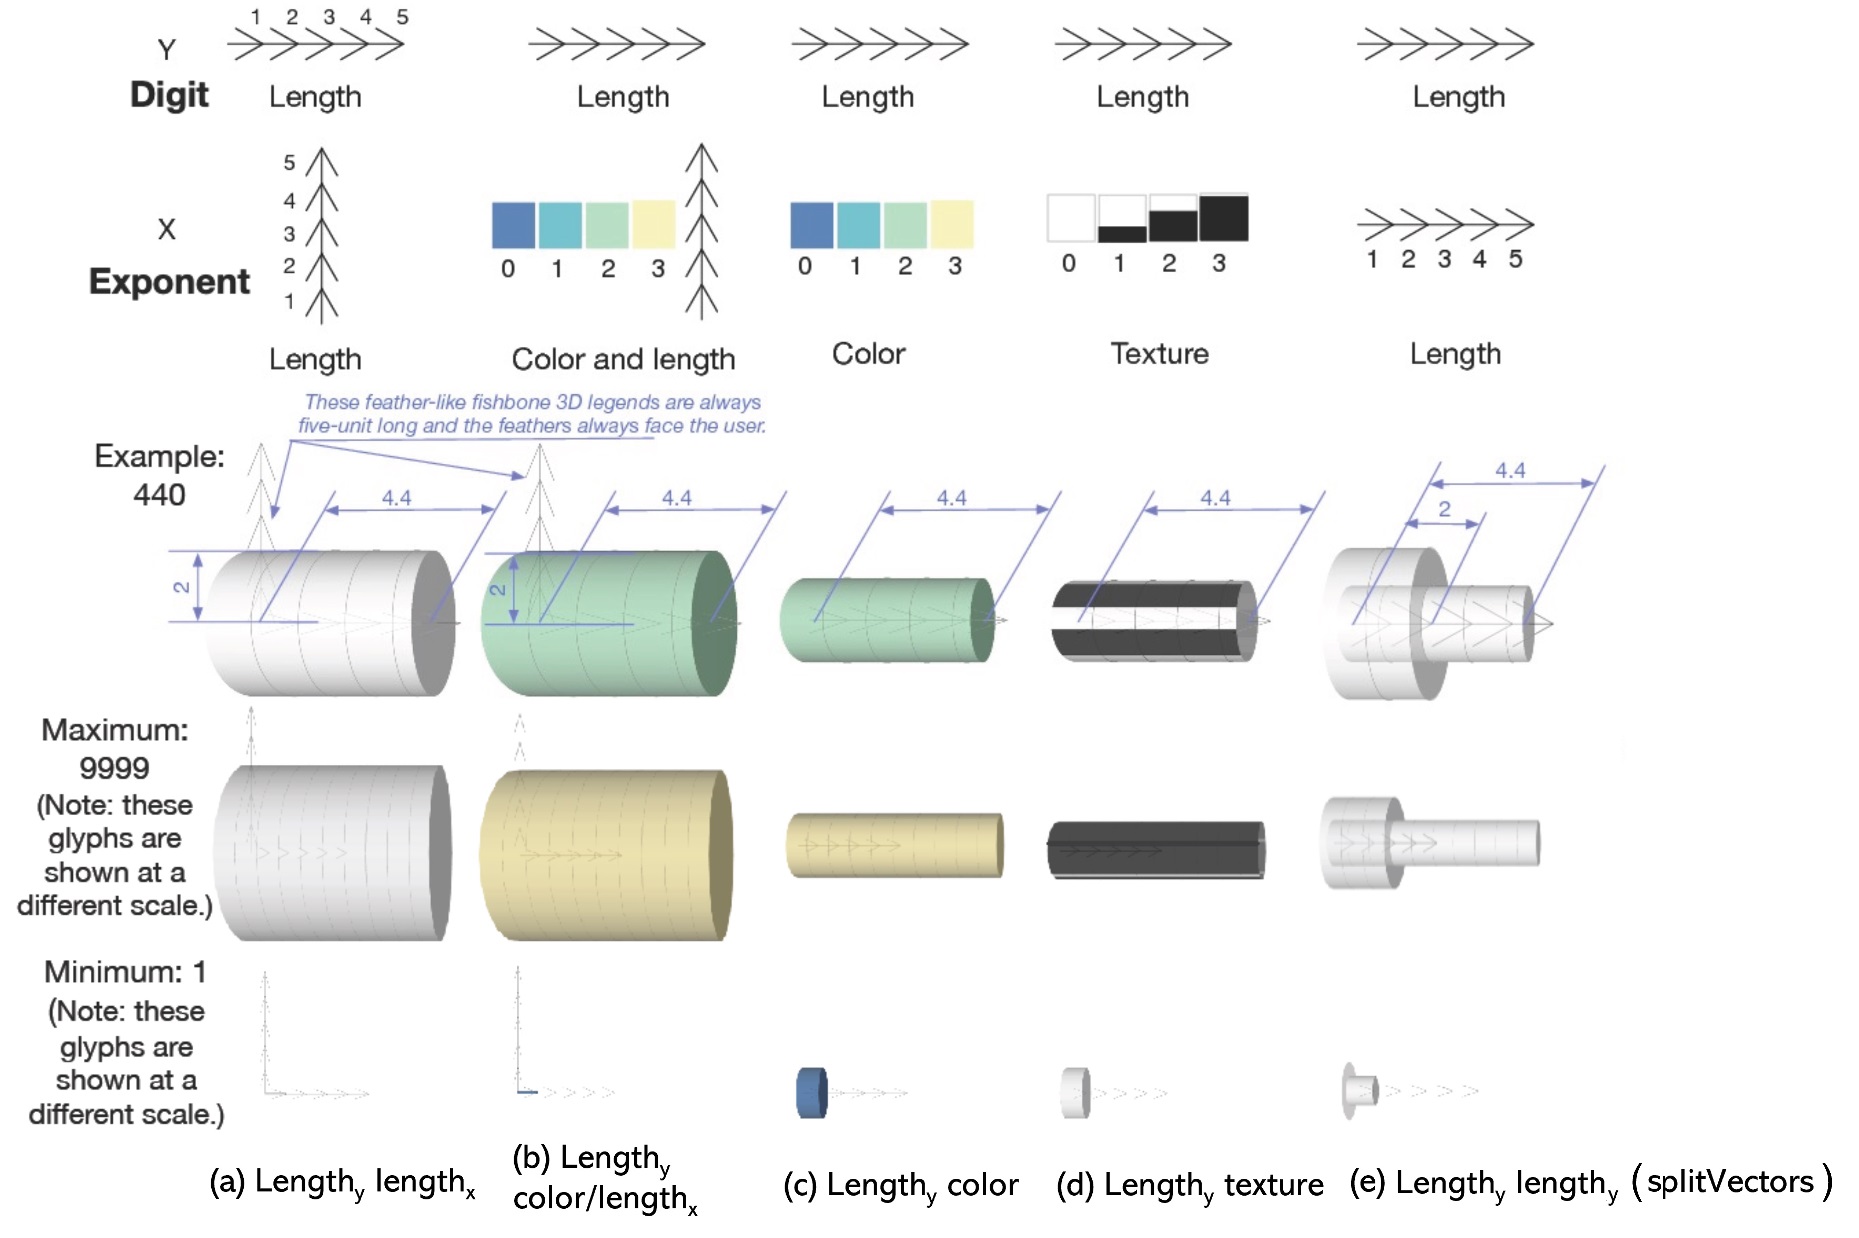
On the visualization side, the initial design and evaluation of large-magnitude-range spin vector visualizations use scientific notation to depict digit and exponent as two concentric cylinders [3]: inside and outside tube-lengths ( or or splitVectors) are mapped to digit and power of spin magnitude accordingly (Figure 1e). A three-dimensional (3D) bivariate glyph scene of this splitVectors design (Figure 2e) achieves up to ten times greater accuracy than the traditional direct approach (Linear, Figure 2f) for reading a vector magnitude of a single spin or deriving ratios between two spin magnitudes. However, this design also increases task completion time for an apparently simple comparison task between two magnitudes in three dimensions (3D): the traditional direct approach of Linear (Figure 2f) is significantly faster than splitVectors (Figure 2e).
One may frame this large-magnitude-range issue as a visual design problem: how can we depict a scalar value using bivariate visual features to help quantum physicists examine complex spatial data? Intuitively, since all tasks in previous study involve a single or at most two spin locations, human visual system would integrate the two component parts (digit and exponent terms) of a quantum spin into one gestalt before comparing the results [5]. Since relating the digit and exponent to the two size features demands a focused attention mode of visual processing, a viewer would take longer to process two component parts in splitVectors compared to a single linear mapping. We term this explanation the object-level hypothesis where a viewer responds to combine two component parts of a value represented in a glyph to its original scalar value (here the magnitude).
However, the object-level processing may be neither efficient nor necessary. For example, Borgo et al. [6] state that “… effective glyph design should encompass a non-conflicting set of separable retinal variables”. Now, for our examples, if we increase the bivariate feature separability by replacing the exponent-to-length mapping in Figures 1e and 2e to the exponent-to-color mapping in Figures 1c and 2c for comparison tasks, it would be counterproductive for our attention first to visit each glyph to compute the magnitude. Instead, the global categorical color (hue) can guide our attention to first compare the exponent, prior to compare vector lengths (digit). In these cases, no object-level attentive processing of bivariate features is needed as long as the two color hues can be easily recognizable.
Further considering the quantum physicists’ task relevant to multiple objects (e.g., find maximum among hundreds of vectors) (Figure 2), viewers are likely to check the color legend and then use color to first divide the scene into subregions, prior to use length for detailed comparisons within the yellow region (Figures 2b and 2c). The colorful scene context benefits the reduction of search to a much smaller scale via global statistics of the scene. Coincidentally, this first impression of the data to drive structural and statistical information is also called scene-level processing [7]; Wolfe called features guiding this top-down task-driven attention behaviors as scene features. Scene features are also preattentive and can guide attention in visual search toward a target [8], perhaps due to fast ensemble processing [9].
Taken together, an effective design of bivariate glyphs is likely to be influenced by two conditions: separable dimensions, with one of them being a pre-attentive scene feature. These two factors are not necessarily independent. For example, For the first factor, we can follow Borgo et al. [6] and Ware [10] for “a non-conflicting set of separable retinal variables”. To meet the both conditions to choose the scene feature, we can give preferences of the separable pair when one of the variables is categorical. This is because categorical features are likely to be better at facilitating the perception of a group of objects in the scene [11, 12, 7]. We in this work compared several separable-integral pairs, length-color (Figures 1b, 2b, 1c, 2c), length-texture (Figures 1d, 2d), and length-length (Figures 1a, 2a). Among the three features of color, texture, and size, color is categorical and thus “most recognizable”. Color ensembles are preattentive and permit visual selection at a glance [13]. We purposefully select texture patterns by varying the amount of dark on white, thus introducing luminance variations when many vectors are examined together (Figure 2d). Compared to the continuous random noise in Urness et al. [14], ours is for discrete quantities and thus uses regular scale variations. When coupled with separable features, we hypothesize that highly distinguishable separable dimension pairs, with one being categorical might encourage preattentive global processing to reduce task completion time and be more accurate.
We tested this hypothesis in two experiments with six tasks using four pairs to compare against the (separable) in Zhao et al. [3]: (integral), (separable), (separable), and (redundant and separable). Since we predicted that separable dimensions with more preattentive features would reduce the task completion time, and might achieve more efficiency without hampering accuracy than other bivariate pairs.
This work makes the following contributions:
-
•
Empirically validates that bivariate-glyphs encoded by highly separable dimensions would improve comparison task completion time (Exp I).
-
•
Is the first to evaluate categorical features in bivirate-glyphs to leverage the benefits of the global scene features (Exp II).
-
•
Offers a rank order of separable variables for 3D glyph design and shows that the separable pairs and are among the most effective and efficient feature pairs.
-
•
Reveals a novel visual design method for scalable search in big-data.
2 Theoretical Foundations in Perception and Vision Sciences
At least four perceptual and vision science theories have inspired our work: integral and separable dimensions [15], preattentive scene features [7, 8, 16, 17], feature ranking, and monotonicity [2].
Integral and Separable Dimensions. Garner and Felfoldy’s seminal work on integral and separable dimensions [15] has inspired many visualization design guidelines. Ware [10] suggests a continuum from more integral to more separable pairs: (red-green)-(yellow-blue), -, color-shape/size/orientation, motion-shape/size/orientation, motion-color, and group position-color. His subsequent award-winning bivariate study [2] using hue-size, hue-luminance, and hue-texton (texture) supports the idea that more separable dimensions of hue-texton lead to higher accuracy. Our work follows the same ideas of quantifying integral and separable dimensions but differs from Ware’s texton selection in two important aspects. First, the Ware study focuses on finding relationships between two independent data variables. In contrast, ours demands participants to examine a complex scene for item discrimination when the two variables are component parts of a vector magnitude. Second, our texture uses the amount of black and white to show luminance variations, in contrast to the discrete shape variation in textons. We anticipate that ours will be more suitable to continuous quantitative values so it is easier to compare large and small to divide the regions [18]. No existing work we know of has studied whether or not one of the separable features being categorical can facilitate global comparisons and can be scaled to large and more complex 3D vector magnitude analysis.
Scene-Guidance and Feature Distance. In order to recognize items, viewers do not “see” features and instead “bind” these features to objects. This binding studies how our visual systems separate object features such as shape, color, motion trajectories, sizes, and distances into the whole object [5]. What we “see” also depends on our goals and expectations. Wolfe et al. propose the theory of “guided search” [8], a first attempt to incorporate users’ goals into viewing. For example, if the viewer’s goal is to search largest values, s/he can just check the yellow ones in Figure 2. Wolfe et al. [8] further suggest that color, texture, size, and spatial frequency are among the most effective features in attracting the user’s attention.
When we combine features together, Duncan and Humphreys articulate some of the most basic principles. In general, guidance to a target will be stronger when the feature differences between the target (T) and distractor (D) are larger (TD differences), and when the feature differences amongst distractors are smaller (DD similarity) [19]. For example, Ts are 2.3 (digit) and 2 (exponent) for 230 (). Ds include all numbers but 2.3 and 2. Using the TD differences between features may explain why splitVectors was time consuming. For example, to compare 230 () to 2,300 (), viewers have to differentiate the two lengths of 2 (T) and 3 (T) from other distractors (Ds other than 2 or 3). The heterogeneity of Ds or small DD distances from 3D lengths may make the use of splitVectors challenging, thus introducing temporal cost.
Preattentive and Attentive Feature Ranking. Human visual processing can be faster when it is preattentive. Wolfe called a feature preattentive when it guides attention in search and cannot be decomposed into simpler features [7]. The idea of preattentive pop-out has historically highlighted that a single object has been considered compelling because it captures the user’s attention against a background of other objects (e.g., in showing spatial highlights [20]). Visual features such as orientation and color (hue, saturation, lightness) can generate pop-out effects [21]. This type of pop-out was also used visualizations. For example, Ropinski, Oeltze, and Preim [22] summarized two groups of glyph design: “parameter mapping” from shape and appearance (color, transparency, and texture) and “placement” driven by features or data. Our study concerns appearance.
Recent vision science development also suggests that the preattentive feature is not limited to single items but expanded to high-level structures. Global statistical and structural features can be also preattentive [7]. Unlike the now outdated Treisman’s 1988 preattentive processing [23], where preattentive features were considered to be perceived before it is given focused attention [23], these preattentive features are persistent during viewers’ data exploration thus can continue to provide guidance [7, 8]. Viewers can use peripheral vision to compare in parallel to confidently tell apart regions relevant or irrelevant to tasks [24].
Visual features also can be responsible for different attention speeds, and color (hue) and size (length and spatial frequency) are among those that guide attention [18, 9]. Healey and Enns [25] in their comprehensive review further remark that these visual features are not popped-out at the same speed: hue has higher priority than shape and texture [26]. Also, when data size increased, some preattentive features diminished [27] [28].
For visualizing quantitative data, MacKinlay [29] and Cleveland and McGill [30] leverage the ranking of visual features and suggest that position and size are quantitative and can be compared in 2D. For example, MacKinlay’s A Presentation Tool (APT) [29] automatically recommends visualizations using effectiveness and expressive criteria and outputs a ranked set of encoding to enumerate candidate visualizations based on data types. Casner [31] expands MacKinlay’s APT by incorporating user tasks to guide visualization generation. McColeman et al. [32] revise the ranking of visual features based on the number of items. All these studies almost exclusively consider only single item mappings. Demiralp et al. [33] evaluate a crowdsourcing method to study subjective perceptual distances of 2D bivariate pairs of shape-color, shape-size, and size-color. When adopted in 3D glyph design, the authors further suggest that the most important data attributes should be displayed with the most salient visual features, to avoid situations in which secondary data values mask the information the viewer wants to see. Ours also emphasizes the use of global scene features to optimize viewing experiences.
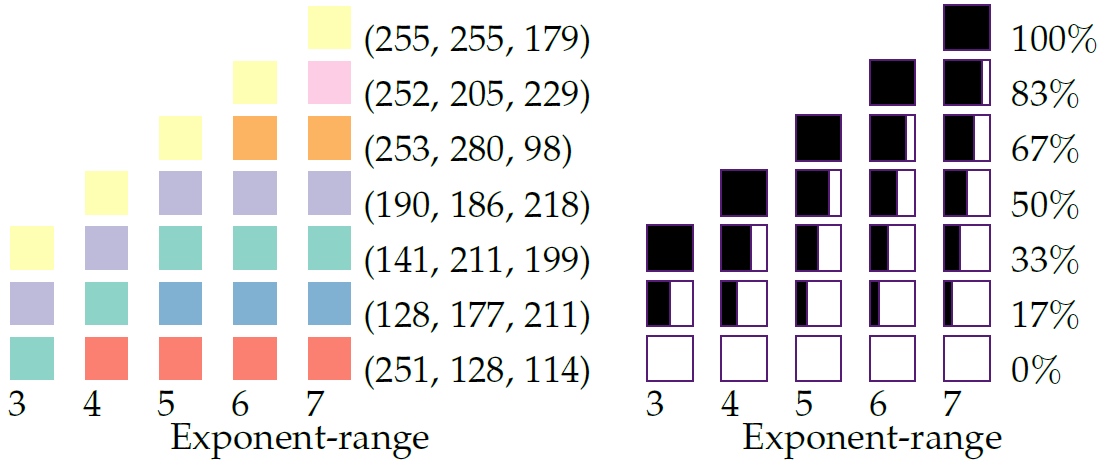
Monotonicity. Quantitative data encoding must normally be monotonic, and various researchers have recommended a coloring sequence that increases monotonically in luminance [34]. In addition, the visual system mostly uses luminance variation to determine shape information [35]. There has been much debate about the proper design of a color sequence for displaying quantitative data, mostly in 2D [36] and in 3D shape volume variations [37]. Our primary requirement is to use categorical colormaps that users be able to read large or small exponents at a glance. We used four color steps in the first study and up to seven steps in the second study from ColorBrewer [36] for showing areas of large and small exponents that are mapped to a hue-varying sequence. We claim not that these color sequences are optimal, only that they are reasonable solutions to the design problem.
3 Experiment I: Effect of Separable Pairs on Local Discrimination and Comparison
The goal in this first experiment is to quantify the benefits of separable pairs with preattentive features for visual processing of a few items. This section discusses the experiment, the design knowledge we can gain from it, and the factors that influence our design.
3.1 Methods
3.1.1 Bivariate Feature-Pairs
We chose five bivariate feature-pairs to examine the comparison task efficiency of separable-integral pairs.
(integral) (Figure 1a). Lengths encoded digits and exponents shown as the height and radius of cylinder glyphs.
(redundant and separable) (Figure 1b). This pair compared to added a redundant color (luminance and hue variations) dimension to the exponent and the four sequential colors were chosen from Colorbrewer [36] (Appendix A shows the sequences.)
(separable) (Figure 1c). This pair mapped exponents to color. Pilot testing showed that the least incorrect exponent levels were selected among these five feature-pairs.
(separable) (Figure 1d). Texture represented exponents. The percentage of black color (Bertin [38]) was used to represent the exponential terms (), (), () and (), wrapped around the cylinders in five segments to make them visible from any viewpoint.
(splitVectors [3], separable) (Figure 1e). This glyph used splitVectors [3] as the baseline and mapped both digit and exponent to lengths. The glyphs were semitransparent so that the inner cylinders showing the digit terms were legible.
Feather-like fishbone legends were added at each location when the visual variable length was used. The tick-mark band was depicted as subtle light-gray lines around each cylinder. Distances between neighboring lines show a unit length legible at certain distance (Figure 1, rows and ).
3.1.2 Hypotheses
Given the analysis below and recommendations in the literature, we arrived at the following working hypotheses:
-
•
Exp I. H1. (Overall). The feature-pair can lead to the most accurate answers.
-
•
Exp I. H2. (Integral-separable). Among the three separable dimensions, may lead to the greatest speed and accuracy and will be more effective than (splitVectors).
-
•
Exp I. H3. (Redundancy on time). The redundant pair will reduce task completion time compared to splitVectors.
Several reasons led to H1 and H2. They are related to the two conditions of glyph design we evaluate. Color and length were separable dimensions, so comparing length to color is simple (condition 1). And color was preattentive and could be detected quickly (condition 2). Compared to the redundant , reduced crowding since the feature-pairs were generally smaller than those in . Also, distinguishing two lengths in splitVectors might be less efficient than . H3 could be supported because redundancy increased information processing capacity [10]. Redundancy contributes to efficiency by increasing the feature distances between exponents. We did not expect accuracy gain from redundancy because splitVectors achieved the same level of accuracy as reading texts in Zhao et al. [3]. It may not be useful to decode quantitative data in this experiment at least for showing a few items.
3.1.3 Tasks
Participants performed the following three task types as in Zhao et al. [3] so that results were comparable. They had unlimited time to perform these three tasks.
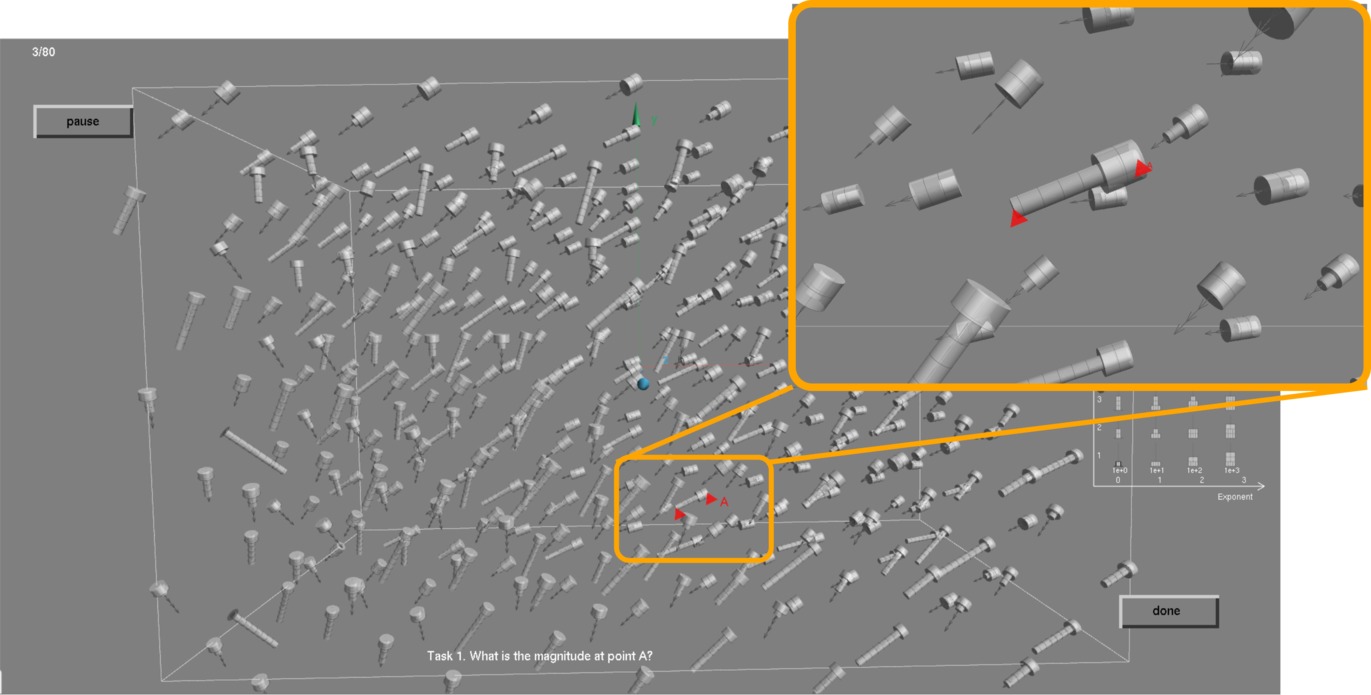
Exp I. Task 1 (MAG): magnitude reading (Figure 3(a)). What is the magnitude at point A? One vector was marked by a red triangle labeled “A”, and participants should report the magnitude of that vector. This task required precise numerical input.
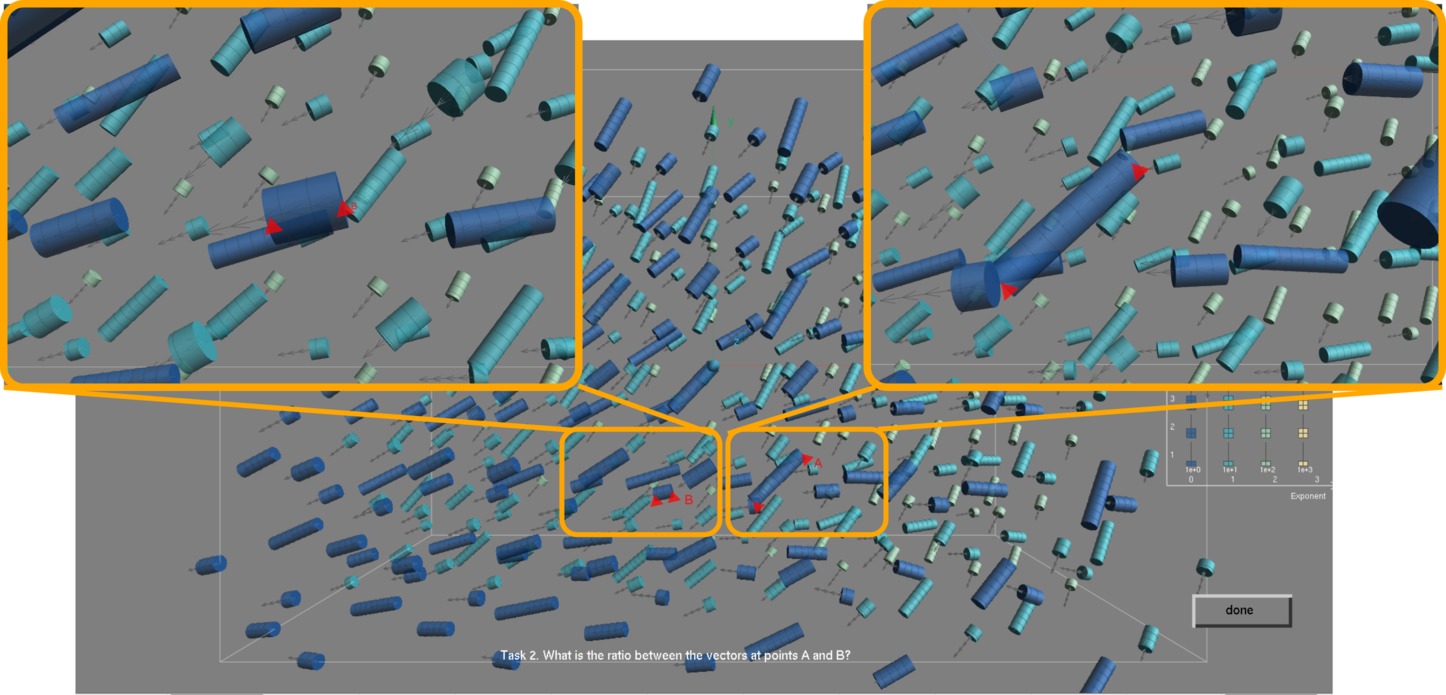
Exp I. Task 2 (RATIO): ratio estimation (Figure 3(b)). What is the ratio of magnitudes of points A and B? Two vectors are marked with two red triangles labeled “A” and “B”, and participants should estimate the ratio of magnitudes of these two vectors. The ratio judgment is the most challenging quantitative task [29]. Participants could either compare the glyph shapes or decipher each vector magnitude and compute the ratio mentally.
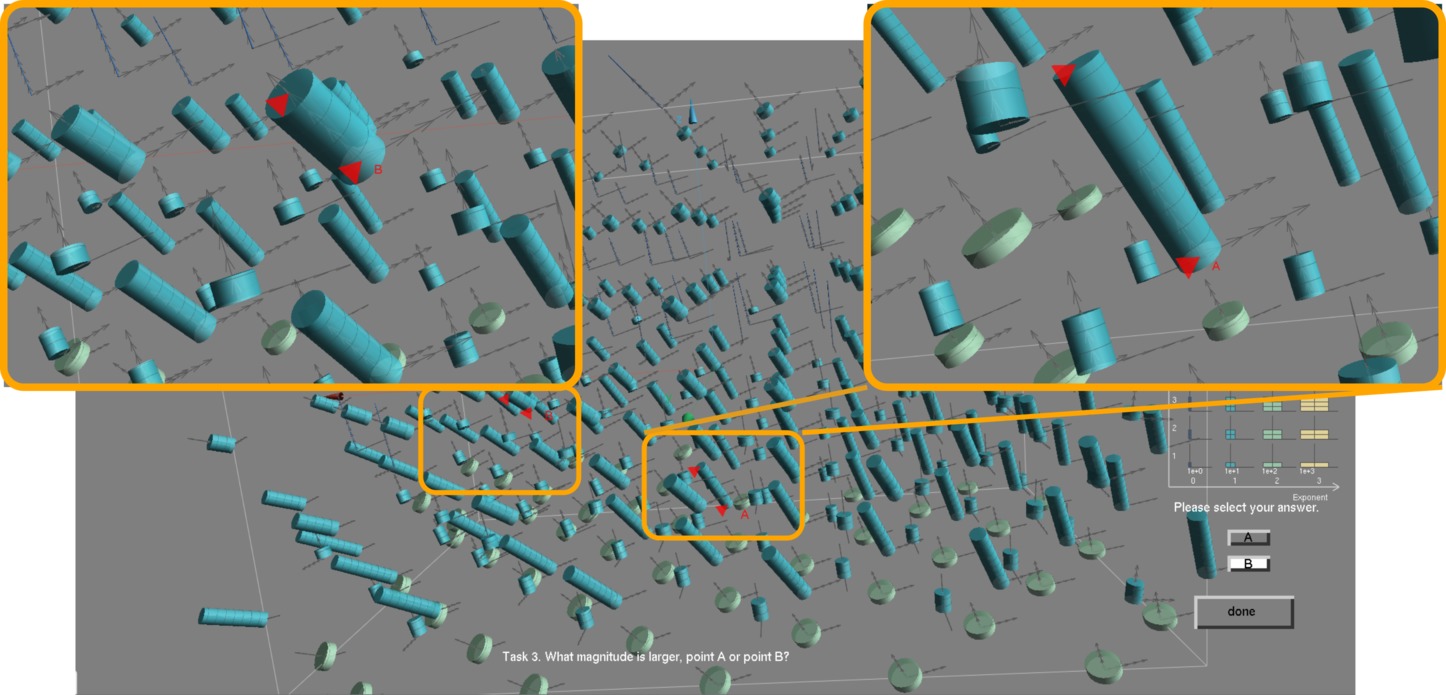
Exp I. Task 3 (COMP): comparison (Figure 3(c)). Which magnitude is larger, point A or B? Two vectors are marked with red triangles and labeled “A” and “B”. Participants select their answer by directly clicking the “A” or “B” answer buttons. This task was a simple comparison between two values and offered a binary choice of large or small.
3.1.4 Data Selection
Because we were also interested in comparing our results to those in Zhao et al. [3], we replicated their data selection method by randomly sampling some quantum physics simulation results and produce samples within 3D boxes of size . There were to sampling locations in each selected data region.
We selected the data satisfying the same following conditions: (1) the answers must be at locations where some context information was available, i.e., not too close to the boundary of the testing data; (2) no data sample was repeated to the same participant; (3) since data must include a broad measurement, we selected the task-relevant data from each exponential term of to .
3.1.5 Empirical Study Design
Design and Order of Trials. We used a within-subject design with one independent variable of bivariate quantitative feature-pair (five types). Dependent variables were error and task completion time. We also collected participants’ confidence levels. Table I showed that participants were assigned into five blocks in a Latin-square order, and within one block the order of the five feature-pair types is the same. Participants performed tasks with randomly selected datasets. Each participant performed trials ( tasks random data feature-pairs). These four random data were from four exponent ranges.
Participants. We diversified the participant pool as much as possible, since all tasks could be carried out by those with only some science background. Twenty participants ( male and female, mean age , and standard deviation ) participated in the study, with ten in computer science, three in engineering, two in chemistry, one in physics, one in linguistics, one in business administration, one double-major in computer science and math, and one double-major in biology and psychology. The five females were placed in each of the five blocks (Table I). On average, participants spent about minutes on the tasks.
| Block | Participant | Feature-pair |
|---|---|---|
| 1 | P1, P6, P11, P16 | splitVectors, , , , |
| 2 | P2, P7, P12, P17 | , , , , splitVectors |
| 3 | P3, P8, P13, P18 | , , , splitVectors, |
| 4 | P4, P9, P14, P19 | , , splitVectors, , |
| 5 | P5, P10, P15, P20 | , splitVectors, , , |
Procedure. Participants were greeted and completed an Institutional Review Board (IRB) consent form (which described the procedure, risks and benefits of the study) and the demographic survey. All participants had normal or corrected-to-normal vision and passed the Ishihara color-blindness test. We showed feature-pair examples and trained the participants with one trial for every feature-pair per task. They were told to be as accurate and as quickly as possible, and that accuracy was more important than time. They could ask questions during the training but were told they could not do so during the formal study. Participants practiced until they fully understood the feature-pairs and tasks. After the formal study, participants filled in a post-questionnaire asking how these feature pairs supported their tasks and were interviewed for their comments. Pilot studies were conducted to examine the procedures.
Environment. Participants sat at a BenQ GTG XL Z, gamma-corrected display with resolution to ensure the colors were displayed properly. The distance between the participants and the display was about cm. The minimum visual angle of task-associated glyphs was in the default view where all data points were visible and the scene filled the screen.
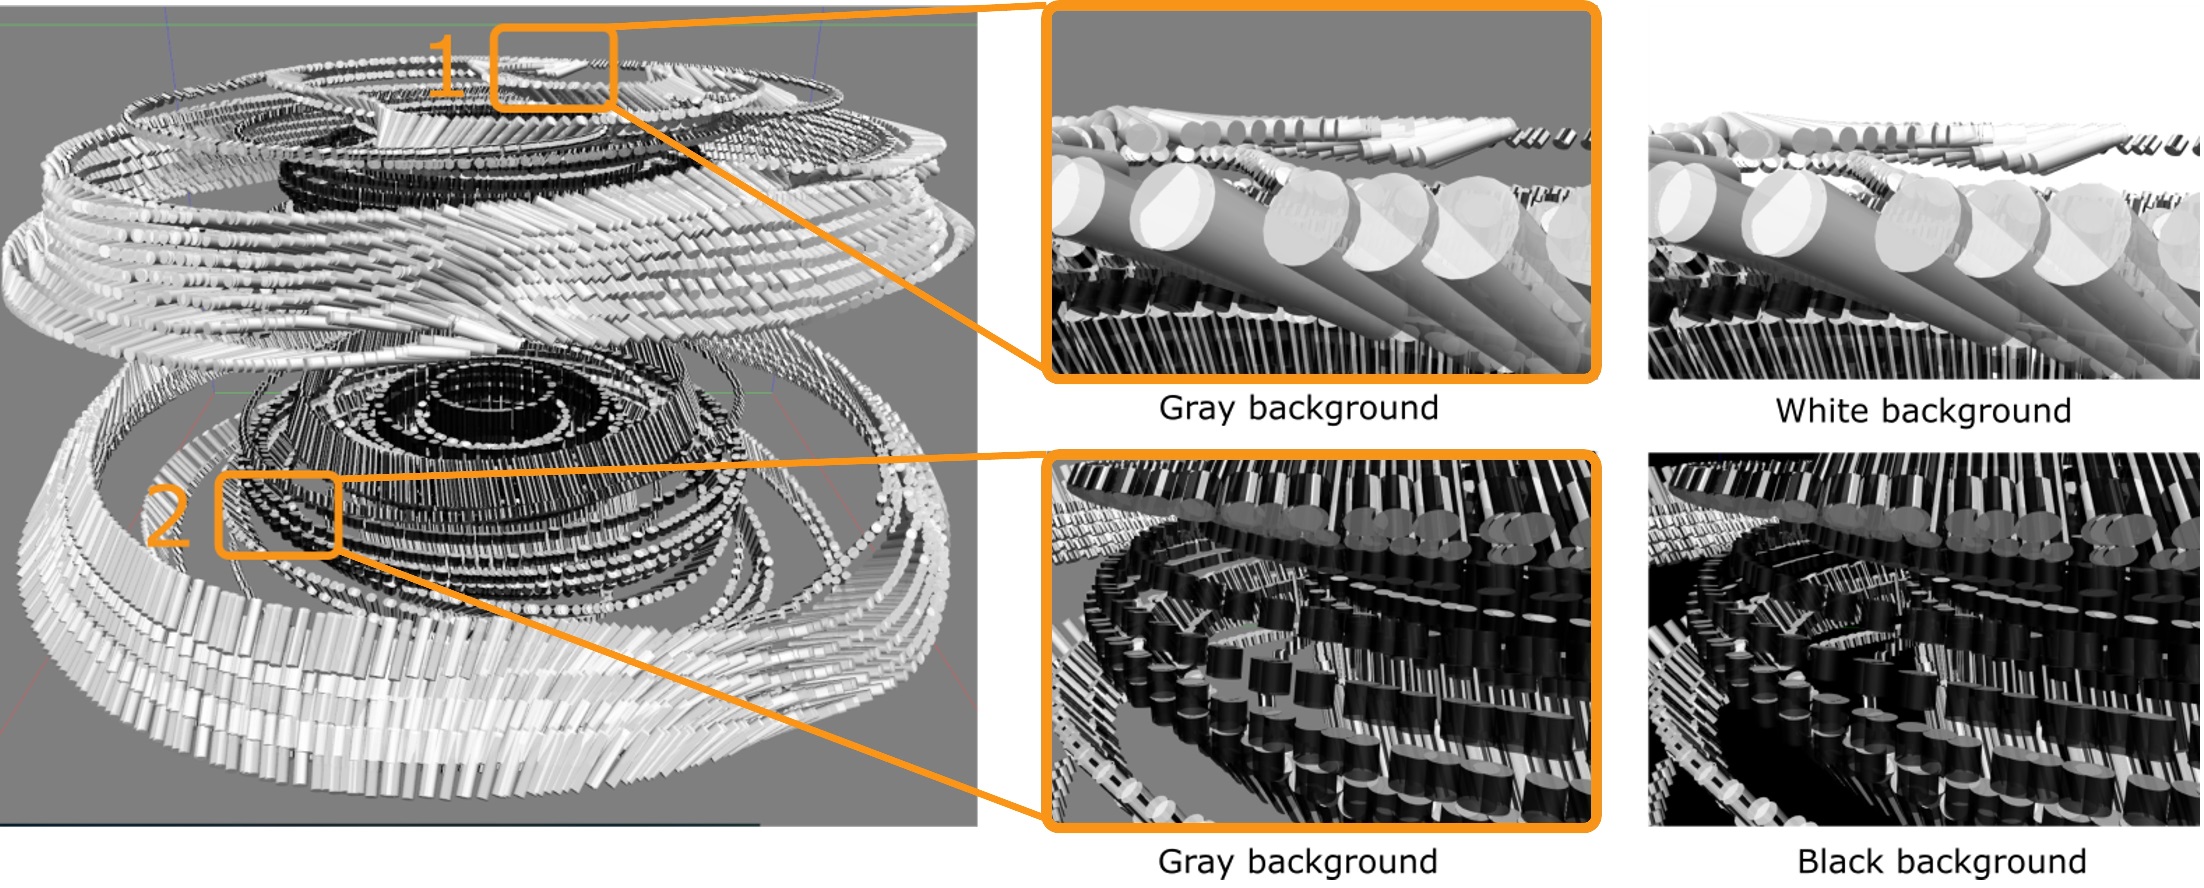
Interaction. Participants could rotate the data and zoom in and out. Lighting placement and intensity were chosen to produce visualization with contrast and lighting properties appropriate for human assumptions and the spatial data. The screen background color was neutral stimulus-free gray background to minimize the discriminability and appearance of colors [10]. Using black or white background colors makes the black and white texture stimuli disappear thus bias the results (See Appendix B for examples).
3.2 Experiment I: Results and Discussion
3.2.1 Analysis Approaches
We collected data points for each task. In preparing the accuracy and task completion time for analysis, we differentiated two error metrics related to the perceptual accuracy of the bivariate pairs:
-
•
Correspondence error (C-Error): A trial is considered to have an answer of C-Error if response’s exponent value does not match the correct one. Having a C-Error would mean that participants have trouble differentiating the exponent levels within a glyph.
-
•
Relative error (R-Error): This R-Error follows Zhao et al. [3] to study how sensitive a method is to error uncertainty based on fractional uncertainty, calculated as R-Error = correct answer - participant answer / (correct answer). This measure was used for MAG and RATIO tasks. The benefit of this metric was that it took into account the value of the quantity being compared and thus provided an accurate view of the overall errors.
In subsequent analysis, we separated these two error measurements since Combining these two errors in the analysis would also be problematic. The C-Errors are at least one order of magnitude larger or smaller than the ground truth. We also did not remove participants’ data with C-Errors, since the source of errors was caused by glyph design methods independent of trials.
A post-hoc analysis using Tukey’s Studentized Range test (HSD) was performed when we observed a significant main effect on R-Errors. When the dependent variable was binary (i.e., answer correct or wrong), we used a logistic regression and reported the p value from the Wald test. When the value was less than 0.05, variable levels with confidence interval of odds ratios not overlapping were considered significantly different. All error bars represent confidence intervals. We also evaluated effect sizes using eta-square, labeled “small” , “medium” , and “large” effects following Cohen [39].
| Task | Variables | Significance | ES |
| MAG | time | F(4, 384) = 6.8, p 0.0001 | 0.07 |
| (, , , splitVectors) | |||
| relative error | F(4, 384) = 0.9, p = 0.46 | 0.01 | |
| RATIO | time | F(4, 395) = 6.2, p 0.0001 | 0.06 |
| Three groups: A: , splitVectors, | |||
| B: splitVectors, , | |||
| C: , , | |||
| relative error | F(4, 395) = 0.8, p = 0.50 | 0.01 | |
| COMP | time | F(4, 395) = 10.4, p 0.0001 | 0.09 |
| Three groups: A: , , | |||
| B: , splitVectors | |||
| C: splitVectors, | |||
| accuracy | = 0.4, p = 0.98 | 0.03 |
3.2.2 Overview of Study Results
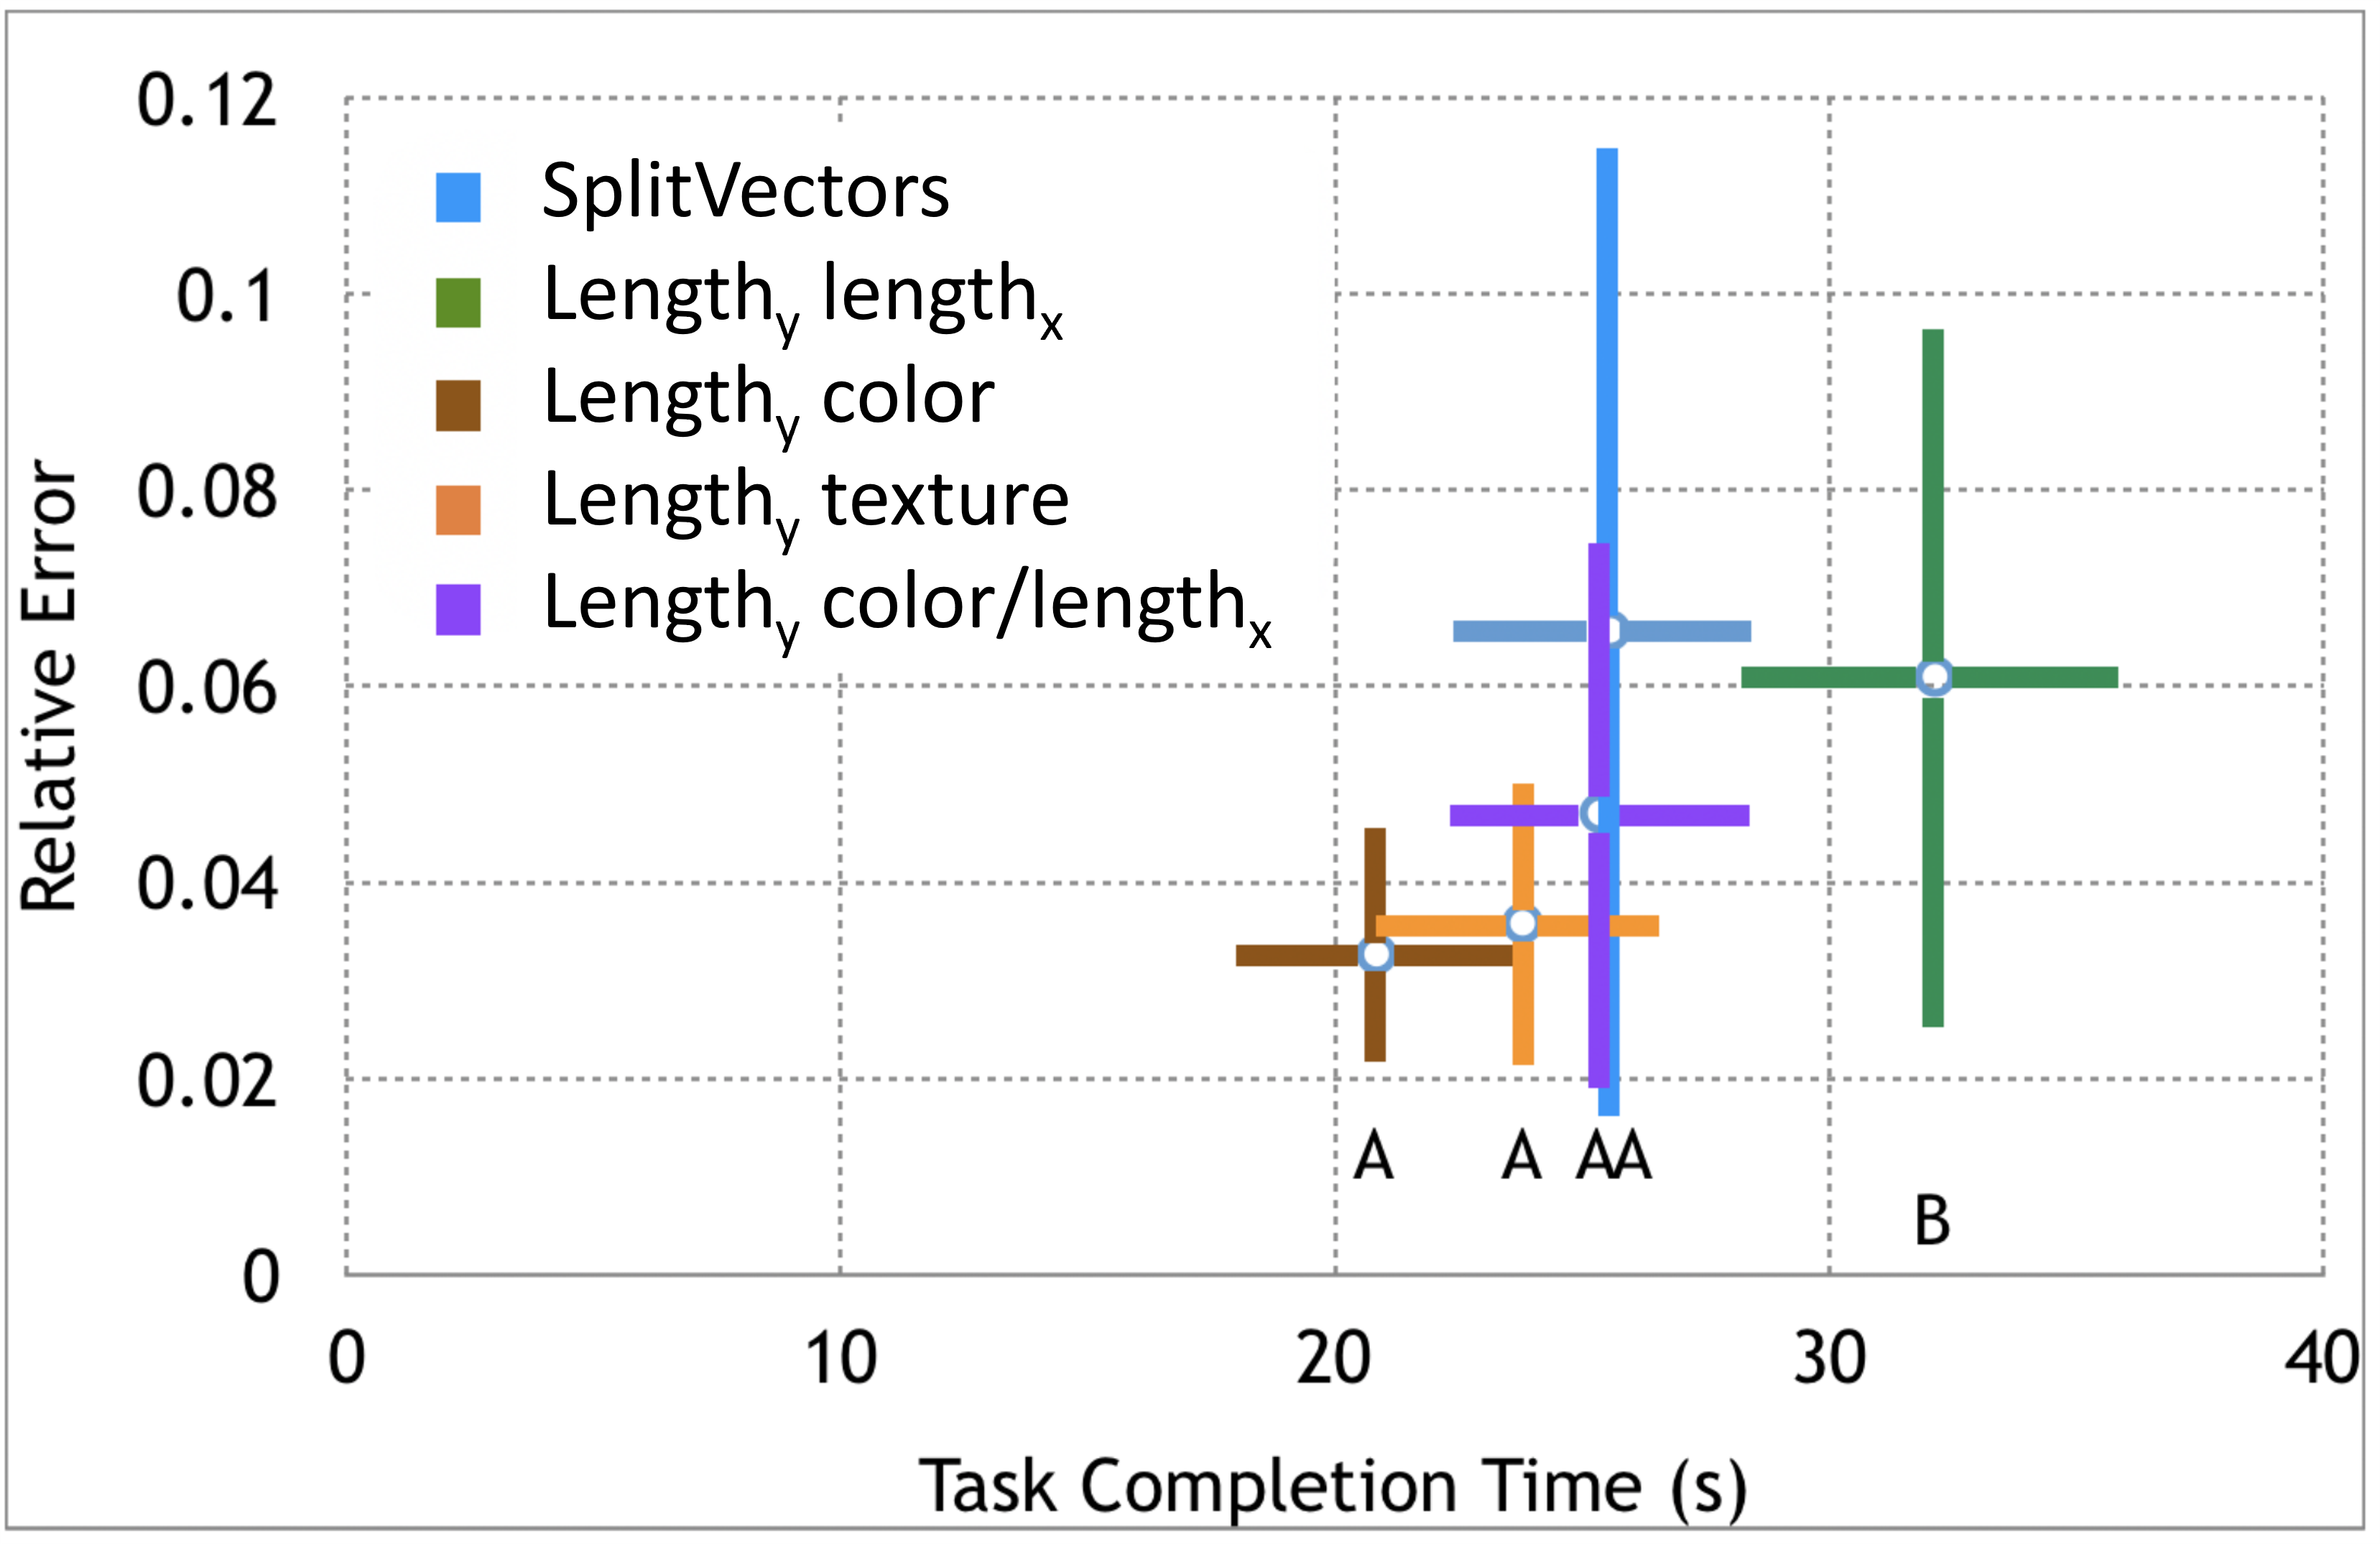
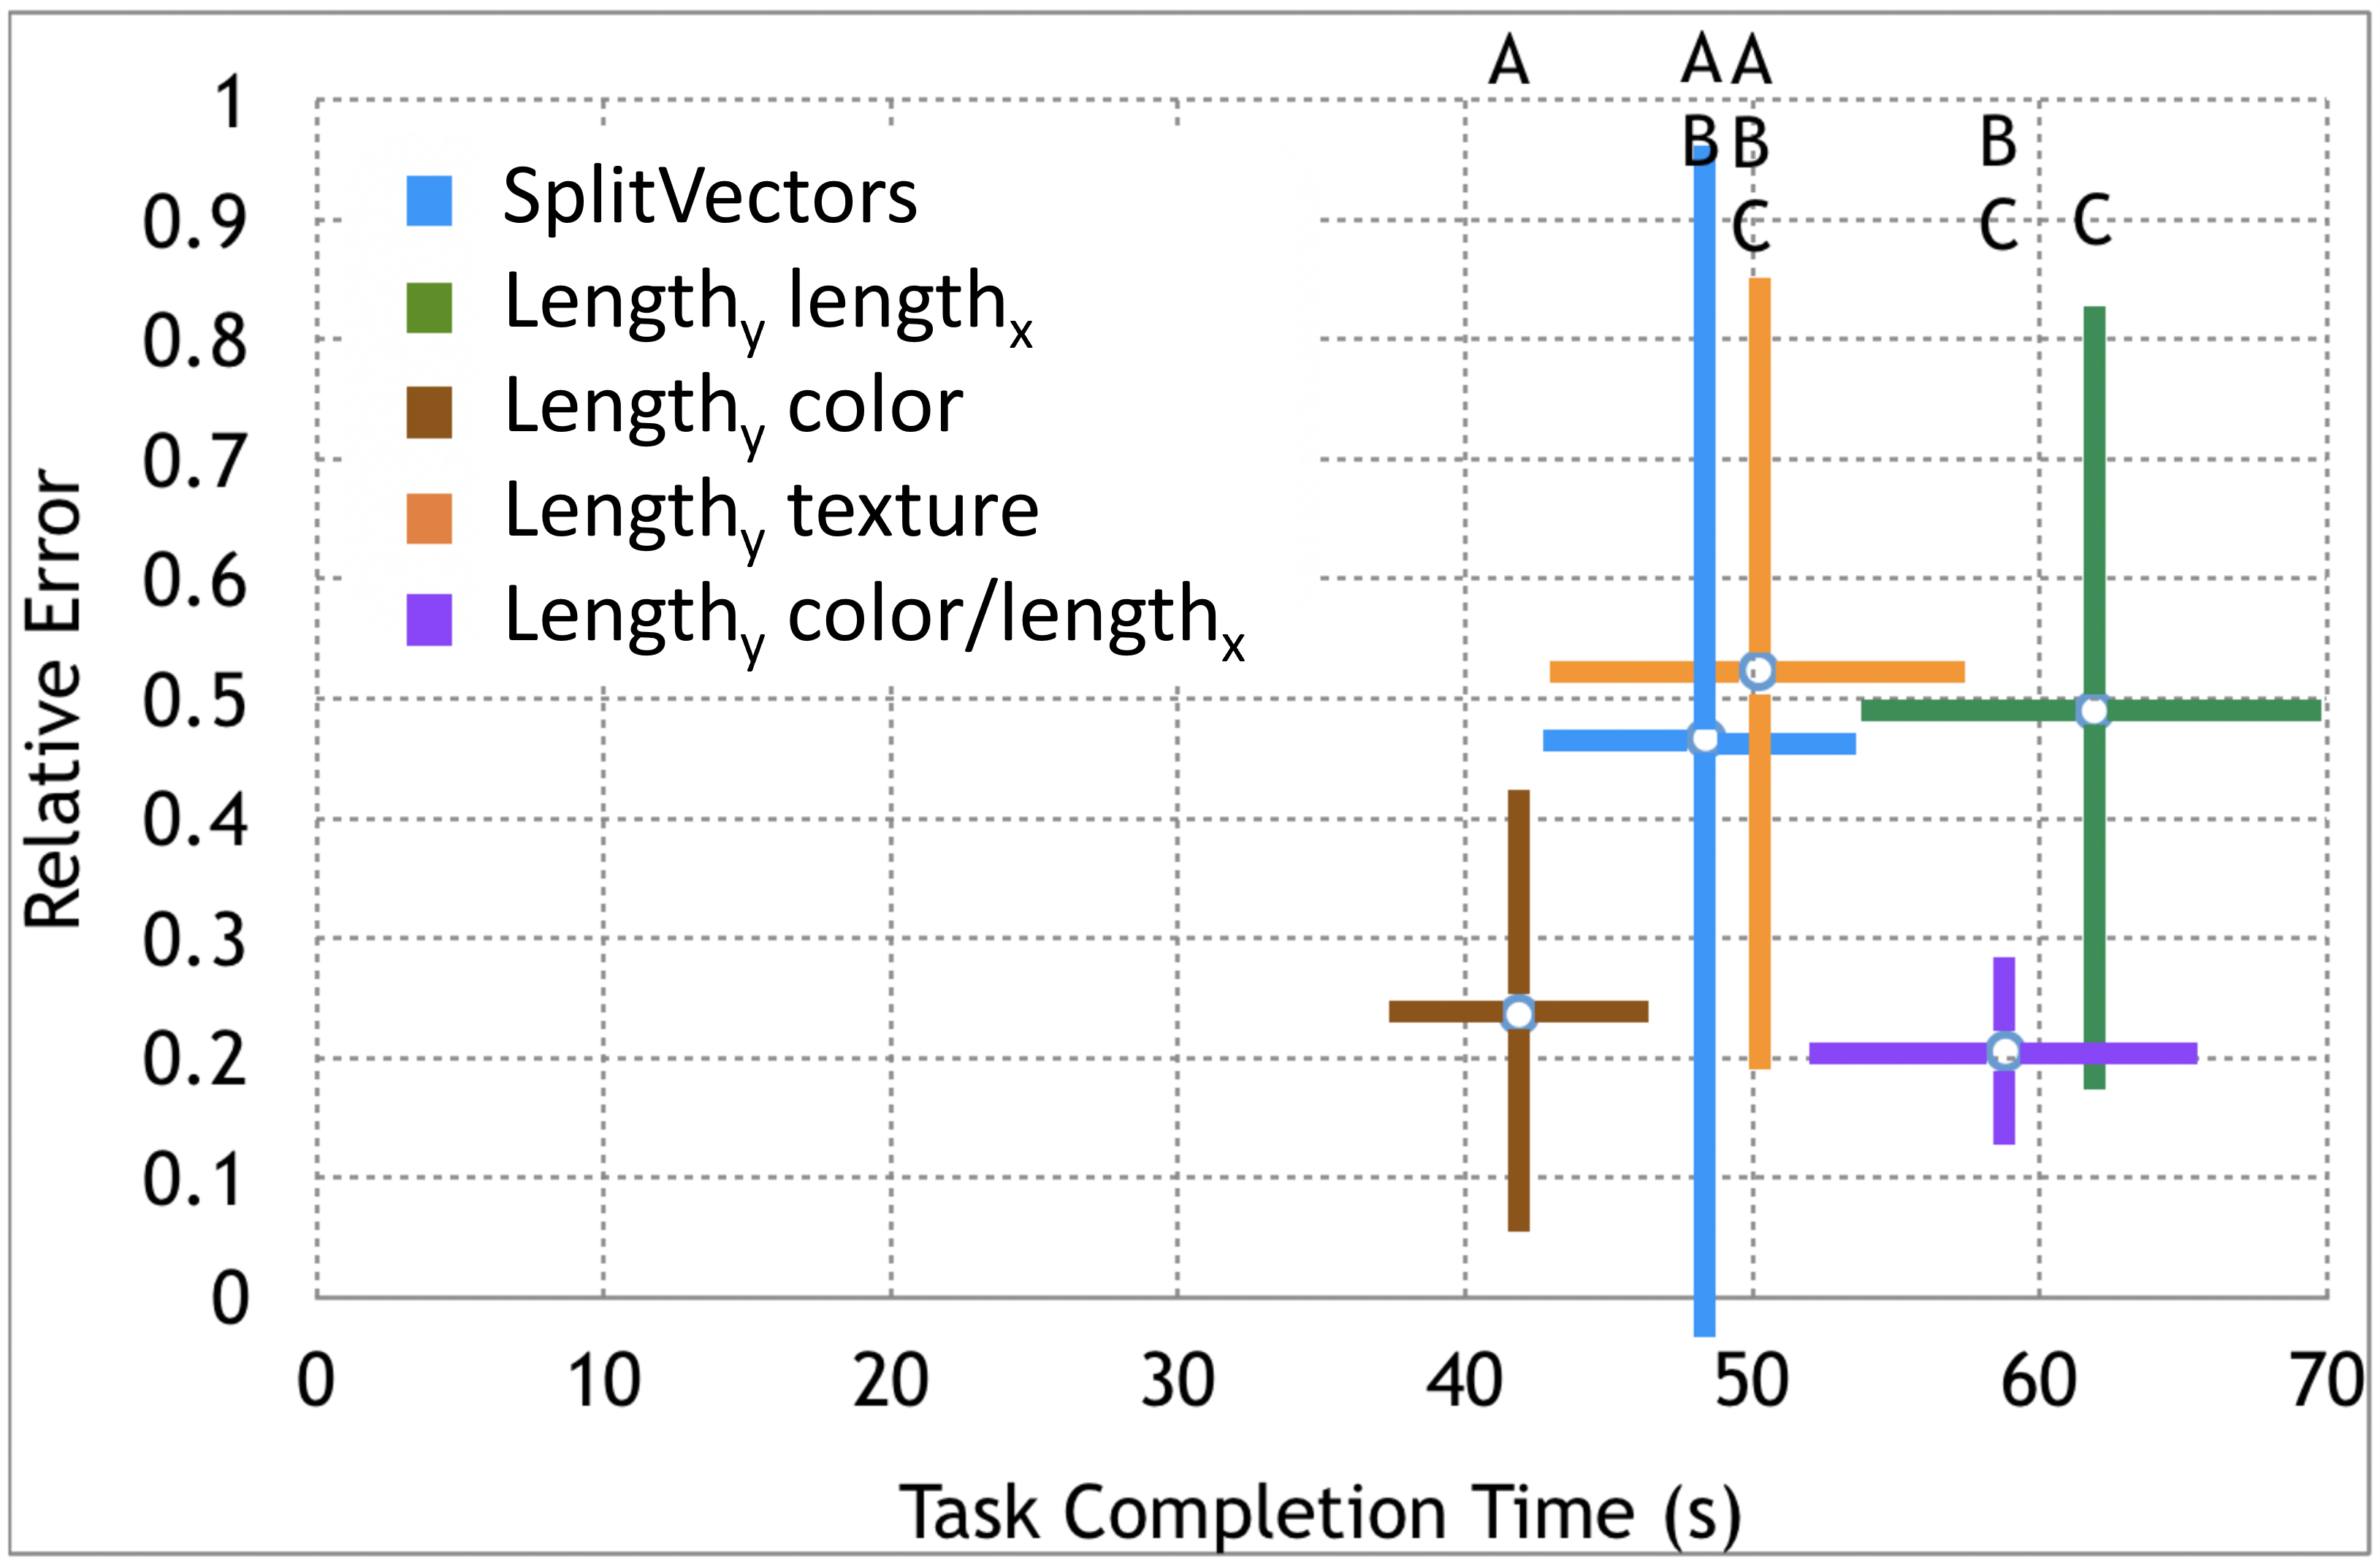
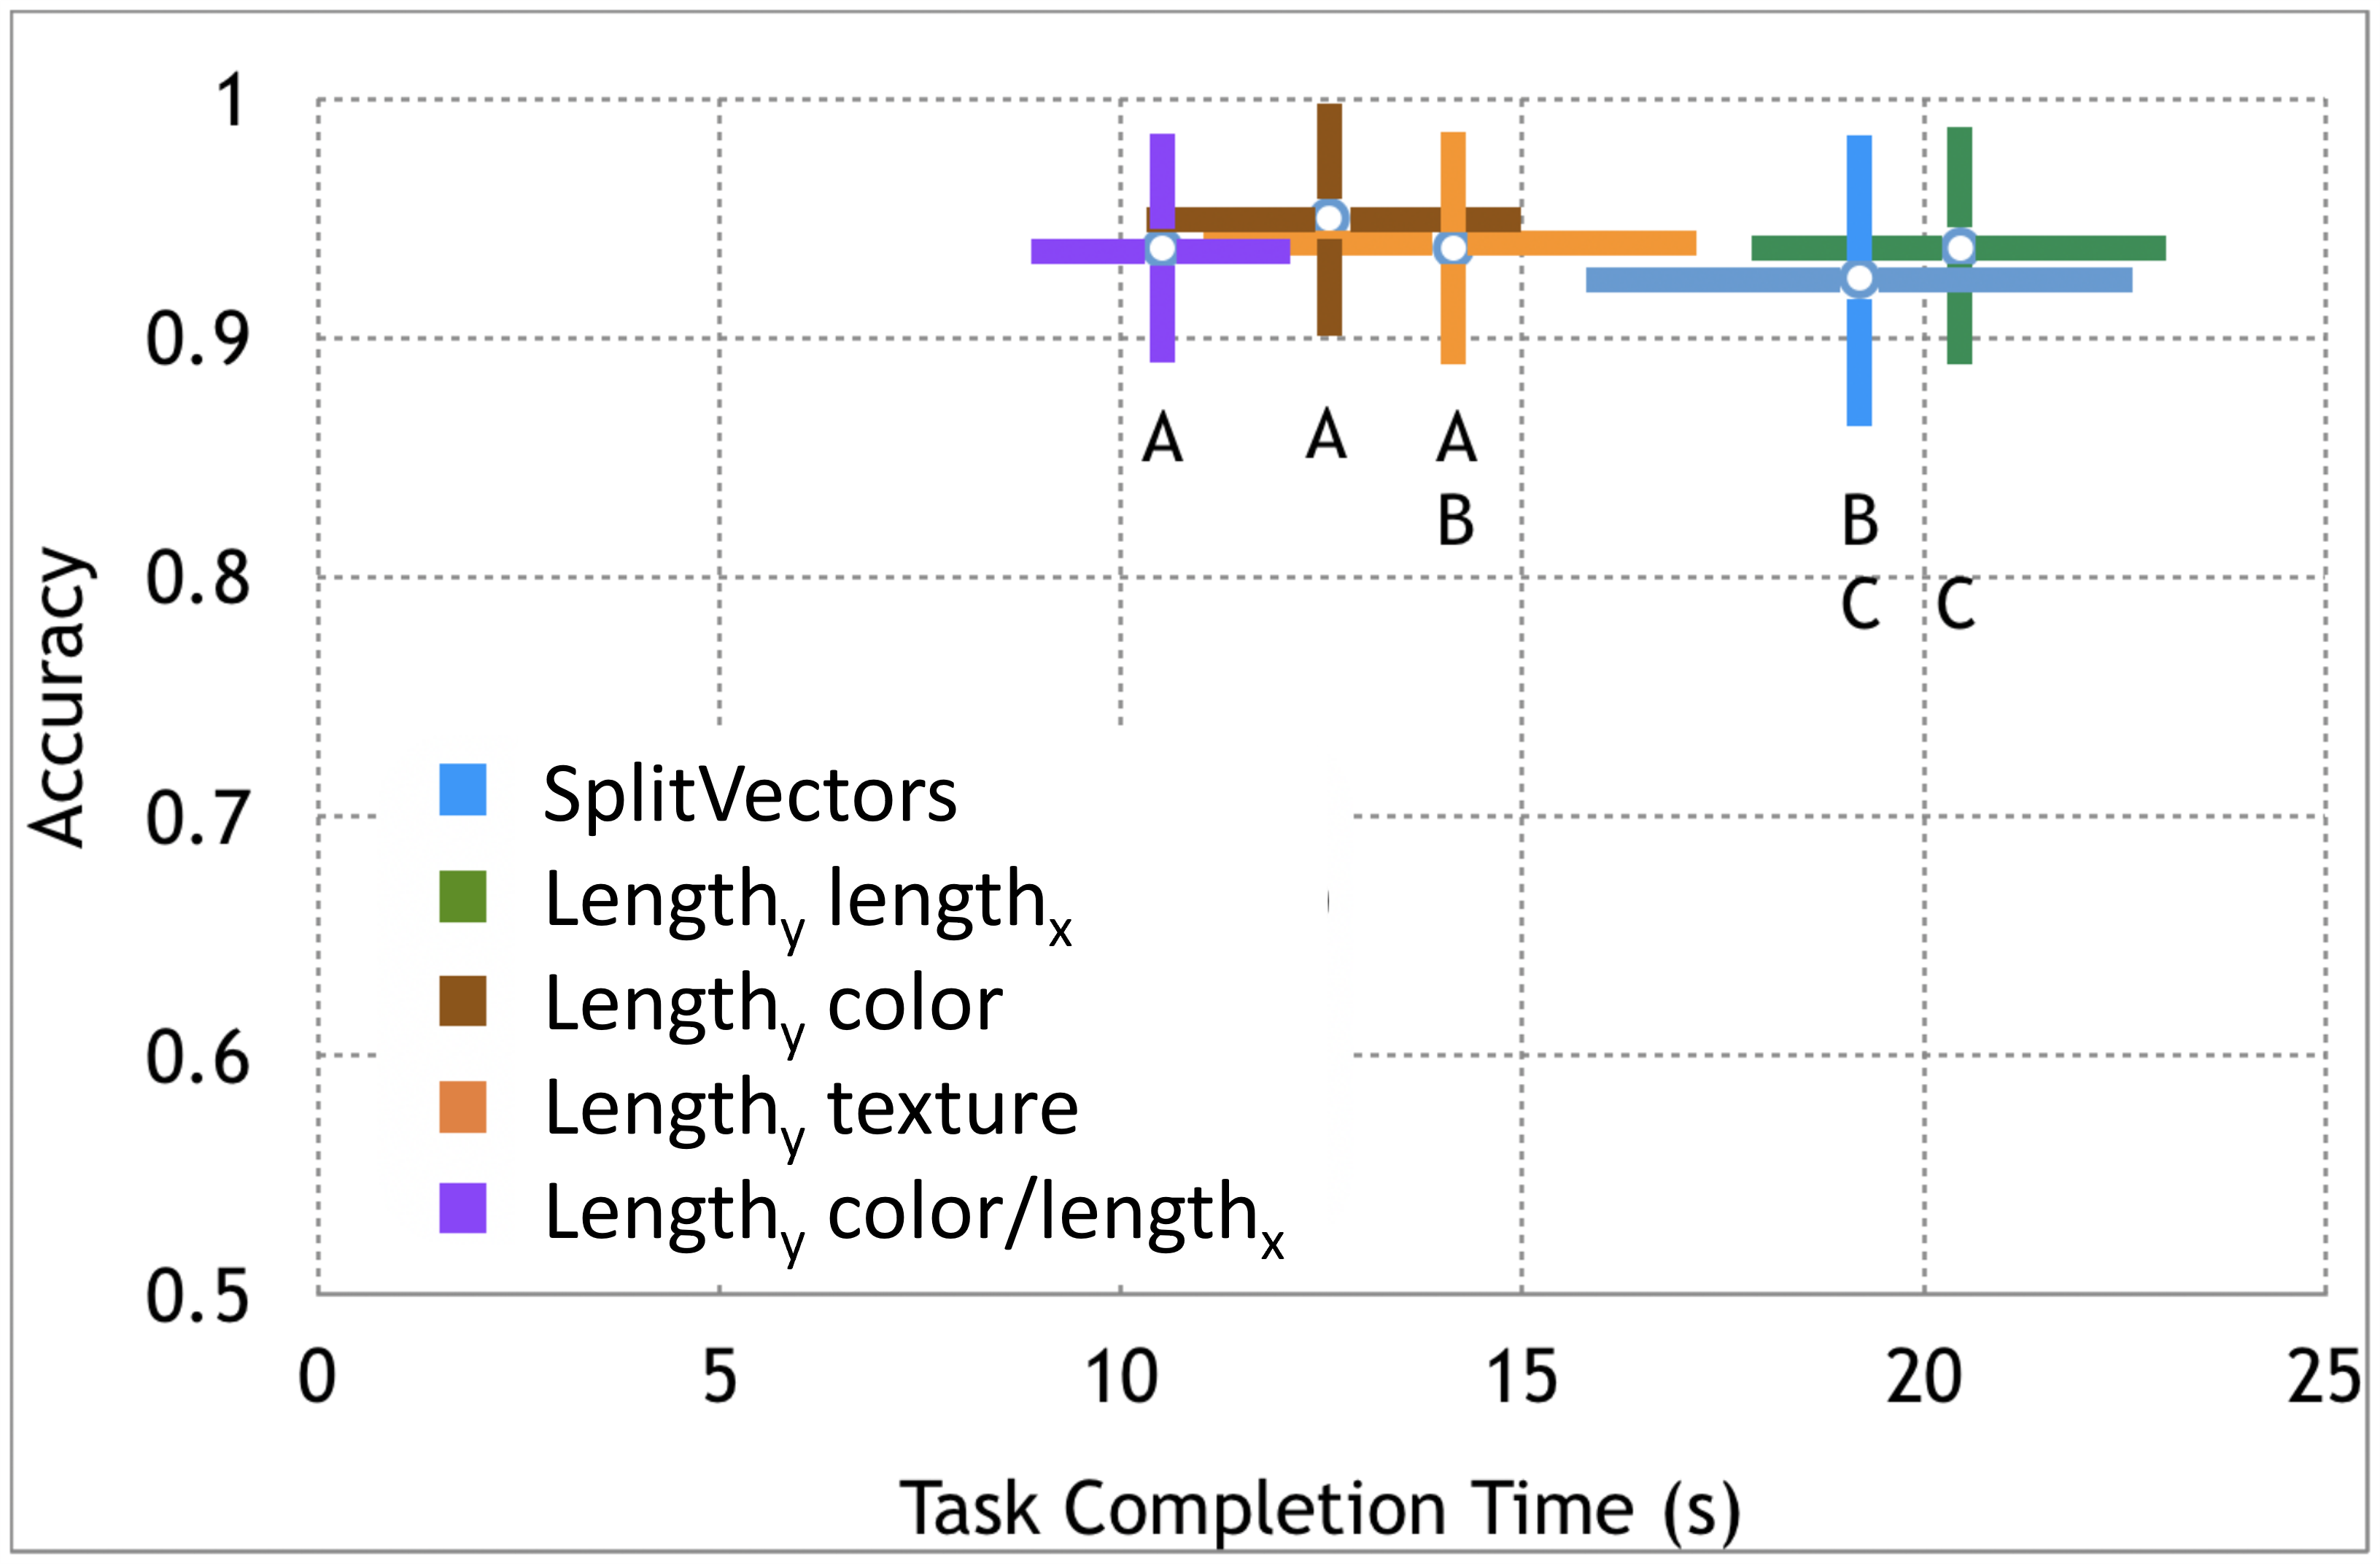
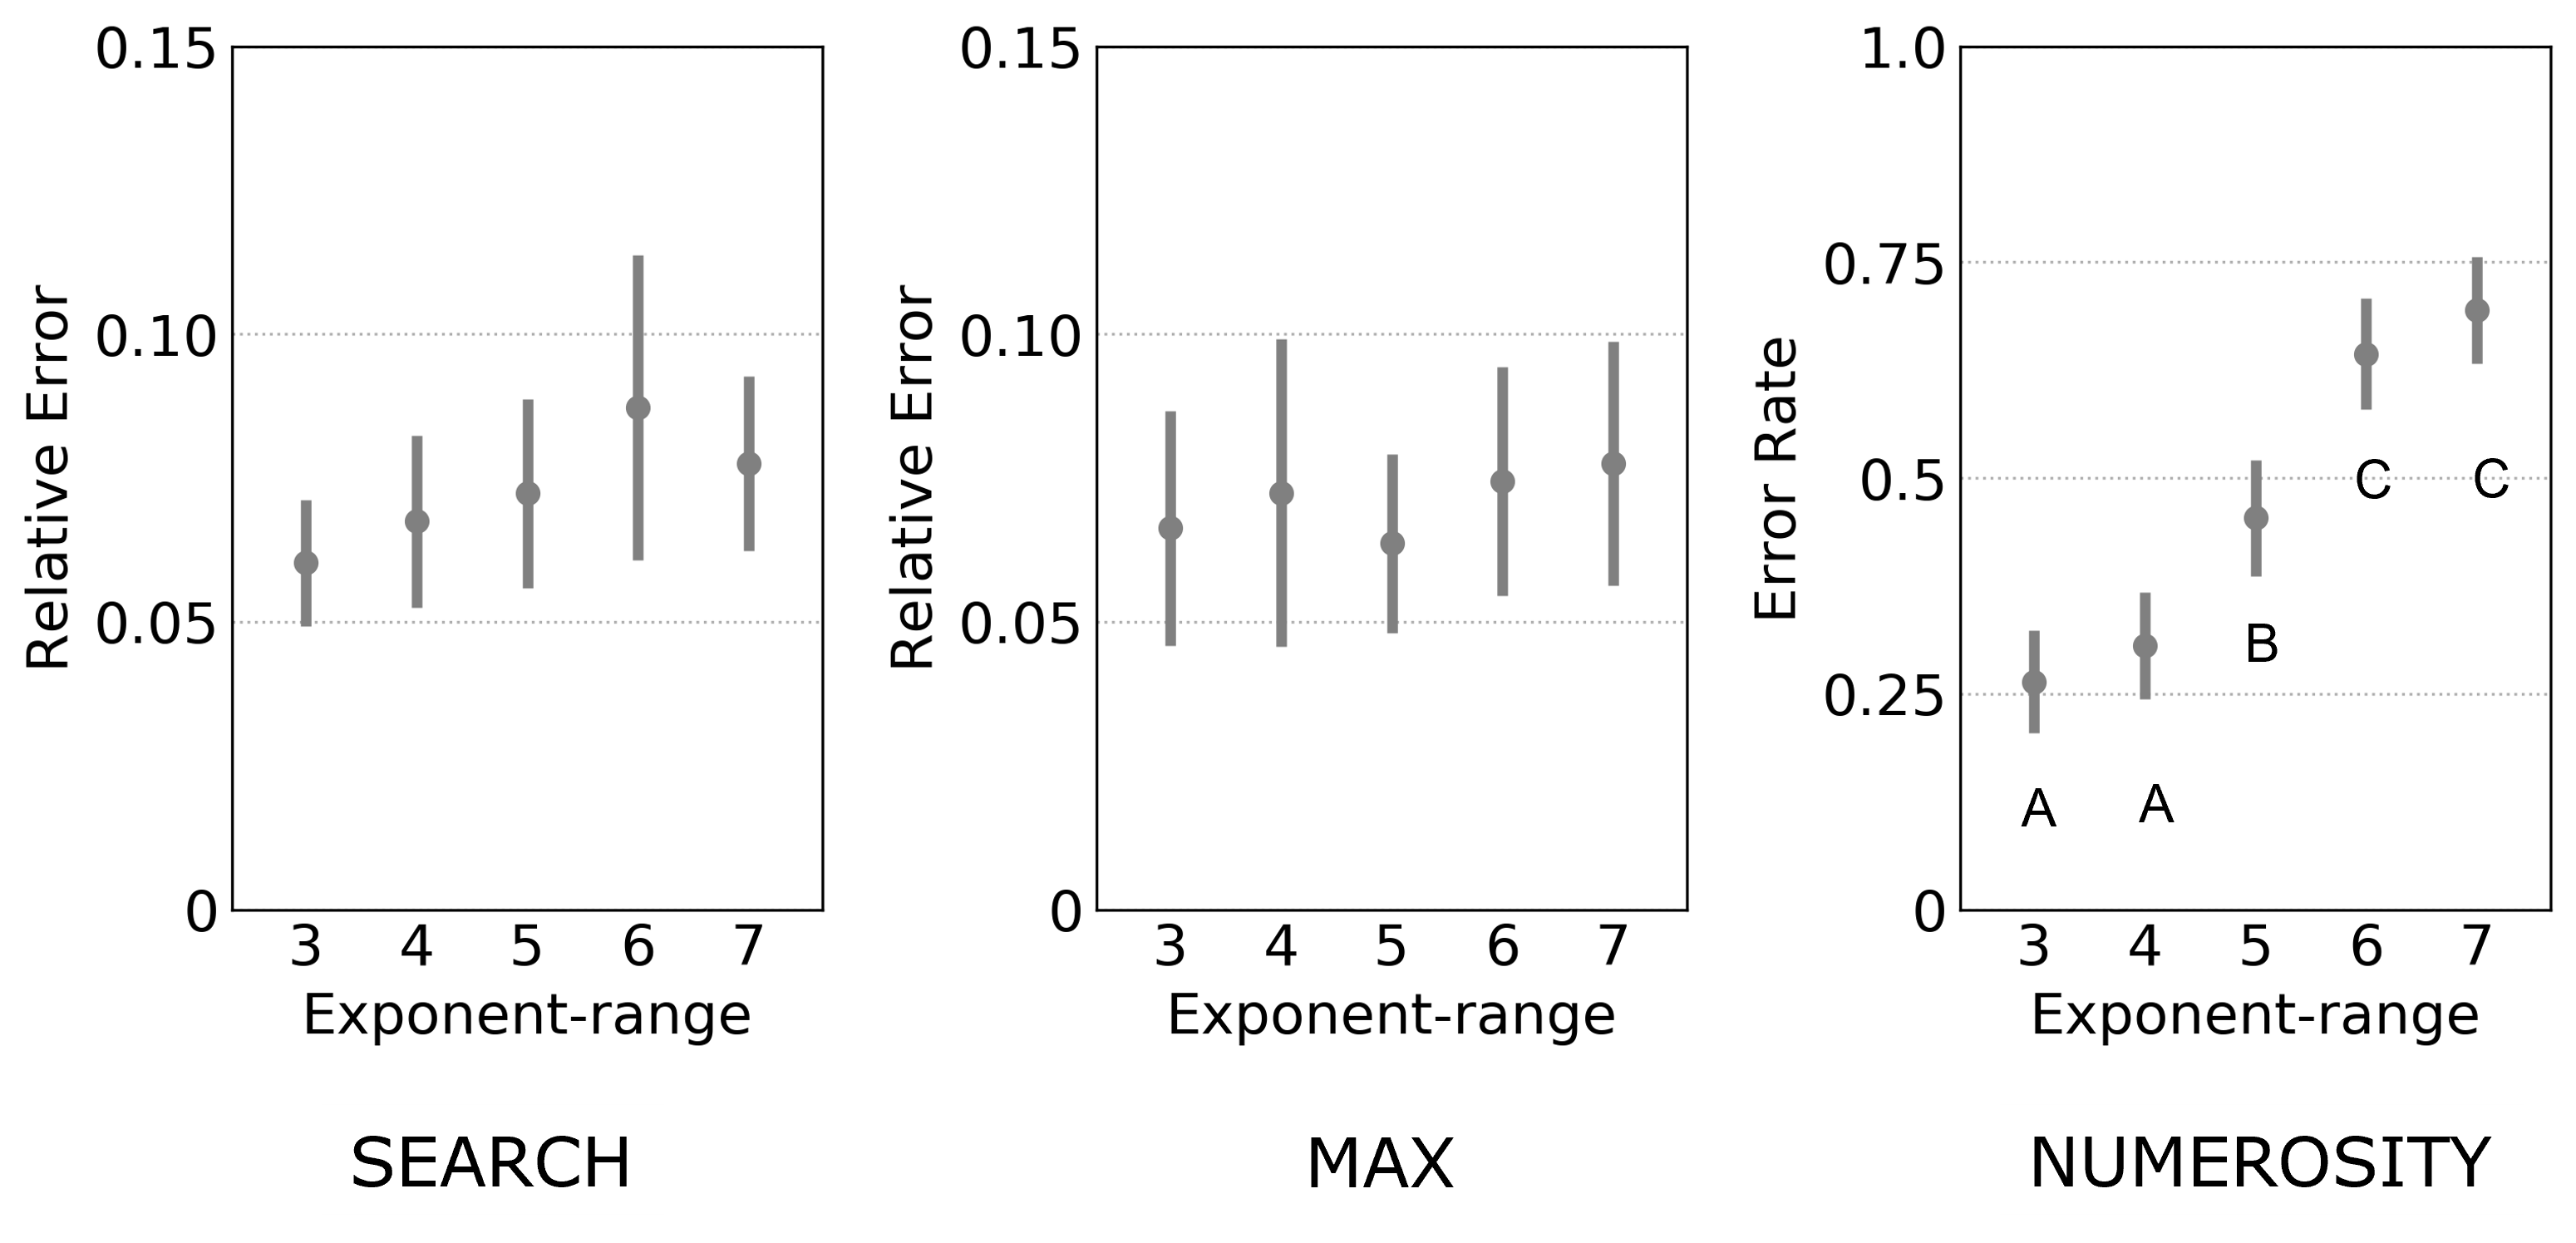
Figure 5 show all C-Error occurrences. Table II and Figure 4 show the and values computed with SAS one-way measures of variance for task completion time and relative error. Our results clearly demonstrated the benefits in terms of task completion time of separable dimensions for comparison. We observed a significant main effect of feature-pair type on task completion time for all three tasks MAG, RATIO, and COMP, and the effect sizes were in the medium range. was the most efficient approach. For COMP, , and were most efficient for simple two-point comparisons (Figure 4(c)).
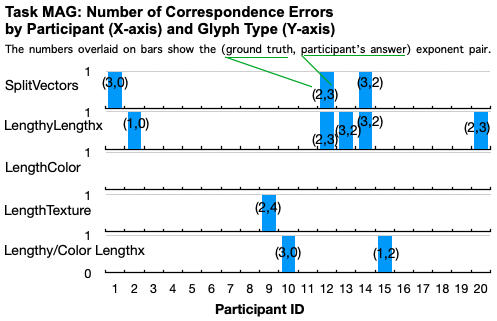
3.2.3 Separable Dimension Coupled with Categorical Features had the Least Correspondence Errors.
We only observed C-Errors in MAG, but not in the RATIO and COMP tasks. The total count was relatively small ( instances of 400 data points). They came from participants (error mean = and confidence intervals (CI)=). Figure 5 shows all instances of these errors by participant and by encoding methods. It appeared that the degree of separability of integral-separable dimensions influenced the errors: the most integral dimension had the highest number ( instances) of C-Errors and the most separable had none.
3.2.4 Separable Dimensions Are Better Than Integral Dimensions for Local Comparisons. But Categorical Feature was not a Statistically Significant Effect.
Our first two hypotheses H1 and H2 are supported. In the MAG task, the integral was the least efficient and all other separable-pairs were in a separate group, the most efficient one (Figure 4(a)). In RATIO, , , and splitVectors were the most efficient group (Figure 4(b)); in COMP, the redundant , , and were in the most efficient group (Figure 4(c)). SplitVectors was not as bad as we originally thought in perceiving correct exponents. SplitVectors belonged to the same efficient post-hoc group as and for RATIO and these three were also most efficient for MAG.
3.2.5 Separable Pairs of And Achieved Comparable Efficiency To Direct Linear Glyph
One aspect for motivating this experiment was to quantify the benefits of separable pairs [6, 10]: whether the separable pairs supported COMP and how the separable pairs compared in efficiency to the direct mapping (Figure 2(f)). Since our study had the same numbers of sample data as Zhao et al. [3], we then performed a one-way -test to compare against the direct linear encoding in Zhao et al. [3]. Our results indicated that results for COMP (judging large or small) from separable variables was no more time-consuming than direct linear glyphs, and our post-hoc analysis showed that , , and were in the same post-hoc group. We also observed that splitVectors dropped to the least efficient post-hoc group (Figure 4(c)). This result replicated the former study results in Zhao et al. [3] by showing that splitVectors impaired comparison efficiency.
3.2.6 Redundant Feature-Pairs Were Efficient
We also confirmed hypothesis H3. We were surprised by the large performance gain with the redundant encoding of mapping and to the exponents in splitVectors. With the redundant encoding, the task completion time was significantly shorter than for MAG and COMP tasks. While Ware [10] confirmed that the efficiency might not be improved by using separable dimensions, in our case, where color and size (separable) represent the same quantitative value, we suggested that the redundancy worked because participants could use either length or color in different task conditions. We could also consider that is a redundant encoding of , and those two feature-pairs had similar efficiency and accuracy for all local tasks.
3.3 Summary
The separable-pair condition is necessary for effective glyph design because all separable pairs were more efficient than the integral ones. The pre-attentive condition enabled by categorical encoding among the separable pairs may be not since not all conditions were statistically different performance-wise. All tasks (MAG, RATIO, and COMP) lacked of significant main effect on relative errors (in MAG or RATIO) or accuracy (in COMP). Note that none of these three tasks required initial visual search, and target answers were labeled. Wolfe called this type of task-driven with known target guided tasks [8]. was the most accurate in all tasks.
We also did not see the needs for the second condition for perceptually accurate glyphs in this experiment. We did not observe differences among categorical dimensions color, texture, and length. We suspect that the reason for this lack of significance could well be their similarities in mentally computing load. The load was relatively small when comparing two values. We suspected that when search-space set-size increases, and when tasks are more complex involving all items, participants will need preattentive global scene features to guide their search. We subsequently ran the second experiment to increase the set size in tasks to the entire scene to study the benefits of categorical features to show quantitative exponent values to benefit global search.
4 Experiment II: Scalability of Global Scene Features
The goal in this second experiment is to quantify the benefits of separable feature-pairs when they introduce categorical features of scene guidance for global tasks in search spaces, as large as the entire dataset of several hundreds items. In other word, we measure scene feature scalability of global tasks.
4.1 Overview
We had three design considerations for us to carefully choose the categorical features in setting up this experiment, concerning the use of glyphs for showing complex simulation results. Intriguingly, all of these considerations support our second glyph design consideration of using a categorical variable in one of the separable pairs.
The first reason is that the initial at-a-glance global statistical summary of the scene depends on categorical information [7]. One of the most important advances in vision science is to find that viewers can summarize the scene without attending to the specific items [40]. Visual dimensions facilitating this summary process become global scene features and these features are pre-attentive [8]. While visualization is mainly about mapping data values to visual variables, the new theory concerns how features form the structural and content of the scene that can affect efficiency. If the quantum spins contain one object at a time, then the first condition of glyph design considering integral and separable dimensions is sufficient to explain the experience as we have shown in Experiment I. For complex tasks, in general, our visual system has a limited capacity. To cope with this limit, humans first visually summarize the scene to find specific regions of interests [6, 8]. If categorical features stimulate population responses from multiple items, we should observe fewer errors and better efficiency. For example, we have exemplified in the Introduction section for search of “largest” values by looking up “yellow” regions, without attending to every single items of “yellow”.
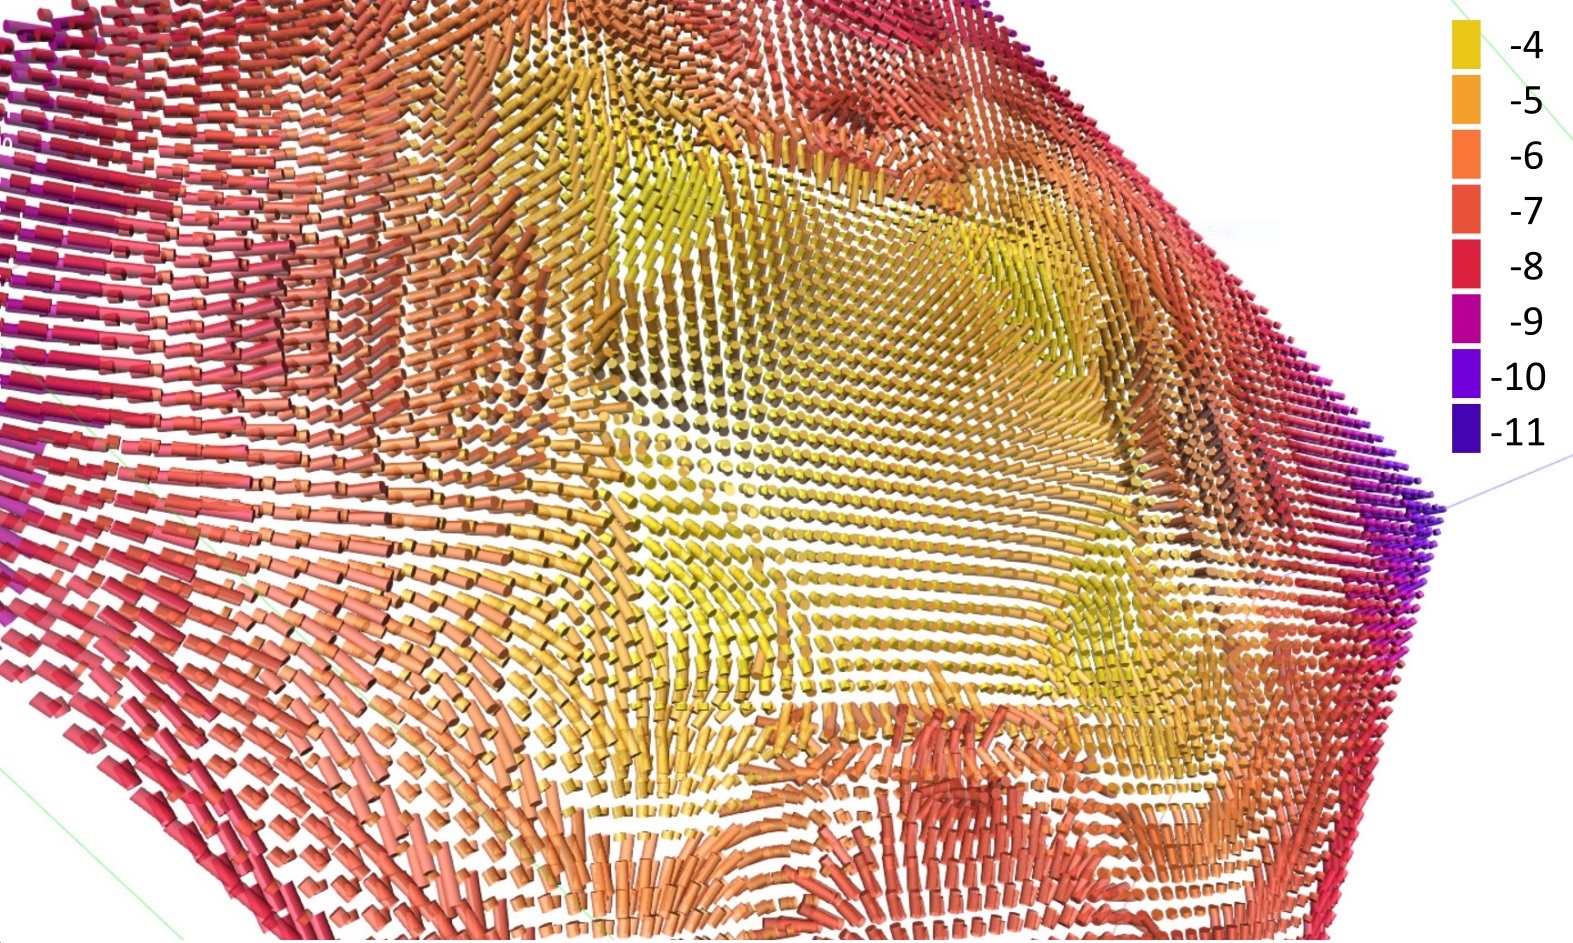
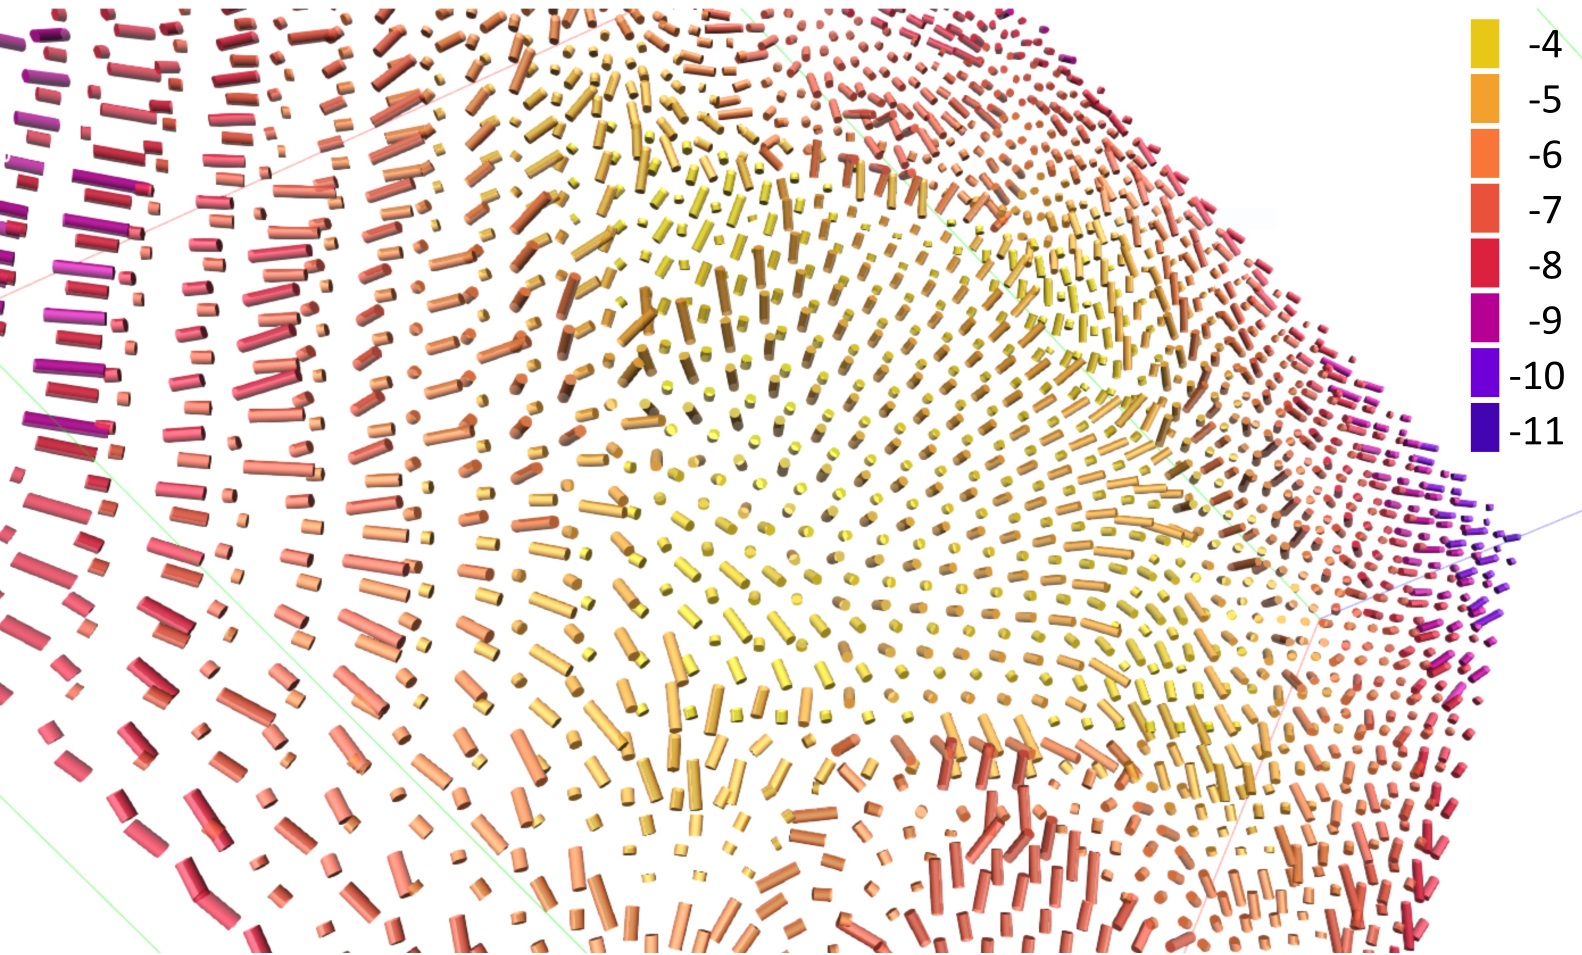
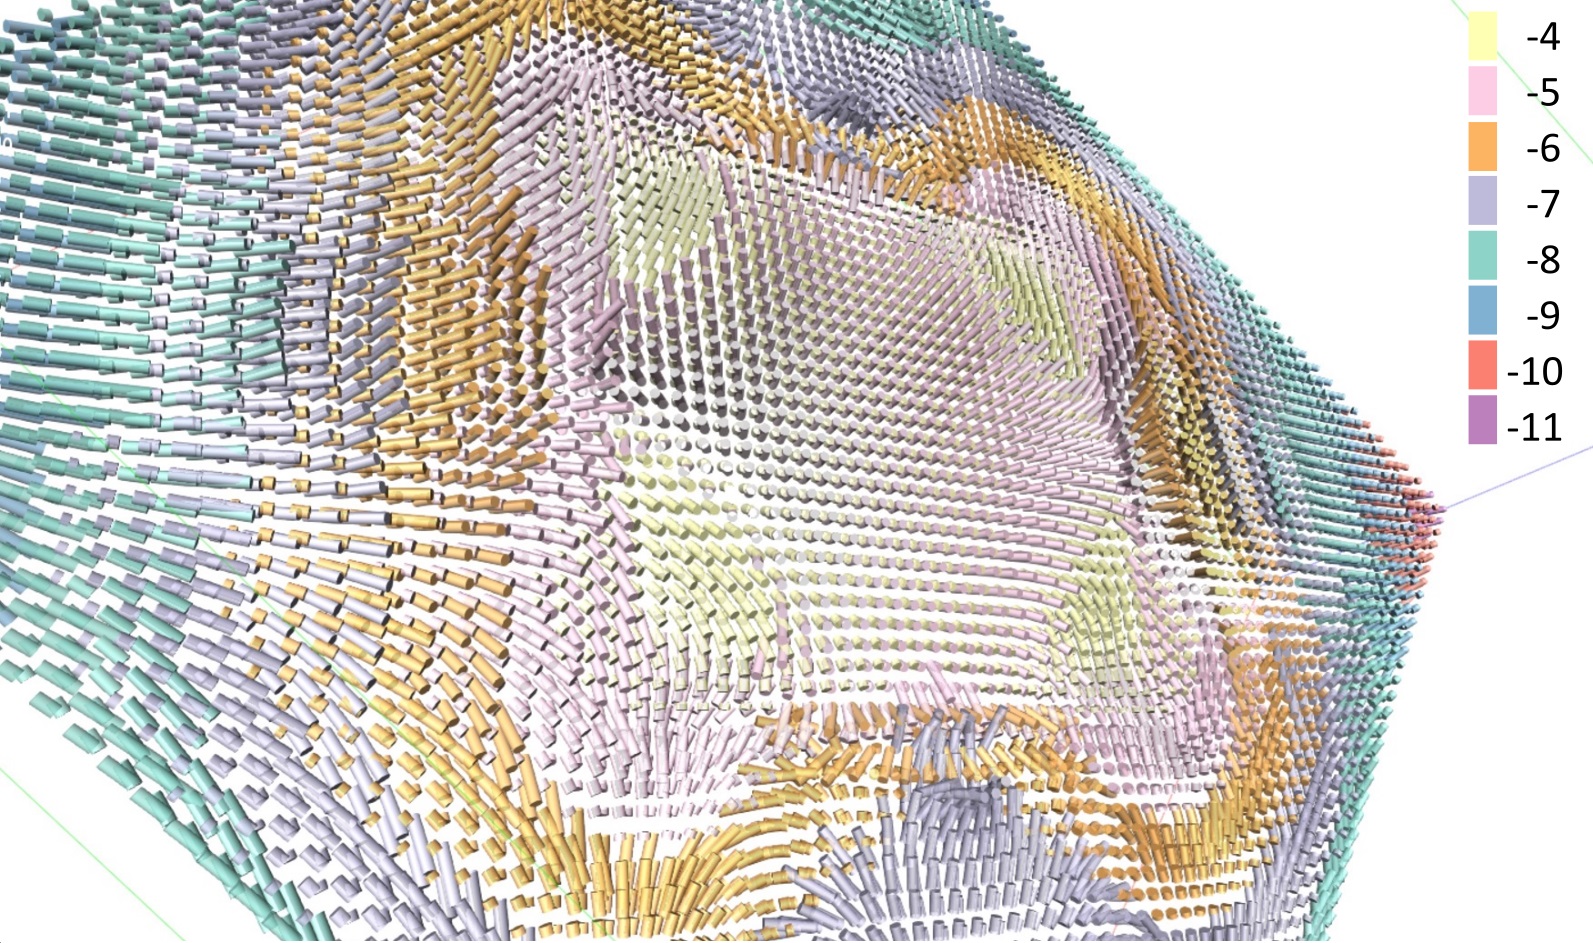
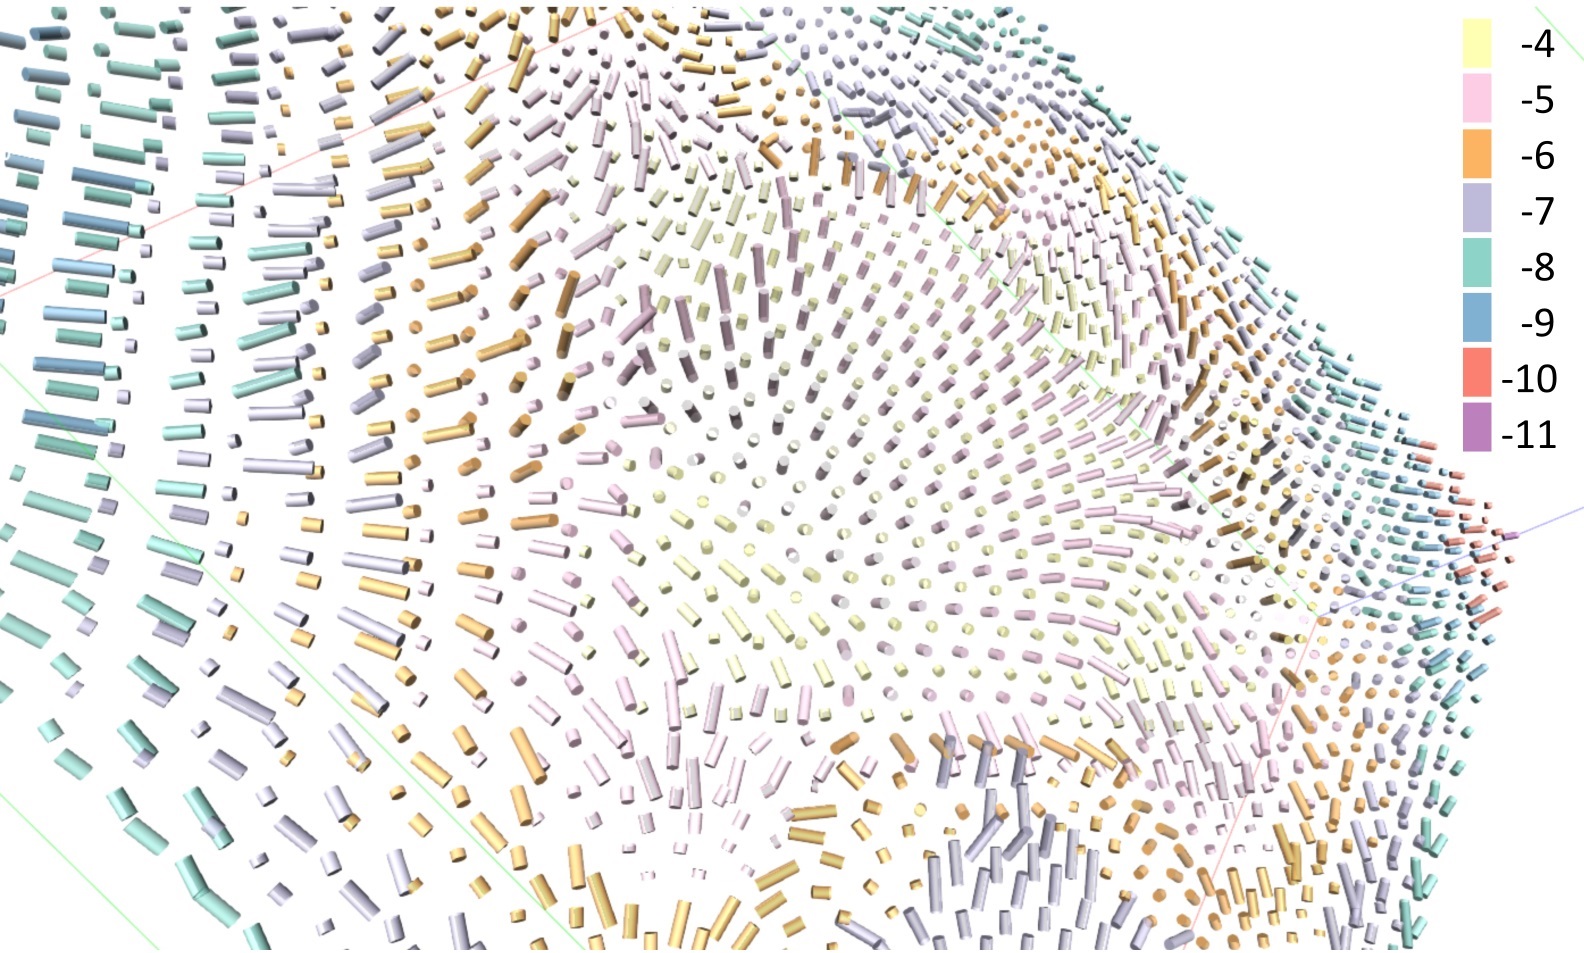
The second concerns scalability to feature distances. Here feature distance is meant to represent target-distractor similarity. It is not the absolute features (e.g., yellow) that direct our attention towards the answer; rather, what determines performance is the result of a comparison between target (yellow) and other data features (such as pink and orange) in the scene (e.g., yellow is different from other colors and the yellow regions stand out) [8]. In other words, one must also look at feature distractors [41, 42, 14], whether or not they are heterogeneous, and that the efficiency of a scene guidance will decline as a function of the degree of distractor variation [19, 24, 43]. While generally, subjective reports from Experiment I indicate that and show the similar perceptual speed. Performance of texture may decline faster than color as the exponent range increases because our vision is not as sensitive to luminance-variation as to hues. For example, at the exponent-range of 7 in Figure 6, the differences between yellow and pink could be more differentiable than the two top-level textures of different amount of black. In this study, we expanded the data range from the single level in Experiment I to five ranges to understand feature-pair scalability to feature distances. The efficiency of color in Experiment I could well arise because the range (of ) was not large enough.
The third concerns the density effects on color choices. Figure 7 shows two densities and two colormaps (a categorical colormap from Colorbrewer [36] and a segmented continuous colormap by the number of exponents generated from the extended blackbody colormap). For a feature to actually guide attention, we can see from Figure 7, the boundary detection with these colormaps is associated with data density. Unless the data density was reasonably high, detecting the boundaries using continuous colormaps (Figures 7(a), 7(b)) is harder than the ColorBrewer colormaps (Figures 7(c), 7(d)).
4.2 Method
4.2.1 Feature-Pairs
We used , , and baseline splitVectors in Experiment II. These three visualizations were chosen because and are among the best feature-pairs from Experiment I and because color and texture are among the most separable features according to Ware [10]. To introduce a “distractor” experience to measure scalability to feature distances, we vary the data range from the levels in Experiment I to levels in Experiment II (See mapping in Figure 13, Appendix C.)
4.2.2 Hypotheses
We had the following hypotheses:
-
•
Exp II.H1 (Accuracy). More categorical feature in the separable pairs will be more effective. We thus anticipate a rank order of effectiveness from high to low: , , and splitVectors.
-
•
Exp II.H2 (Correspondence Errors). More categorical feature of color in the separable pairs will reduce C-Errors, when participants will choose the correct exponent level.
-
•
Exp II.H3 (User behavior). More categorical dimension in the separable feature-pairs will lead to optimal users’ behaviors: i.e., participants can quickly locate task-related regions for tasks that demand looking among many vectors due to global scene features.
4.2.3 Tasks
Participants performed three tasks in which they had to compare all vectors to obtain an answer.
Exp II. Task 1 (SEARCH): visual search. A vector search within seconds (Figure 8(a)). Find the vector with magnitude within seconds. The target vector was shown at the bottom-right corner of the screen. Participants were asked to find this vector.
Exp II. Task 2 (MAX): find maximum. An extreme value search within seconds (Figure 8(b)). Within seconds, locate the point of maximum magnitude when the exponent is . in the study was a number from to the maximum exponent (). This was a global task requiring participants to find the extremum among many vectors.
Exp II. Task 3 (NUMEROSITY): estimate the total number of unique vector exponents (Figure 8(c)). Estimate the total number of unique vector exponents in the entire vector field within seconds. Data are randomly chosen and modified to produce the to range.
4.2.4 Task Choices
Tasks are use-inspired by real-world quantum physics data analyses. Experiment I drilled down to a single or at most two spins. But global tasks are also of quantum physicists’ interests, such as those involving understanding the distributions of quantum spin magnitudes. Practically, a spin represents charge density or the measure of the probability of an electron being present at an infinitesimal element of space surrounding any given point. This probability varies due to electron traveling from one grid point to another and is often interpreted together with its neighbors. Quantum physicists are thus interested in searches for regions, where local regions are defined by spin magnitude and different regions would correspond to changes in exponent. Often the most interesting regions are also those with specific charge densities (Task 1) or largest magnitudes (Task 2) . The regional task is related to learning the number of interesting regions or magnitude exponent clusters (Task 3).
Performing tasks was limited to seconds as a pilot study showed that it took participants about seconds or on average about seconds to finish search tasks 1 and 2. Also, preattentive processing when used for scene guidance involving a group of similar objects are often fast for viewers to see and increasing the number of items should not significantly impair the search time. From the practical side for the last experiment, participants who would want a perfect score could just spend time counting. Constraining the time allowed us to measure the accuracy when they may have to use the scene feature.
4.2.5 Data Choices
Data were first sampled using the same approach as Experiment I, and no data is used repeatedly in this experiment. We then modified the exponent range from to for the three tasks by normalizing the data to the desired new data range.
Prior literature used both synthetic data and real-world data to construct the data visualization as test scenarios, enabling tight control over the stimulus parameters (e.g., [44]). Most of the synthetic data in literature were to replicate real-world data characteristics; and others were explained in fictitious use scenarios. The goal was primarily to prevent preconceived user knowledge about the domain-specific attributes. As a result, the synthetic data strike the right balance between real-world uses and the data characteristics.
In our cases, replicating characteristics in quantum physics data was challenging and indeed impossible, since atom behaviors in high-dimensional space were largely unknown and thus were not easily simulated. Our approach was therefore to randomly sample quantum physics simulation results to capture domain-specific attributes and then modify the data to suit evaluation purposes. We showed our data to our physicist collaborators to ensure their validity. We confirmed that these modifications preserved the domain-specific schema of a scene in terms of the domain-specific structures and complexity from real simulations. These modifications represented less than of overall data points in each scene. Finally, It improves the reuse of our study results.
4.2.6 Empirical Study Design
Dependent and Independent Variables. We used a within-subject design with two independent variables of feature-pair (three levels: baseline splitVectors, , and ) and exponent range (five levels: ). The dependent variable was relative error. We did not measure time since all tasks were time-constrained.
Participants performed (feature-pairs) (magnitude-ranges) (repetitions) trials for the first two tasks. Three repetitions were used to give participants enough time to develop strategies. For NUMEROSITY tasks, the design runs repetitions, resulting in (feature-pairs) (exponent-ranges) (repetitions) trials. Each participant thus executed trials. Completing all tasks took about minutes.
Self-Reporting Strategies. Several human-computer interaction (HCI) approaches can help observe users’ behaviors. Answering questions can assist us to determine not just which technique is better but also the strategies humans adopt. For example, cognitive walkthrough (CTW) measures whether or not the users’ actions match the designers’ pre-designed steps. Here we predicted that participants would use the global scene-features as guidance to accomplish tasks. We interviewed participants and asked them to verbalize their visual observations in accomplishing tasks.
4.2.7 Participants
Eighteen new participants ( male and female, mean age = , and standard deviation = ) of diverse backgrounds participated in the study (seven in computer science, four in computer engineering, two in information systems, three in engineering, one in business school, and one in physics).
Procedure, interaction, and environment were the same as those in the Experiment I.
4.3 Experiment II: Results and Discussion
We collected data points per task for the first two tasks of SEARCH and MAX and points for the third NUMEROSITY task.
4.3.1 Analysis Approaches
For SEARCH and MAX tasks, we measured relative error (which was the percentage the reported value was away from the ground truth and the same as that of Experiment I) with SAS repeated measure. The last NUMEROSITY task used error rate which was the percentage of incorrect answers of all trials for each participant. We also used the same outlier removal methods to remove instances of correspondence errors for SEARCH and MAX.
4.3.2 Overview of Study Results
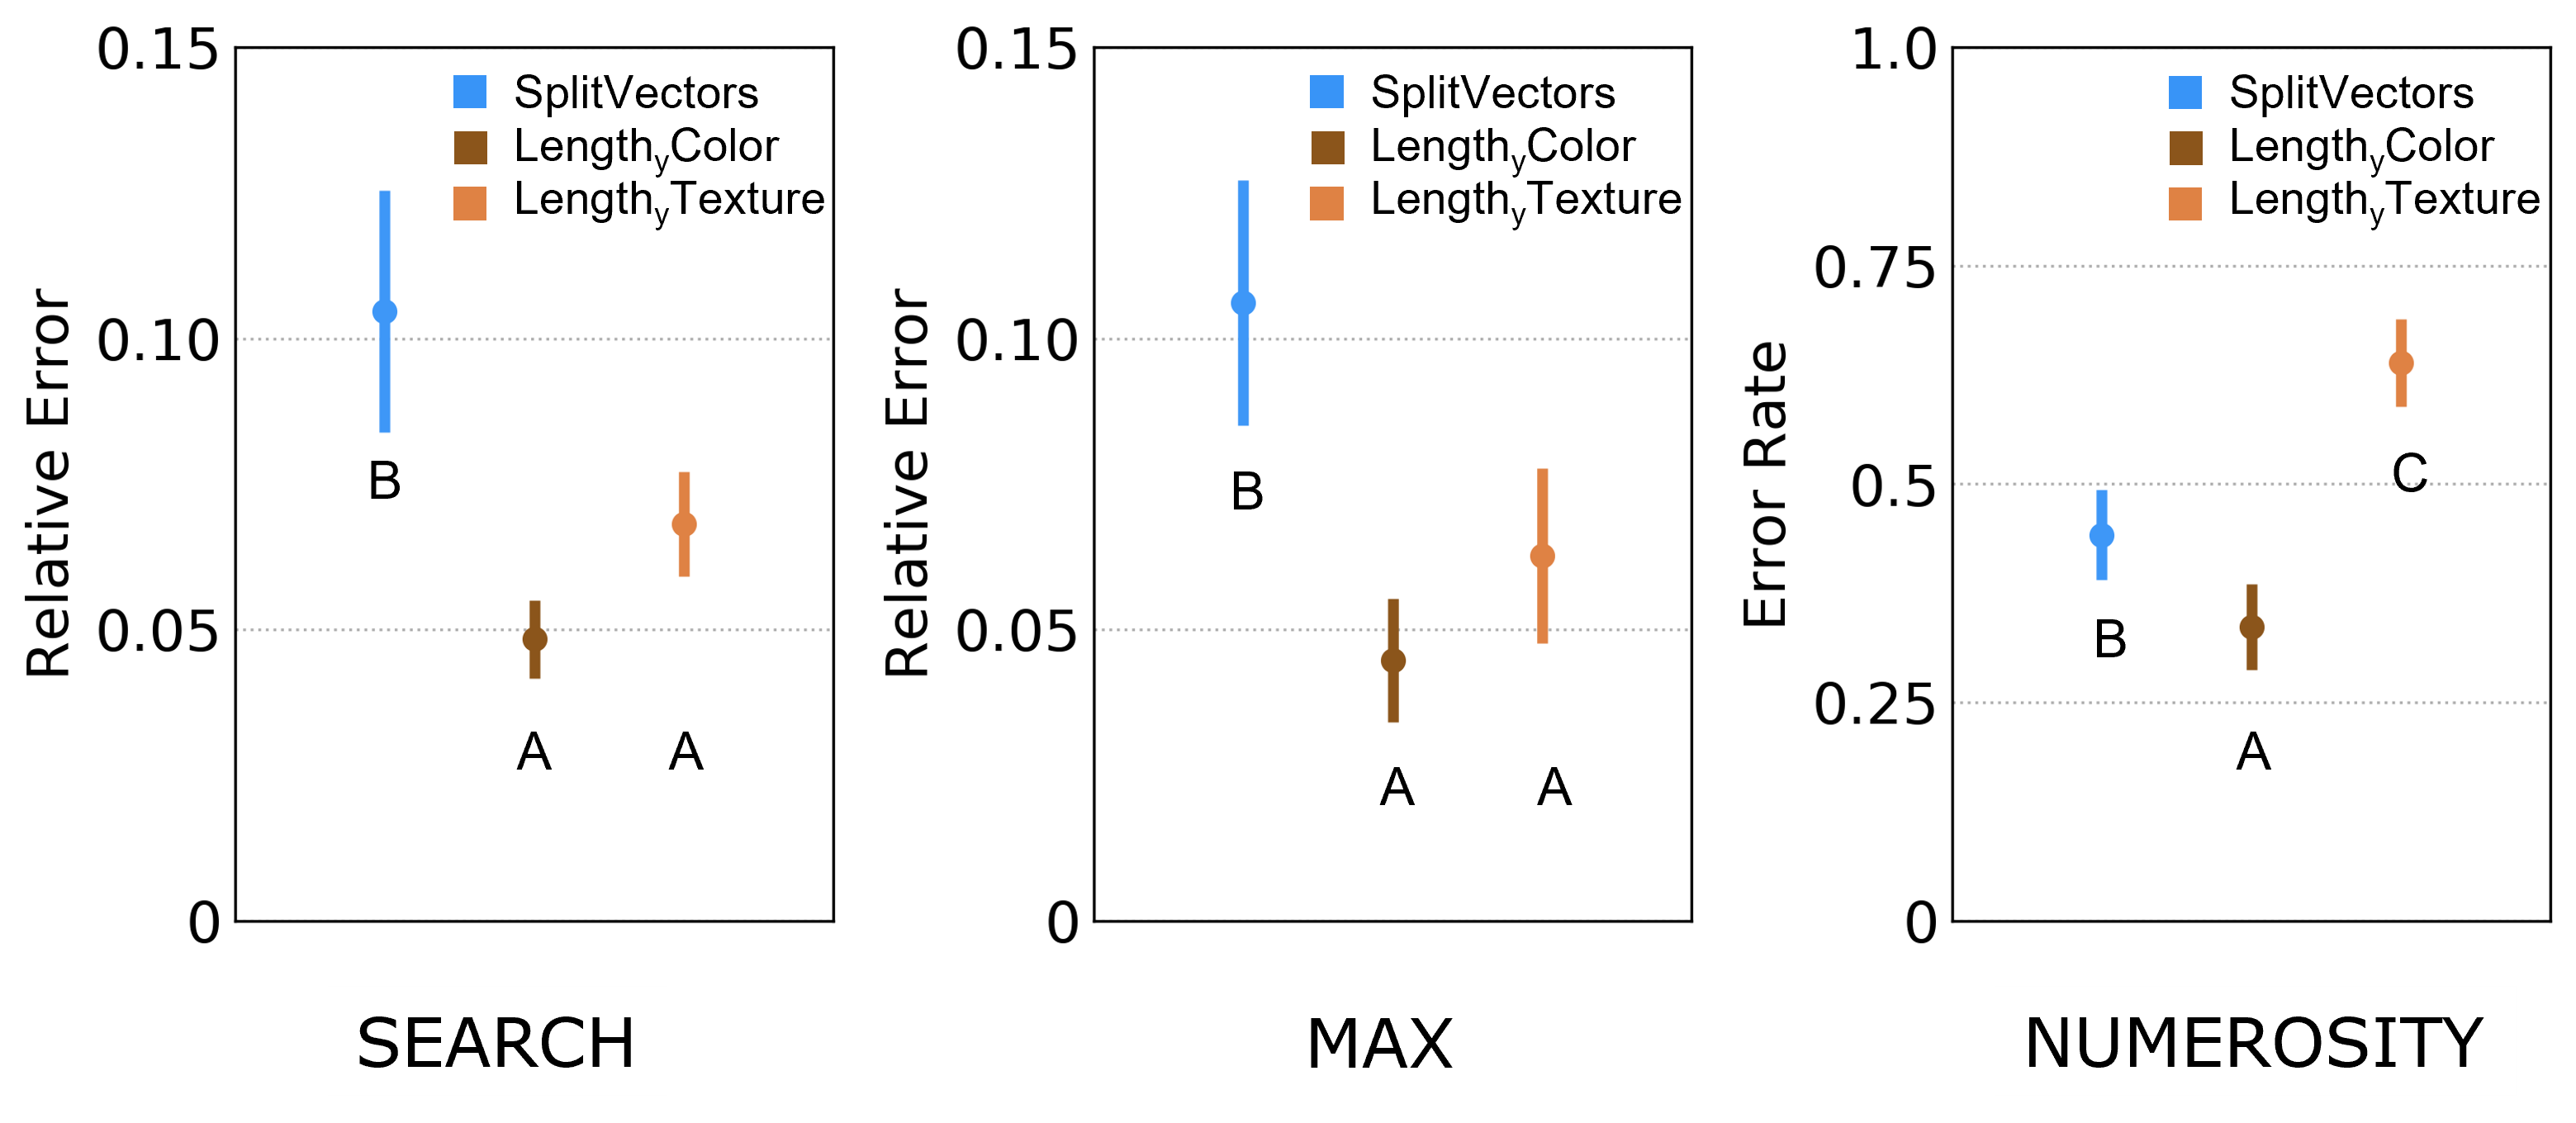
Table III and Figure 10 show the summary statistics; And all error bars again represent confidence intervals. We observed a significant main effect of feature-pair type on all three tasks. For the first two tasks, the post-hoc analysis revealed that and were in the same group, the most efficient one and that relative errors were statistically significantly lower than those of the splitVectors. remained the most accurate pair for the NUMEROSITY tasks. Exponent-range was only a significant main effect for NUMEROSITY, with power ranges and were significantly better than , which was better than and .
4.3.3 More Categorical Features of Separable Dimensions Improved Accuracy
We were interested to see if we could observe significant main effects of categorical features in the separable pairs in this experiment. Here we did observe the significant main effect and confirmed our first hypothesis (H1) for both SEARCH and MAX: in the general trend, more separable was more effective than which was better than splitVectors, and and were in the same Tukey group, when viewers were in the correct data sub-categories.
led to the most accurate answers, and splitVectors was better than for NUMEROSITY task. This result can be explained by participants’ behaviors - more than half the participants suggested they simply look for the longest cylinder from splitVectors since they know the numerical values in the test were continuous. This behavior deviated from our original purpose of testing the global estimate but did show two perspectives in favor of this work: (1) participants developed task-specific strategies during the experiment for efficiency; (2) 3D length still supported judging large and small and it was not as effective as color perhaps due to ensemble perception from categorical features.
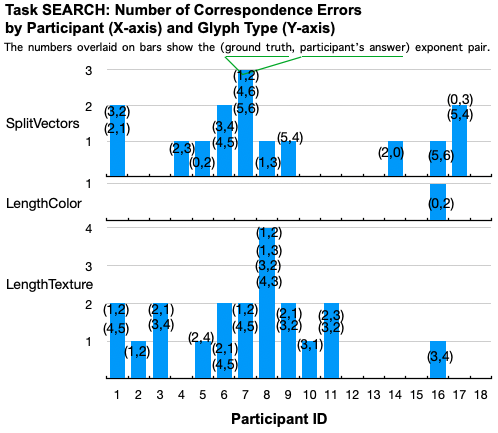
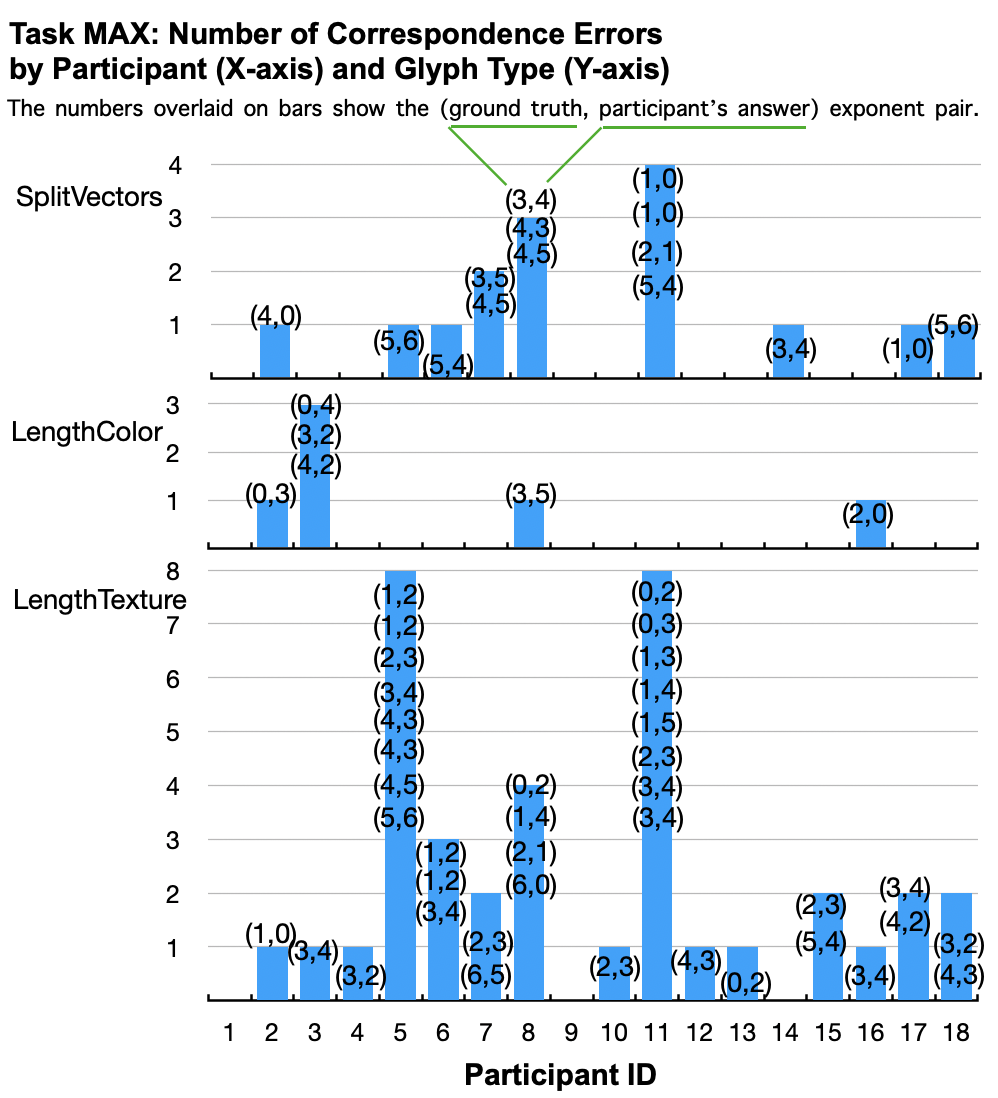
4.3.4 Color Categories of Separable Pairs Reduced Correspondence Errors by a Large Margin
Our second hypothesis H2 was also supported. We first tested the number of correspondence errors in SEARCH and MAX in the same way as in Experiment I. These results when combined with those in Experiment I confirmed again that the reduced correspondence errors. For SEARCH, There were only a single instance of correspondence error. instances of correspondence errors came from participants (mean, CIs=) (Figure 9 top). Another instances for MAX came from of participants, mean, CIs) (Figure 9 bottom).
| Task | Variables | Significance | ES |
| SEARCH | feature-pair | F(2, 261) = 18.4, p 0.0001 | 0.46 |
| (, ) splitVectors | |||
| power-range | F(4, 261) = 3.0, p = 0.20 | 0.86 | |
| MAX | feature-pair | F(2, 261) = 15.4, p 0.0001 | 0.47 |
| (, ) splitVectors | |||
| power-range | F(4, 261) = 0.3, p = 0.87 | 0.11 | |
| NUM | feature-pair | = 63.2, p 0.0001 | 0.25 |
| splitVectors | |||
| power-range | = 47.4, p 0.0001 | 0.35 | |
| (3, 4) 5 (6, 7) |
4.3.5 Compensating The Cost of Search in Complex Data through Preattentive Scene Feature
The visualizations in our study contained hundreds of items from realistic uses. Subjective behaviors through self-report suggested that they adopted a sequential task-driven viewing strategy to first obtain gross regional distribution of task-relevant exponents. After this, a visual comparison within the same exponent region were achieved. With these two steps, judging large or small or perceiving quantities accurately from separable variables would not use object-level information process.
Many participants commented on how the number of powers in the data affected their effectiveness. For , participants remarked that it was difficult to differentiate adjacent powers when the total power level is around - for . The white and black textures were very easy to perceive. All but two participants agreed that could perhaps support up to . Chung et al. [42] studied ordering effects and it would be challenging to compare ours to their results because their visual features were not shown as a scene but an isolated feature. More than half of the participants felt that effectiveness of was not affected by changing the number of powers, since they looked for the longest outer cylinder to help find the answer. These results may suggest that subregion selection with can perhaps be better designed with interfaces when the users can interactively select a texture level.
5 General Discussion
We discuss the results from both experiments and suggest future directions.
5.1 Separable Dimensions with Preattentive Guidance for Large-Magnitude-Range Quantum Physics Spins
Our first principle in glyph design is to follow the convention to use separable variable pairs [6, 10]. The results of Experiment I showed that separable dimensions could achieve the same efficiency as direct linear visualizations for COMP and was always more efficient than integral pairs. For these local-tasks, we didn’t observe significant error reduction.
Our second principle in glyph design is to include categorical features in separable pairs. The results from Experiment II studied the rank order of the separable pairs and found that they indeed improved accuracy for global tasks. and splitVectors in both experiments led to more correspondence errors than . Achieving integrated numerical readings by combining two separable visual features at object level seems not necessary.
The separable-dimension pairs of and worked because they were preattentive scene features. Our experiments show that viewers adopted a sequential task-driven viewing strategy based on a view hierarchy: viewers first obtain global distributions of the scene. Then, a visual scrutiny is possible within a subregion. Although splitVectors are separable, visual search for length among length would be unguided because both targets and distractors contained the same visual variable. The more separable, the easier it would be to guide the attention. Using coloring to provide some initial regional division may be always better than not. Texture (luminance) could achieve similar accuracy and efficiency as long as the task-relevant regions could be detected.
5.2 Feature Guidance vs. Scene Guidance
Taking into account both study results, we think an important part of the answer to visualization design is guidance of attention. It is guided to some objects or locations over others by two broad methods: feature guidance (seeing objects) and scene guidance (seeing global structures).
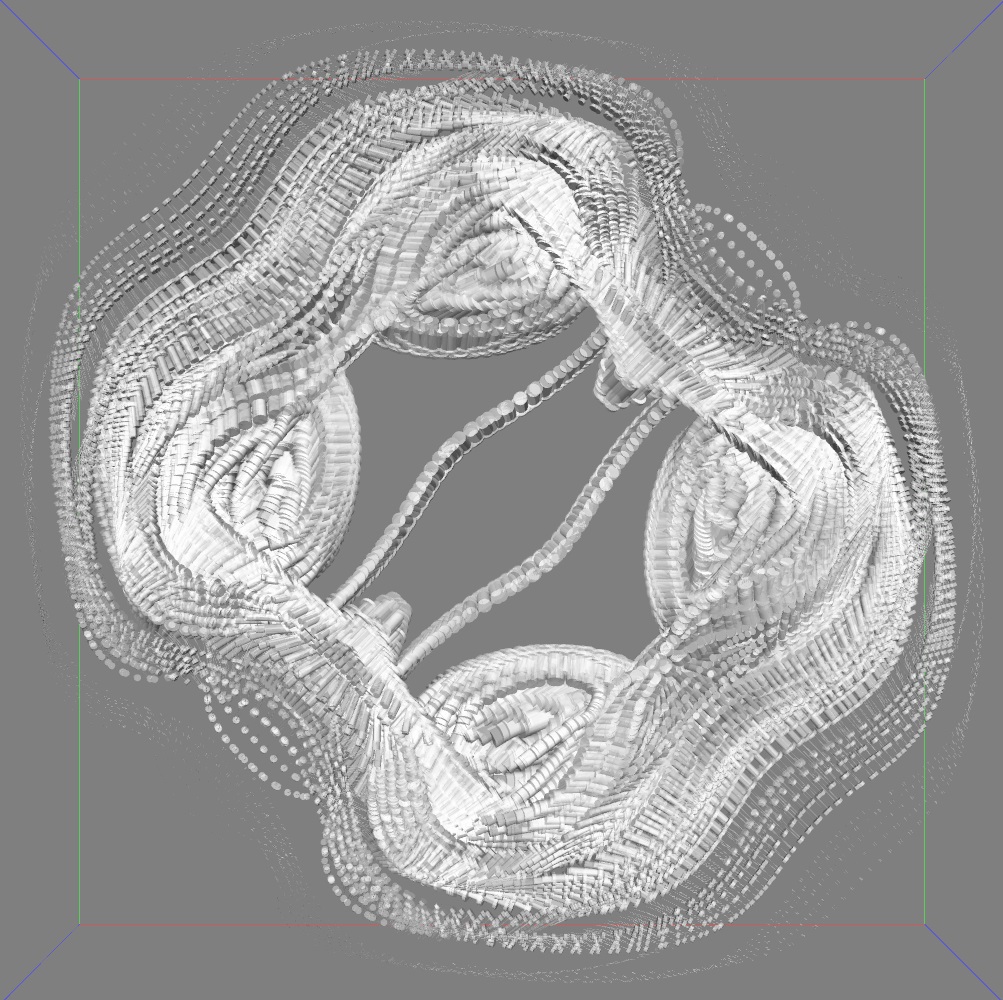
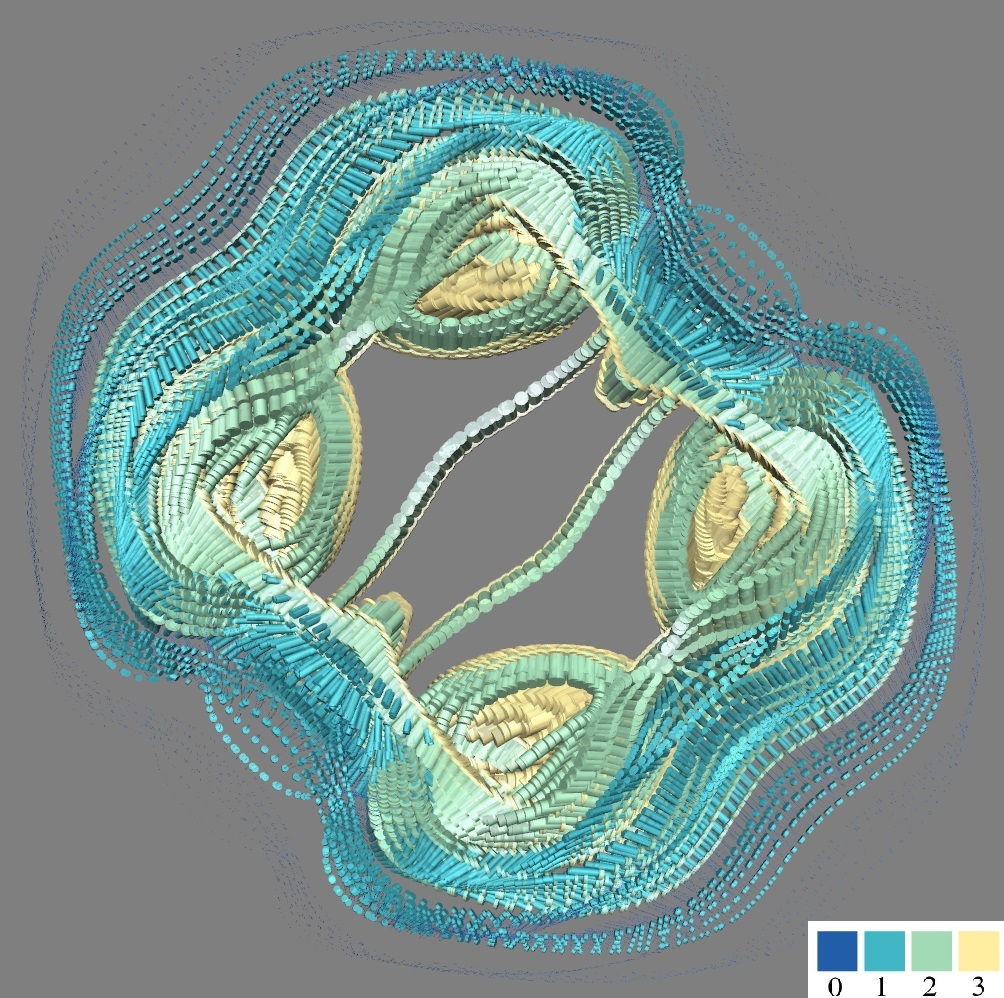
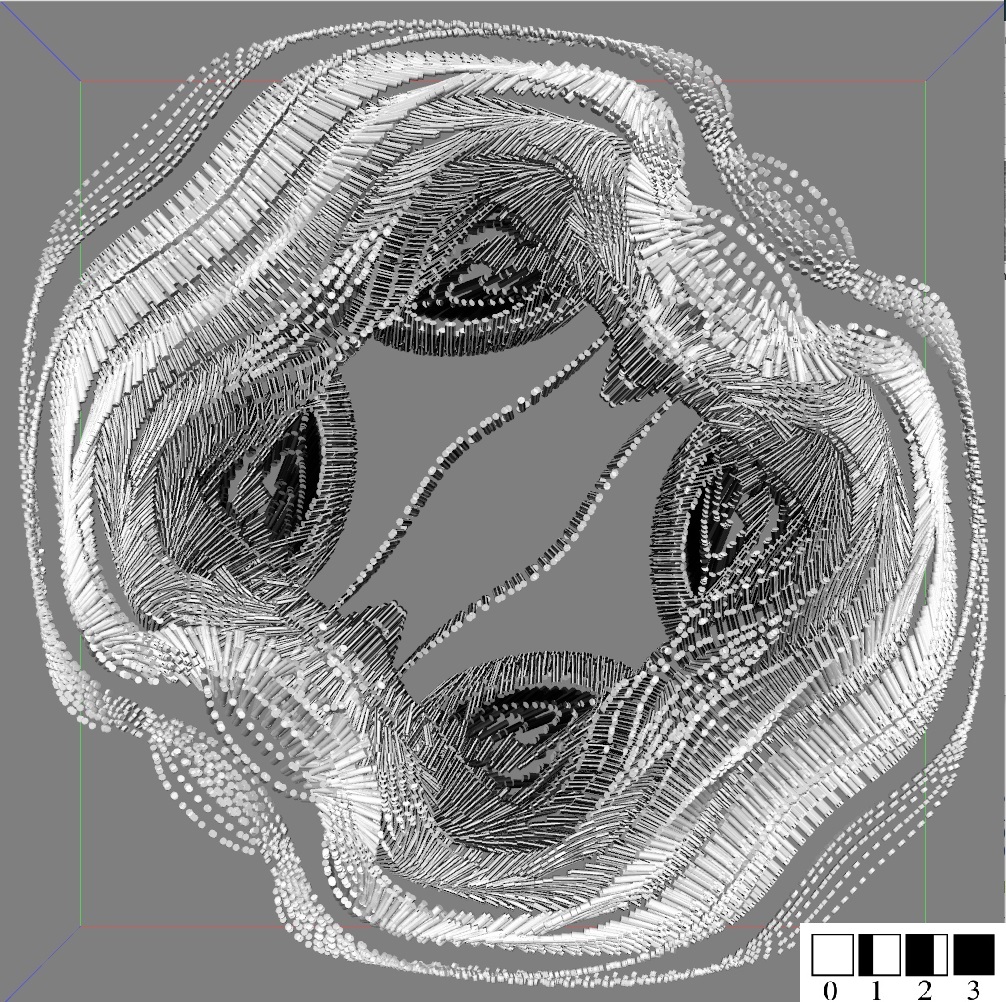
Feature guidance refers to guidance by properties of the task-target as well as the distractors (leading to correspondence errors). These features are limited to a relatively small subset of visual dimensions: color, size, texture, orientation, shape, blur or shininess and so on. These features have been broadly studied in 3D glyph design (see reviews by Healey and Enns [25], Borgo et al. [6], Lie et al. [46], Ropinski et al. [22], and McNabb and Laramee [28]). Take one more example from quantum physics simulation results, but with a different task of searching for the structural distributions in the power of in Figure 11 will guide attention to either the fat cylinders (Figure 11(a)) or the bright yellow color (Figure 11(d), 11(b)) or the very dark texture (Figure 11(c)), depending on the feature-pair types.
Working with quantum physicists, we have noticed that the structure and content of the scene strongly constrain the possible location of meaningful structures, guided “scene guidance” constraints [47, 8]. Scientific data are not random and are typically structured. Contextual and global structural influences can arise from different sources of visual information. If we return to the MAX search task in Figure 11 again, we will note that the chunk of darker or lighter texture patterns and colors on these regular contour structures strongly influence our quick detection. This is a structural and physical constraint that can be utilized effectively by viewers. This observation coupled with the empirical study results may suggest an interesting future work and hypothesis: adding scene structure guidance would speed up quantitative discrimination, improve the accuracy of comparison tasks, and reduce the perceived data complexity.
Another structure acting as guidance is the size itself. It was used by participants seeking to resolve the NUMEROSTIY tasks to look for the longest outside cylinders. We have showed several examples like Figure 11, our collaborator suggested that the cylinder-bases of the same size with the redundant encoding (Figure 11b) also helped locate and group glyphs belonging to the same magnitude. This observation agrees with the most recent literature that guidance-by-size in 3D must take advantage of knowledge of the layout of the scene [45].
Though feature guidance can be preattentive and features are detected within a fraction of a second, scene guidance is probably just about as fast (though precise experiments have not been done and our Experiment II only merely shows this effect). Scene ‘gist’ can be extracted from complex images after very brief exposures [47] [48]. This doesn’t mean that a viewer instantly knows, say, where the answer is located. However, with a fraction of a second’s exposure, a viewer will know enough about the spatial layout of the scene to guide his or her attention towards vector groups in the regions of interest. For example, categorical color becomes scene features since these colorful glyphs were perceived as a whole
A future direction, and also an approach to understanding the efficiency and the effectiveness of scene guidance, is to conduct an eye-tracking study to give viewers a flash-view of our spatial structures and then let the viewer see the display only in a narrow range around the point of fixation: does this brief preview guide attention and the gaze effectively? Work in vision and visualization [49, 50, 51, 52] domain has measured and correlated performance on the glance or global structure formation. Vision science discovered long ago that seeing global scene structures in medical imaging decision making guides experts’ attention (experts always know where to look) [53] [54].
5.3 Redundancy and Ensemble Graphical Perception
Our results showed that adding categorical colors, in which the correspondence parts could be quickly discriminated, is scalable to a large number of items. Our result agrees with that of Northelfer and Gleicher [55]. They observed that redundant encoding using color and shape could strengthen grouping when searching for targets from multiple objects. Their explanation was a race model [55]: for separable dimensions, the performance of a glyph with the redundant encoding might be dominated by the feature with greater efficiency. We did not find efficiency improvement - this suggested that the grouping is generally fast. So it might not be the redundancy itself that contributed to scene understanding.
Another possible theory is perhaps ensemble perception, i.e., “the visual system’s ability to extract summary statistical information from groups of similar objects - often in a brief glance” [40]. Also ensemble features are best represented using the categorical features. To model parallel processing, the target contrast signal theory by Buetti et al. [24] may suit our scenario better. It describes more specific time estimate it takes to evaluate items in parallel. In visualization, we just began to understand the ensemble averages (e.g., Chen [11] and Alberts et al. [56]) but have limited understanding of ensemble visual encoding choices to guide attention to optimize behaviors. We leave this to future work.
5.4 Use Our Results in Visualization Tools and Limitations of Our Work
Visualization is used when the goal is to augment human capabilities in situations where the problems might not be sufficiently defined for algorithms to communicate certain information. One of our showcase areas is quantum physics. We believe that the design principle of prompting the addition of categorical features in bivariate glyphs would be broadly applicable to glyph design. Also, application domains carrying similar data attributes could reuse of work. Our current study concerns bivariate data visualization in which the bivariate variables are component parts of scalar variables.
Our design could have been improved by following advanced tensor glyph design methods. Both generic [57] and domain-specific requirements for glyph designs [37] [58] [59] have led to the summary of glyph properties (e.g., invariant, uniqueness, continuity) to guide design and to render 2D and 3D tensors. A logic step is to truly understand the quantum physics principles to combine data attributes and human perception to improve our domain-specific solutions.
One limitation of this work is that we measure only a subset of tasks crucial to showing structures and omitted all tasks relevant to orientation. However, one may argue that the vectors naturally encode orientation. When orientation is considered, we could address the multiple-channel mappings in two ways. The first solution is to use the to encode the quantitative glyphs and color to encode the orientation clusters. The second solution is to treat magnitude and orientation as two data facets and use multiple views to display them separately, with one view showing magnitude and the other for orientation (using Munzner’s multiform design recommendations [60]). The second limitation here was that our experiments were limited to a relatively small subset of visual dimensions: color, texture, and size. A future direction would be to try shapes and glyphs to produce novel and useful design.
6 Conclusion
Our findings in general suggest that, as we hypothesized, distinguishable separable dimensions with preattentive categorical features perform better. The separable pair was the most efficient and effective for both local and global tasks. The categorical features enable effective complex scene inspections. Our empirical study results provide the following recommendations for designing 3D bivariate glyphs. .
-
•
Highly separable pairs can be used for quantitative comparisons as long as these glyphs could guide attention (i.e., category forming). We recommend using .
-
•
Texture-based glyphs () that introduces luminance variation will only be recommended when task-relevant structures can be isolated.
-
•
Integral and separable bivariate feature-pairs have the similar accuracy when the tasks are local. When the search tasks are more complex, introducing categorical features in the separable feature-pairs will lead to perceptually accurate glyphs.
-
•
3D glyph scene would shorten task completion time by combing two glyph design factors: separability and visual guidance from categorical features.
-
•
The redundant encoding () greatly improved on task completion time of integral dimensions () by adding separable and preattentive color features.
Acknowledgments
The work is supported in part by NSF IIS-1302755, NSF CNS-1531491, and NIST-70NANB13H181. The user study was funded by NSF grants with the OSU IRB approval number 2018B0080. Non-User Study design work was supported by grant from NIST-70NANB13H181. The authors would like to thank Katrina Avery for her excellent editorial support and all participants for their time and contributions.
Any opinions, findings, and conclusions or recommendations expressed in this material are those of the author(s) and do not necessarily reflect the views of the National Science Foundation. Certain commercial products are identified in this paper in order to specify the experimental procedure adequately. Such identification is not intended to imply recommendation or endorsement by the National Institute of Standards and Technology, nor is it intended to imply that the products identified are necessarily the best available for the purpose.
References
- [1] J. Fuchs, P. Isenberg, A. Bezerianos, and D. Keim, “A systematic review of experimental studies on data glyphs,” IEEE Transactions on Visualization and Computer Graphics, vol. 23, no. 7, pp. 1863–1879, 2017. [Online]. Available: http://doi.org/10.1109/TVCG.2016.2549018
- [2] C. Ware, “Quantitative texton sequences for legible bivariate maps,” IEEE Transactions on Visualization and Computer Graphics, vol. 15, no. 6, pp. 1523–1529, 2009. [Online]. Available: https://doi.org/10.1109/tvcg.2009.175
- [3] H. Zhao, G. W. Bryant, W. Griffin, J. E. Terrill, and J. Chen, “Validation of SplitVectors encoding for quantitative visualization of large-magnitude-range vector fields,” IEEE Transactions on Visualization and Computer Graphics, vol. 23, no. 6, pp. 1691–1705, 2017. [Online]. Available: https://doi.org/10.1109/tvcg.2016.2539949
- [4] D. J. Wineland, “Nobel lecture: Superposition, entanglement, and raising schrödinger’s cat,” Reviews of Modern Physics, vol. 85, no. 3, p. 1103, 2013. [Online]. Available: https://doi.org/10.1103/RevModPhys.85.1103
- [5] A. Treisman and G. Gelade, “A feature-integration theory of attention,” Cognitive Psychology, vol. 12, no. 1, pp. 97–136, 1980. [Online]. Available: http://doi.org/10.1016/0010-0285(80)90005-5
- [6] R. Borgo, J. Kehrer, D. H. Chung, E. Maguire, R. S. Laramee, H. Hauser, M. O. Ward, and M. Chen, “Glyph-based visualization: Foundations, design guidelines, techniques and applications,” Eurographics State of the Art Reports, pp. 39–63, 2013. [Online]. Available: http://diglib.eg.org/handle/10.2312/conf.EG2013.stars.039-063
- [7] J. M. Wolfe and I. S. Utochkin, “What is a preattentive feature?” Current Opinion in Psychology, vol. 29, pp. 19–26, 2019. [Online]. Available: https://doi.org/10.1016/j.copsyc.2018.11.005
- [8] J. M. Wolfe, “Guided search 6.0: An updated model of visual search,” Psychonomic Bulletin & Review, pp. 1–33, 2021. [Online]. Available: https://doi.org/10.3758/s13423-020-01859-9
- [9] D. Ariely, “Seeing sets: Representation by statistical properties,” Psychological Science, vol. 12, no. 2, pp. 157–162, 2001. [Online]. Available: https://doi.org/10.1111/1467-9280.00327
- [10] C. Ware, Information Visualization: Perception for Design, 3rd ed. Elsevier, 2012. [Online]. Available: https://www.elsevier.com/books/information-visualization/ware/978-0-12-381464-7
- [11] Z. Chen, R. Zhuang, X. Wang, Y. Ren, and R. A. Abrams, “Ensemble perception without attention depends upon attentional control settings,” Attention, Perception, & Psychophysics, vol. 83, pp. 1240–1250, 2021. [Online]. Available: https://doi.org/10.3758/s13414-020-02067-2
- [12] T. Sekimoto and I. Motoyoshi, “Ensemble perception without phenomenal awareness of elements,” Scientific Reports, vol. 12, no. 1, pp. 1–8, 2022.
- [13] J. Maule, C. Witzel, and A. Franklin, “Getting the gist of multiple hues: metric and categorical effects on ensemble perception of hue,” J. Opt. Soc. Am. A, vol. 31, no. 4, pp. A93–A102, Apr 2014. [Online]. Available: http://www.osapublishing.org/josaa/abstract.cfm?URI=josaa-31-4-A93
- [14] T. Urness, V. Interrante, I. Marusic, E. Longmire, and B. Ganapathisubramani, “Effectively visualizing multi-valued flow data using color and texture,” IEEE Visualization, pp. 115–121, 2003. [Online]. Available: https://doi.org/10.1109/visual.2003.1250362
- [15] W. R. Garner and G. L. Felfoldy, “Integrality of stimulus dimensions in various types of information processing,” Cognitive Psychology, vol. 1, no. 3, pp. 225–241, 1970. [Online]. Available: https://doi.org/10.1016/0010-0285(70)90016-2
- [16] C. G. Healey and J. T. Enns, “Large datasets at a glance: Combining textures and colors in scientific visualization,” IEEE Transactions on Visualization and Computer Graphics, vol. 5, no. 2, pp. 145–167, 1999. [Online]. Available: https://doi.org/10.1109/2945.773807
- [17] C. G. Healey, K. S. Booth, and J. T. Enns, “Visualizing real-time multivariate data using preattentive processing,” ACM Transactions on Modeling and Computer Simulation, vol. 5, no. 3, pp. 190–221, 1995. [Online]. Available: http://doi.org/10.1145/217853.217855
- [18] J. M. Wolfe and T. S. Horowitz, “What attributes guide the deployment of visual attention and how do they do it?” Nature Reviews Neuroscience, vol. 5, no. 6, pp. 1–7, 2004. [Online]. Available: http://doi.org/10.1038/nrn1411
- [19] J. Duncan and G. W. Humphreys, “Visual search and stimulus similarity.” Psychological review, vol. 96, no. 3, p. 433, 1989. [Online]. Available: https://doi.org/10.1037/0033-295x.96.3.433
- [20] H. Strobelt, D. Oelke, B. C. Kwon, T. Schreck, and H. Pfister, “Guidelines for effective usage of text highlighting techniques,” IEEE Transactions on Visualization and Computer Graphics, vol. 22, no. 1, pp. 489–498, 2016. [Online]. Available: https://doi.org/10.1109/TVCG.2015.2467759
- [21] C. G. Healey, K. S. Booth, and J. T. Enns, “High-speed visual estimation using preattentive processing,” ACM Transactions on Computer-Human Interaction, vol. 3, no. 2, pp. 107–135, 1996. [Online]. Available: http://doi.org/10.1145/230562.230563
- [22] T. Ropinski, S. Oeltze, and B. Preim, “Survey of glyph-based visualization techniques for spatial multivariate medical data,” Computers & Graphics, vol. 35, no. 2, pp. 392–401, 2011. [Online]. Available: https://doi.org/10.1016/j.cag.2011.01.011
- [23] A. Treisman and S. Gormican, “Feature analysis in early vision: evidence from search asymmetries,” Psychological Review, vol. 95, no. 1, pp. 15–48, 1988. [Online]. Available: https://doi.org/10.1037/0033-295X.95.1.15
- [24] S. Buetti, J. Xu, and A. Lleras, “Predicting how color and shape combine in the human visual system to direct attention,” Scientific Reports, vol. 9, no. 1, pp. 1–11, 2019. [Online]. Available: https://doi.org/10.1038/s41598-019-56238-9
- [25] C. G. Healey and J. T. Enns, “Attention and visual memory in visualization and computer graphics,” IEEE Transactions on Visualization and Computer Graphics, vol. 18, no. 7, pp. 1170–1188, 2012. [Online]. Available: https://doi.org/10.1109/tvcg.2011.127
- [26] T. C. Callaghan, “Interference and dominance in texture segregation: Hue, geometric form, and line orientation,” Perception, & Psychophysics, vol. 46, no. 4, pp. 299–311, 1989. [Online]. Available: https://doi.org/10.3758/bf03204984
- [27] J. Fuchs, P. Isenberg, A. Bezerianos, and D. Keim, “A systematic review of experimental studies on data glyphs,” IEEE Transactions on Visualization and Computer Graphics, vol. 23, no. 7, pp. 1863–1879, 2017. [Online]. Available: https://doi.org/10.1109/tvcg.2016.2549018
- [28] L. McNabb and R. S. Laramee, “Survey of surveys (SoS)-mapping the landscape of survey papers in information visualization,” Computer Graphics Forum, vol. 36, no. 3, pp. 589–617, 2017. [Online]. Available: https://doi.org/10.1111/cgf.13212
- [29] J. Mackinlay, “Automating the design of graphical presentations of relational information,” ACM Transactions on Graphics, vol. 5, no. 2, pp. 110–141, 1986. [Online]. Available: https://doi.org/10.1145/22949.22950
- [30] W. S. Cleveland and R. McGill, “Graphical perception: Theory, experimentation, and application to the development of graphical methods,” Journal of the American Statistical Association, vol. 79, no. 387, pp. 531–554, 1984. [Online]. Available: https://doi.org/10.2307/2288400
- [31] S. M. Casner, “Task-analytic approach to the automated design of graphic presentations,” ACM Transactions on Graphics, vol. 10, no. 2, pp. 111–151, 1991. [Online]. Available: https://doi.org/10.1145/108360.108361
- [32] C. M. McColeman, F. Yang, T. F. Brady, and S. Franconeri, “Rethinking the ranks of visual channels,” IEEE Transactions on Visualization and Computer Graphics, 2021.
- [33] Ç. Demiralp, M. S. Bernstein, and J. Heer, “Learning perceptual kernels for visualization design,” IEEE Transactions on Visualization and Computer Graphics, vol. 20, no. 12, pp. 1933–1942, 2014. [Online]. Available: https://doi.org/10.1109/tvcg.2014.2346978
- [34] B. E. Rogowitz and A. D. Kalvin, “The ”Which Blair Project”: A quick visual method for evaluating perceptual color maps,” IEEE Visualization, pp. 183–191, 2001. [Online]. Available: https://doi.org/10.1109/visual.2001.964510
- [35] J. P. O’Shea, M. Agrawala, and M. S. Banks, “The influence of shape cues on the perception of lighting direction,” Journal of Vision, vol. 10, no. 12, pp. 1–21, 2010. [Online]. Available: https://doi.org/10.1167/10.12.21
- [36] M. Harrower and C. A. Brewer, “Colorbrewer.org: An online tool for selecting colour schemes for maps,” The Cartographic Journal, vol. 40, no. 1, pp. 27–37, 2003. [Online]. Available: https://doi.org/10.1002/9780470979587.ch34
- [37] C. Zhang, T. Schultz, K. Lawonn, E. Eisemann, and A. Vilanova, “Glyph-based comparative visualization for diffusion tensor fields,” IEEE Transactions on Visualization and Computer Graphics, vol. 22, no. 1, pp. 797–806, 2016. [Online]. Available: https://doi.org/10.1109/TVCG.2015.2467435
- [38] J. Bertin, Semiology of Graphics: Diagrams, Networks, Maps. University of Wisconsin Press, 1967.
- [39] J. Cohen, Statistical power analysis for the behavioral sciences. New York: Academic Press, 1988. [Online]. Available: https://doi.org/10.4324/9780203771587
- [40] D. Whitney and A. Yamanashi Leib, “Ensemble perception,” Annual review of psychology, vol. 69, pp. 105–129, 2018. [Online]. Available: https://doi.org/10.1146/annurev-psych-010416-044232
- [41] D. Acevedo, J. Chen, and D. H. Laidlaw, “Modeling perceptual dominance among visual cues in multilayered icon-based scientific visualizations,” IEEE Visualization Posters, 2007. [Online]. Available: https://vis.cs.brown.edu/docs/pdf/Acevedo-2007-MPD.pdf
- [42] D. H. Chung, D. Archambault, R. Borgo, D. J. Edwards, R. S. Laramee, and M. Chen, “How ordered is it? on the perceptual orderability of visual channels,” Computer Graphics Forum, vol. 35, no. 3, pp. 131–140, 2016. [Online]. Available: https://doi.org/10.1111/cgf.12889
- [43] A. Lleras, Z. Wang, G. J. P. Ng, K. Ballew, J. Xu, and S. Buetti, “A target contrast signal theory of parallel processing in goal-directed search,” Attention, Perception, & Psychophysics, vol. 82, no. 2, pp. 394–425, 2020. [Online]. Available: https://doi.org/10.3758/s13414-019-01928-9
- [44] A. Forsberg, J. Chen, and D. H. Laidlaw, “Comparing 3D vector field visualization methods: A user study,” IEEE Transactions on Visualization and Computer Graphics, vol. 15, no. 6, pp. 1219–1226, 2009. [Online]. Available: https://doi.org/10.1109/TVCG.2009.126
- [45] M. P. Eckstein, K. Koehler, L. E. Welbourne, and E. Akbas, “Humans, but not deep neural networks, often miss giant targets in scenes,” Current Biology, vol. 27, 2017. [Online]. Available: https://doi.org/10.1016/j.cub.2017.07.068
- [46] A. E. Lie, J. Kehrer, and H. Hauser, “Critical design and realization aspects of glyph-based 3D data visualization,” Proceedings of the Spring Conference on Computer Graphics, pp. 19–26, 2009. [Online]. Available: https://doi.org/10.1145/1980462.1980470
- [47] I. Biederman, “On processing information from a glance at a scene,” ACM SIGGRAPH Workshop on User-oriented Design of Interactive Graphics Systems, 1977. [Online]. Available: https://doi.org/10.1145/1024273.1024283
- [48] A. Oliva, “Gist of the scene,” Neurobiology of Attention, vol. 696, no. 64, pp. 251–258, 2005. [Online]. Available: https://doi.org/10.1016/B978-012375731-9/50045-8
- [49] G. Ryan, A. Mosca, R. Chang, and E. Wu, “At a glance: Pixel approximate entropy as a measure of line chart complexity,” IEEE Transactions on Visualization and Computer Graphics, vol. 25, no. 1, pp. 872–881, 2019. [Online]. Available: https://doi.org/10.1109/TVCG.2018.2865264
- [50] Z. Bylinskii, P. Isola, C. Bainbridge, A. Torralba, and A. Oliva, “Intrinsic and extrinsic effects on image memorability,” Vision Research, vol. 116, pp. 165–178, 2015. [Online]. Available: https://doi.org/10.1016/j.visres.2015.03.005
- [51] M. A. Borkin, A. A. Vo, Z. Bylinskii, P. Isola, S. Sunkavalli, A. Oliva, and H. Pfister, “What makes a visualization memorable?” IEEE Transactions on Visualization and Computer Graphics, vol. 19, no. 12, pp. 2306–2315, 2013. [Online]. Available: https://doi.org/10.1109/tvcg.2013.234
- [52] R. Li and J. Chen, “Toward a deep understanding of what makes a scientific visualization memorable,” IEEE VIS and arXiv preprint, 2018. [Online]. Available: https://arxiv.org/abs/1808.00607
- [53] H. L. Kundel, C. F. Nodine, E. F. Conant, and S. P. Weinstein, “Holistic component of image perception in mammogram interpretation: gaze-tracking study,” Radiology, vol. 242, no. 2, pp. 396–402, 2007. [Online]. Available: https://doi.org/10.1148/radiol.2422051997
- [54] T. Drew, M. L.-H. Võ, and J. M. Wolfe, “The invisible gorilla strikes again: Sustained inattentional blindness in expert observers,” Psychological Science, vol. 24, no. 9, pp. 1848–1853, 2013. [Online]. Available: https://doi.org/10.1177/0956797613479386
- [55] C. Nothelfer, M. Gleicher, and S. Franconeri, “Redundant encoding strengthens segmentation and grouping in visual displays of data,” Journal of Experimental Psychology: Human Perception and Performance, vol. 43, no. 9, p. 1667, 2017. [Online]. Available: https://doi.org/10.1037/xhp0000314
- [56] D. Albers, M. Correll, and M. Gleicher, “Task-driven evaluation of aggregation in time series visualization,” in Proceedings of the SIGCHI Conference on Human Factors in Computing Systems, 2014, pp. 551–560. [Online]. Available: https://doi.org/10.1145/2556288.2557200
- [57] T. Gerrits, C. Rössl, and H. Theisel, “Glyphs for general second-order 2D and 3D tensors,” IEEE Transactions on Visualization and Computer Graphics, vol. 23, no. 1, pp. 980–989, 2017. [Online]. Available: https://doi.org/10.1109/TVCG.2016.2598998
- [58] H.-J. Schulz, T. Nocke, M. Heitzler, and H. Schumann, “A design space of visualization tasks,” IEEE Transactions on Visualization and Computer Graphics, vol. 19, no. 12, pp. 2366–2375, 2013. [Online]. Available: http://doi.org/10.1109/TVCG.2013.120
- [59] G. Kindlmann and C.-F. Westin, “Diffusion tensor visualization with glyph packing,” IEEE Transactions on Visualization and Computer Graphics, vol. 12, no. 5, pp. 1329–1336, 2006. [Online]. Available: https://doi.org/10.1109/tvcg.2006.134
- [60] T. Munzner, Visualization Analysis and Design. A K Peters Visualization Series. CRC Press, 2014. [Online]. Available: https://doi.org/10.1201/b17511
![[Uncaptioned image]](/html/2301.00002/assets/photos/Henan.jpg) |
Henan Zhao was a PhD student in Department of Computer Science and Electrical Engineering at University of Maryland, Baltimore County. She received B.E. degree in Computer Science and Information Security from Nankai University, China. Her research interests include design and evaluation of perceptually accurate visualization techniques. This work was conducted while she was visiting The Ohio State University. |
![[Uncaptioned image]](/html/2301.00002/assets/photos/Garnett.png) |
Garnett Bryant received his PhD at Indiana University in theoretical condensed matter physics. After research positions at Washington State University, the National Bureau of Standards, McDonnell Research Labs and the Army Research Laboratory, he has worked at the National Institute of Standards and Technology (NIST) since 1994. He is directing the Quantum Processes and Metrology Group at NIST with experimental and theoretical programs on nanoscale, condensed matter systems for quantum information science and metrology. He is a Fellow of the Joint Quantum Institute of NIST/University of Maryland, a Fellow of the American Physical Society and a member of the IEEE. His theoretical research program focuses on nanosystems, nanooptics and quantum science. |
![[Uncaptioned image]](/html/2301.00002/assets/photos/griffin.png) |
Wesley Griffin received his PhD degree in Computer Science from the University of Maryland, Baltimore County. He is a developer at Stellar Science. His research interests include real-time graphics and graphics hardware. He is a member of ACM SIGGRAPH, the IEEE and the IEEE Computer Society. |
![[Uncaptioned image]](/html/2301.00002/assets/photos/judyc2.png) |
Judith E. Terrill is a Computer Scientist and the Leader of the High Performance Computing and Visualization Group at the National Institute of Standards and Technology. She is a member of the IEEE Computer Society, the Association for Computing Machinery, and the Association for the Advancement of Artificial Intelligence. |
![[Uncaptioned image]](/html/2301.00002/assets/photos/JianChen.jpeg) |
Jian Chen is an Associate Professor in Computer Science and Engineering at The Ohio State University. She received her PhD degree in Computer Science from Virginia Tech, and her MS degree in Mechanical Engineering Precision Instrument from Tianjin University Tsinghua University, China. She was a postdoctoral fellow at Brown University and a visiting researcher at Harvard University. Her current research interests include visual design, 3D interaction, and human-AI teaming. |
Additional Material
A. Background Color
B. Visual Mapping for Color and Texture in the and Pairs
Fig. 6 shows the visual mapping using color and texture in Experiment II. The horizontal axis represents the exponent range . We selected those categorical colors from ColorBrewer [36]. For texture, the percentage of black is mapped to the exponent-range. Examples with three different exponent-ranges of 3, 5, and 7 are shown in Fig. 13, in which color and texture are used for the visual mapping of study data.
C. Visual Features and Exponent-Range
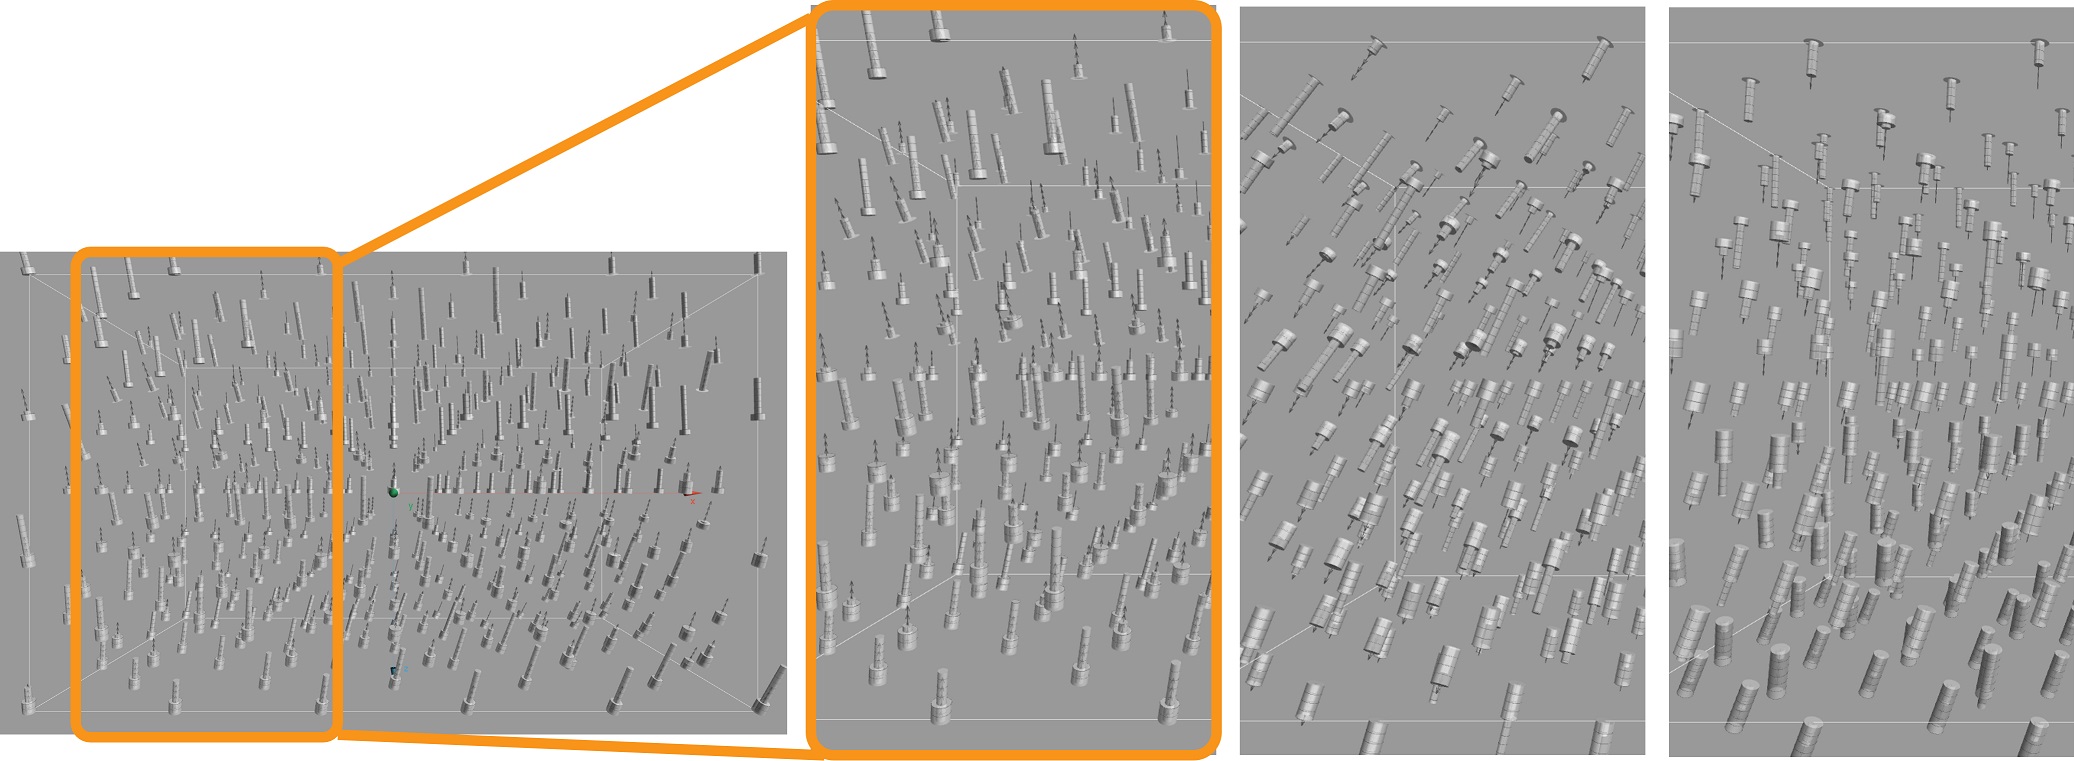
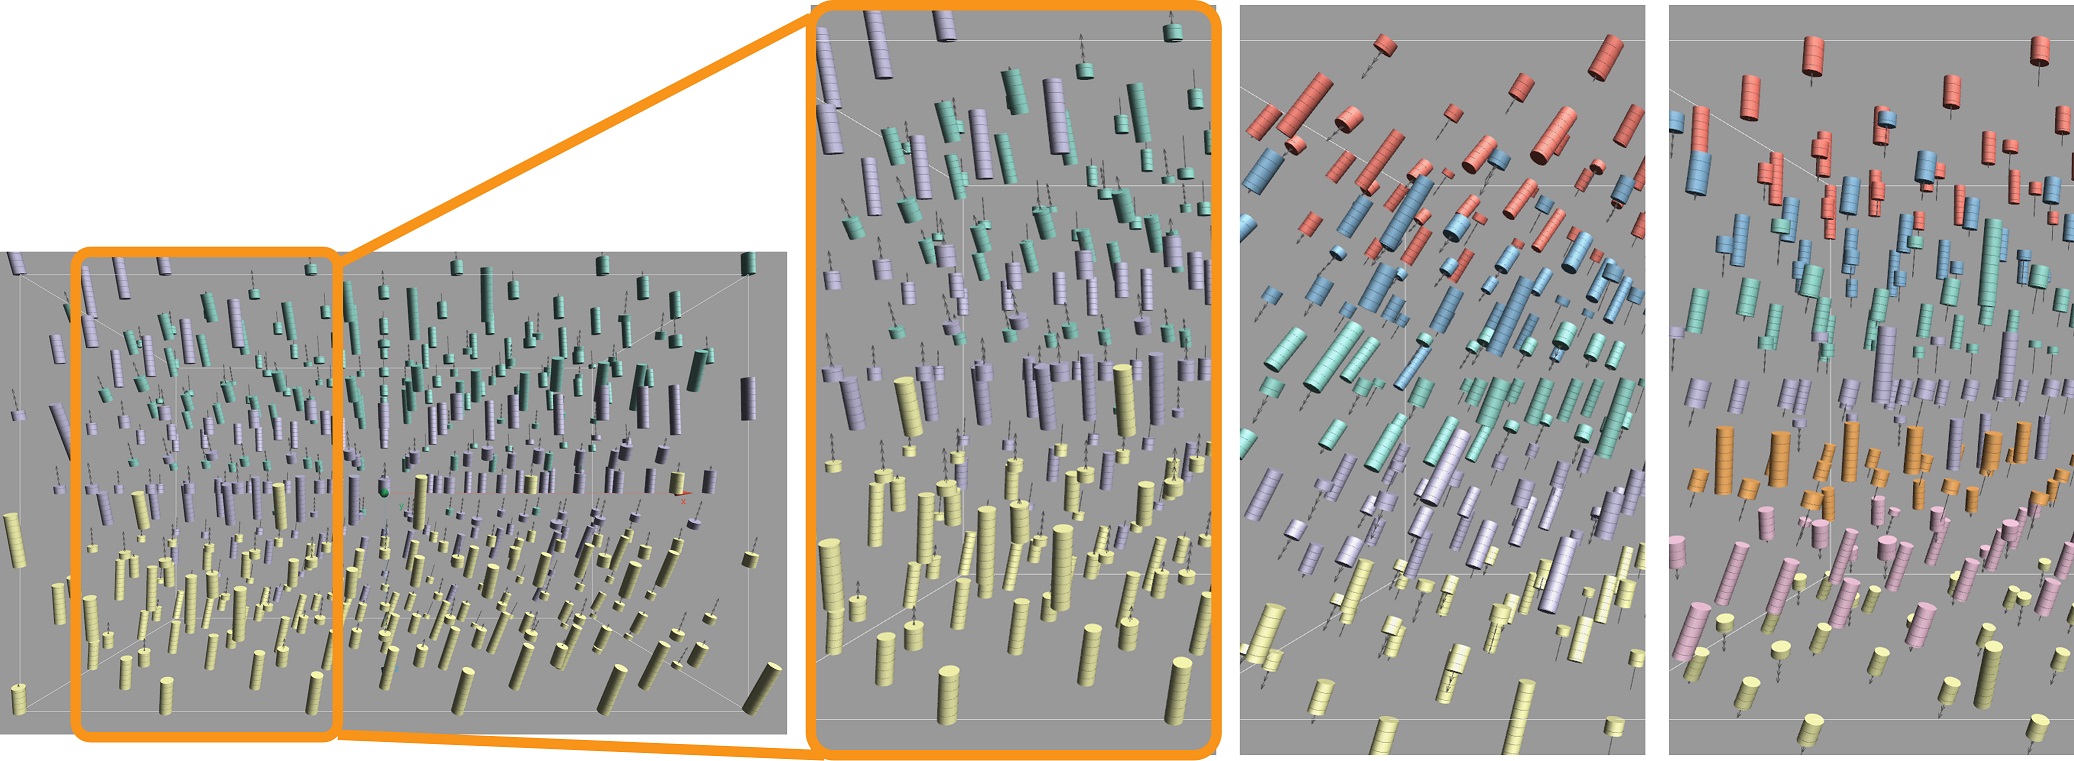
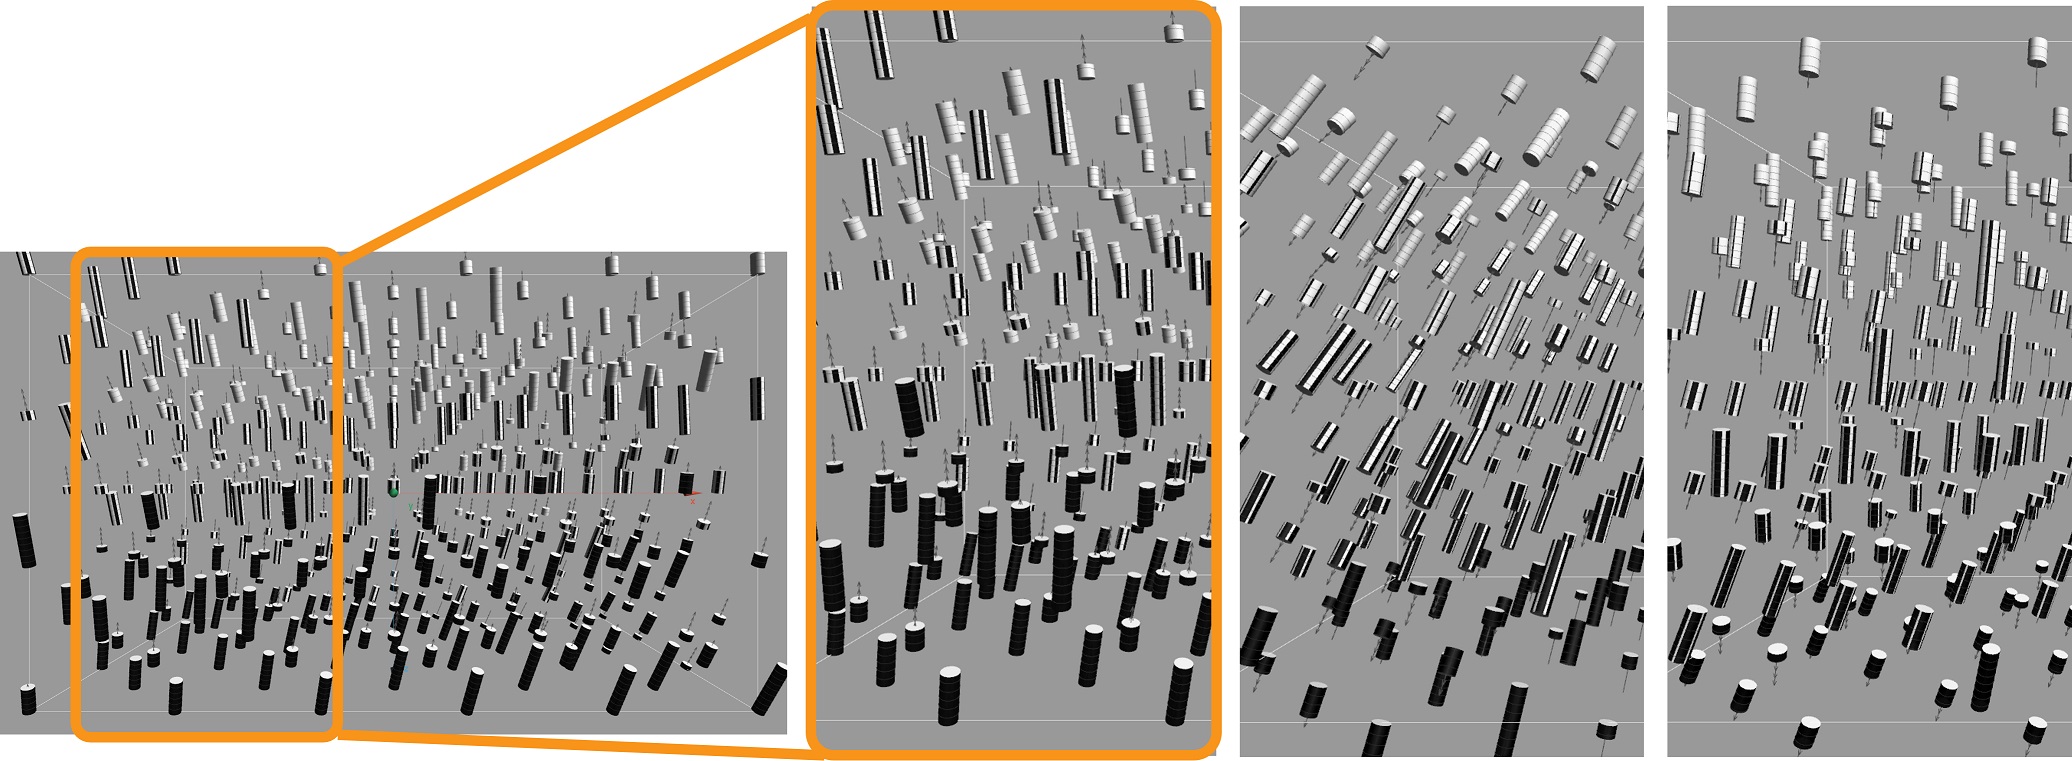
Fig. 13 shows examples for visual features and three exponent-ranges of , , and . The figures with the same exponent-range were generated using the same data and different visual features. The dataset used in this figure is for illustration purpose only and does not necessarily reflect all image features used in the vector magnitude experiments.
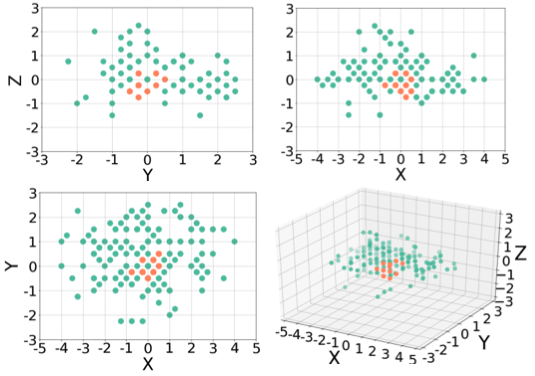
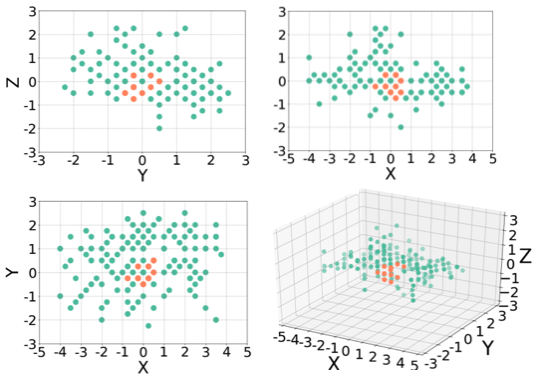
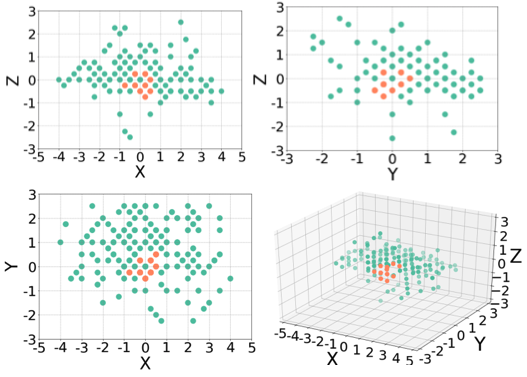
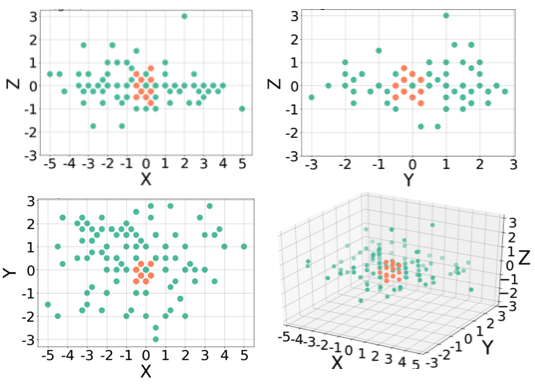
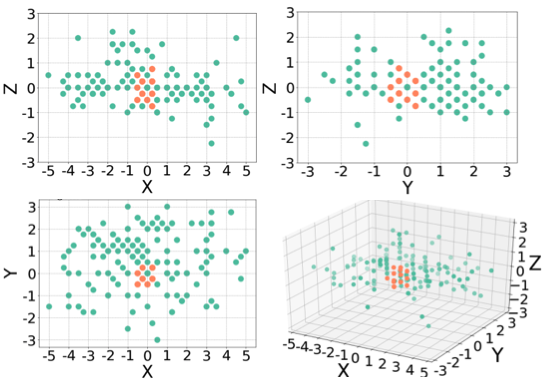
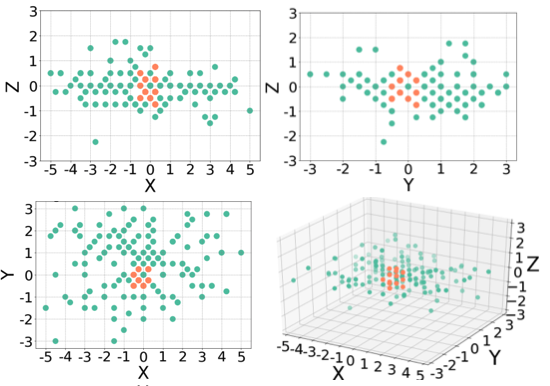
D. Spatial Proximity
Figures 14 and 15 show spatial distributions of the identified targets (participants’ answers) to the correct targets in the search and max tasks in Experiment II. Here locations of the correct targets are translated to the origin (0, 0, 0). Participants’ answers are depicted in green and each dot represents a trial. Dots may overlap. Dots in orange illustrate some of the nearest spins whose exponent values differ from the target (located at the origin). Comparing the distribution of participants’ answers and the orange dot locations illustrates one of the key quantum physics data attributes: quantum physics data are discrete; and spatial proximity is not correlated with the spin magnitude proximity. For complex data like this, using the structural features (e.g., from color) in search will help them be more efficient and reduce errors.