Cluster-level Group Representativity Fairness in -means Clustering
Abstract
There has been much interest recently in developing fair clustering algorithms that seek to do justice to the representation of groups defined along sensitive attributes such as race and gender. We observe that clustering algorithms could generate clusters such that different groups are disadvantaged within different clusters. We develop a clustering algorithm, building upon the centroid clustering paradigm pioneered by classical algorithms such as -means, where we focus on mitigating the unfairness experienced by the most-disadvantaged group within each cluster. Our method uses an iterative optimisation paradigm whereby an initial cluster assignment is modified by reassigning objects to clusters such that the worst-off sensitive group within each cluster is benefitted. We demonstrate the effectiveness of our method through extensive empirical evaluations over a novel evaluation metric on real-world datasets. Specifically, we show that our method is effective in enhancing cluster-level group representativity fairness significantly at low impact on cluster coherence.
Keywords
algorithmic fairness, unsupervised machine learning, clustering, representativity
1 Introduction
Fairness in ML [13] has seen much scholarly activity in recent times. Within the broader umbrella of fair ML, several fair clustering methods have also been developed [11]. Most of these endeavours, starting from a pioneering work by Chierichetti et al [12], have considered ensuring proportional representation of sensitive groups – such as those defined on race and gender – within each cluster in the output; this is often referred to as group fairness [16]. Recent formulations of fair clustering are able to incorporate considerations to fairness along multiple sensitive attributes together [2]. Such representational fairness of sensitive groups may be seen as the application of the notion of proportional representation, aka statistical parity [7], within clustering.
It may be argued that simply ensuring representation of sensitive groups within each cluster is insufficient, especially within the popular paradigm of centroid clustering, pioneered by the -means clustering algorithm [24]. In centroid clustering, each cluster is represented by a prototype, often informally referred to as the centroid. A data object’s proximity to its cluster centroid is a key criterion determining the quality of the clustering. For example, an object that happens to be very close to its centroid could be thought of as being ‘better represented’ within the clustering than another that happens to be much further away from its centroid. Recent work on fair clustering has sought to deepen uniformity of distance-to-centroid, dubbed as representativity fairness [26], across all dataset objects. Representativity fairness seeks to ensure deeper levels of uniformity of representativity (i.e., centroid distance) across objects, regardless of their sensitive attribute membership, and may thus be regarded as an instantiation of individual fairness [16]. The notion of representativity has been extended to the framework of sensitive groups independently by Abbasi et al [1] and Ghadiri et al [19]. While the methodologies they propose are different, they are strikingly similar in the nature of the fairness sought. They consider the aggregate representativity (they use the term representation) across objects within each sensitive group, and target proportionality along such group-specific aggregates across sensitive groups. For example, within a social media profile clustering scenario, this implies that the mean distance of female profiles from their centroids should be as close as possible to the mean distance of male profiles from their centroids. This fairness condition targets that groups are fairly treated across all the clusters in the output cluster assignment.
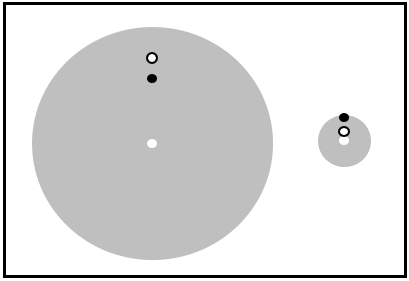
Against this backdrop, we note two issues with such representativity aggregations across sensitive groups and clusters. First, note that representativity is quantified as the distance of an object to its cluster centroid111Representativity, in a literal sense, may be argued to mean centroid proximity than centroid distance; however, since it is easier to deal with distances, we consistently refer minimisation of centroid distance as representativity enhancement, which is essentially maximising centroid proximity.. This construction of representativity, we observe, does not yield well to cross-cluster comparisons, especially when there could be clusters with widely varying sizes. Consider the toy 2-cluster clustering in Figure 1 where the black and circled white objects represent different sensitive groups, with the white object representing the centroid; also assume that the grey area is full of other objects which we do not consider for now. The black object has better representativity (i.e., better centroid proximity) in the larger cluster, and vice versa. However, given the size of the clusters, the same numeric difference in representativity should be regarded as almost insignificant in the larger cluster, and very consequential in the smaller cluster, when conditioned on the relative cluster sizes. In other words, considering representativity against the backdrop of the cluster sizes, we may assume that the circled white group gets a much better overall representativity than the black group. In sharp contrast to such intuitive judgement, observe that the simple aggregate of representativity misleadingly puts the black and circled white groups on an equal footing. Second, note that the fairness goal seeks to bring about parity across sensitive groups. For a clustering task, as in the case of earlier work on statistical parity for group fairness (e.g., Chierichetti et al [12], Abraham et al [2]), the natural granularity for evaluating clustering fairness is at the level of each cluster. The cross-cluster aggregation of representativities is neither aligned with pragmatism (e.g., decision scenarios almost always involve cluster-level decision-making [25]) or underpinning political justifications (e.g., in contrast to extant justifications of statistical parity [20]). We additionally note that the same sensitive group may be advantaged in one cluster and disadvantaged in another. The paradigm of cross-cluster aggregation of representativities allows such effects to cancel out, thus acting as a veneer to conceal potentially deep levels of intra-cluster unfairness.
1.1 Our Contributions
We propose a novel formulation of group fairness extending the notion of representativity fairness along sensitive groupings in the data. Our cluster-level group representativity fairness targets cluster-level fairness, thus mitigating identified cross-cluster representativity aggregation issues. We propose a novel fair clustering method targeting to optimise for cluster-level group representativity fairness, and illustrate, through extensive empirical evaluations, that our method is able to achieve high degrees of fairness on appropriate evaluation metrics.
2 Related Work
We now briefly summarise research on group fairness and individual fairness in fair clustering.
2.1 Group Fairness
The notion of group fairness, which targets proportional representation of sensitive attribute groups, was pioneered by Chierichetti et al [12] in 2017. Since then, group fair clustering research has diversified into considering settings such as spectral clustering [22], hierarchical clustering [4] and probabilistic scenarios [17]. Along another facet, variants of group fairness notions such as capped representation [3] and equitable group-level representativity [1, 19] have been explored. There have also been fairness conceptualisations such as proportional fairness [10] that straddle boundaries between group and individual fairness.
2.2 Individual Fairness
At a risk of overgeneralisation, one may paraphrase individual fairness as ensuring that similar objects be given similar outcomes (i.e., cluster membership in clustering). While this is inarguably aligned with the clustering objective of maximising intra-cluster similarities and minimising inter-cluster similarities, clustering algorithms can only achieve the objective on a best-effort basis, making some shortfall inevitable. Specific formulations of individually fair clustering methods have explored curtailing the shortfall through ways such as using randomness [8]. P & Abraham [26] considers optimising for the uniformity of centroid-proximity (aka representativity) across objects. The focus on representativity continues in much recent work, with Vakilian & Yalciner [27] considering an object-specific upper bound for representativity and Chakrabarti et al [9] proposing that representativities between pairs of objects be bounded above by a specified multiplication factor.
2.3 Positioning Our Work
Our notion of cluster-level group representativity fairness is a novel conceptualisation of fairness unexplored in previous work. Our usage of cluster-level group fairness quantification as an intermediate level between individual and group makes it distinct from previous work on both fairness streams.
3 Background
We briefly outline the formulation of the popular -means clustering algorithm [24], as essential background to describe our method. Consider a set of relational data objects where , which need to be partitioned into clusters, . -means uses an EM-style [14] optimisation framework to optimise for:
| (3.1) |
where is the centroid or prototype object of cluster . The reader would notice that the objective relates to a given cluster assignment ; the EM-style optimisation starts with a given cluster assignment, and iteratively refines the cluster assignment and centroids in order to minimise the objective in Equation 3.1.
As a generic clustering method, -means is obviously agnostic to sensitive attribute groups to which individual objects belong. Using the terminology of representativity (i.e., centroid proximity), one may observe that -means seeks to optimise for the sum of representativities across all objects in the dataset. This may be regarded as a Benthamite [5] utilitarian objective that seeks the greatest good for the greatest number. Abbasi et al [1] and Ghadiri et al [19] note that this can result in cluster centroids representing sensitive groups differently, often favouring one over the other. This would have implications especially in cases where the centroids are used to summarise objects in the clusters. To mitigate the disparity in representativities of sensitive groups, Abbasi et al [1] and Ghadiri et al [19] independently proposed a new fair -means objective. Suppose each data object in belongs to one of several groups (e.g., female, male, etc.) defined across a sensitive attribute (e.g., sex). The fair -means objective [1, 19] seeks to optimise for the worst-off sensitive group at the cluster assignment level:
| (3.2) |
The objective in Equation 3.2 suffers from a variant of the issue observed in the -means objective – the averaging property can allow a sensitive group to have a low representativity in one cluster which is discounted by moderately high representativities in the other clusters. Further, a single sensitive group may not be the worst-off in all clusters. Towards this, we turn our attention to mitigating group unfairness at the cluster level, rather than the cluster assignment level.
4 Problem Statement
Our notion of cluster-level group representativity fairness targets to minimise the disparity in the representativities of the sensitive groups within each cluster. We assume a single sensitive attribute . Consider a cluster within a cluster assignment . The representativity loss of the set of objects taking within is denoted as:
| (4.3) |
Thus for each cluster , we obtain a representativity vector with one component per sensitive group. We say that a cluster assignment is fair if all clusters in it are fair, and we say that a cluster is fair if its corresponding representativity vector is uniform, i.e., the gap between the best-off and worst-off groups is as small as possible.
In view of this novel formulation of cluster-level group representativity fairness, we consider developing a metric towards quantifying adherence to the notion. In this paper, we look at the case where the number of sensitive groups is not large. Accordingly, we capture the representativity disparity between the best-off and worst-off groups simply by taking the difference in their representativities, given by:
| (4.4) |
, or cluster disparity, quantifies the difference between the representativity losses for the best-off and worst-off groups within cluster , expressed as a percentage. Evidently, we would ideally like to be which is achieved when the same representativity loss is experienced by each sensitive group. The formulation of as a percentage allows a fair basis for aggregating this across clusters of different sizes and shapes, thus addressing the first issue with representativity aggregation pointed out in Section 1 – that of cluster sizes. We aggregate this across clusters in the cluster assignment to arrive at a single measure for the overall cluster assignment:
| (4.5) |
The average cluster disparity abbreviated as , being an average of percentages, evaluates to a non-negative value, with a lower value indicating a smaller disparity between the worst-off group and best-off group in individual clusters, and consequently a fairer clustering.
5 Proposed Method
We now describe our fair clustering method focused on cluster-level group representativity fairness. We start by describing our objective function followed by the optimisation framework.
5.1 Objective Function
The notion of fairness outlined in Section 4 targets to enhance the uniformity of the representativity vector for each cluster. This can be trivially achieved by having a high representativity loss for all sensitive groups (as noted by Abbasi et al [1]) which would make the resulting cluster assignment of poor utility. Towards improving uniformity of the representativities, we take cue from contemporary theories in political philosophy and focus on mitigating the representativity loss (i.e., ) experienced by the worst-off group within each cluster. The worst-off group in a cluster is given by:
| (5.6) |
This notion espouses the ethos across several popular philosophical theories including the concern for the most vulnerable within the famed difference principle [18] of distributive justice due to John Rawls222https://en.wikipedia.org/wiki/John_Rawls.
Thus, the overall clustering objective we address here is to generate a cluster assignment that comprises coherent clusters (the singular focus of algorithms such as -means) where, additionally, the representativity loss for the worst-off group within each cluster is mitigated as much as possible. Given that the utilitarian consideration of cluster coherence (one that classical -means also targets to optimise) would be in apparent tension with the cluster-level group representativity fairness consideration, we look to deepen the latter at as little detriment to the former as possible.
Given our intent of mitigating the representativity loss of the worst-off sensitive group within each cluster, we model our objective function as simply the aggregate of representativity losses of the worst-off cluster-level group:
| (5.7) |
This, as may be noted, captures the fairness ethos espoused by our formulation of cluster-level group representativity fairness, albeit using significantly different methodology.
5.2 Optimisation Framework
To estimate the parameters – and – in our objective function (Equation 5.7), we follow the same EM-style iterative procedure as used in the classical -means algorithm that alternates between the following E and M steps:
-
1.
E-step: estimate the cluster assignment for each keeping the set of cluster centroids fixed, and
-
2.
M-step: estimate the set of cluster centroids keeping the cluster assignment stationary.
The method we propose falls in the category of post-processing methods which is in line with classical works in fair clustering such as Ahmadian et al [3], Bera et al [6], Esmaeili et al [17], Kleindessner et al [21], among others. It operates over the output of a utilitarian clustering algorithm – the classical -means algorithm; we use the generated cluster centroids as the initial cluster centroids for our method. We now describe the details of the E and M steps within our optimisation framework.
5.3 E-step: Estimating the Cluster Assignment
Given the set of cluster centroids , we need to assign objects to clusters that minimise the objective function in Equation 5.7. Towards operationalising this, given the complexity of the objective function, we perturb the existing cluster assignment by greedily reassigning objects – in round-robin fashion – to new clusters such that the value of the objective function decreases. Thus, if an object is reassigned from cluster to cluster , the new cluster assignment is given by:
| (5.8) |
Algorithm 1 outlines our greedy approach. Within each E-step, this entails trying out cluster reassignments, per object. It is notable that the change between and where and differ in the membership of a single object can be computed very efficiently without a full dataset-wide estimation. While we do not include the details of such efficient computations herein, the computation of such incremental changes is similar in spirit to what is outlined within Section 4.2.1 in Abraham et al [2].
5.4 M-step: Estimating the Cluster Centroids
We now look at estimating the set of cluster centroids given the cluster assignment . Our goal is to minimise the objective function in Equation 5.7 while keeping the cluster assignment fixed. Since the operator is not differentiable, we use the following differentiable approximation [26]:
| (5.9) |
where is a large enough positive constant that amplifies the significance of the largest distance. Substituting Equation 5.9 in Equation 5.7 gives us a differentiable approximation for the objective function:
| (5.10) |
We model our optimisation steps along the framework of gradient descent where the intent is to move along the negative gradient. Towards this, we note that the derivative of with respect to evaluates to:
| (5.11) |
where
| (5.12) |
Much like in the E-step, regularities in the construction of Equation 5.11 allow for efficient incremental gradient computation. Equations 5.11 and 5.12 are together used to update the set of cluster centroids within the gradient descent framework:
| (5.13) |
where is the learning rate. The M-step is outlined in Algorithm 2. To summarise, within each M-step, each cluster centroids, chosen in round-robin fashion, is updated once using the update in Equation 5.13.
5.5 Stopping Condition
Being initialised using a utilitarian clustering such as one that optimises for the -means objective, each iteration progressively moves the cluster assignment away from the utilitarian starting point towards cluster-level group representativity fairness. This monotonicity makes the choice of the stopping condition critical to ensure that a good trade-off between the utilitarianism and fairness is achieved within the eventual cluster assignment. In other words, the stopping condition for our iterative procedure is determined by the trade-off between two factors:
-
1.
the deterioration in utility, i.e., the classical -means objective, given that our method starts from the cluster assignment generated by the classical -means algorithm, and
-
2.
the improvement in our objective function towards group fairness.
It may be noted that both the terms above may be computed intrinsically, i.e., without using any form of external input, and are thus available to the optimisation approach. This allows us to formulate a contrastive stopping condition that can choose good trade-off points in the optimisation. At any iteration, we consider the overall percentage improvement in our fairness objective over the past ten iterations, and the overall percentage deterioration in the -means objective across the past ten iterations, and break out of the iterative loop when the latter exceeds the former. This is complemented by another stopping condition where we break the iterative process after 200 iterations, if the contrastive stopping condition was not reached earlier.
6 Empirical Evaluation
We now detail our empirical evaluation. We start by describing the experimental setup, followed by results and analyses. All underlying research data and code will be made publicly available upon acceptance.
6.1 Experimental Setup
6.1.1 Datasets
The datasets used in our empirical evaluation are based on the publicly available Adult dataset333https://archive.ics.uci.edu/ml/datasets/adult and CreditCard dataset444https://archive.ics.uci.edu/ml/datasets/default+of+credit+card+clients from the UCI repository [15]. Both datasets contain data about humans and include sensitive information such as race and sex, making them exceedingly popular in the algorithmic fairness community [11, 23]. In case of the Adult dataset, we use workclass, education-num, occupation, capital-gain, capital-loss, hours-per-week as non-sensitive attributes. We do not use fnlwgt (refer to Le Quy et al [23]) and education (which is the same as education-num). The two sensitive attributes we consider are sex and race. In case of the CreditCard dataset, we use LIMIT_BAL, PAY_x (6 attributes), BILL_AMTx (6 attributes), PAY_AMTx (6 attributes) as the non-sensitive attributes. The sensitive attribute we consider is SEX. The two datasets are processed as follows. Among the non-sensitive attributes, the continuous ones are standardised (i.e., zero mean and unit variance) on the same lines as Ghadiri et al [19], and the categorical ones are one hot encoded. Table 1 contains information about the processed versions of the datasets used in our evaluation.
| dataset | sensitive attribute | non-sensitive attributes | objects | |
|---|---|---|---|---|
| name | groups | |||
| Adult | sex | 2 | 26 | 30718 |
| race | 5 | |||
| CreditCard | SEX | 2 | 77 | 30000 |
6.1.2 Baselines
We benchmark our method against the classical -means algorithm, which also forms our initialisation. Ours being a novel fairness formulation that has been hitherto unexplored in literature, there are no suitable state-of-the-art baseline clustering methods to compare against. Abbasi et al [1] and Ghadiri et al [19], being based on group representativity fairness, are related but are optimised for a different fairness objective; we compare our method against Ghadiri et al’s Fair-Lloyd [19]. Since the available implementation of Fair-Lloyd555https://github.com/samirasamadi/SociallyFairKMeans can only handle binary sensitive attributes, we do not evaluate it on the Adult dataset with race as the sensitive attribute. We do not compare with Abbasi et al [1] because it is more suited for the facility location problem rather than the -means clustering problem.
6.1.3 Parameter Configuration
In all experiments, we set the number of clusters to be generated =5. We run Fair-Lloyd using its default settings. In case of our method, we set =3, and learning rate =0.01 for gradient descent. All numbers reported are averaged over 100 runs with random initial centroids provided to the classical -means algorithm (whose generated centroids are subsequently used as the initial centroids of our method). The numbers reported for Fair-Lloyd are also averaged over 100 runs. Following Ghadiri et al [19]’s setup, we allow Fair-Lloyd and our method to run for 200 iterations for the purpose of our empirical evaluation.
6.2 Results
6.2.1 Fairness vs Utility
| dataset | sensitive attribute | method | average cluster disparity | % change |
|---|---|---|---|---|
| Adult | sex | classical -means | 24.6498 | 0.00% |
| Fair-Lloyd | 25.0157 | +1.48% | ||
| ours | 9.4066 | -61.84% | ||
| race | classical -means | 80.8993 | 0.00% | |
| Fair-Lloyd | N/A | N/A | ||
| ours | 31.9480 | -60.51% | ||
| CreditCard | SEX | classical -means | 21.6800 | 0.00% |
| Fair-Lloyd | 16.8425 | -22.31% | ||
| ours | 4.8128 | -77.80% |
| dataset | sensitive attribute | method | -means objective | % change |
|---|---|---|---|---|
| Adult | sex | classical -means | 2.0849 | 0.00% |
| Fair-Lloyd | 2.3548 | +12.95% | ||
| ours | 2.5833 | +23.91% | ||
| race | classical -means | 2.0860 | 0.00% | |
| Fair-Lloyd | N/A | N/A | ||
| ours | 2.3299 | +11.69% | ||
| CreditCard | SEX | classical -means | 8.6176 | 0.00% |
| Fair-Lloyd | 8.5498 | -0.79% | ||
| ours | 9.8836 | +14.69% |
Our method optimises for a fairer objective function different from the classical utilitarian one. It is widely accepted that increase in fairness almost always causes decrease in utility; it would be of interest to look at the fairness gains obtained due to our method and the corresponding loss in utility. Here, we quantify unfairness with our evaluation metric – average cluster disparity (Equation 4.5), and utility with the -means objective666We normalise the original -means objective here, i.e., divide Equation 3.1 by the number of objects in the dataset.. From Tables 2 and 3, we see that our method is able to significantly reduce the unfairness (reduction of 61.84%, 60.51%, 77.80% over the classical -means algorithm on our datasets; 66.72% on average) at the cost of a relatively smaller increase in the utilitarian objective (increase of 23.91%, 11.69%, 14.69% over the classical -means algorithm; 16.76% on average). Fair-Lloyd, on the other hand, does not perform as well on this fairness metric (average reduction of 10%). Evidently, our method outperforms the baselines on our cluster-level group fairness evaluation metric, i.e., average cluster disparity.
6.2.2 Fairness Objectives
| dataset | sensitive attribute | method | our objective | % change |
|---|---|---|---|---|
| Adult | sex | classical -means | 3.1302 | 0.00% |
| Fair-Lloyd | 3.5403 | +13.10% | ||
| ours | 2.1299 | -31.96% | ||
| race | classical -means | 4.1148 | 0.00% | |
| Fair-Lloyd | N/A | N/A | ||
| ours | 2.7868 | -32.27% | ||
| CreditCard | SEX | classical -means | 43.8224 | 0.00% |
| Fair-Lloyd | 39.6524 | -9.52% | ||
| ours | 14.3313 | -67.30% |
| dataset | sensitive attribute | method | fair -means objective | % change |
|---|---|---|---|---|
| Adult | sex | classical -means | 2.2473 | 0.00% |
| Fair-Lloyd | 2.5453 | +13.26% | ||
| ours | 2.7811 | +23.75% | ||
| race | classical -means | 2.6185 | 0.00% | |
| Fair-Lloyd | N/A | N/A | ||
| ours | 2.8538 | +8.99% | ||
| CreditCard | SEX | classical -means | 8.6489 | 0.00% |
| Fair-Lloyd | 8.5508 | -1.13% | ||
| ours | 10.1417 | +17.26% |
In the interest of comparing across the two threads of representativity fairness, we look at how our method compares with the baselines on the two fairness objectives: (i) our objective777We normalise our objective here, i.e., divide Equation 5.7 by the number of clusters . (Equation 5.7), and (ii) fair -means objective [1, 19] (Equation 3.2) . In Table 4, we see that our method does indeed improve the representativity of the worst-off sensitive groups (reduction of 31.96%, 32.27%, 67.30% over the classical -means algorithm; 43.84% on average) which indicates that our method is moving in the right direction. The Fair-Lloyd baseline does not perform as well; this is acceptable as it is not designed for cluster-level group fairness. On the other hand, our method causes the worst-off sensitive group at the cluster assignment level to have a worse representativity than the classical -means algorithm, as seen in Table 5. While at first glance this may seem to be a deficiency of our method, we note that any improvement in the representativity of this worst-off group would potentially result in another sensitive group that is the worst-off in some cluster being further disadvantaged in order to improve the representativity of the former group. This would be unacceptable in cases where more than one sensitive groups are historically disadvantaged (e.g., black and American Indians in case of race) and benefitting one would result in disadvantaging the other.
6.2.3 Disparity Trends
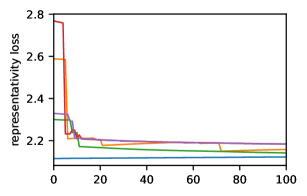
In order to further observe the behaviour of our method, we look at how the representativity losses of the different sensitive groups vary within a cluster over iterations. As an illustration, Figure 2 shows the trends in cluster 4 that was initialised with random_state=3 on the Adult dataset with race as the sensitive attribute. We notice that over iterations (i) the disparity in the representativities of the best-off and worst-off sensitive groups decreases, and (ii) the representativity loss of the worst-off sensitive group decreases , which is what we expect. Also note in this figure that the worst-off sensitive group in the cluster changes over iterations; this is a trend that we observe to generally hold for clusters.
7 Conclusion and Future Work
In this paper, we introduced a new formulation of fairness for clustering with respect to representativity of sensitive groups at the cluster-level. Against the backdrop of much recent enthusiasm in using representativity-oriented notions of fairness in clustering, we outlined issues engendered by simplistic aggregations of representativities across clusters, and how our notion alleviates such problems. We proposed a new post-processing based clustering formulation that is able to improve upon existing cluster assignments by iteratively modifying them towards cluster-level group representativity fairness. Given the novel form of our fairness notion, we introduced a new metric that captures disparity between the representativity of groups at the cluster level. Our experiments on the Adult and CreditCard datasets demonstrate the effectiveness of our method towards achieving high levels of cluster-level group representativity fairness at low impact to the popular utilitarian cluster coherence metric used within -means.
7.1 Future Work
One future direction for this work would be to extend our method to incorporate multiple sensitive attributes together, and also to consider numeric sensitive attributes such as age, an attribute on which discrimination is well-understood within healthcare scenarios. Another direction would be to extend this notion to other clustering paradigms such as hierarchical clustering and spectral clustering where data models depart significantly from the relational model we assumed in our present work.
Acknowledgement
This project has received funding from the European Union’s Horizon 2020 research and innovation programme under the Marie Skłodowska-Curie grant agreement No 945231; and the Department for the Economy in Northern Ireland. We are grateful for use of the computing resources from the Northern Ireland High Performance Computing (NI-HPC) service funded by EPSRC (EP/T022175).
References
- [1] Mohsen Abbasi, Aditya Bhaskara and Suresh Venkatasubramanian “Fair Clustering via Equitable Group Representations” In Proceedings of the 2021 ACM Conference on Fairness, Accountability, and Transparency (FAccT ’21) ACM, 2021, pp. 504–514 DOI: 10.1145/3442188.3445913
- [2] Savitha Sam Abraham, Deepak P and Sowmya S. Sundaram “Fairness in Clustering with Multiple Sensitive Attributes” In Proceedings of the 23rd International Conference on Extending Database Technology (EDBT 2020) OpenProceedings.org, 2020, pp. 287–298 DOI: 10.5441/002/edbt.2020.26
- [3] Sara Ahmadian, Alessandro Epasto, Ravi Kumar and Mohammad Mahdian “Clustering without Over-Representation” In Proceedings of the 25th ACM SIGKDD International Conference on Knowledge Discovery & Data Mining (KDD ’19) ACM, 2019, pp. 267–275 DOI: 10.1145/3292500.3330987
- [4] Sara Ahmadian et al. “Fair Hierarchical Clustering” In Advances in Neural Information Processing Systems (NeurIPS 2020) 33 Curran Associates, Inc., 2020, pp. 21050–21060 URL: https://proceedings.neurips.cc/paper/2020/hash/f10f2da9a238b746d2bac55759915f0d-Abstract.html
- [5] Jeremy Bentham “The Collected Works of Jeremy Bentham: An Introduction to the Principles of Morals and Legislation” Clarendon Press, 1996 DOI: 10.1093/actrade/9780198205166.book.1
- [6] Suman Bera, Deeparnab Chakrabarty, Nicolas Flores and Maryam Negahbani “Fair Algorithms for Clustering” In Advances in Neural Information Processing Systems (NeurIPS 2019) 32 Curran Associates, Inc., 2019, pp. 4954–4965 URL: https://proceedings.neurips.cc/paper/2019/hash/fc192b0c0d270dbf41870a63a8c76c2f-Abstract.html
- [7] Philippe Besse et al. “A Survey of Bias in Machine Learning Through the Prism of Statistical Parity” In The American Statistician 76.2 Taylor & Francis, 2022, pp. 188–198 DOI: 10.1080/00031305.2021.1952897
- [8] Brian Brubach et al. “A Pairwise Fair and Community-preserving Approach to -Center Clustering” In Proceedings of the 37th International Conference on Machine Learning (ICML 2020) 119, Proceedings of Machine Learning Research PMLR, 2020, pp. 1178–1189 URL: https://proceedings.mlr.press/v119/brubach20a.html
- [9] Darshan Chakrabarti et al. “A New Notion of Individually Fair Clustering: -Equitable -Center” In Proceedings of The 25th International Conference on Artificial Intelligence and Statistics (AISTATS 2022) 151, Proceedings of Machine Learning Research PMLR, 2022, pp. 6387–6408 URL: https://proceedings.mlr.press/v151/chakrabarti22a.html
- [10] Xingyu Chen, Brandon Fain, Liang Lyu and Kamesh Munagala “Proportionally Fair Clustering” In Proceedings of the 36th International Conference on Machine Learning (ICML 2019) 97, Proceedings of Machine Learning Research PMLR, 2019, pp. 1032–1041 URL: https://proceedings.mlr.press/v97/chen19d.html
- [11] Anshuman Chhabra, Karina Masalkovaitė and Prasant Mohapatra “An Overview of Fairness in Clustering” In IEEE Access 9 IEEE, 2021, pp. 130698–130720 DOI: 10.1109/ACCESS.2021.3114099
- [12] Flavio Chierichetti, Ravi Kumar, Silvio Lattanzi and Sergei Vassilvitskii “Fair Clustering Through Fairlets” In Advances in Neural Information Processing Systems (NIPS 2017) 30 Curran Associates, Inc., 2017, pp. 5029–5037 URL: https://proceedings.neurips.cc/paper/2017/hash/978fce5bcc4eccc88ad48ce3914124a2-Abstract.html
- [13] Alexandra Chouldechova and Aaron Roth “A Snapshot of the Frontiers of Fairness in Machine Learning” In Communications of the ACM 63.5 ACM, 2020, pp. 82–89 DOI: 10.1145/3376898
- [14] Arthur P. Dempster, Nan M. Laird and Donald B. Rubin “Maximum Likelihood from Incomplete Data Via the EM Algorithm” In Journal of the Royal Statistical Society: Series B (Methodological) 39.1 Wiley Online Library, 1977, pp. 1–22 DOI: 10.1111/j.2517-6161.1977.tb01600.x
- [15] Dheeru Dua and Casey Graff “UCI Machine Learning Repository”, 2019 URL: http://archive.ics.uci.edu/ml
- [16] Cynthia Dwork et al. “Fairness through Awareness” In Proceedings of the 3rd Innovations in Theoretical Computer Science Conference (ITCS ’12) ACM, 2012, pp. 214–226 DOI: 10.1145/2090236.2090255
- [17] Seyed Esmaeili, Brian Brubach, Leonidas Tsepenekas and John Dickerson “Probabilistic Fair Clustering” In Advances in Neural Information Processing Systems (NeurIPS 2020) 33 Curran Associates, Inc., 2020, pp. 12743–12755 URL: https://proceedings.neurips.cc/paper/2020/hash/95f2b84de5660ddf45c8a34933a2e66f-Abstract.html
- [18] Samuel Freeman “Rawls on Distributive Justice and the Difference Principle” In The Oxford Handbook of Distributive Justice Oxford University Press, 2018, pp. 13–40 DOI: 10.1093/oxfordhb/9780199645121.013.2
- [19] Mehrdad Ghadiri, Samira Samadi and Santosh Vempala “Socially Fair -Means Clustering” In Proceedings of the 2021 ACM Conference on Fairness, Accountability, and Transparency (FAccT ’21) ACM, 2021, pp. 438–448 DOI: 10.1145/3442188.3445906
- [20] Corinna Hertweck, Christoph Heitz and Michele Loi “On the Moral Justification of Statistical Parity” In Proceedings of the 2021 ACM Conference on Fairness, Accountability, and Transparency (FAccT ’21) ACM, 2021, pp. 747–757 DOI: 10.1145/3442188.3445936
- [21] Matthäus Kleindessner, Pranjal Awasthi and Jamie Morgenstern “Fair -Center Clustering for Data Summarization” In Proceedings of the 36th International Conference on Machine Learning (ICML 2019) 97, Proceedings of Machine Learning Research PMLR, 2019, pp. 3448–3457 URL: https://proceedings.mlr.press/v97/kleindessner19a.html
- [22] Matthäus Kleindessner, Samira Samadi, Pranjal Awasthi and Jamie Morgenstern “Guarantees for Spectral Clustering with Fairness Constraints” In Proceedings of the 36th International Conference on Machine Learning (ICML 2019) 97, Proceedings of Machine Learning Research PMLR, 2019, pp. 3458–3467 URL: https://proceedings.mlr.press/v97/kleindessner19b.html
- [23] Tai Le Quy et al. “A survey on datasets for fairness-aware machine learning” In WIREs Data Mining and Knowledge Discovery 12.3 Wiley Periodicals LLC, 2022, pp. e1452 DOI: 10.1002/widm.1452
- [24] James MacQueen “Some Methods for Classification and Analysis of Multivariate Observations” In Proceedings of the Fifth Berkeley Symposium on Mathematical Statistics and Probability 1.14, 1967, pp. 281–297
- [25] Deepak P “Whither Fair Clustering?” In AI for Social Good Workshop, 2020 URL: https://crcs.seas.harvard.edu/publications/whither-fair-clustering
- [26] Deepak P and Savitha Sam Abraham “Representativity Fairness in Clustering” In 12th ACM Conference on Web Science (WebSci ’20) ACM, 2020, pp. 202–211 DOI: 10.1145/3394231.3397910
- [27] Ali Vakilian and Mustafa Yalciner “Improved Approximation Algorithms for Individually Fair Clustering” In Proceedings of the 25th International Conference on Artificial Intelligence and Statistics (AISTATS 2022) 151, Proceedings of Machine Learning Research PMLR, 2022, pp. 8758–8779 URL: https://proceedings.mlr.press/v151/vakilian22a.html