GPTR: Gestalt-Perception Transformer for Diagram Object Detection
Abstract
Diagram object detection is the key basis of practical applications such as textbook question answering. Because the diagram mainly consists of simple lines and color blocks, its visual features are sparser than those of natural images. In addition, diagrams usually express diverse knowledge, in which there are many low-frequency object categories in diagrams. These lead to the fact that traditional data-driven detection model is not suitable for diagrams. In this work, we propose a gestalt-perception transformer model for diagram object detection, which is based on an encoder-decoder architecture. Gestalt perception contains a series of laws to explain human perception, that the human visual system tends to perceive patches in an image that are similar, close or connected without abrupt directional changes as a perceptual whole object. Inspired by these thoughts, we build a gestalt-perception graph in transformer encoder, which is composed of diagram patches as nodes and the relationships between patches as edges. This graph aims to group these patches into objects via laws of similarity, proximity, and smoothness implied in these edges, so that the meaningful objects can be effectively detected. The experimental results demonstrate that the proposed GPTR achieves the best results in the diagram object detection task. Our model also obtains comparable results over the competitors in natural image object detection.
1 Introduction
The goal of object detection (Liu et al. 2020; Guo et al. 2021; Dong et al. 2021) is to accurately locate and classify all objects in a given image, which is indeed dominated by various deep neural networks (Pan et al. 2021; Wu et al. 2021; Zhong et al. 2021; Chen et al. 2021b; Cao et al. 2021; Wang et al. 2021). For this task, it is very important to understand the detailed and implicit semantic information of images. It also has great significance in practical applications such as visual question answering (Yuan et al. 2021), cross-modal retrieval (Chen et al. 2021a; Diao et al. 2021), etc.
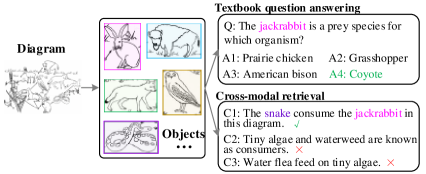
Most existing detectors are designed for natural images of variant objects, while the research on diagram object detection is still blank. Diagram is a special kind of image, which usually consists of simple lines and color blocks, and exists in many fields such as pedagogy and architecture (Hu et al. 2021). Diagram object detection is a key step in many applications as shown in Figure 1. On this basis, it plays an important role in smart education and so on. Taking textbook question answering (Kembhavi et al. 2017; He et al. 2021) as an example, given the diagram and question text, diagram object detector outputs the locations and categories of objects in the diagram. And then, these objects interact with the question text multimodally to facilitate the answer of the question. However, detectors for natural images cannot be directly applied to diagram object detection. We adopt some mainstream detectors to conduct experiments on natural images and diagrams, respectively. Taking the recent SAM-DETR (Zhang et al. 2022) model as an example, the average precision of this model on natural images is as high as 39%, while the precision on diagrams drops to about 15%. See Section 4 for more analyses of experimental results. The reason is that the diagram has two characteristics different from natural image. On the one hand, the visual features of diagram are sparser than those of natural image. As shown in Figure 2 (a), the frequency distribution histograms are drawn corresponding to the RGB values for all pixels from the diagrams in AI2D* dataset and the natural images in MSCOCO (Lin et al. 2014). We can see that the RGB value distribution of the natural image is more balanced than
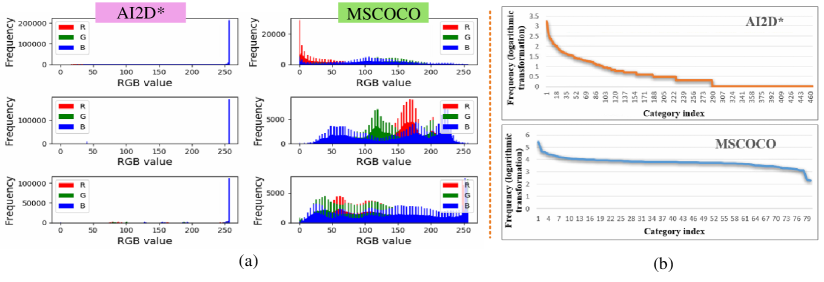
that of the diagram, and the distribution of three RGB color components in the diagram is extremely uneven, which is concentrated around 255. This phenomenon illustrates the presence of a large amount of white in diagrams and the rest of the color information is scarce. White usually represents the background, which contains almost useless information. Therefore, there are a large number of white backgrounds in the diagrams, resulting in sparser visual features and fewer pixels occupied by foreground content compared with the natural images. On the other hand, the ratio of low-frequency object categories is larger in the diagram. In Figure 2 (b), the orange line depicts the long-tail distribution of object category in diagram dataset AI2D*. For MSCOCO, there is little difference in the frequency of all object categories. In summary, the existing detectors are not suitable for the task of diagram object detection.
How can humans efficiently identify the objects? According to the process of human perception (Wagemans et al. 2012; Pomerantz, Sager, and Stoever 1977), the human visual system tends to perceive patches in an image that are similar, close or connected without abrupt directional changes as a perceptual whole object. For example, in a jigsaw puzzle, humans consciously splice two patches with similar colors and close positions into a whole, and the spliced object has a smooth and continuous contour. Gestalt perception contains a series of laws to explain human perception, such as laws of similarity, proximity, closeness, smoothness, symmetry and so on. The diagram is drawn by experts and the object recognition process conforms to the gestalt perception theory (Wertheimer 1922; Hörhan and Eidenberger 2021; Desolneux, Moisan, and Morel 2004). Among them, similarity, proximity and smoothness laws play an important role in recognizing objects.
Inspired by this, we propose a Gestalt-Perception TRansformer model for diagram object detection (GPTR). GPTR is based on the transformer encoder-decoder architecture, and the main module is the gestalt-perception graph named GPG that is constructed during encoding. Gestalt laws are used as prior knowledge to guide the aggregation of diagram patches to form reasonable objects, without relying on large amounts of annotations. The way of dividing the diagram into patches is the same as that of dividing the image into patches in (Dosovitskiy et al. 2020). Specifically, GPG is composed of diagram patches as nodes and the relationships between patches as edges. Node features in GPG are obtained by three gestalt-visual branches, namely color branch, position branch and edge branch. Edge weights of the graph are adaptively learned by the laws of color similarity, position proximity, and contour smoothness. The decoder of GPTR decodes the object queries in parallel and predicts the final location and classification results. Our main contributions are summarized as follows:
-
•
As far as we know, we put forward the diagram object detection task for the first time. Due to the problems of sparser visual features and more low-frequency objects of diagrams than those of natural images, we propose a novel gestalt-perception model to complete this task. The model is based on transformer architecture, and it can simulate the process of human visual perception to learn better features for diagram object detection.
-
•
We build a gestalt-perception graph, in which the adaptive learning strategy of gestalt-visual branches simulates humans to combine the diagram patches into more meaningful objects in accordance with the gestalt laws. In addition, we adopt the multi-scale attention mechanism to produce better query initialization.
-
•
We conduct experiments on a diagram dataset AI2D* and a benchmark MSCOCO of natural images to verify the effectiveness of GPTR. The experimental results show that our model achieves the best results in the diagram object detection task, and also obtains comparable results over the competitors in natural images.
2 Related Work
This section mainly introduces DETR-series detection models and the gestalt perception theory.
DETR-Series Detection.
DETR (Carion et al. 2020) is the first end-to-end transformer-based detection model, which effectively removes the need for many hand-designed components. Subsequently, there are some improved models. Deform-DETR (Zhu et al. 2020) designs a deformable attention module, which attends to a small set of sampling locations for prominent key elements out of all the feature map pixels. ConditionDETR (Meng et al. 2021) learns a conditional spatial query from decoder embedding, while DAB-DETR (Liu et al. 2021) presents a novel query formulation using dynamic anchor boxes for DETR. SMCA-DETR constrains co-attention responses to be high near initially estimated bounding box locations. SAM-DETR interpretes its cross-attention as a matching and distillation process and semantically aligns object queries with encoded image features to facilitate their matching. The above models adopt convolutional network, which cannot effectively represent diagrams because of the sparse visual features.
Gestalt Perception Theory.
According to the process of human perception (Pomerantz, Sager, and Stoever 1977), characterized by the laws of similarity, proximity, and continuity, the human visual system tends to perceive objects that are similar, close or connected without abrupt directional changes as a perceptual whole. For example, GLGOV (Yan et al. 2018) is guided by the gestalt laws of perception for image saliency detection with a bottom-up mechanism. Inspired by the gestalt laws of feature grouping, we propose a gestalt-perception model. Similarity, proximity and smoothness laws are considered in our work.
3 The GPTR Model
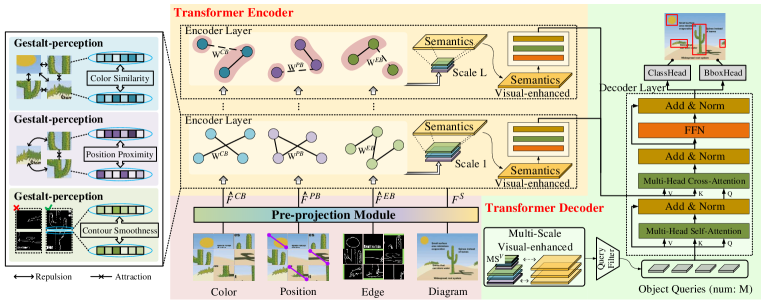
The overall architecture of GPTR is depicted in Figure 3. It follows the encoder-decoder transformer and mainly contains three components: 1) the pre-projection module maps the patch features from different visual branches to the same dimensional space to initialize GPTR model; 2) the transformer encoder is built by gestalt-perception graph, which aims to model the relationships between the diagram patches and group these patches into objects via gestalt laws, so that the meaningful features can be better processed by the detector; 3) the transformer decoder transforms the object queries that represented by learnable positional embeddings into an output embedding and makes the final prediction with a feed-forward neural network (FFN). GPTR model is optimized with classification loss and box regression loss that are same as DETR (Carion et al. 2020). These three components are detailed in the following subsections.
3.1 Pre-Projection Module
The global features generated by only convolutional backbone network can not effectively represent diagrams because of the sparse visual features of diagrams. In order to make up for this limitation, we divide the diagram into local-level patches and let the GPTR model focus on the details of the diagram. Specifically, given an initial diagram , we reshape it into a set of patches that is same as (Dosovitskiy et al. 2020). is the resolution of diagram and means three color channels. is the total number of patches in a diagram. Then, the pre-projection module learns patch features by feeding into three different gestalt-visual branches. In addition, this module adopts another MLP layer to project the backbone feature of the diagram into the -dimension signed as .
Color Branch (CB) maps per patch into a 9-dim color feature , and all the features consist of the feature set . Specifically, is concatenated by three central moments (Stricker and Orengo 1995) of each color channel. These three moments represent mean feature, variance feature, and skewness feature of color distribution, respectively.
Position Branch (PB) outputs a position feature for each patch, and . is composed of the coordinates of the top left corner and the bottom right corner of patch .
Edge Branch (EB) represents each patch as the pixel values of top, bottom, left, and right edges. We use Canny algorithm (Canny 1986) converting 3-channel patch into 1-channel contour map. Then, the pixel values of the four edges of each contour map are concatenated as the edge feature for per patch. denotes a set of edge features for each diagram. We use and to distinguish the top and bottom edge features from the left and right edge features.
In order to facilitate the construction and updating of the gestalt-perception graph, the pre-projection module adopts three kinds of MLP layers mapping low-dimensional visual features into high-dimensional ones as shown in follows. , and are mapping dimensions for color, position and edge features. denotes the concatenating operator in (2).
| (1) |
| (2) |
3.2 Gestalt-Perception Graph in Encoder
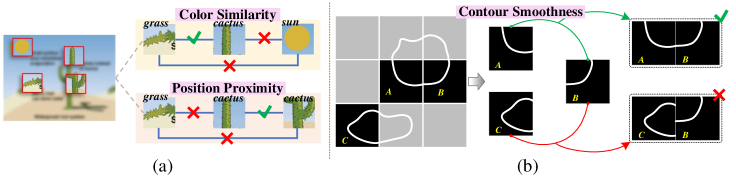
According to the process of human perception, the human visual system tends to perceive similar, close, or connected patches as a perceptual whole object. As shown by the color similarity and position proximity in Figure 4 (a), for the cactus patch and sun patch, because their color features are quite different, the two patches may not belong to the same object according to the law of color similarity. The same green grass patch and cactus patch are consistent with color similarity, but they are far away in spatial and do not meet the law of position proximity. Consequently, they can not belong to the same object. On the contrary, two different cactus patches that are both green and close to each other can be easily recognized as the same object. Taking the contour smoothness in Figure 4 (b) as an example, according to the left and right edges for each patch, the features of the left edge of patch B and the right edge of patch A are similar, which means that the contours in B and A can be connected into a smooth curve, and they are more likely belong to the same object. On the contrary, the features of the left edge of patch B and the right edge of patch C are quite different, that is, if B and C are spliced into one object, it does not meet the human perception of the contour smoothness law.
These gestalt laws, as a kind of priori knowledge, guide human to effectively identify the objects in the diagrams without relying on a large annotated dataset. Therefore, gestalt-perception based method can learn good representations for low-frequency objects. Inspired by this, GPTR designs a gestalt-perception graph (GPG) and it is composed of diagram patches as nodes and the relationships between patches as edges. GPG consists of three subgraphs, in other words, similarity, proximity and smoothness are encoded by the edges on subgraphs , and , respectively.
Color Similarity.
is a subgraph for modeling color similarity between patches. indicates nodes, each node is a -dimension color feature for one patch. represents the color similarity between nodes. Specifically, given two node features and , the weight of is given by (3), where is a cosine similarity function and .
| (3) |
Position Proximity.
In order to measure the proximity of spatial positions, is formulated to learn the positional relation between two patches. Concretely, indicates the nodes set with position feature , and is denoted as position proximity between each pair of nodes in . The weight of is shown in (4). The parameter is fixed as 0.1 and .
| (4) |
Contour Smoothness.
The law of contour smoothness is one of the gestalt laws that states humans perceive objects as continuous in a smooth pattern, which means that object usually contains a smooth contour. In order to judge whether two patches may belong to the same object, is constructed to measure the feature consistency of the top, bottom, left and right edges between patches. Specifically, is defined as . indicates the nodes with edge features and determines the possibility of splicing two patches. The weight of is computed as follows, where and represents the bottom edge feature of patch .
| (5) |
| (6) |
| (7) |
GPG Grouping with an Assignment Matrix.
For aggregating patch features to obtain meaningful object features, we denote a learned assignment matrix (Ying et al. 2018) at layer as , where is the number of nodes at layer . It provides a soft assignment of each node at layer to layer . Taking as an example, when , in (8) denotes the output of pre-projection module. The node feature at layer is computed by (9). The node update method of and is similar as that of . GPG concatenates , and , where , and are three learnt adaptive weight coefficients. Then, a self-attention layer (SA) is applied to generate the final visual feature as shown in (10).
| (8) |
| (9) |
| (10) |
GPTR updates the diagram feature of visual enhancement through cross-attention strategy (CA), then a self-attention layer (SA) and a feed-forward layer (FFN) are stacked to form a transformer encoder layer. in (11) and (12) indicates the high-level semantic feature extracted from Convolution Neural Network (CNN).
| (11) |
| (12) |
3.3 Multi-Scale Visual-Enhanced Decoder
The decoder follows the standard architecture of ConditionDETR (Meng et al. 2021), transforming embeddings using multi-head self-attention and cross-attention mechanisms. Unlike ConditionDETR decoder, which receives zero set as initial queries, we consider the human visual perception. When recognizing objects in diagrams, humans follow the process of visual perception to identity variety of objects with different scales. Inspired by this, our GPTR designs a multi-scale attention mechanism named MSA, to acquire better initial query features.
Firstly, the output of each layer of , and is taken as the multi-scale visual feature. Taking as an example, the multi-scale color feature is recorded as . The score of color feature is computed by a single-layer MLP as shown in (13), and top- color feature is selected according to the score. and are acquired in the same way as . The final selected multi-scale visual feature is written as . In (14), GPTR first concatenates the and the output feature of the -layer encoder, and then obtains the enhanced features through the self-attention mechanism SA. indicates that the first features are selected as the initial query representation QUERY.
| (13) |
| (14) |
Loss Function.
We follow DETR to find an optimal bipartite matching (Kuhn 1955) between the predicted and ground-truth objects using the Hungarian algorithm, and then form the loss function for optimizing GPTR model. Focal loss (Lin et al. 2017) is used for classification and GIoU loss (Rezatofighi et al. 2019) for box regression, both of which are the same as DETR.
4 Experiments
4.1 Datasets
In this work, we evalute the baselines and our GPTR model both on the diagram and the natural image datasets.
AI2D* is composed of diagrams in the original AI2D dataset (Kembhavi et al. 2016), and the topic is grade school science. AI2D is mainly used to verify the question and answering task. We annotate it with more fine-grained details, including the spatial coordinates and category labels of objects in per diagram. The novel AI2D* dataset contains total 557 object categories and it is divided into a train set with 1,634 diagrams and a test set with 404 diagrams.
MSCOCO (Lin et al. 2014) is a large-scale object detection dataset with 80 categories. It comprises 118,287 images for training and 5,000 images for testing.
| Models | Epoch | AP | AP50 | AP75 | APS | APM | APL | params | |||
| CenterNet (Duan et al. 2019) | / | / | 16 | 500 | 8.6 | 13.2 | 9.9 | 10.7 | 13.4 | 12.5 | 50.39M |
| RetinaNet (Lin et al. 2017) | / | / | 16 | 100 | 10.5 | 16.3 | 11.4 | 6.0 | 12.8 | 14.9 | 29.86M |
| DETR (Carion et al. 2020) | 4 | 4 | 16 | 1000 | 10.5 | 18.3 | 11.0 | 6.6 | 13.7 | 13.9 | 28.93M |
| ConditionDETR (Meng et al. 2021) | 4 | 4 | 16 | 100 | 11.5 | 18.5 | 12.7 | 10.4 | 15.1 | 15.2 | 29.22M |
| GPTR(Ours) | 4 | 4 | 16 | 100 | 14.1 | 23.0 | 15.6 | 12.2 | 18.4 | 18.9 | 30.56M |
| Deform-DETR (Zhu et al. 2020) | 6 | 8 | 8 | 100 | 11.8 | 16.8 | 14.2 | 13.9 | 15.8 | 16.6 | 35.11M |
| DAB-DETR (Liu et al. 2021) | 6 | 8 | 8 | 100 | 10.8 | 17.1 | 12.0 | 14.9 | 14.1 | 14.6 | 41.55M |
| SMCA-DETR (Gao et al. 2021) | 6 | 8 | 8 | 300 | 13.8 | 21.7 | 15.4 | 10.5 | 18.1 | 18.4 | 39.66M |
| SAM-DETR (Zhang et al. 2022) | 6 | 8 | 8 | 200 | 14.6 | 21.7 | 16.6 | 10.9 | 19.0 | 18.5 | 47.08M |
| AnchorDETR (Wang et al. 2022) | 6 | 8 | 8 | 120 | 15.6 | 23.5 | 17.3 | 14.8 | 19.4 | 20.5 | 32.22M |
| GPTR(Ours) | 6 | 8 | 8 | 120 | 16.1 | 24.6 | 18.4 | 15.3 | 21.1 | 21.5 | 33.44M |
| Models | Epoch | AP | AP50 | AP75 | APS | APM | APL | |||
|---|---|---|---|---|---|---|---|---|---|---|
| CenterNet (Duan et al. 2019) | / | / | 32 | 100 | 20.1 | 39.6 | 16.6 | 7.5 | 22.8 | 29.1 |
| RetinaNet (Lin et al. 2017) | / | / | 16 | 100 | 25.5 | 42.4 | 26.2 | 10.7 | 27.6 | 38.0 |
| DETR (Carion et al. 2020) | 4 | 4 | 16 | 1000 | 30.2 | 49.7 | 30.6 | 10.1 | 31.4 | 47.2 |
| ConditionDETR (Meng et al. 2021) | 4 | 4 | 16 | 50 | 31.9 | 52.4 | 32.6 | 13.7 | 34.0 | 48.7 |
| GPTR(Ours) | 4 | 4 | 16 | 50 | 32.1 | 52.4 | 33.2 | 13.8 | 34.7 | 48.8 |
| SMCA-DETR (Gao et al. 2021) | 6 | 8 | 8 | 50 | 28.9 | 50.3 | 28.7 | 9.9 | 30.7 | 46.9 |
| SAM-DETR (Zhang et al. 2022) | 6 | 8 | 8 | 50 | 39.0 | 60.5 | 40.8 | 19.7 | 42.5 | 58.0 |
| GPTR(Ours) | 6 | 8 | 8 | 50 | 37.2 | 57.8 | 38.2 | 14.0 | 41.6 | 54.9 |
| SAM-DETR+GPG | 6 | 8 | 8 | 50 | 39.3 | 61.5 | 41.2 | 19.5 | 43.3 | 58.9 |
4.2 Experimental Settings
GPTR Implementation.
Our architecture is almost the same with the DETR-like architecture and contains the CNN backbone, transformer encoder and transformer decoder. The main difference is that we introduce the details of gestalt-perception graph in transformer encoder. For the gestalt visual preprocessing, we resize all images of two datasets to 2242243 and each image is divided into 196 patches. The dimension of per patch feature is 256. We set 50 and 100 object queries for AI2D* and MSCOCO datasets, respectively.
Training and Evaluation.
The learning rate is initially set to and the AdamW optimizer is used in GPTR. The weight decay is set to be and the dropout rate in transformer is 0.1. We use the standard COCO evaluation introduced in (Meng et al. 2021), and we also report the average precision (AP), and the AP scores at 0.50 (AP50), 0.75 (AP75) and for the small (APS), medium (APM), and large (APL) objects. For fair comparison, we adopt the same equipment and settings, such as the layer number for transformer encoder and decoder, and the number of attention heads inside the transformer’s attentions, to rerun all the baseline models for several times, and then record the average results. All the models are trained and evaluated on NVIDIA Tesla V100 GPU.
4.3 Performance Comparison
Diagram Object Detection.
We conduct this experiment on the AI2D* dataset and the proposed GPTR achieves the best results compared with all the competitors. One can find in Table 1 that DETR with 1,000 training epochs performs much worse than ConditionDETR with only 100 epochs. The performance of our GPTR is 1.8% to 4.5% higher than that of ConditionDETR in all AP scores. Compared with SMCA-DETR and SAM-DETR, GPTR achieves better results in all AP scores. Concretely, GPTR is 2.3% and 1.5% higher in AP than SMCA-DETR and SAM-DETR, respectively. Especially for small objects, GPTR has a gain of 4.8% in APS than that of SMCA-DETR. In addition, the parameters of SAM-DETR and SMCA-DETR are much more than our GPTR model, and the training time of GPTR is only less than half that of SMCA-DETR. Also, our GPTR outperforms the recently proposed AnchorDETR model in all AP scores, especially 0.5% higher in AP.
Natural Image Object Detection.
Although GPTR model is especially proposed for the diagram object detection, it can also be applied to the object detection in natural images. For natural images, the patches also meet three gestalt laws of color similarity, position proximity and contour smoothness. The performance of GPTR is verified on MSCOCO with natural images as shown in Table 2. One can find that our model achieves competitive results on this task. Specifically, DETR works better than the anchor-free models CenterNet and RetinaNet, but it converges more slowly. The ConditionDETR model is built on the DETR model, with higher AP scores and faster convergence. Compared with ConditionDETR, our GPTR still achieves the best performance under the same experimental settings, and GPTR is 8.3% and 4.1% higher than SMCA-DETR in AP and APS scores, respectively. In addition, the designed gestalt-perception graph (GPG) in transformer encoder can be flexibly added to SAM-DETR model, and the performance of SAM-DETR+GPG is improved in almost all the AP scores.
Diagrams vs. Natural Images.
From the experimental results in Table 1 and Table 2, it can be seen that the GPTR outperforms almost all the competitors in AP scores. In particular, compared with natural image object detection, GPTR improves the performance of diagram object detection more significantly. In other words, the gestalt laws in GPTR are more effective for the representation of diagrams. The reason is that the visual features of diagrams are sparse, and there are many low-frequency object categories. As a kind of prior knowledge of human cognition, gestalt laws can effectively learn the visual features of diagrams without relying on a large amount of labeled dataset, and alleviate the limitations of learning low-frequency object representations.
| Model | AdaB | VQ | MSA | AP | APS | APM | APL |
|---|---|---|---|---|---|---|---|
| GVB-CPE | - | - | - | 11.6 | 10.7 | 15.5 | 15.6 |
| GVB-CPEa | 11.9 | 11.6 | 16.0 | 16.5 | |||
| GVB-CPEb | 12.7 | 11.7 | 16.9 | 18.0 | |||
| GPTR | 14.1 | 12.2 | 18.4 | 18.9 |
| Model | CB | PB | EB | AP | APS | APM | APL |
|---|---|---|---|---|---|---|---|
| -ALL | - | - | - | 11.4 | 10.3 | 15.1 | 15.2 |
| GVB-C | 11.0 | 8.6 | 14.3 | 14.6 | |||
| GVB-P | 11.2 | 7.4 | 14.9 | 14.8 | |||
| GVB-E | 10.6 | 9.4 | 13.4 | 14.0 | |||
| GVB-CPE | 11.6 | 10.7 | 15.5 | 15.6 |
4.4 Ablation Studies
The performance of GPTR in diagram object detection is mainly improved in three aspects. They are gestalt-visual branches in GPG module, visual-guided initialization for decoder queries, and multi-scale visual enhancement strategy. To demonstrate the effectiveness of these aspects, we study the ablation models and the differences between these versions are shown in Table 3. 1) GVB-CPE represents the combination of three branches as visual features, and the combination mode is direct concatenate. 2) GVB-CPEa adopts adaptive learning method to combine the three branches on the basis of GVB-CPE. 3) GVB-CPEb adopts visual-guided initialization mechanism, and our GPTR model adds the multi-scale mechanism to GVB-CPEb.
The experimental results are shown in Table 3. One can find that: 1) after using the adaptive method, GVB-CPEa has significantly improved the APS score compared with GVB-CPE model. 2) Compared with taking zero set as initial queries in GVB-CPEa, the visual-guided initialization mechanism of GVB-CPEb has improved performance in all AP scores, especially 1.5% higher in APL. 5) Our GPTR, which adds multi-scale attention mechanism to GVB-CPEb, has achieved the best results in all AP scores.
Since three gestalt-visual branches are included in the GPTR model, we also analyze the effects of different visual branches. As shown in Table 4, 1) GVB-C, GVB-P and GVB-E indicate that only the gestalt-visual branches of color, position and edge, respectively. 2) GVB-CPE is the same model in Table 3. When three gestalt-visual branches are used separately, the performance of GVB-C, GVB-P and GVB-E is affected by the law-bias compared with -ALL model. 2) GVB-CPE has improved in most AP scores that compared with all the ablation models.
4.5 Qualitative Results
Visualization of Detection Results.
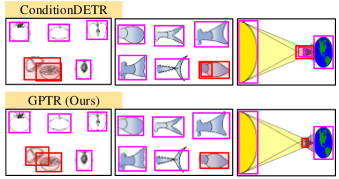
The detection results for ConditionDETR and GPTR are shown in Figure 5. For the first case, when two orange are close to each other in a diagram, ConditionDETR confuses them as a whole object, while GPTR accurately locates them respectively. For the second case, the fishtail in the bottom right corner is composed of two polygons. ConditionDETR recognizes it as two independent objects, while GPTR accurately recognizes it as a whole fishtail. For the third case, the moon, earth and light in this diagram are close in space, and the light as the background affects the recognition of the foreground objects moon and earth by the ConditionDETR. On the contrary, GPTR effectively separates the foreground and background, and then accurately locate the foreground objects.
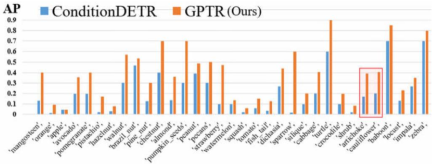
Low-Frequency Objects in AI2D* Dataset.
Figure 6 shows the AP score of the ConditionDETR and GPTR models on low-frequency objects, respectively. For the convenience of visualization, the abscissa represents several object categories selected with a frequency of no more than 10 times, and the ordinate indicates the AP score. It can be seen that the performance of GPTR is better than that of the ConditionDETR for low-frequency object categories. Especially for some categories that only appear once, such as artichoke and cauliflower in the red box, the performance of GPTR is about 20% higher than that of ConditionDETR.
5 Conclusion
In this paper, we propose a gestalt-perception transformer model (GPTR) for the novel diagram object detection. The gestalt laws, as a kind of priori knowledge, guide human to identify the objects without relying on a large dataset. For the sparse visual features and low-frequency objects of diagrams, GPTR constructs a gestalt-perception graph and these laws are encoded by the graph edges. During updating, the designed adaptive learning strategy effectively combine the laws of similarity, proximity and smoothness to group the diagram patches to objects. In addition, we adopt the multi-scale mechanism based on the visual features to produce better queries. We have demonstrated the effectiveness of GPTR in diagram object detection by achieving significant performance improvements. However, there are still limitations in the application of gestalt laws in this work. For example, GPTR only uses three laws. How to mine other laws for diagram representation, and how multiple laws work together will be the future research works.
Acknowledgments
This work was supported by National Key Research and Development Program of China (2020AAA0108800), National Natural Science Foundation of China (62137002, 61937001, 62192781, 62176209, 62176207, 62106190, and 62250009), Innovative Research Group of the National Natural Science Foundation of China (61721002), Innovation Research Team of Ministry of Education (IRT17R86), Consulting research project of Chinese academy of engineering “The Online and Offline Mixed Educational Service System for ‘The Belt and Road’ Training in MOOC China”, “LENOVO-XJTU” Intelligent Industry Joint Laboratory Project, CCF-Lenovo Blue Ocean Research Fund, Project of China Knowledge Centre for Engineering Science and Technology, Foundation of Key National Defense Science and Technology Laboratory (6142101210201).
References
- Canny (1986) Canny, J. 1986. A computational approach to edge detection. IEEE Transactions on Pattern Analysis and Machine Intelligence, (6): 679–698.
- Cao et al. (2021) Cao, Y.; Wang, J.; Jin, Y.; Wu, T.; Chen, K.; Liu, Z.; and Lin, D. 2021. Few-Shot Object Detection via Association and DIscrimination. Advances in Neural Information Processing Systems, 34.
- Carion et al. (2020) Carion, N.; Massa, F.; Synnaeve, G.; Usunier, N.; Kirillov, A.; and Zagoruyko, S. 2020. End-to-end object detection with transformers. In Proceedings of the European Conference on Computer Vision, 213–229. Springer.
- Chen et al. (2021a) Chen, J.; Hu, H.; Wu, H.; Jiang, Y.; and Wang, C. 2021a. Learning the best pooling strategy for visual semantic embedding. In Proceedings of the IEEE/CVF Conference on Computer Vision and Pattern Recognition, 15789–15798.
- Chen et al. (2021b) Chen, Y.; Li, Y.; Kong, T.; Qi, L.; Chu, R.; Li, L.; and Jia, J. 2021b. Scale-aware automatic augmentation for object detection. In Proceedings of the IEEE/CVF Conference on Computer Vision and Pattern Recognition, 9563–9572.
- Desolneux, Moisan, and Morel (2004) Desolneux, A.; Moisan, L.; and Morel, J.-M. 2004. Gestalt theory and computer vision. In Seeing, Thinking and Knowing, 71–101. Springer.
- Diao et al. (2021) Diao, H.; Zhang, Y.; Ma, L.; and Lu, H. 2021. Similarity Reasoning and Filtration for Image-Text Matching. In Proceedings of the AAAI Conference on Artificial Intelligence, volume 35, 1218–1226.
- Dong et al. (2021) Dong, N.; Zhang, Y.; Ding, M.; and Lee, G. H. 2021. Bridging Non Co-occurrence with Unlabeled In-the-wild Data for Incremental Object Detection. Advances in Neural Information Processing Systems, 34.
- Dosovitskiy et al. (2020) Dosovitskiy, A.; Beyer, L.; Kolesnikov, A.; Weissenborn, D.; Zhai, X.; Unterthiner, T.; Dehghani, M.; Minderer, M.; Heigold, G.; Gelly, S.; et al. 2020. An Image is Worth 16x16 Words: Transformers for Image Recognition at Scale. In International Conference on Learning Representations.
- Duan et al. (2019) Duan, K.; Bai, S.; Xie, L.; Qi, H.; Huang, Q.; and Tian, Q. 2019. Centernet: Keypoint triplets for object detection. In Proceedings of the IEEE/CVF International Conference on Computer Vision, 6569–6578.
- Gao et al. (2021) Gao, P.; Zheng, M.; Wang, X.; Dai, J.; and Li, H. 2021. Fast convergence of detr with spatially modulated co-attention. In Proceedings of the IEEE/CVF International Conference on Computer Vision, 3621–3630.
- Guo et al. (2021) Guo, J.; Han, K.; Wang, Y.; Wu, H.; Chen, X.; Xu, C.; and Xu, C. 2021. Distilling object detectors via decoupled features. In Proceedings of the IEEE/CVF Conference on Computer Vision and Pattern Recognition, 2154–2164.
- He et al. (2021) He, J.; Fu, X.; Long, Z.; Wang, S.; Liang, C.; and Lin, H. 2021. Textbook Question Answering with Multi-type Question Learning and Contextualized Diagram Representation. In International Conference on Artificial Neural Networks, 86–98. Springer.
- Hörhan and Eidenberger (2021) Hörhan, M.; and Eidenberger, H. 2021. Gestalt descriptions for deep image understanding. Pattern Analysis and Applications, 24(1): 89–107.
- Hu et al. (2021) Hu, X.; Zhang, L.; Liu, J.; Zheng, Q.; and Zhou, J. 2021. Fs-DSM: Few-Shot Diagram-Sentence Matching via Cross-Modal Attention Graph Model. IEEE Transactions on Image Processing, 30: 8102–8115.
- Kembhavi et al. (2016) Kembhavi, A.; Salvato, M.; Kolve, E.; Seo, M.; Hajishirzi, H.; and Farhadi, A. 2016. A diagram is worth a dozen images. In Proceedings of the European Conference on Computer Vision, 235–251. Springer.
- Kembhavi et al. (2017) Kembhavi, A.; Seo, M.; Schwenk, D.; Choi, J.; Farhadi, A.; and Hajishirzi, H. 2017. Are you smarter than a sixth grader? textbook question answering for multimodal machine comprehension. In Proceedings of the IEEE/CVF Conference on Computer Vision and Pattern recognition, 4999–5007.
- Kuhn (1955) Kuhn, H. W. 1955. The Hungarian method for the assignment problem. Naval Research Logistics Quarterly, 2(1-2): 83–97.
- Lin et al. (2017) Lin, T.-Y.; Goyal, P.; Girshick, R.; He, K.; and Dollar, P. 2017. Focal loss for dense object detection. In Proceedings of the IEEE/CVF International Conference on Computer Vision, 2980–2988.
- Lin et al. (2014) Lin, T.-Y.; Maire, M.; Belongie, S.; Hays, J.; Perona, P.; Ramanan, D.; Dollár, P.; and Zitnick, C. L. 2014. Microsoft coco: Common objects in context. In Proceedings of the European Conference on Computer Vision, 740–755. Springer.
- Liu et al. (2020) Liu, L.; Ouyang, W.; Wang, X.; Fieguth, P.; Chen, J.; Liu, X.; and Pietikäinen, M. 2020. Deep learning for generic object detection: A survey. International Journal of Computer Vision, 128(2): 261–318.
- Liu et al. (2021) Liu, S.; Li, F.; Zhang, H.; Yang, X.; Qi, X.; Su, H.; Zhu, J.; and Zhang, L. 2021. DAB-DETR: Dynamic Anchor Boxes are Better Queries for DETR. In International Conference on Learning Representations.
- Meng et al. (2021) Meng, D.; Chen, X.; Fan, Z.; Zeng, G.; Li, H.; Yuan, Y.; Sun, L.; and Wang, J. 2021. Conditional detr for fast training convergence. In Proceedings of the IEEE/CVF International Conference on Computer Vision, 3651–3660.
- Pan et al. (2021) Pan, T.-Y.; Zhang, C.; Li, Y.; Hu, H.; Xuan, D.; Changpinyo, S.; Gong, B.; and Chao, W.-L. 2021. On model calibration for long-tailed object detection and instance segmentation. Advances in Neural Information Processing Systems, 34.
- Pomerantz, Sager, and Stoever (1977) Pomerantz, J. R.; Sager, L. C.; and Stoever, R. J. 1977. Perception of wholes and of their component parts: some configural superiority effects. Journal of Experimental Psychology: Human Perception and Performance, 3(3): 422.
- Rezatofighi et al. (2019) Rezatofighi, H.; Tsoi, N.; Gwak, J.; Sadeghian, A.; Reid, I.; and Savarese, S. 2019. Generalized intersection over union: A metric and a loss for bounding box regression. In Proceedings of the IEEE/CVF Conference on Computer Vision and Pattern Recognition, 658–666.
- Stricker and Orengo (1995) Stricker, M. A.; and Orengo, M. 1995. Similarity of color images. In Storage and Retrieval for Image and Video Databases III, volume 2420, 381–392. SPiE.
- Wagemans et al. (2012) Wagemans, J.; Feldman, J.; Gepshtein, S.; Kimchi, R.; Pomerantz, J. R.; Van der Helm, P. A.; and Van Leeuwen, C. 2012. A century of Gestalt psychology in visual perception: II. Conceptual and theoretical foundations. Psychological Bulletin, 138(6): 1218.
- Wang et al. (2021) Wang, J.; Song, L.; Li, Z.; Sun, H.; Sun, J.; and Zheng, N. 2021. End-to-end object detection with fully convolutional network. In Proceedings of the IEEE/CVF Conference on Computer Vision and Pattern Recognition, 15849–15858.
- Wang et al. (2022) Wang, Y.; Zhang, X.; Yang, T.; and Sun, J. 2022. Anchor detr: Query design for transformer-based detector. In Proceedings of the AAAI Conference on Artificial Intelligence, volume 36, 2567–2575.
- Wertheimer (1922) Wertheimer, M. 1922. Untersuchungen zur Lehre von der Gestalt. Psychologische Forschung, 1(1): 47–58.
- Wu et al. (2021) Wu, A.; Zhao, S.; Deng, C.; and Liu, W. 2021. Generalized and Discriminative Few-Shot Object Detection via SVD-Dictionary Enhancement. Advances in Neural Information Processing Systems, 34.
- Yan et al. (2018) Yan, Y.; Ren, J.; Sun, G.; Zhao, H.; Han, J.; Li, X.; Marshall, S.; and Zhan, J. 2018. Unsupervised image saliency detection with Gestalt-laws guided optimization and visual attention based refinement. Pattern Recognition, 79: 65–78.
- Ying et al. (2018) Ying, Z.; You, J.; Morris, C.; Ren, X.; Hamilton, W.; and Leskovec, J. 2018. Hierarchical graph representation learning with differentiable pooling. Advances in Neural Information Processing Systems, 31.
- Yuan et al. (2021) Yuan, Y.; Wang, S.; Jiang, M.; and Chen, T. Y. 2021. Perception matters: detecting perception failures of VQA models using metamorphic testing. In Proceedings of the IEEE/CVF Conference on Computer Vision and Pattern Recognition, 16908–16917.
- Zhang et al. (2022) Zhang, G.; Luo, Z.; Yu, Y.; Cui, K.; and Lu, S. 2022. Accelerating DETR Convergence via Semantic-Aligned Matching. Proceedings of the IEEE/CVF Conference on Computer Vision and Pattern Recognition.
- Zhong et al. (2021) Zhong, Y.; Wang, J.; Wang, L.; Peng, J.; Wang, Y.-X.; and Zhang, L. 2021. DAP: Detection-Aware Pre-training with Weak Supervision. In Proceedings of the IEEE/CVF Conference on Computer Vision and Pattern Recognition, 4537–4546.
- Zhu et al. (2020) Zhu, X.; Su, W.; Lu, L.; Li, B.; Wang, X.; and Dai, J. 2020. Deformable DETR: Deformable Transformers for End-to-End Object Detection. In International Conference on Learning Representations.