PBH formation from overdensities in delayed vacuum transitions
Abstract
Primordial black hole (PBH) formation from first-order phase transitions (FOPTs) combines two prevalent elements of beyond the Standard Model physics with wide-ranging consequences. We elaborate on a recently proposed scenario in which inhomogeneities in vacuum energy decay seed the overdensities that collapse to PBHs. In this scenario, the PBH mass is determined by the Hubble mass as in conventional formation scenarios, while its number density is determined by the nucleation dynamics of the FOPT. We present a detailed study of the formation probability including parameter dependencies. In addition, we generate populations in the open mass window as well as for the HSC and OGLE candidate microlensing events. This mechanism inevitably creates PBHs in generic FOPTs, with significant populations produced in slow and moderately strong phase transitions.
I Introduction
The existence of primordial black holes (PBHs) would have many interesting and diverse consequences. In the asteroid mass window , the PBH mass fraction is free of constraints, making this mass range a popular candidate for PBH dark matter (DM) Carr and Kuhnel (2020); Carr et al. (2021a, 2010). As a subdominant component of DM, PBHs can contribute to the LIGO-VIRGO-KAGRA population of detected binary black hole mergers Nakamura et al. (1997); Bird et al. (2016); Cotner and Kusenko (2016, 2017); Raidal et al. (2017); Eroshenko (2018); Sasaki et al. (2016); Clesse and García-Bellido (2017); Cotner et al. (2018, 2019); Flores and Kusenko (2021a, b, c); Wang et al. (2023) or seed supermassive black holes Bean and Magueijo (2002); Kawasaki et al. (2012); Clesse and García-Bellido (2015). Interestingly, two microlensing experiments HSC Niikura et al. (2019a) and OGLE Niikura et al. (2019b) have reported candidate events which may be consistent with a population of PBHs at and , respectively. PBHs are leading candidates for DM and ones with abundant astrophysical consequences.
It is therefore unsurprising that PBH-production mechanisms have saturated the literature in recent years. In addition to the classic formation from primordial overdensities Carr and Hawking (1974); Carr (1975), models involving first-order phase transitions (FOPTs) have become popular Crawford and Schramm (1982); Hawking et al. (1982); La and Steinhardt (1989); Moss (1994); Konoplich et al. (1998, 1999); Kodama et al. (1982); Lewicki and Vaskonen (2020); Kusenko et al. (2020) (see also Animali and Vennin (2023) for an inflationary scenario but with metastable vacuum). Generically, FOPTs soften the equation of state of the relativistic plasma and stimulate the growth of overdensities, leading to increased PBH production Jedamzik and Niemeyer (1999); Musco and Miller (2013); Byrnes et al. (2018); Jedamzik (1998, 2021); Carr et al. (2021b, c); Dolgov and Postnov (2020); Franciolini et al. (2022); Juan et al. (2022); Lu et al. (2023). In models with additional particles, they can accumulate and form PBHs and other compact objects Gross et al. (2021); Baker et al. (2021a, b); Kawana and Xie (2022); Marfatia and Tseng (2022); Huang and Xie (2022); Davoudiasl et al. (2022); Jung and Okui (2021); Hashino et al. (2022); Maeso et al. (2021); Lu et al. (2022a); Kawana (2022); Lu et al. (2022b); Kawana et al. (2022).
In particular, Ref. Liu et al. (2022) calculated the abundance of FOPT-induced PBHs that result from the overdensities in the false vacuum (FV) regions with delayed decay (see He et al. (2022) for a specific FOPT model realizing the same scenario). The essence of this mechanism is the stochastic nature of the FOPT, which creates inhomogeneities in the subsequent radiation energy distribution after the vacuum transition. These perturbations may then grow and collapse into PBHs in the standard manner. We seek to elaborate and present a more detailed investigation of this interesting scenario, providing a quantitative understanding of the production probability. The PBH prediction of this mechanism is sensitive to the parameters of the FOPT, so it is possible to realize any mass and energy fraction given suitable models. In this paper, we simply choose benchmark parameters of FOPTs that correspond to the open mass window () and the two microlensing events mentioned above, leaving concrete model buildings for future investigation.
In this paper, we describe the formation of PBHs from vacuum energy decay in a FOPT. In Sec. II, a general overview of FOPTs and the relevant equations are given. In Sec. III, we construct the formalism to calculate the PBH formation probability and abundance. In Sec. IV, the numerical process and results are described. Finally, in Sec. V, we discuss the results and draw conclusions.
II First-Order Phase Transition
We summarize the progression of a FOPT and list out key equations. In the following, we take a phenomenological approach for the FOPT parameters and defined below. Our arguments are largely independent of the underlying model, provided that the phase transition has a strong vacuum energy and slow pace , where is the Hubble expansion rate.
In a FOPT, the Universe is initially in a stable FV state which becomes unstable below the critical temperature (see Refs. Megevand and Ramirez (2017); Kobakhidze et al. (2017); Ellis et al. (2019, 2020); Wang et al. (2020)) and corresponding time . The nucleation rate for true vacuum (TV) bubbles is given by
| (1) |
where is the bounce action of the three- (from thermal fluctuations) or four-dimensional (from quantum tunneling) instanton solution. is the number of bubble nucleations per unit time per unit physical volume in FV regions.
The time dependence of the nucleation rate stems from the temperature dependence of the finite-temperature effective potential. As the temperature varies with time due to the expansion of the Universe and the progression of the phase transition, the effective potential and the corresponding nucleation rate vary accordingly.
The qualitative behavior of the effective potential depends on whether the potential barrier separating the two vacua disappears in a finite temperature below or it persists even in the zero-temperature limit Megevand and Ramirez (2017). As the Universe cools down, the nucleation rate continually increases for the former case. In the latter case, it peaks at some intermediate temperature and subsequently decreases, where only the quantum tunneling can nucleate new bubbles in the zero-temperature limit. The statistics of the postphase transition universe and the completion of the phase transition (having no FV regions) depend on the low-temperature behavior. We discuss this consistency problem in Sec. III.1 and in more detail in Appendix A, by stating the conditions that should be satisfied in order to have a FOPT that successfully ends while producing PBHs by the scenario considered here.
The temperature evolution is complicated by the moderate reheating from the release of latent heat and the differing Hubble rate in a two-component radiation-vacuum universe. The effects of reheating are minor in a weak FOPT with low latent heat. In a strong detonationlike FOPT, the bubble walls move at nearly the speed of light, faster than the sound speed, so the latent heat remains in TV and the nucleation rate in the FV is unaffected. An inhomogeneous Hubble rate arises from the constant energy density in the vacuum-dominated FV regions and the redshifting radiation-dominated TV regions (see Sec. III). However, we neglect this effect as the inhomogeneous expansion rates are not directly relevant to the focus of this paper, and instead use the average energy density to calculate the Hubble rate.
For analytical purposes, the exponential form
| (2) |
is a good approximation when , and the second derivative of is negligible with respect to Megevand and Ramirez (2017) at an arbitrary fixed time . Hereafter, we take , the critical time in which the two vacua become degenerate. The average size of the FV bubbles is related to the bubble wall velocity and by Kawana and Xie (2022); Lu et al. (2022a), which implies that is necessary to have enough horizon-sized FV regions that can collapse into a detectable number of PBHs. For numerical calculations, we consider values of to marginally satisfy both these conditions. Another key parameter is the ratio of the vacuum energy to the plasma energy density , which measures the strength of the FOPT. In this paper, we make an approximation by ignoring the temperature evolution of and let it be a constant after . This corresponds to a situation where only the height of the potential barrier varies, giving Eq. (2), while the vacua energies remain the same. Also, we simply focus on to avoid a long-duration second inflationary phase.
As the phase transition progresses, the volume fraction of the FV region shrinks from at to at , and can be computed by
| (3) |
where
| (4) |
is the comoving size of a bubble nucleated at . Under the constant scale factor approximation or constant Hubble rate approximation during the transition and using the exponential approximation (2), can be analytically solved to be Turner et al. (1992a)
| (5) |
Note that we have approximated when const. Here we see that there are competing effects for PBH production. As detailed in Sec. III, the constant vacuum energy grows in strength to the surrounding plasma at lower temperatures and later times. Conversely, the FV fraction steadily decreases with increasing time, constraining the PBH production to peak at intermediate times.
III PBH Formation Mechanism
In the classical analytic prescription for PBH formation, a PBH forms when horizon-sized perturbations exceed a critical overdensity threshold Musco et al. (2021). The spectrum of curvature perturbations is usually generated during inflation and reenters the horizon after reheating. Here, we consider the scenario outlined in Ref. Liu et al. (2022) in which overdensities are generated stochastically during a FOPT. However, we investigate the formation mechanism in more detail and comment on the different methodologies in this paper and Ref. Liu et al. (2022) in Sec. III.3.
For a moderately strong FOPT , the vacuum energy is a significant component of the overall energy density which even temporarily keeps the Hubble rate constant. This vacuum energy will seed the fluctuations when converted to radiation by the phase transition. Because of the conservation of entropy, the background plasma radiation density redshifts with scale factor as , but the vacuum energy density stays constant. Therefore, regions of FV will have proportionally larger energy densities with increasing time. If the resultant density contrasts are large enough, they gravitationally collapse and PBHs are formed (see Sec. III.1 for detailed PBH formation criterion), whereas deficient overdensities will decay and disappear soon due to the radiation pressure.
In the paper, we focus on the PBHs from horizon-sized overdensities only and discard the subhorizon ones, since the formation criterion for these are not well understood.
III.1 Formation criterion
Here the quantitative criterion for PBH formation is stated. First, we define a time at which the local energy density of a FV point is of the background average density,
| (6) |
where is the Standard Model (SM) plasma energy density that was present before the transition, and is the average total energy density of the Universe (see Sec. IV.1 for more concrete definitions).
Then we use a simple but justified criterion for PBH formation: Any Hubble volume that is entirely covered by FV after time eventually collapses to a PBH. There are a few subtleties excluded by this prescription. First, the value of is applicable only to radiation-dominated plasma and should be scaled according to its effective equation-of-state parameter Musco and Miller (2013) which would be different due to the presence of vacuum energy. Furthermore, the overdensity cannot accumulate and collapse when the horizon is dominated by the FV until it decays into radiation, delaying the growth phase of the perturbation past . However, this delayed growth is offset by the relative increase in the FV energy to the surrounding plasma during this time. These omitted effects tend to cancel and we leave a more in-depth investigation of PBH formation involving numerical simulations to future work.
The horizon-sized FV regions will expand exponentially if they remain intact. This resembles the old inflation scenario, which was abandoned due to the prediction that inflation never ends because the vacuum transition cannot overcome the exponential expansion of FV regions. However, there is one important difference for FOPT: The nucleation rate is not restricted to be much smaller than the Hubble scale and also allowed to increase exponentially as in Eq. (2). So for our scenario to be consistent with the successful completion of a FOPT, the nucleation rate should catch up with the volume expansion rate, making the physical volume of FV decrease Turner et al. (1992b); Kawana (2022). More detailed conditions to achieve this are explained in Appendix A with a numerical demonstration. We are assuming one of the three cases with exponential approximation (2) for the nucleation rate; see the Appendix for more details. Any deviation from our assumption will result in different quantitative results, but the physics of PBH formation is not altered.
III.2 Formation probability
We calculate the time-dependent probability of PBH formation per unit time for any given Hubble volume. We then apply this in Sec. IV to find the PBH mass spectrum and abundance.
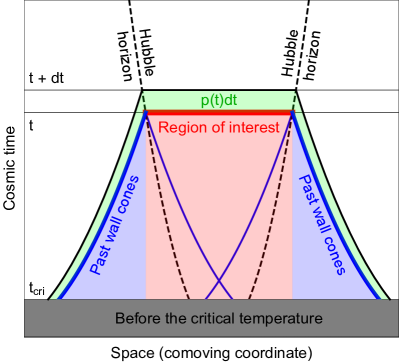
In the following, we use the wall cone formalism developed in Ref. Lu et al. (2022a) with the comoving radius of a TV bubble given by Eq. (4). The wall cone formalism describes the propagation of bubble walls as cones in spacetime, corresponding to light cones only with light speed replaced by wall velocity . A future wall cone coming out from a nucleation point represents the region of TV, while the past wall cone of a spacetime point represents the region for nucleation to put that point in TV.
For a Hubble volume to be entirely in FV at time , (i) there can be no nucleation within the Hubble volume for time and (ii) no nucleation within the past wall cone of the Hubble volume. A nucleation outside the horizon at time can propagate to the Hubble volume if it is less than a distance away. In Fig. 1, we display these three regions in spacetime. The probability represents the transition probability of the Hubble volume between and . We now derive this probability. To streamline the discussion, we use comoving quantities, with the comoving nucleation rate defined as
| (7) |
In an infinitesimal time interval , the probability of no nucleation in an infinitesimal comoving volume is . Summing infinitesimal volumes and taking the limit, the probability of no nucleation within a given comoving volume until the time for each comoving point is
| (8) | |||||
We apply this formula to the transition probability of a given Hubble volume by using the comoving radius from its center
| (9) |
First, each point within the Hubble volume should remain in the FV, implying . This is shown by the red region in Fig. 1. On the other hand, outside the horizon, the past wall cone has ()
| (10) |
where we assume a constant wall velocity , and the maximum comoving radius is denoted by . The corresponding outside region is represented in blue in Fig. 1. If we denote the inverse of Eq. (10) as , each outside point must remain in the FV until . Then, the survival probability of the Hubble volume, or the probability of having no TV up to time , is given by the product of the probabilities of having no nucleation in the horizon itself or in its past wall cone as
| (11) |
The complement is simply the cumulative distribution function of , so the desired transition probability is given by
| (12) |
As previously mentioned, we limit the domain of to so that can be interpreted as the probability density for the onset of PBH collapse. The mass distribution of PBH is determined by the temporal distribution of formation, as the horizon size and the overdensity vary with time. The mass of the PBH is related to the horizon mass at the transition time by
| (13) |
where we choose the numerical prefactor , and is the average energy density (combined radiation and vacuum). If another value of or a different PBH mass relation (e.g., critical collapse; see Sec. IV.2) is used, the mass distribution is simply shifted with little consequence for our purposes. can be converted to the standard PBH formation parameter , which is the fraction of PBH abundance in the Universe at the formation time Carr and Kuhnel (2020); Carr et al. (2021a, 2010). The (physical) number density at the formation of new PBHs for a time interval between and is
| (14) |
giving
| (15) | |||||
where is the entropy density of SM plasma, and both and on the rhs are understood as functions of via Eq. (13). Finally, the PBH energy fraction is given in terms of De Luca et al. (2021) as
| (16) |
with and the horizon mass at matter-radiation equality .
III.3 Comparison with 2106.05637
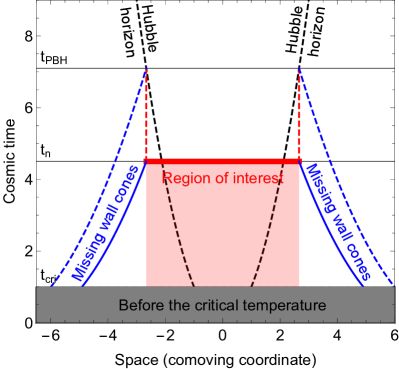
In Liu et al. 2021 Liu et al. (2022), the authors proposed a PBH formation scenario from vacuum energy during a FOPT and provided some estimates of the formation probability and PBH statistics. We elaborate on this mechanism and present improved calculations in this paper using the wall cone approach of Ref. Lu et al. (2022a). We find that Refs. Liu et al. (2022); He et al. (2022) overestimate the PBH abundance. In contrast, although our methods also use analytic simplifications and contain uncertainties, they are more sophisticated and tend to conservatively estimate the formation probability, leading to a lower bound on the PBH abundance. Here we also try to clarify certain points that were implied in the qualitative exposition of Refs. Liu et al. (2022); He et al. (2022).
Although a direct comparison is difficult, the primary difference between these two methods is the past wall cone region that we consider. Our interpretation of the spacetime diagram for Refs. Liu et al. (2022); He et al. (2022) is shown in Fig. 2. Their condition for PBH production requires only delayed nucleation in the Hubble horizon itself, treating each Hubble volume as a separate universe and neglecting TV propagation from the surrounding wall cone. We find numerically that the wall cone region contributes an exponential suppression factor comparable to the contribution from the Hubble volume itself. This would result in much lower production probability and smaller , although production is also exponentially sensitive to FOPT parameters and which can be changed to compensate for the extra suppression. Thus, we conclude that the production mechanism proposed in Ref. Liu et al. (2022) is valid, but we present a modified version and provide some details that we found missing.
IV PBH Abundance Calculation
We numerically evolve the FOPT equations to find the formation probability and energy fraction or . We describe the generic numerical procedure in Sec. IV.1 and show the results in Sec. IV.2.
IV.1 FOPT evolution
During a FOPT, the Universe has two energy components: the vacuum energy of FV and the radiation energy . The FOPT starts at the critical temperature . At this moment, there are only homogeneous SM plasma with energy density and the vacuum energy with density times the former. As the transition progresses, the vacuum energy is converted into kinetic energy for the bubble walls and delivers latent heat into the plasma. The average total energy density is then expressed by
| (17) |
where
| (18) |
is the average vacuum energy density for the FV volume fraction given by Eqs. (3) and (4), and
| (19) |
is the total average radiation energy density, the sum of the SM plasma from the reheating after inflation, the latent heat, and the bubble wall energy. Hereafter, the wall energy is included in as it is subject to the same redshift dependence of Liu et al. (2022) and will release gravitational waves after collisions. evolves as
| (20) |
where the converted vacuum energy goes into the last two terms in Eq. (19), and the Hubble rate is determined by the Friedmann equation
| (21) |
To simplify our calculations, we assumed to be homogeneous, regardless of the local composition of energy contents hence neglecting the backreaction of the inhomogeneous vacuum transition to the expansion rate. Also, we use the exponential form of , Eq. (2), which is marginally valid for our parameter choice of . For even slower phase transitions, which are conducive to forming horizon-sized bubbles, the Gaussian approximation should be used Megevand and Ramirez (2017); however, this may suffer from the consistency problem as explained in Appendix A.
For a given set of FOPT and cosmological parameters, we first perform a numerical evolution of the FOPT to calculate , i.e., Eq. (6). Then, using Eqs. (11) and (12), the transition probability of PBH formation for is calculated. The mass and energy fractions of the corresponding PBH are estimated by Eqs. (13), (15), and (16).
IV.2 Numerical results
| Model | |||||
|---|---|---|---|---|---|
| A | GeV | 2.5 | 1.0 | 1 | |
| B | GeV | 2.5 | 1.0 | 1 | |
| C | GeV | 2.5 | 1.4 | 1 |
As benchmarks, we chose three phenomenological FOPT models summarized in Table 1.111While the nucleation rate starts with at Megevand and Ramirez (2017), we extend the exponential approximation (2) to this point for numerical calculation and take . This value has only little effect on the results. Model A assumes a high-temperature phase transition resulting in light mass PBHs in the mass window for DM. The other two happening at lower temperatures can produce heavier mass PBHs, which can be responsible for the candidate events of the HSC and OGLE experiments.
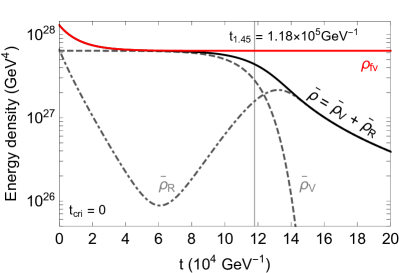
We first display the energy density evolution of model A in Fig. 3, whose behavior is generic to all three models. The average radiation energy density initially falls with increasing scale factor but is subsequently heated up by the decaying FV.222Figure 3 is for the average densities. Locally, FV regions are not reheated as discussed above Eq. (2). The nucleation rate there thus can still be approximated by the exponential form, except for the common deviation by the actual potential shape outlined in Appendix A. The energy density in the FV becomes dominated by as the radiation component redshifts away. During the phase transition, the FV regions become significantly overdense with respect to the average density at .
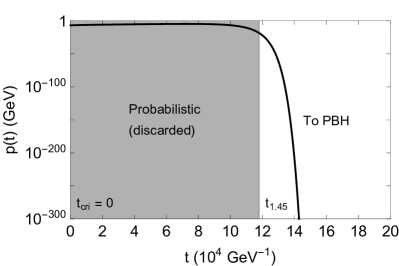
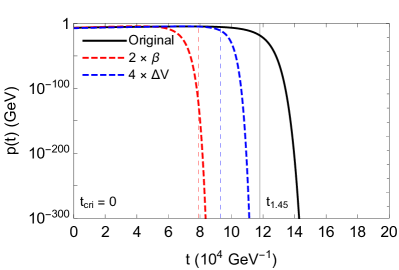
If the onset of the phase transition in a Hubble volume occurs after this time, then the overdensity there will tend to grow until the FV regions are depleted so that PBH formation is almost certain. We show the PBH-producing tail of the probability density distribution in Fig. 4, and the discarded region where PBH formation is unlikely. It is possible for some Hubble volumes near the boundary that begin transitioning at to have by the time the phase transition culminates. However, we discard these “probabilistic” regions to provide a conservative estimate on the PBH abundance.
In the bottom panel of Fig. 4, we show the effect of changing the FOPT parameters , which determines the timescale of the FOPT, and or the vacuum energy density (with fixed). Faster phase transitions (larger ) result in earlier TV nucleation and exponentially suppressed PBH production. Alternatively, the average size of the FV pockets is inversely proportional to Kawana and Xie (2022); Lu et al. (2022a), so that there are fewer horizon-sized ones. Naturally, stronger phase transitions (larger ) result in larger overdensities between FV regions with energy density and the background facilitating PBH formation. All these effects exponentially impact and dominate the final PBH abundance.
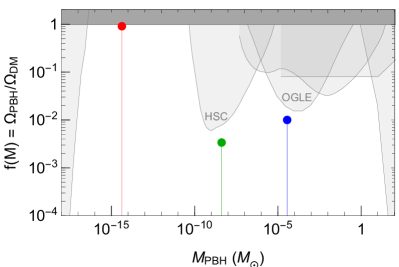
We show the PBH distribution of the three models in Fig. 5. The survival probability drops sharply after , and the scaling can be obtained from Eq. (24) with replaced by and Eq. (12). We have numerically confirmed this behavior in Fig. 4. Combined with the mass relation Eq. (13), the resulting PBH distributions are sharply peaked and resemble Dirac delta functions . However, the actual mass function would be slightly broadened to lower mass ranges if critical collapse is considered Choptuik (1993); Koike et al. (1995); Niemeyer and Jedamzik (1998), modifying Eq. (13). The variation of of a Hubble volume after the transition time depending on the internal progression of phase transition would be responsible for it.
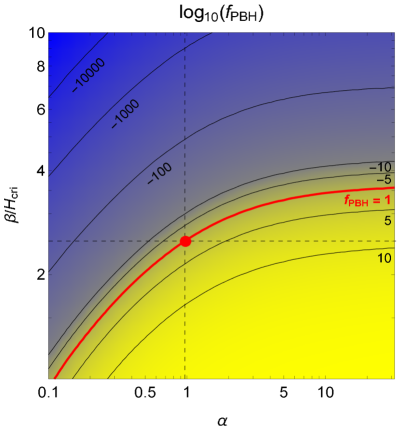
We further explore the parameter space of and and show the PBH abundance in Fig. 6 using model A as a reference. As a whole, we see that the abundance increases with and decreases with , as expected from the behavior of in Fig. 4 and also the physical considerations. The dependence is stronger for than , and the dependence is even more suppressed for . The dependence becomes saturated by resulting in the same vacuum-dominated universe, hence the same FOPT progression for fixed and ; see also Gouttenoire and Volansky (2023). These scaling behaviors correspond with our semianalytic analysis in Appendix B.
Because of the exponential dependence of the PBH fraction on these input parameters, only a very narrow parameter region near the red contour with is practically viable to produce DM. On the other hand, from a phenomenological point of view, any reasonable PBH mass and fraction can be generated in this scenario by changing the model parameters.
V Discussion
In this paper, we presented a thorough calculation of the PBH mass distribution function arising from vacuum energy decay in a FOPT. We examined the condition of Ref. Liu et al. (2022) for a Hubble volume to be entirely in the FV, and found that the surrounding wall cone was neglected. This omitted factor was found numerically to be of similar magnitude to the primary contribution of the Hubble volume itself and can therefore result in significant suppression of the PBH abundance.
Through our numerical simulations, we generated PBH populations that make up all of DM in the PBH mass window and that can originate the candidate HSC and OGLE microlensing events. Although we included the additional term and have a slightly different formalism, our results generally agreed with those of Ref. Liu et al. (2022). Because of the sensitive dependence of the PBH abundance on the FOPT parameters, the extra suppression we found can be compensated by a modest change in parameters.
The PBH formation probability and the resulting abundance are exponentially sensitive to FOPT speed and strength . Among them, the dependence on was shown to be exceedingly strong, while the dependence on was relatively mild, and further suppressed for . These are supported by semianalytic analysis, and they also align with intuition. For horizon-sized perturbations to survive late into the FOPT, small is needed as it determines the timescale of the phase transition and is inversely proportional to the bubble size Kawana and Xie (2022); Lu et al. (2022a). Naturally, small values of the vacuum energy suppress PBH formation and large values increase the formation rate, but make no further difference once a fully vacuum-dominated universe is reached.
Altogether, the PBH formation from horizon-sized vacuum decay is a viable and versatile scenario and can apply to a generic FOPT in beyond the Standard Model physics. Phenomenologically, setting the critical time/temperature determines the PBH mass, and minor changes in the FOPT parameters can produce the desired PBH mass function. We found that significant production of PBH occurs in phase transitions that are slow and moderately strong.
ACKNOWLEDGMENTS
The work of K. K. is supported by KIAS Individual Grants, Grant No. 090901. The work of T. H. K. is supported by a KIAS Individual Grant No. PG095201 at Korea Institute for Advanced Study and National Research Foundation of Korea under Grant No. NRF-2019R1C1C1010050. The work of P. L. is supported by National Research Foundation of Korea under Grant No. NRF-2019R1C1C1010050. We thank Hyung Do Kim, Wan-Il Park, Dhong Yeon Cheong, Gansukh Tumurtushaa, Masahide Yamaguchi, Chang Sub Shin, and Alexander Kusenko for constructive comments which helped improve the paper.
Appendix A Consistency check for completion of FOPT
Here we show that our scenario is generically consistent with the completion of FOPT. We first discuss several options for completing a FOPT with (super)horizon-sized FV regions at , and then present a numerical demonstration under a simplified treatment.
The major concern is that the horizon-sized FV regions soon become vacuum energy dominated and undergo a de Sitter expansion, starting a second inflation that resembles the old inflation scenario. Since the latter was abandoned due to the failure of the graceful exit, we must also check whether these FV regions do not harm the completion of FOPT.
We first state that just having a de Sitter expanding FV region does not necessarily mean a never-ending inflation. The precise reason that the old inflation was unsuccessful is that the constant nucleation rate was restricted to be much smaller than in order to solve the horizon and the flatness problems. This turned out to be incompatible with the completion of the vacuum transition and thermalization Guth and Weinberg (1983). Here in our scenario, no such restriction applies and we can have much higher nucleation rates during the phase transition. If the nucleation rate is high enough, the bubble nucleation and growth can overcome the volume expansion of FV so that the physical FV volume decreases to zero and the phase transition ends Turner et al. (1992b); Kawana (2022).
To clarify, assume a simplified situation of a de Sitter expanding background with constant and a constant nucleation rate . The physical FV volume is , so its decrement requires
| (22) |
which is, for constant and ,
| (23) |
Thus, even a quite slow FOPT can complete while having horizon-sized FV regions if the nucleation rate in those regions is higher than about .
Then the question comes down to how high the nucleation rates in the FV regions can be after passing . This is determined by the temperature dependence of the effective potential as discussed in Sec. II. If the barrier disappears at some finite temperature, the nucleation rate in FV regions keeps increasing, and hence there is no problem in finishing the phase transition; after the barrier disappears, the phase transition becomes second order and ends through spinodal decomposition. On the other hand, if the barrier persists in the zero-temperature limit, the nucleation rate by thermal fluctuation decreases to zero. Then nucleation can only occur through quantum tunneling, and it is likely that the phase transition never ends, resulting in a second inflationary phase.
Typically, the latter case does not pose a serious problem because the remaining FV regions are fragmented into subhorizon sizes before the nucleation rate becomes too small. These regions are totally converted into TV by the bubble walls approaching from outside, instead of relying on bubble nucleations inside. However, as our scenario requires having horizon-sized FV regions at least until , we need a stronger condition to have a consistent scenario.
In conclusion, there are generically three ways to have completion of FOPT within our scenario. First, if the effective potential gives the bubble nucleation rate that keeps increasing with decreasing temperature, the FOPT will finish without any problem. The exponential approximation we take (2) in our study corresponds to this case. Second, even if the nucleation rate peaks and decreases it is still possible to have a high enough nucleation rate after so that all the horizon-sized FV regions are dismantled into subhorizon pieces before the nucleation rate becomes too small. The third option is to have a sufficiently high quantum tunneling rate that can finish the FOPT even at zero temperature.
The actual nucleation rates in these three cases will have deviations from the simple analytic exponential approximation in Eq. (2), although more realistic forms of the nucleation rate for the current scenario are left to future studies.
In the rest of this appendix, we numerically demonstrate the decrease of physical FV volume after for the first option in a simplified setup. We regard the FV region at as a separate universe and assume it undergoes a de Sitter expansion with the Hubble rate coming from the vacuum energy density . These are quite good approximations for horizon-sized FV regions, as they are vacuum dominated and the bubble walls from outside cannot entirely cover them. The exponential approximation (2) is used for the nucleation rate.
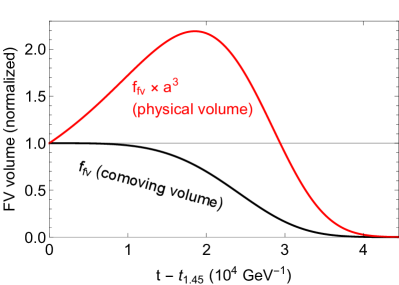
In Fig. 7, we plot and for the separated universe corresponding to a FV region at with the same parameters as in Fig. 3. We see that the physical volume of the FV initially increases due to the volume expansion, but it soon rapidly decreases due to the nucleation and growth of TV bubbles. The nucleation rate at is already about due to the exponential growth from , and even keeps increasing further. Referring to Eq. (23), this nucleation rate is sufficient to convert all the remaining FV regions soon after the nucleation begins.
We also note that this large nucleation rate at late times is one of the two reasons why the survival probability [or as its differential] is suppressed as depicted in Fig. 4. The other reason is of course the wall cone contribution in Fig. 1. This tiny probability is compensated by the cosmological expansion during the radiation-dominated epoch, where the radiation density redshifts while the PBH only undergoes a number density dilution . Because of this effect, the small fraction of horizons that have delayed transitions in the early Universe can contribute significantly to in the present day.
Appendix B Semianalytic analysis of PBH formation probability
We derive the qualitative dependence of the PBH formation probability on the FOPT parameters and , and confirm the agreement to the intuitive expectations while also supporting our numerical results in Sec. IV.2. As the actual PBH formation in this model is exponentially sensitive to the parameters, the quantitatively correct probabilities and resultant abundances need to be numerically computed as in the main text.
Here we focus on the formation probability (Fig. 4), as this is the main point of our calculation; analytic expressions of and follow directly from Eqs. (12), (15), and (16). We approximate the integrated formation probability as simply the survival probability , since the majority of the PBH production occurs at [see the rapidly dropping curves of in Fig. 4]. Furthermore, it is sufficient to consider only the first exponent in Eq. (11) for our purposes since the behavior of the second exponent is similar (see Fig. 1).
As can be seen in Fig. 3, the average energy density stays approximately constant before . This is generically true in our scenario, as the vacuum energy necessarily becomes dominant over the SM plasma. Then as the FV energy is converted into latent heat, the average density will decline to a value by . Thus, the average density and the Hubble rate [Eq. (21)] are approximately constant for as , and hence, .
Then in this constant Hubble rate approximation, the first exponent of Eq. (11) is (we calibrate by setting hereafter)
| (24) | |||||
where the subscript HV denotes the Hubble volume only (excluding the wall cone contribution) and , . Since , only the behavior of remains to be figured out.
To see how it scales, we use Eqs. (6) and (17)-(20). First, integrating Eq. (20) with Eqs. (18) and (19) gives
| (25) |
Then substituting Eqs. (17) and (25) into Eq. (6) and eliminating by gives
| (26) |
where represents the average redshift of the transitioned vacuum energy defined by
| (27) |
From the constant Hubble rate approximation in Eq. (II),
| (28) |
From Eq. (26), we extract the variation of with and . Then we use Eq. (28) to solve for as a function of and determine the behavior of in Eq. (24).
We first examine the dependence on . Faster phase transitions with larger have smaller , which results in less redshifting and greater .333While not mathematically clear, it is physically reasonable, and we also numerically checked for all three cases in Table 1, with varying by times. The FV fraction at formation, , decreases to satisfy Eq. (26) and lower the background energy density.444At linear order, the variation of the lhs in Eq. (26) gives . Since , means to maintain Eq. (26); note that the second term containing also increases. Equation (28) then demands to greatly increase to get over the denominator. Solving for it gives the scaling of . Since itself decreases with increasing , using this relation in Eq. (24) shows that decreases rapidly, faster than negative exponential of powers of .
On the other hand, Eq. (26) shows that larger results in larger ,555Similar to the previous case, this is not mathematically clear but physically reasonable since the critical density contrast will be reached in the earlier stage of FOPT. We checked this numerically too. but the effect is suppressed by the exponential factor and itself. Furthermore, Eqs. (24) and (28) show no explicit dependence as long as and are fixed. Therefore, increases with , but the effect is suppressed if keeps growing.
These behaviors are depicted in the bottom panel of Fig. 4 and Fig. 6. Increasing drastically lowers and hence . Increasing gives larger and but relatively mildly. Clearly, these agree with the rule of thumb expectations: The faster the phase transition, the less time for the redshift to generate density contrast, so PBH formation probability decreases with ; greater vacuum energy (the source of density contrast) over the homogeneous SM radiation always facilitates the PBH production, so the probability increases with , but asymptotes at large values of corresponding to a vacuum-dominated universe.
References
- Carr and Kuhnel (2020) B. Carr and F. Kuhnel, Ann. Rev. Nucl. Part. Sci. 70, 355 (2020), arXiv:2006.02838 [astro-ph.CO] .
- Carr et al. (2021a) B. Carr, K. Kohri, Y. Sendouda, and J. Yokoyama, Rept. Prog. Phys. 84, 116902 (2021a), arXiv:2002.12778 [astro-ph.CO] .
- Carr et al. (2010) B. J. Carr, K. Kohri, Y. Sendouda, and J. Yokoyama, Phys. Rev. D 81, 104019 (2010), arXiv:0912.5297 [astro-ph.CO] .
- Nakamura et al. (1997) T. Nakamura, M. Sasaki, T. Tanaka, and K. S. Thorne, Astrophys. J. Lett. 487, L139 (1997), arXiv:astro-ph/9708060 .
- Bird et al. (2016) S. Bird, I. Cholis, J. B. Muñoz, Y. Ali-Haïmoud, M. Kamionkowski, E. D. Kovetz, A. Raccanelli, and A. G. Riess, Phys. Rev. Lett. 116, 201301 (2016), arXiv:1603.00464 [astro-ph.CO] .
- Cotner and Kusenko (2016) E. Cotner and A. Kusenko, Phys. Rev. D 94, 123006 (2016), arXiv:1609.00970 [hep-ph] .
- Cotner and Kusenko (2017) E. Cotner and A. Kusenko, Phys. Rev. D 96, 103002 (2017), arXiv:1706.09003 [astro-ph.CO] .
- Raidal et al. (2017) M. Raidal, V. Vaskonen, and H. Veermäe, JCAP 09, 037 (2017), arXiv:1707.01480 [astro-ph.CO] .
- Eroshenko (2018) Y. N. Eroshenko, J. Phys. Conf. Ser. 1051, 012010 (2018), arXiv:1604.04932 [astro-ph.CO] .
- Sasaki et al. (2016) M. Sasaki, T. Suyama, T. Tanaka, and S. Yokoyama, Phys. Rev. Lett. 117, 061101 (2016), [Erratum: Phys.Rev.Lett. 121, 059901 (2018)], arXiv:1603.08338 [astro-ph.CO] .
- Clesse and García-Bellido (2017) S. Clesse and J. García-Bellido, Phys. Dark Univ. 18, 105 (2017), arXiv:1610.08479 [astro-ph.CO] .
- Cotner et al. (2018) E. Cotner, A. Kusenko, and V. Takhistov, Phys. Rev. D 98, 083513 (2018), arXiv:1801.03321 [astro-ph.CO] .
- Cotner et al. (2019) E. Cotner, A. Kusenko, M. Sasaki, and V. Takhistov, JCAP 10, 077 (2019), arXiv:1907.10613 [astro-ph.CO] .
- Flores and Kusenko (2021a) M. M. Flores and A. Kusenko, Phys. Rev. Lett. 126, 041101 (2021a), arXiv:2008.12456 [astro-ph.CO] .
- Flores and Kusenko (2021b) M. M. Flores and A. Kusenko, (2021b), arXiv:2108.08416 [hep-ph] .
- Flores and Kusenko (2021c) M. M. Flores and A. Kusenko, Phys. Rev. D 104, 063008 (2021c), arXiv:2106.03237 [astro-ph.CO] .
- Wang et al. (2023) X. Wang, Y.-l. Zhang, R. Kimura, and M. Yamaguchi, Sci. China Phys. Mech. Astron. 66, 260462 (2023), arXiv:2209.12911 [astro-ph.CO] .
- Bean and Magueijo (2002) R. Bean and J. Magueijo, Phys. Rev. D 66, 063505 (2002), arXiv:astro-ph/0204486 .
- Kawasaki et al. (2012) M. Kawasaki, A. Kusenko, and T. T. Yanagida, Phys. Lett. B 711, 1 (2012), arXiv:1202.3848 [astro-ph.CO] .
- Clesse and García-Bellido (2015) S. Clesse and J. García-Bellido, Phys. Rev. D 92, 023524 (2015), arXiv:1501.07565 [astro-ph.CO] .
- Niikura et al. (2019a) H. Niikura et al., Nat. Astron. 3, 524 (2019a), arXiv:1701.02151 [astro-ph.CO] .
- Niikura et al. (2019b) H. Niikura, M. Takada, S. Yokoyama, T. Sumi, and S. Masaki, Phys. Rev. D 99, 083503 (2019b), arXiv:1901.07120 [astro-ph.CO] .
- Carr and Hawking (1974) B. J. Carr and S. W. Hawking, Mon. Not. Roy. Astron. Soc. 168, 399 (1974).
- Carr (1975) B. J. Carr, Astrophys. J. 201, 1 (1975).
- Crawford and Schramm (1982) M. Crawford and D. N. Schramm, Nature 298, 538 (1982).
- Hawking et al. (1982) S. W. Hawking, I. G. Moss, and J. M. Stewart, Phys. Rev. D 26, 2681 (1982).
- La and Steinhardt (1989) D. La and P. J. Steinhardt, Phys. Lett. B 220, 375 (1989).
- Moss (1994) I. G. Moss, Phys. Rev. D 50, 676 (1994).
- Konoplich et al. (1998) R. Konoplich, S. Rubin, A. Sakharov, and M. Y. Khlopov, Astronomy Letters 24, 413 (1998).
- Konoplich et al. (1999) R. V. Konoplich, S. G. Rubin, A. S. Sakharov, and M. Y. Khlopov, Phys. Atom. Nucl. 62, 1593 (1999).
- Kodama et al. (1982) H. Kodama, M. Sasaki, and K. Sato, Prog. Theor. Phys. 68, 1979 (1982).
- Lewicki and Vaskonen (2020) M. Lewicki and V. Vaskonen, Phys. Dark Univ. 30, 100672 (2020), arXiv:1912.00997 [astro-ph.CO] .
- Kusenko et al. (2020) A. Kusenko, M. Sasaki, S. Sugiyama, M. Takada, V. Takhistov, and E. Vitagliano, Phys. Rev. Lett. 125, 181304 (2020), arXiv:2001.09160 [astro-ph.CO] .
- Animali and Vennin (2023) C. Animali and V. Vennin, JCAP 02, 043 (2023), arXiv:2210.03812 [astro-ph.CO] .
- Jedamzik and Niemeyer (1999) K. Jedamzik and J. C. Niemeyer, Phys. Rev. D 59, 124014 (1999), arXiv:astro-ph/9901293 .
- Musco and Miller (2013) I. Musco and J. C. Miller, Class. Quant. Grav. 30, 145009 (2013), arXiv:1201.2379 [gr-qc] .
- Byrnes et al. (2018) C. T. Byrnes, M. Hindmarsh, S. Young, and M. R. S. Hawkins, JCAP 08, 041 (2018), arXiv:1801.06138 [astro-ph.CO] .
- Jedamzik (1998) K. Jedamzik, Phys. Rept. 307, 155 (1998), arXiv:astro-ph/9805147 .
- Jedamzik (2021) K. Jedamzik, Phys. Rev. Lett. 126, 051302 (2021), arXiv:2007.03565 [astro-ph.CO] .
- Carr et al. (2021b) B. Carr, S. Clesse, J. García-Bellido, and F. Kühnel, Phys. Dark Univ. 31, 100755 (2021b), arXiv:1906.08217 [astro-ph.CO] .
- Carr et al. (2021c) B. Carr, S. Clesse, and J. García-Bellido, Mon. Not. Roy. Astron. Soc. 501, 1426 (2021c), arXiv:1904.02129 [astro-ph.CO] .
- Dolgov and Postnov (2020) A. Dolgov and K. Postnov, JCAP 07, 063 (2020), arXiv:2004.11669 [astro-ph.CO] .
- Franciolini et al. (2022) G. Franciolini, I. Musco, P. Pani, and A. Urbano, Phys. Rev. D 106, 123526 (2022), arXiv:2209.05959 [astro-ph.CO] .
- Juan et al. (2022) J. I. Juan, P. D. Serpico, and G. Franco Abellán, JCAP 07, 009 (2022), arXiv:2204.07027 [astro-ph.CO] .
- Lu et al. (2023) P. Lu, V. Takhistov, and G. M. Fuller, Phys. Rev. Lett. 130, 221002 (2023), arXiv:2212.00156 [astro-ph.CO] .
- Gross et al. (2021) C. Gross, G. Landini, A. Strumia, and D. Teresi, JHEP 09, 033 (2021), arXiv:2105.02840 [hep-ph] .
- Baker et al. (2021a) M. J. Baker, M. Breitbach, J. Kopp, and L. Mittnacht, (2021a), arXiv:2105.07481 [astro-ph.CO] .
- Baker et al. (2021b) M. J. Baker, M. Breitbach, J. Kopp, and L. Mittnacht, (2021b), arXiv:2110.00005 [astro-ph.CO] .
- Kawana and Xie (2022) K. Kawana and K.-P. Xie, Phys. Lett. B 824, 136791 (2022), arXiv:2106.00111 [astro-ph.CO] .
- Marfatia and Tseng (2022) D. Marfatia and P.-Y. Tseng, JHEP 08, 001 (2022), [Erratum: JHEP 08, 249 (2022)], arXiv:2112.14588 [hep-ph] .
- Huang and Xie (2022) P. Huang and K.-P. Xie, Phys. Rev. D 105, 115033 (2022), arXiv:2201.07243 [hep-ph] .
- Davoudiasl et al. (2022) H. Davoudiasl, P. B. Denton, and J. Gehrlein, Phys. Rev. Lett. 128, 081101 (2022), arXiv:2109.01678 [astro-ph.CO] .
- Jung and Okui (2021) T. H. Jung and T. Okui, (2021), arXiv:2110.04271 [hep-ph] .
- Hashino et al. (2022) K. Hashino, S. Kanemura, and T. Takahashi, Phys. Lett. B 833, 137261 (2022), arXiv:2111.13099 [hep-ph] .
- Maeso et al. (2021) D. N. Maeso, L. Marzola, M. Raidal, V. Vaskonen, and H. Veermäe, (2021), arXiv:2112.01505 [astro-ph.CO] .
- Lu et al. (2022a) P. Lu, K. Kawana, and K.-P. Xie, Phys. Rev. D 105, 123503 (2022a), arXiv:2202.03439 [astro-ph.CO] .
- Kawana (2022) K. Kawana, Phys. Rev. D 105, 103515 (2022), arXiv:2201.00560 [hep-ph] .
- Lu et al. (2022b) P. Lu, K. Kawana, and A. Kusenko, (2022b), arXiv:2210.16462 [astro-ph.CO] .
- Kawana et al. (2022) K. Kawana, P. Lu, and K.-P. Xie, JCAP 10, 030 (2022), arXiv:2206.09923 [astro-ph.CO] .
- Liu et al. (2022) J. Liu, L. Bian, R.-G. Cai, Z.-K. Guo, and S.-J. Wang, Phys. Rev. D 105, L021303 (2022), arXiv:2106.05637 [astro-ph.CO] .
- He et al. (2022) S. He, L. Li, Z. Li, and S.-J. Wang, (2022), arXiv:2210.14094 [hep-ph] .
- Megevand and Ramirez (2017) A. Megevand and S. Ramirez, Nucl. Phys. B 919, 74 (2017), arXiv:1611.05853 [astro-ph.CO] .
- Kobakhidze et al. (2017) A. Kobakhidze, C. Lagger, A. Manning, and J. Yue, Eur. Phys. J. C 77, 570 (2017), arXiv:1703.06552 [hep-ph] .
- Ellis et al. (2019) J. Ellis, M. Lewicki, and J. M. No, JCAP 04, 003 (2019), arXiv:1809.08242 [hep-ph] .
- Ellis et al. (2020) J. Ellis, M. Lewicki, and J. M. No, JCAP 07, 050 (2020), arXiv:2003.07360 [hep-ph] .
- Wang et al. (2020) X. Wang, F. P. Huang, and X. Zhang, JCAP 05, 045 (2020), arXiv:2003.08892 [hep-ph] .
- Turner et al. (1992a) M. S. Turner, E. J. Weinberg, and L. M. Widrow, Phys. Rev. D 46, 2384 (1992a).
- Musco et al. (2021) I. Musco, V. De Luca, G. Franciolini, and A. Riotto, Phys. Rev. D 103, 063538 (2021), arXiv:2011.03014 [astro-ph.CO] .
- Turner et al. (1992b) M. S. Turner, E. J. Weinberg, and L. M. Widrow, Phys. Rev. D 46, 2384 (1992b).
- De Luca et al. (2021) V. De Luca, G. Franciolini, and A. Riotto, Phys. Rev. Lett. 126, 041303 (2021), arXiv:2009.08268 [astro-ph.CO] .
- Choptuik (1993) M. W. Choptuik, Phys. Rev. Lett. 70, 9 (1993).
- Koike et al. (1995) T. Koike, T. Hara, and S. Adachi, Phys. Rev. Lett. 74, 5170 (1995), arXiv:gr-qc/9503007 .
- Niemeyer and Jedamzik (1998) J. C. Niemeyer and K. Jedamzik, Phys. Rev. Lett. 80, 5481 (1998), arXiv:astro-ph/9709072 .
- Gouttenoire and Volansky (2023) Y. Gouttenoire and T. Volansky, (2023), arXiv:2305.04942 [hep-ph] .
- Guth and Weinberg (1983) A. H. Guth and E. J. Weinberg, Nucl. Phys. B 212, 321 (1983).