Forecasting the El Niño type well before the spring predictability barrier
The El Niño Southern Oscillation (ENSO) is the most important driver of interannual global climate variability and can trigger extreme weather events and disasters in various parts of the globe. Depending on the region of maximal warming, El Niño events can be partitioned into 2 types, Eastern Pacific (EP) and Central Pacific (CP) events. The type of an El Niño has a major influence on its impact and can even lead to either dry or wet conditions in the same areas on the globe. Here we show that the zonal difference between the sea surface temperature anomalies (SSTA) in the equatorial western Pacific and central Pacific gives an early indication of the type of an upcoming El Niño: When at the end of a year, is positive, an event in the following year will be probably an EP event, otherwise a CP event. Between 1950 and present, 3/4 of the EP forecasts and all CP forecasts are correct. When combining this approach with a previously introduced climate-network approach, we obtain reliable forecasts for both the onset and the type of an event: at a lead time of about one year, 2/3 of the EP forecasts and all CP forecasts in the regarded period are correct. The combined model has considerably more predictive power than the current operational type forecasts with a mean lead time of about 1 month and should allow early mitigation measures.
Significance statement: El Niño events represent anomalous episodic warmings, which can peak in the equatorial Central Pacific (CP events) or Eastern Pacific (EP events). Both types of events can have adverse and devastating impacts around the globe. Currently, robust operational type forecasts have a mean lead time of about 1 month. Here we show that the difference of the sea surface temperature anomalies between the equatorial western and central Pacific in December enables an early forecast of the type of an upcoming El Niño. Combined with a previously introduced climate network-based approach, both the onset and type of an upcoming El Niño can be efficiently forecasted. The lead time is about 1y and should allow early mitigation measures.
El Niño events are part of the El Niño-Southern Oscillation (ENSO) [3, 4, 2, 5, 6, 7], which can be perceived as a self-organized quasi-periodic pattern in the tropical Pacific ocean-atmosphere system, featured by rather irregular warm (“El Niño”) and cold (“La Niña”) excursions from the long-term mean state. Depending on the location of the peak warming of the SSTA, one usually distinguishes between Eastern Pacific (EP) and Central Pacific (CP) El Niño events. The EP events exhibit their largest SSTA warming in the eastern equatorial Pacific, while the CP events exhibit their largest warming westwards in the central equatorial Pacific. The shift of the location of the maximum SSTA during CP El Niños, compared to EP El Niños, towards the central Pacific drives substantial shifts in atmospheric convection and circulation responses, which alter the location and intensity of temperature and precipitation impacts associated with El Niño around the globe [8, 9, 10, 11, 12, 13, 15, 14, 16].
Large EP events typically lead to strongly increased precipitation along the coast of Ecuador and Northern Peru, resulting in massive floodings and landslides, while CP events only lead to dry conditions in these already dry areas and also to dryer conditions in the Peruvian Andes (see, e.g., [17, 18]). In India, particularly, CP events may lead to monsoon failures and thus to major droughts [19]. For more extensive discussions of the impacts of both El Niño types, we refer to, e.g., [9, 10, 16].
These examples demonstrate that for mitigating the societal impact of an El Niño event by more targeted mitigation measures, it is crucial to have early operational forecasts not only for the event itself but also for the type of the event. Currently, this is not the case. For instance, Hendon et al. [20] found that the coupled ocean-atmosphere seasonal forecast model of the Australian Bureau of Meteorology is limited to less than 1 season in predicting the SSTA pattern of EP and CP events. In a more recent and comprehensive study, Ren et al. [21] analyzed 6 operational climate models and found that only 2-3 can distinguish at 1 month lead time between CP and EP events. Zhang et al. [22] focused on hindcasts of the Climate Forecast System version 2 (CFSv2). They found that the skill of the CFSv2 model was comparable to the one reported by Ren et al. [21] and concluded that the CFSv2 model was broadly representative of the state-of-the-art forecast systems.
For comparison, without distinction between CP and EP events, the current forecasts in operation (which are limited by the spring barrier) have a maximum lead time of about 6 months [23, 7]. Forecasts based on a climate network [24, 25, 26] approach have a lead time of about 1 year (see also Data and Methods Section) [27, 28].
In the present study, we consider the period between 1950 and present, where reliable data on the El Niño events exist. We show that from the available SSTA data in the tropical Pacific, a precursor for CP and EP events can be obtained about 1 year before the peak of the event with high prediction skill. When combined either with the conventional forecasts in operation or the recently established climate network approach, one arrives at significantly better forecasts for the type of an El Niño event, with the same lead time as the conventional or the network approaches, respectively.
Classification of the El Niño types
To identify the types of the 23 El Niño events between 1950 and present (here, the El Niño events from 1986-1988 and 2014-2016 are counted as 1 event each), we have used 11 classification approaches [8, 9, 29, 30, 31, 32, 33, 34, 35, 36, 37]. Most of these approaches rely on compressing/projecting the diverse spatial SSTA patterns in the tropical Pacific into simple scalar numbers, i.e., indices. The choice of which geographical areas, times of the year, or physical quantities to regard and how to analyze the data leads to a large set of possible indices. Figure 1 summarizes the classification according to the 11 methods. For details, see the SI. For the majority of El Niño events, in particular the strong ones, there is a high consensus about the type irrespective of the approach. For the events in 1969/70 and 1986-1988, there is lacking consensus, so we keep them as unidentified. For more details, see the SI.

Precursor for the type of the next El Niño event
Due to the mostly easterly winds of the Walker circulation, the climatological background state of the equatorial Pacific is characterized by a temperature gradient from the cold tongue in the east to the warm pool in the west. Accordingly, the simplest conceptual models of ENSO, for instance, the recharge-oscillator model developed by Jin [38], divide the Pacific into two regions, the western Pacific and the eastern Pacific. The models are able to describe the occurrence of the canonical EP events but not of CP events [39].
Since CP El Niños are located in the central Pacific, it appears natural to extend the two-region conceptional models by including the central Pacific as a third region. This region is important for the development of CP events since the zonal advective feedback is most effective here [40, 39]. Such three-region models were developed by Fang and Mu [39] and Chen et al. [41] and indeed allow for the occurrence of both EP and CP events [41]. Within their model, Chen et al. [41] found that on decadal scales the frequency of CP events depended particularly on the SST gradient between the western and central Pacific (which is directly related to the zonal advective feedback and highly correlated with the strength of the Walker circulation). This suggests that the occurrence of CP events may be related to the zonal SST difference between the western and central Pacific.
Here we follow this idea and study the temporal fluctuations of the zonal temperature difference between the western Pacific and central Pacific. We want to find out whether there are precursor phenomena that can be used to forecast the type of the next El Niño well before its onset.
To be specific, we consider the monthly zonal SSTA difference between two equal-sized areas in the west Pacific (120E-165E, 5N-5S) and the central Pacific (165E-150W, 5N-5S) (see Fig. 2). The width of both areas is identical to the widths of the Niño3, Niño4 and Niño3.4 areas. The CP area nearly coincides with the Niño4 area. To account for the different effects of climate change in both regions, we use a trailing 30 y climatology, i.e., we calculate the temperature anomalies based only on the past of the considered point in time.
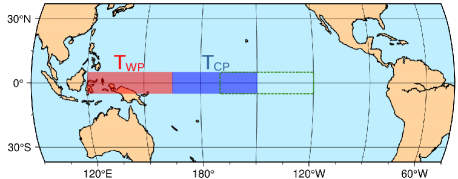

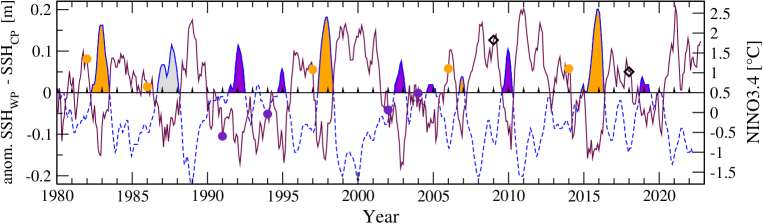
Figure 3 shows the difference between the mean SSTA in both areas, as a function of time (maroon line), starting in 1950 and ending at present. The blue line is the Oceanic Niño Index (ONI), which is defined as the three-month running-mean SSTA in the Niño3.4 region (see Fig. 2). The filled areas mark the El Niño events where the ONI is at least for 5 months greater or equal 0.5°C. The orange color stands for the 9 EP El Niño events, the violet color for the 12 CP events, obtained from our consensus classification. For the El Niño events starting in 1969 and the event starting in 1986 and ending in 1988, there is no consensus, so they are marked gray.
There are two observations on the time evolution of : (i) looks like the mirror image of the ONI, running through deep minima right at the peak of an El Niño event and reaching strong maxima in pronounced La Niña events. (ii) In the last months of a year preceding an El Niño onset, tends to be positive when the upcoming event is an EP event and negative when it is a CP event. In the following, we will use this feature as a precursor for the type of an upcoming El Niño, with a lead time of about 1 y.
To be specific, we focus on the December values of for each year between 1950 and 2021. When a December value is positive, we expect that an upcoming El Niño will be an EP event, otherwise a CP event. Figure 3 shows that all 9 EP El Niño events are correctly forecasted by this precursor. There are 3 “false alarms”, in 1962, 2008, and 2017, where an EP event is forecasted, but a CP event is observed in the following year. In contrast, all 9 CP forecasts were correct. Accordingly, when is negative in December, we can be highly certain that an upcoming event will be a CP event, i.e., a possibly disastrous EP event in the following year can be excluded with high probability. Otherwise, when is positive in December, an upcoming El Niño will be an EP event with 75 percent probability. In October 2022, . It seems unlikely that will fall below zero in the next 2 months. Thus, should an El Niño start in 2023, it probably will be an EP event.
In total, 18 out of 21 events were correctly forecasted. When random guessing with the past occurrence probabilities of EP and CP El Niño events, the -value for correctly predicting 18 of 21 events is , i.e., the predictions by our precursor are highly significant.
Apart from the zonal SSTA difference, the zonal sea surface height anomaly (SSHA) difference and the zonal surface air temperature anomaly difference are strongly related to the Walker circulation and its fluctuations. Figure 4 shows the difference of the monthly SSHAs between 1980 and present. The figure shows that the SSHA is highly correlated with the SSTA and leads to the same forecasts. As we show in the SI (SI Fig. 5), the surface air temperature anomalies are also highly correlated with the SSTA and lead to the same forecasting performance.
We like to note that our findings are consistent with Ashok et al. [9], where correlation maps for the El Niño Modoki Index (EMI) with the SSHA and SSTA in the tropical Pacific have been calculated.
Forecasting El Niño events and their type
The precursor is most useful when combined with other methods that forecast the onset of an El Niño event, irrespective of its type (see, e.g., [42, 43, 44, 45, 46, 47, 48, 49, 50, 51, 52, 53, 54, 55, 56, 57]). For simplicity, we discuss here two kinds of forecast:
A. Conventional forecasts. Coupled general circulation models (GCM) are initialized by observations and directly simulate the further development of physical quantities like the SSTA. When the predicted development of the ONI, i.e., the SSTA in the Niño3.4 region, satisfies the definition of an El Niño, the models predict the onset of an El Niño event. Since the predictions of these models are limited by the spring barrier, the lead time is about 6 months [23, 7].
A systematical study of the performance of the CP/EP prediction using GCMs has been done by Ren et al. [21], who focused on 6 operational GCMs. All models were initialized in November. Then the predicted temporal and spatial distribution of the SSTA in December, January and February is used to forecast whether an El Niño event will come and whether it will be an EP or CP event. The result was pretty surprising (see Table 1): Despite the very short lead time, only about every second EP or CP event was correctly forecasted. The limited skill in distinguishing between EP and CP events might be due to the models’ biases in simulating the background mean state [58, 59, 60, 61].

B. Climate network approach. The climate network approach [27, 28] is described in the Methods Section. As in Fig. 3, we consider the period from 1950 until present. In its original version (i) (see Fig. 5A and SI Fig. 3), the approach yields 20 alarms in the year before the onset of an El Niño event; 15 forecasts are correct, including 6 of the 8 largest El Niño events (see SI). Accordingly, 75% of the alarms are correct. The total -value of the predictions (including learning, hindcasting, and forecasting phase) calculated from random guessing with the climatological El Niño onset probability (about 1/3 per year) is .
Combining this approach with our precursor shown in Fig. 3, the method correctly forecasts 6 EP events (among them the 4 largest ones) and 7 CP events. When the climate network approach sounded a correct alarm, then also the type of the event was correctly forecasted, with one exception in 2017. Accordingly, when an EP event was forecasted, the forecast was about 67% correct, in 11% of the cases a CP event was observed, and in 22% of the cases an El Niño did not occur. (The correct alarm in 1985 before the non-identified event starting in 1986 was not counted.) When a CP event was predicted, of the predicted events were CP events and no El Niño events.
In its more restricted version (ii) (see Fig. 5B and SI Fig. 4), the climate network approach sounds 15 alarms, 13 of which are correct alarms and 2 false alarms. Compared with version (i), the 2 correct alarms for the smallest El Niño events (1958/59 and 1977/78, both CP events) are missing. Now 86.7% of the alarms are correct, and for all correct alarms, except that one in 2017, the type of the El Niño is correctly forecasted. As in version (i), of the predicted EP events were EP events, were CP events and percent no events. But now, each prediction of a CP event was correct.
Table 1 compares the performance of the 2 versions of the climate network approach with the performance of the operational GCMs. It shows that our approach, which is based solely on the zonal SSTA difference between the equatorial western and central Pacific, when combined with the climate network approach, considerably outperforms the conventional GCM approach, even though its lead time is one order of magnitude longer.
| Observed type | GCM | |||||
| network v(i) | network v(ii) | |||||
| (1 month) | (11 months) | (11 months) | ||||
| EP | CP | EP | CP | EP | CP | |
| EP | 49 | 31 | 67 | 0 | 67 | 0 |
| CP | 41 | 50 | 11 | 70 | 11 | 100 |
| Other | 10 | 19 | 22 | 30 | 22 | 0 |
Discussion
In summary, by studying the zonal SSTA difference between the equatorial western and central Pacific, we arrived at a precursor which allows to predict the type of an El Niño event well before the spring barrier with a high accuracy. The approach does not require fitting procedures, only the sign of the zonal SSTA difference at the end of a year matters. When it is positive, an El Niño event arising in the following year will probably be an EP event, otherwise a CP event. Interestingly, the precursor predicted the onset of CP events accurately, while only 75 % of the EP predictions turned out to be correct.
We may attribute this difference in the EP/CP predictability to stochastic processes, most likely westerly wind events (WWE) that typically start in boreal spring and are highly relevant for triggering El Niño events. WWEs can be regarded as state dependent noise, where warmer sea surface temperatures in the western and central Pacific favor more WWEs [6]. It has been noticed by Jadhav et al. [62] that stronger boreal spring through summer WWEs, with relatively stronger ocean preconditioning (e.g., large SSHA in the west [63]), can lead to EP events, while weaker ocean preconditioning (small SSHA in the west [63]) and weaker WWE can generate CP events. For similar arguments, see, e.g., [65, 64].
In light of this, we may interpret our results as follows: When the zonal difference of the SSTA (Fig. 3) or the SSHA (Fig. 4) is positive at the end of a year and sufficiently strong WWEs occur in boreal spring in the following year, an upcoming event will most probably be an EP event, but for weaker WWEs, a CP event may occur with high probability. This may explain the 25% incorrect EP forecasts. On the other hand, when the zonal difference is negative, the WWEs can only trigger CP events, and this may explain why we do not see incorrect CP forecasts.
For more precise predictions, we have combined the precursor with a climate network approach that forecasts the onset of an El Niño in the next calendar year and also does not require a large computational effort. The climate network sounds an alarm when its mean link strength exceeds a fixed threshold and the ONI remains below 0.5 until the end of the year. In this case, the onset of an El Niño event is forecasted for the next calendar year. From the perspective of predicting the major disastrous events, the combined approach was quite successful. In the last 7 decades, it forecasted the 4 largest El Niño events.
Since our El Niño type prediction approach is not based on a fitting procedure, we are confident that it remains valid also under climate change conditions where the background state of the equatorial Pacific might change. We hope that the approach will enable early and more targeted mitigation methods, either together with the climate network approach discussed here or with any other early forecasting approach, and thus help prevent or at least mitigate humanitarian disasters as consequences of El Niño related extreme weather impacts.
Data and Methods
Data. The monthly sea surface temperatures were obtained from the National Oceanic and Atmospheric Administration (NOAA) Extended Reconstructed Sea Surface Temperature version 5 (ERSSTv5) [66]. The daily surface air temperature (SAT) data (1948-present) for the calculation of the mean link strength of the network (see below) were obtained from the National Centers for Environmental Prediction/National Center for Atmospheric Research (NCEP/NCAR) Reanalysis I project [67, 68]. For the sea surface height (SSH), we used the monthly NCEP Global Ocean Data Assimilation System (GODAS) [69] data set obtained from [70].
Climate Network Approach. The approach exploits the observation that a large-scale cooperative mode linking the “El Niño basin” (i.e., the equatorial Pacific corridor) and the rest of the tropical Pacific (see SI Fig. 2 and [71, 27]) builds up in the calendar year before an El Niño event. The emerging cooperativity is derived from the time evolution of the teleconnections (“links“) between the SATA at the grid points (”nodes“) inside and outside of the El Niño basin. The strengths of these links at a given time are derived from the values of the respective cross-correlations (for details, see [71, 27]). The mean link strength in the network usually rises in the year before an El Niño event starts and drops with the onset of the event. This feature serves as a precursor for the event.
The algorithm [27] involves as only fit parameter a decision threshold , which has been fixed in a learning phase between 1950 and 1980. In its original version (i), the algorithm gives an alarm and predicts an El Niño inception in the following year whenever crosses from below while the most recent ONI is below 0.5°C. In a modified version (ii), the algorithm considers only those alarms for which the ONI remains below 0.5 for the rest of the calendar year.
Acknowledgments J.L. thanks the “Brazil East Africa Peru India Climate Capacities (B-EPICC)” project, which is part of the International Climate Initiative (IKI) of the German Federal Ministry for Economic Affairs and Climate Action (BMWK) and implemented by the Federal Foreign Office (AA).
References
- [1]