Detection, Explanation and Filtering of Cyber Attacks Combining Symbolic and Sub-Symbolic Methods
Abstract
Machine learning (ML) on graph-structured data has recently received deepened interest in the context of intrusion detection in the cybersecurity domain. Due to the increasing amounts of data generated by monitoring tools as well as more and more sophisticated attacks, these ML methods are gaining traction. Knowledge graphs and their corresponding learning techniques such as Graph Neural Networks (GNNs) with their ability to seamlessly integrate data from multiple domains using human-understandable vocabularies, are finding application in the cybersecurity domain. However, similar to other connectionist models, GNNs are lacking transparency in their decision making. This is especially important as there tend to be a high number of false positive alerts in the cybersecurity domain, such that triage needs to be done by domain experts, requiring a lot of man power. Therefore, we are addressing Explainable AI (XAI) for GNNs to enhance trust management by exploring combining symbolic and sub-symbolic methods in the area of cybersecurity that incorporate domain knowledge. We experimented with this approach by generating explanations in an industrial demonstrator system. The proposed method is shown to produce intuitive explanations for alerts for a diverse range of scenarios. Not only do the explanations provide deeper insights into the alerts, but they also lead to a reduction of false positive alerts by 66% and by 93% when including the fidelity metric.
Index Terms:
Explainable AI, Cybersecurity, OntologiesI Introduction
The continuous increase in cyber attacks has given rise to a growing demand for modern intrusion detection approaches that leverage ML to detect both simple security risks as well as sophisticated cyber attacks [1]. These approaches identify patterns in data and highlight anomalies corresponding to attacks. Such detection tasks are particularly poised to benefit from the ability to automatically analyze and learn from vast quantities of data. There are many relevant examples of the application of deep learning and similar techniques for intrusion detection systems (IDS) [2] based on anomaly detection methods able to find deviations from a previously learned baseline [3]. However, their drawbacks include alarm flooding problems [4] and a lack of explainability, e.g., for why certain network traffic is flagged as anomalous by the IDS [5].
This is not just relevant for the defense of conventional IT systems, but also in the context of modern operational technology (OT) systems, such as those used in factories and other industrial automation settings. While these industrial control systems used to be exclusively deterministic in their operation, modern Industry 4.0 automation settings are characterized by a convergence of IT and OT infrastructure [6]. This convergence comes with increasingly complex activity patterns and network topologies that make extensive use of autonomous systems and components such as AI-enabled software applications [3]. While this has the potential to substantially improve the flexibility, reliability and efficiency of industrial systems and consumer-oriented manufacturing, it also poses new cybersecurity challenges [7] and demands a high degree of domain-specific knowledge from analysts assessing potential integrity issues or indications of security compromises.
Therefore, there is a clear need for XAI that enables analysts to understand how the system is reaching its conclusions and allow them to interact with it in a collaborative manner [1].
One of the biggest drivers for successful adoption of ML models is how well human users can understand and trust their functionality. The benefits afforded by explanations only fully come to bear when these are human-centered and the users are able to understand and interact with them. This is especially crucial in the cybersecurity domain, where experts require far more information from the model than a simple binary output for their analysis [3].
A possible example of a cyber attack in an OT system is a security breach. Such a security breach could be a network host that should stay in the local network connecting to the Internet or a developer host directly accessing an edge device.
In the latter scenario, with a binary output, a connection of the form would be flagged as suspicious by the ML model. This gives the analyst very little information about what happened and requires further in-depth analysis. The explanation for the anomaly Security Breach is something whose Connection receives Service via SSH given by our approach, shows that edge devices are usually not the origin or destination of SSH connections and why this connection was flagged as suspicious.
It is in this context that we propose combining symbolic and sub-symbolic methods on knowledge graphs in order to improve the explainability and quality of IDS-generated alerts in modern industrial systems, increasing their usefulness for analysts.
This is achieved by integrating domain-specific data, which enables us to better contextualize and enrich cybersecurity-relevant observations, while allowing the sub-symbolic machine learning method GNN to leverage this additional context, i.e., to learn from these observations in a way that makes use of the rich set of interconnections and relations between different entities in the graph. Similarly to other connectionist models, GNNs lack transparency in their decision-making. A variety of explainable models have been developed [8], but since such sub-symbolic models are built for AI researchers, they are often hard to understand for non-experts. We strive to go beyond that by justifying predictions with background knowledge in a human-understandable way by employing a hybrid method [9].
In this paper, we contribute an explainable methodology for system monitoring in the cybersecurity domain comprised of:
-
•
Ontology creation that follows the separation of the industrial automation system into three domains following structured language for cyber threat intelligence (STIX).
-
•
Creating and validating explanations of security alerts through using inductive logic learning and calculating fidelity scores following the approach in [9].
-
•
Verbalization of the explanations with state-of-the-art verbalization framework [10] for increased user-friendliness.
-
•
Testing of our proposed system on a hardware demonstrator integrating IT and OT technologies and showing that the proposed method is capable of explaining all triggered alerts which are true positives, and filters out a large percentage of false positives.
To the best of our knowledge, no work exists that leverages XAI to address the alert flooding problem and combines symbolic with sub-symbolic methods for user-friendly alert explanations. The rest of the paper is organized as follows. Section II introduces knowledge graphs and presents a brief overview of existing applications in the “XAI for cybersecurity” domain. In Section III we describe the anomaly detection, ontology creation and explanation generation method employed for our specific security monitoring application. Section IV describes the qualitative and quantitative evaluation of the explanations based on an industrial automation hardware prototype, before finally drawing some conclusions in Section V.
II Background and Related Work
II-A XAI in the Cybersecurity Domain
XAI in cybersecurity has been gaining more attention in the last two years. The authors of [1] and [11] focus on what constitutes a good explanation for the user, including what information requirements a human
needs for decision-making. In [3], the authors propose a taxonomy for XAI methods and introduce a black box attack for analyzing
the consistency, correctness and confidence properties of
gradient-based XAI methods. In [12] a rule extraction process is proposed that allows to explain the causes of cyber threats, while in
[13] a system is proposed that combines experts’ written rules and dynamic knowledge generated by a decision tree algorithm.
Similarly, in [14] a concrete proposal for an Explainable Intrusion Detection System including a neural network combined with decision trees is presented, together with an empirical evaluation of its prototype implementation.
There are several differences between our work and the approaches mentioned above. Despite sharing the general motivation of studying explanations
in the cybersecurity context, our work not only focuses on extracting human-centric explanations but also ensures the trustworthiness of the explanation through including a sub-symbolic explanation element. Therefore, a fidelity metric can be given that shows how close the explanation is to the actual decision-making process of the ML algorithm.
II-B Knowledge Graph Model and Ontology
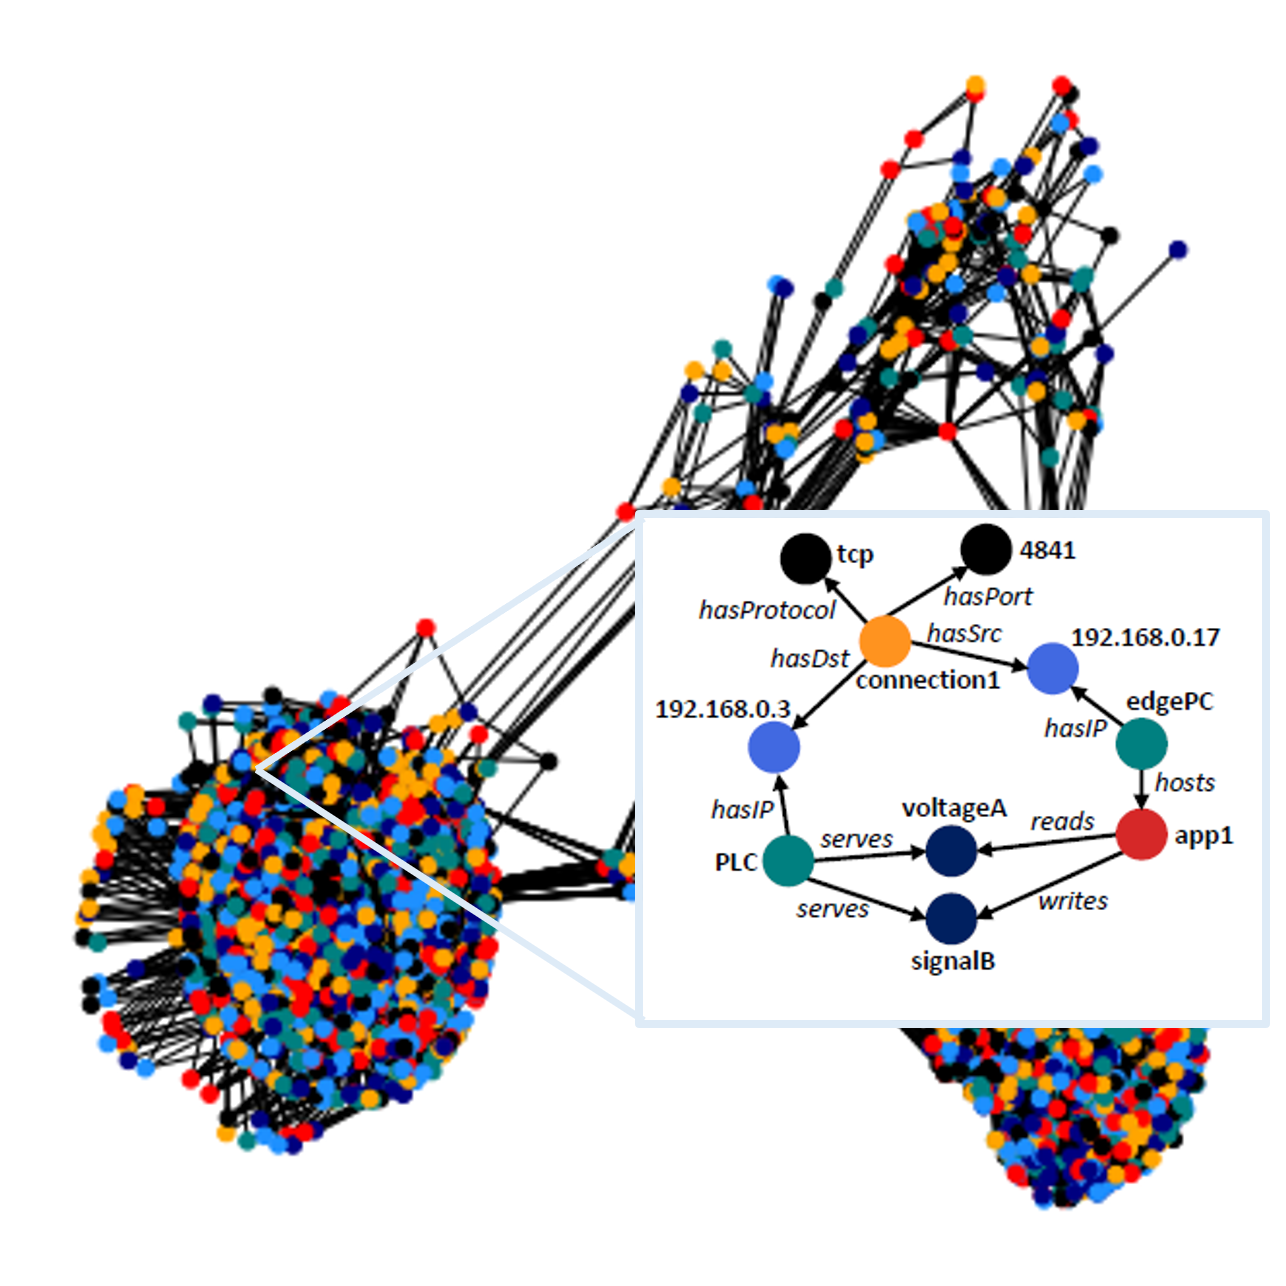
A knowledge graph is a specific type of knowledge base where information is encoded in the form of a directed labeled graph, with nodes representing entities and edges representing different types of possible relationships between entities. A simple knowledge graph illustrating these two alternative representations is depicted in Figure 1 for the hardware demonstrator used in this paper. Knowledge graphs are particularly useful structures to integrate data from multiple areas of knowledge, typically making use of domain-specific vocabularies and ontologies that model the different categories, relationships, rules and constraints in a specific area of knowledge. For incorporating explicit domain knowledge into our explanation method on the side of symbolic representation, we use ontologies expressed in the W3C OWL 2 standard111https://www.w3.org/TR/owl2-overview/ [15] based on the description logic formalism. The basic constituents for representing knowledge in OWL are individuals, classes and properties. They are used to form axioms, i.e. statements within the target domain, and an ontology is a set of axioms to describe what holds true in this domain. The most relevant axioms for our work are class assertions assigning an individual to a class , property assertions connecting two individuals by property , and subclass axioms expressing that class is a subclass of class . Classes can be either atomic class names, such as ’App1‘, or they can be composed by means of complex class expressions. An example for a complex class expression noted in Manchester syntax is ’UAVariable and hasDataType byte‘, which refers to all UAVariables which have the data type byte. For details about all types of axioms and the way complex concepts are constructed we refer to [15].
II-C Graph Neural Networks for Anomaly Detection
We apply a GNN to detect unexpected activity in industrial automation systems, which are control systems, such as computers or robots, and information technologies for handling different processes and machineries in a factory. Use of machine learning methods is possible on knowledge graphs, typically by means of so-called graph embeddings: vector representations of graph entities which are more suitable for processing via neural networks and similar methods than their original symbolic representations. In [3], relational learning on knowledge graphs is applied to security monitoring and intrusion detection by mapping the events in an industrial automation system to links in a knowledge graph. This way, the anomaly detection task can be rephrased as a link prediction task in the knowledge graph representation of the modeled system. In particular, [3] report that the collective learning properties of graph embedding methods allow the resulting models to generalize beyond individual observations, benefiting from the context provided by a rich set of entity and relationship types. Here, we follow the same paradigm of phrasing the security monitoring task as a knowledge graph link prediction task, with a 2-step process. (1) Learning a baseline of normal behavior by training a GNN on a graph built from a training dataset. (2) Applying the GNN in a link prediction setting to rank the likelihood of triple statements resulting from events observed at test time and determine whether they represent an anomaly. A GNN usually consists of graph convolution layers which extract local substructure features for individual nodes and a graph aggregation layer which aggregates node-level features into a graph-level feature vector [20]. Here, we use a GraphSAGE model [34], which is a framework for inductive representation learning on large graphs. It is used to generate low-dimensional vector representations for nodes, and is especially useful for graphs that have rich node attribute information.
II-D Explainable AI for Graph Neural Networks
Current work towards explainable GNNs attempts to convert approaches initially designed for Convolutional Neural Networks (CNNs) into the graph domain [16]. The drawback of reusing explanation methods previously applied to CNNs are their inability to incorporate graph-specific data such as the edge structure. In order to take node feature information into account [26], the model-agnostic approach GNNExplainer finds a subgraph of input data which influence GNNs predictions in the most significant way by maximizing the subgraph’s mutual information with the model’s prediction. A different type of explainability method tries to integrate ML with symbolic methods. The symbolic methods utilized alongside neural networks are quite agnostic of the underlying algorithms and mainly harness ontologies and knowledge graphs [23]. One approach is to map network inputs or neurons to classes of an ontology or entities of a knowledge graph. For example, in [17] scene objects within images are mapped to classes of an ontology. Based on the image classification outputted by the neural network, the authors run inductive logic learning on the ontology to create class expressions that act as model-level explanations. An ontology-based approach for human-centric explanation of transfer learning is proposed by [18]. While there is some explanatory value to these input-output methods, they fail to give insights into the inner workings of a GNN and cannot identify which type of information was influential in making a prediction. In [9] this gap is bridged by combining the advantages of both approaches.
II-E Explainer Method: Combining Symbolic and Sub-Symbolic Methods
We are applying a hybrid method [9], within which the coupling of the sub-symbolic explainer method GNNExplainer [26] with the symbolic DL-Learner [33] is used to explain GNN instance-level link predictions. Firstly, a GNN is trained on and applied to training and testing data and subsequently the sub-symbolic explainer method GNNExplainer is applied, which outputs explainer subgraphs. Secondly, to create explainer classes for the GNN decision making process, DL-Learner is applied for a specific predicted category, with positive and negative examples labelled accordingly. An explainer class is a description that
represents a set of individuals by formally specifying conditions on the individuals’ properties. It captures the global behavior of a GNN through investigating what input patterns can lead to a specific prediction. As the DL-Learner can only process ontologies, the background knowledge is mapped to an ontology as described in Section III-C.
The pool of possible explainer classes by the DL-Learner are used to generate instance-level explanations through explainer class entailment. Explainer class entailment is given when an explainer class applies for a certain alert, given the ontology and as can be derived by a standard OWL reasoner. Or in other words, the explainer class is entailed if the learned overall decision-making pattern of the GNN applies to a specific alert.
For increased trustworthiness, the fidelity for each explanation is given. Fidelity is defined as the measure of the accuracy of the student model (DL-Learner) with respect to the teacher model (GNN). High fidelity is therefore fundamental whenever a student model is to be claimed to offer a good explanation for a teacher model [27]. The fidelity is defined as the overlap of the explainer subgraph generated by the sub-symbolic explainer method with the entailed explainer class for a specific instance [9].
III Cybersecurity Application
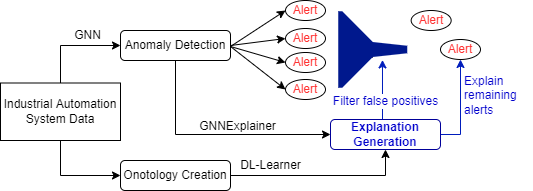
The high-level workflow for the cybersecurity application which encompasses anomaly detection with a GNN, the creation of an ontology based on the industrial automation system and the explanation generation for the generated alerts can be seen in Figure 2. The individual parts of this workflow are explained in detail below.
III-A Experimental Setup
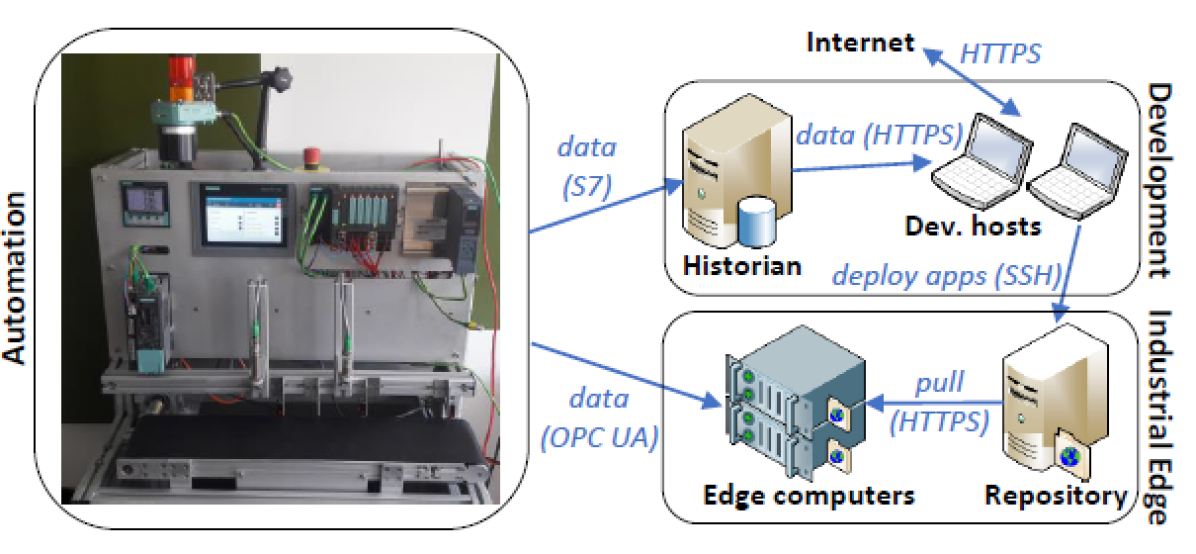
The demonstrator system for e.g. measuring the height of objects for quality control amongst other capabilities, is described in Figure 3, following the design of modern industrial systems integrating IT and OT elements. The automation side is equipped with a programmable logic controller (PLC) connected to peripherals via an industrial network. These include a drive subsystem controlling the motion of a conveyor belt, an industrial camera, a human-machine interface, and a distributed I/O subsystem with modules interfacing with various sensors for object positioning and other measurements (Figure 3, left). The PLC exposes values reported by these sensors as well as information about the state of the system by means of an OPC-UA server222OPC-UA server is a machine to machine communication protocol for industrial automation [28].. The variables exposed by the server are consumed on the IT part of the demonstrator by applications hosted on edge computing servers (Figure 3, bottom right), i.e., computing infrastructure directly located at the factory floor which is typically devoted to data driven tasks that require close integration with the automation system and short response times, such as real-time system monitoring, fault prediction or production optimization. Industrial edge applications have dynamic life cycles, and this is captured in the prototype by recreating a development environment (Figure 3, top right). This cycle starts with development hosts consuming potentially high volumes of data from a historian, a database that constantly stores process data from the automation system. Finally, edge computing hosts fetch application updates periodically. To make the behavior more realistic, development hosts occasionally access the internet with low traffic volumes. The environment is fully virtualized and performs these activities in an autonomous manner, with an option to manually induce different types of anomalous behaviors in order to test the response of our IDS system. A knowledge graph is built out of the running prototype by integrating three main sources of knowledge: information about the automation system, observations at the network level (e.g., connections between hosts), and observations at the application level (e.g., data access events). A sizeable portion of the information is related to the automation system, which is extracted from engineering tools in the Automation ML format and ingested into the graph using a readily available ontology [29]. Information about application activity is obtained from the OPC-UA server logs, including session information, i.e., which variables are accessed and in which way. Finally, all network traffic is passed through the security monitoring tool Zeek [30], which produces a stream of observed connections that are ingested using a simple custom data model.
III-B Anomaly Detection
Initially, a baseline is captured with the system under normal
operating conditions, and the collected data is used to train
the link prediction algorithm in an unsupervised
manner. Thereafter, in order to qualitatively evaluate its predictions,
we trigger a set of actions which result in events
not observed during normal operation, but which would be
assigned a wide range of severity levels by a human expert
upon detailed analysis of the available contextual information.
Suspicious behavior is novel behavior given the baseline definition. These scenarios are defined following
the ATT&CK framework for Industrial Control
Systems333https://collaborate.mitre.org/attackics/index.
php/Main Page, i.e., a standardized collection of cyber attack
patterns, to guarantee a high degree of realism. The employed scenarios are listed in Table I.
One example is sniffing, where an app accesses data variables completely unrelated to those accessed usually (Scenario 1.2), e.g. not served by the
PLC, or with a different data type, such as strings instead of
numeric data types like int, real, etc. This could be an event
where system information is extracted, like serial
numbers of devices or firmware versions, which
is useful information for discovering back doors and
vulnerabilities of the system. For more details on the scenarios, we refer to [3].
For the learning we use a 2-layer GraphSAGE model and the Adam optimizer to train the GNN. Training is done for 1000 epochs with learning rate 0.01, reaching a ROC AUC score of at least 84%. The train/validation/test
split is 80/10/10%.
| Scenario description |
|---|
| Application activity |
| 1.1 App changes the way it accesses some variables (e.g. writes instead of reads). |
| 1.2 App accesses variables completely unrelated to those accessed usually. |
| Network activity (HTTPS) |
| 2.1 A local address not corresponding to a dev. host (e.g. an edge server) accesses the historian. |
| 2.2 A local address not corresponding to a dev. host (e.g. an edge server) accesses a public IP address. |
| 2.3 A high-volume HTTP access is made to a public IP address (high volumes only from historian in baseline). |
| Network activity (SSH) |
| 3.1 The historian host (not a dev. host but on the same network) accesses the app repository via SSH. |
| 3.2 A dev. host accesses an edge server via SSH, but during training no edge servers received SSH connections. |
| 3.3 SSH connection between two edge servers. Usually no edge servers started or received SSH connections. |
| Credential use |
| 4.1 Access to OPC-UA server from an IP address that corresponds to a development host. |
| Network Scan |
| 5.1 Connection which does not match any source-destination pair usually observed. |
| 5.2 Attempt to connect to an IP which is not assigned to any host. |
III-C Ontology Creation
Analysis of security incidents typically requires consideration of multiple data sources, some of which are often exchanged between organizations. In order to facilitate this, common schemas and data representation formats, such as STIX [21], have been introduced that enable organizations to exchange threat intelligence in a consistent way. More recently, these have evolved into fully-fledged ontologies enabling inference and reasoning [25]. These ontologies model a wide range of cybersecurity-relevant knowledge such as product information, known vulnerabilities and attack patterns, and can additionally be linked to domain-specific knowledge, e.g. coming from industrial automation systems [22]. Once constructed, these knowledge graphs find a wide range of applications, e.g., intrusion and threat detection [24], [31]. Construction of high-quality knowledge graphs is a challenging task, especially when it requires extraction of information from unstructured textual or heterogeneous data. To use the DL-Learner, we first have to transform the knowledge graph into an ontology. Here, a class hierarchy that follows the separation of the industrial automation system into three domains following STIX [21] is adapted:
-
•
Automation part: Summarizes the engineering design of the manufacturing prototype. Further separated into InternalStructure, containing InternalElements, ExternalInterfaces, Attributes and InternalLinks as subclasses as well as UAVariables, containing PLCtags and Attributes as subclasses.
-
•
Edge part: Contains app initialization events, data events and the applications.
-
•
Network part: Contains network connections and their properties as subclasses, as well as IPs and their subdomains with local and global and automation, development and edge networks as subclasses.
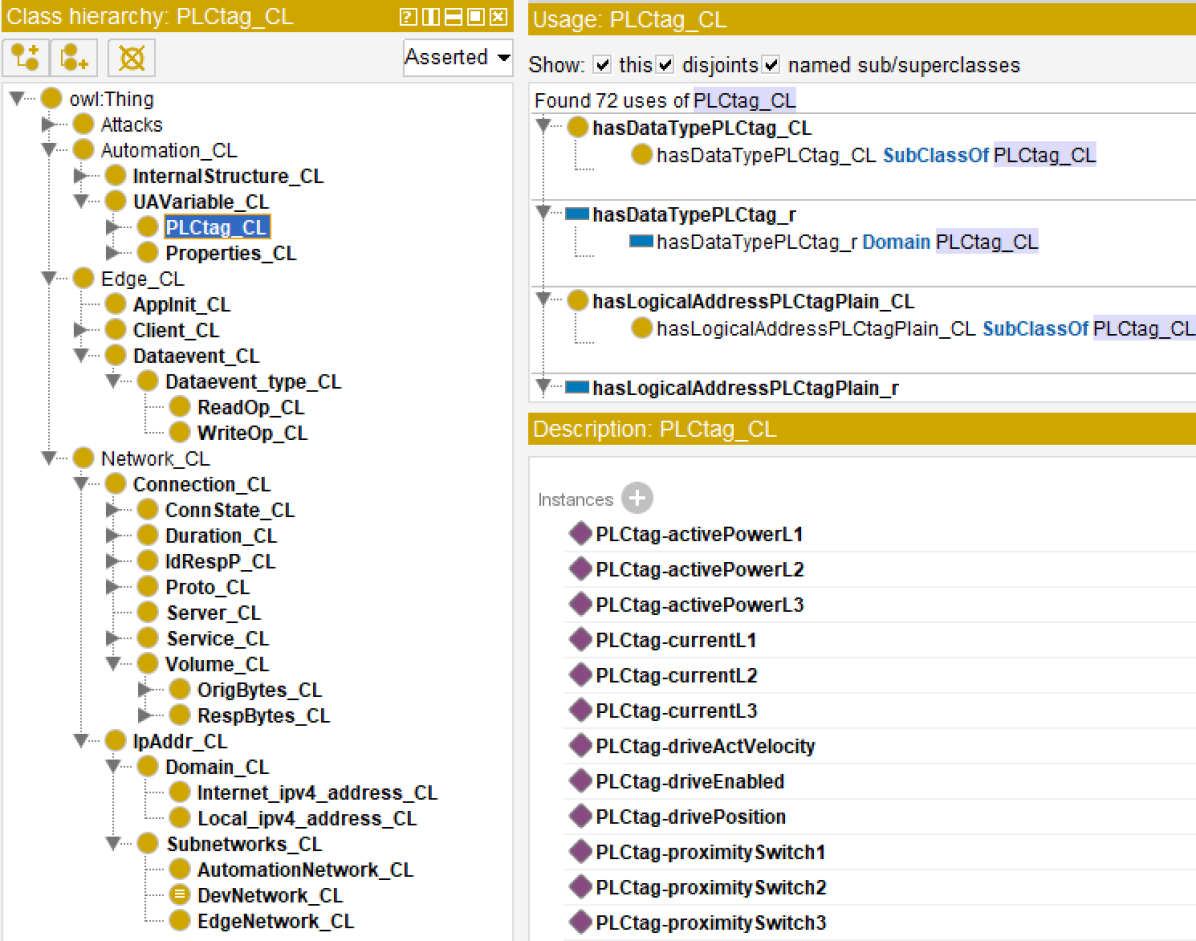
For relations, domain and range are provided. To enable DL-Learner to use properties (like network connection properties), these have to be promoted to classes, e.g., every possible instance for network volumes is its own class. We do the same for applications, InternalElements and ExternalInterfaces, network types (DevNetwork etc.) and attributes. Figure 4 shows a screenshot of the described ontology in the Protégé application [32].
III-D Explanation Generation
Tools specially designed to address tasks related to the detection of malicious behavior typically tend to focus more on events or observations that are considered to be unexpected or unusual [1]. Similarly to that, detected unexpected events serve as the trigger for explanations in our approach, where the type of abnormality is identified.
For the testing of the events from
a certain device (e.g., activity of a certain app, or network
connections between two IPs), the events are compared against each other based on class category.
For example, the suspicious class against the baseline. We do this by using model predictions, based on a ranked list with suspiciousness scores. Thus, one can compare, e.g., the top entry with compatible baseline events. This is how positive and negative examples for the DL-Learner are generated, which generates class expressions, such as some )
and some some (not ()))).
For increased user-friendliness, the class expressions are verbalized further with the state-of-the-art framework [10].
Through the verbalization step, the class expression
some )
and some some (not ()))) of the class is translated to Sniffing is something whose data event client is App4 and whose data event variable is something that has data type something that is not data type real.
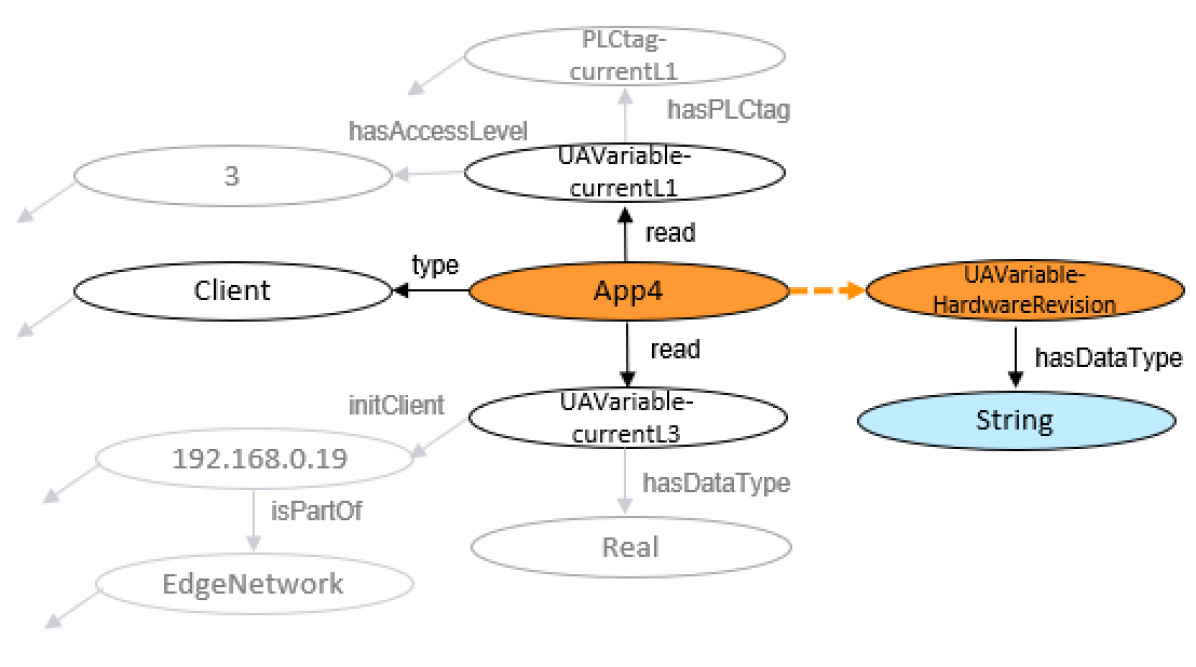
Sub-symbolic explanations in the shape of subgraphs are generated by the GNNExplainer, as can be seen in Figure 5.
Here you can see the as suspicious flagged data event . The greyed out nodes and edges are considered not influential in the flagging by the GNN, as opposed to the remaining subgraph. This information is then used to calculate the fidelity score of the entailed explainer class for each flagged event.
As can be seen in the figure, the entailed explanation is part of the identified subgraph, with the data event client being and the having datatype string. Therefore, the explanation generated by the DL-Learner shows fidelity with respect to the GNN.
| Explainer Class | Verbalization |
|---|---|
| some ) and ( some WriteOp) Attack Scenario 1.1 | Sniffing is something whose data event client is an App5 and whose data event operation is a Write Operation |
| some ) and some some (not ()))) Attack Scenario 1.2 | Sniffing is something whose data event client is App4 and whose data event variable is something that has data type something that is not data type real |
| and some Attack Scenario 3.2 | Security Breach is something whose service is SSH |
| some and some Attack Scenario 3.3 | Security Breach is something whose port is an 22 and whose origin volume is |
| some and some some Attack Scenario 4.1 | Credential Use is something whose initial client is an App3 and whose initial server is something that is part of a development network |
| some Attack Scenario 5.1 | Network Scan is something whose port is 22 |
IV Evaluation
IV-A Qualitative Results
In Table II, a selection of explanations can be seen, along with their verbalization and correspondence with a sub-scenario. For example, the verbalized explanation Credential Use is something whose initial client is an App3 and whose initial server is something that is part of a development network corresponds to Scenario 4.1. ”Access to OPC-UA server from an IP address that corresponds to a development host.” The explanation captures the anomaly and is even more specific to the concrete data example, as it also gives information about the initial client. This explanation of a Credential Use anomaly is, for example, entailed for the triple .
The explanation Network Scan is something whose port is 22, which is, amongst others, entailed for connection , may need some additional information for a layman, but should give ample information for a domain expert. Here, the IP Address does a network scan and, of course, also scans IPs it normally connects to, but with the wrong port - SSH (22) instead of HTTPS (443). Overall we can see that the explanations capture the general scenarios, while often being more specific in describing the concrete anomaly in the data.
| Manual | with Explanation | reduced by % | Fidelity 0 | reduced by % | |
|---|---|---|---|---|---|
| Total (TP + FP) | 105 | 78 | 0.26 | 42 | 0.60 |
| App. activity | 12 | 12 | 0 | 6 | 0.50 |
| Network (HTTPS) | 29 | 23 | 0.21 | 18 | 0.38 |
| Network (SSH) | 23 | 13 | 0.43 | 11 | 0.52 |
| Credential Use | 12 | 6 | 0.50 | 3 | 0.75 |
| Network Scan | 29 | 23 | 0.21 | 4 | 0.86 |
| TP (total) | 64 | 64 | 0 | 39 | 0.39 |
| App. activity | 11 | 11 | 0 | 6 | 0.45 |
| Network (HTTPS) | 23 | 23 | 0 | 18 | 0.22 |
| Network (SSH) | 8 | 8 | 0 | 8 | 0 |
| Credential Use | 3 | 3 | 0 | 3 | 0 |
| Network Scan | 18 | 18 | 0 | 4 | 0.78 |
| FP (total) | 41 | 14 | 0.66 | 3 | 0.93 |
| App. activity | 1 | 1 | 0 | 0 | 1 |
| Network (HTTPS) | 6 | 0 | 1 | 0 | 1 |
| Network (SSH) | 14 | 5 | 0.64 | 3 | 0.79 |
| Credential Use | 9 | 3 | 0.67 | 0 | 1 |
| Network Scan | 11 | 5 | 0.55 | 0 | 1 |
IV-B Quantitative Results
The training data encompasses more than 37k data events, with 4347 nodes and 37 edge types. The testing data contains 1367 data events, evenly distributed across all 5 attack scenarios, where we reach a ROC AUC score of 84%. A total of 16 explainer classes have been created. As you can see in Table III, a total of 105 data events have been predicted as unexpected, or in other words, 105 alerts have been triggered, with nearly 40% being false positives. The learned explainer classes apply to only 14 of the total 41 false positives, while covering 100% of all true positive alerts. This gives the domain expert the possibility to filter out all triggered alerts that have been created based on the availability of an explanation, reducing the need to investigate false positives by 66%. No false negatives are created trough filtering, meaning all relevant alerts are still shown to the domain expert. In a further step, the fidelity of the explanation per alert can be taken into account. Such an additional filtering step would lead to a reduction of the false positives by 93%. However, 39% of true positives would be missed, which translates to 23% false negatives in the total alerts. False negatives should be avoided, as critical alerts could be missed. Therefore, depending on the preferences of the domain expert, it might be preferable to use the fidelity score as a means to prioritize the alerts. The use of these filter and prioritization techniques significantly reduces the time and resources need by the domain expert. Additionally, more time will be saved in the analysis of the remaining alerts, as explanations for these are available as seen in Section IV-A. While this is a relatively small example, we can see the potential benefit of applying such a method in a large-scale OT system.
V Conclusion
The continuous increase in cyber attacks has given rise to a growing demand for modern intrusion detection approaches that leverage ML, e.g. GNNs. However, these methods tend to come with alarm flooding problems and a lack of explainability. In this paper, we are addressing XAI for a cybersecurity application by exploring the combination of symbolic and sub-symbolic methods that incorporate domain knowledge. We experiment with this approach by generating explanations in an industrial demonstrator system, which are validated through a fidelity score, increasing their trustworthiness. Through empirical and qualitative evaluation, we show that the proposed method produces intuitive explanations for alerts in a diverse range of scenarios. Not only do the explanations provide deeper insights into the alerts, but they also lead to a reduction of false positive alerts by 66% and therefore address the alarm flooding issue.
References
- [1] Paredes, J.N., Teze, J.C.L., Simari, G.I. and Vanina Martinez, M., 2021. “On the Importance of Domain-specific Explanations in AI-based Cybersecurity Systems (Technical Report)”. arXiv e-prints, pp.arXiv-2108.
- [2] Mane, S. and Rao, D., 2021. Explaining Network Intrusion Detection System Using Explainable AI Framework. arXiv e-prints, pp.arXiv-2103.
- [3] Soler Garrido, J., Dold, D. and Frank, J., 2021. Machine learning on knowledge graphs for context-aware security monitoring. IEEE-CSR 2021.
- [4] Rao, D. and Mane, S., 2021. Zero-shot learning approach to adaptive Cybersecurity using Explainable AI. arXiv preprint arXiv:2106.14647.
- [5] A. Aldweesh, A. Derhab, and A. Z. Emam. “Deep learning approaches for anomaly-based intrusion detection systems: A survey, taxonomy, and open issues”. In: Knowledge-Based Systems 189 (2020). ISSN: 0950-7051. URL: http : / /www. sciencedirect .com/science/ article / pii / S0950705119304897.
- [6] A. Chemudupati et al. “The convergence of IT and Operational Technology”. In: Atos White Paper (2012).
- [7] R. Paes et al. “A Guide to Securing Industrial Control Networks: Integrating IT and OT Systems”. In: IEEE Industry Applications Magazine 26.2 (2020).
- [8] Pope, Phillip E., et al. “Explainability methods for graph convolutional neuralnetworks.” Proceedings of the IEEE/CVF Conference on Computer Vision andPattern Recognition. 2019
- [9] Himmelhuber, A., Grimm, S., Zillner, S., Joblin, M., Ringsquandl, M. and Runkler, T., 2021, September. Combining Sub-symbolic and Symbolic Methods for Explainability. In International Joint Conference on Rules and Reasoning (pp. 172-187). Springer, Cham.
- [10] Ngomo, A.C.N., Moussallem, D. and Bühmann, L., 2019, September. A Holistic Natural Language Generation Framework for the Semantic Web. In Proceedings of the International Conference on Recent Advances in Natural Language Processing (RANLP 2019) (pp. 819-828).
- [11] Vigan‘o, L., Magazzeni, D.: Explainable security. In: Proc. EuroS&PW. pp. 293– 300. IEEE (2020)
- [12] Mahdavifar, S. and Ghorbani, A.A., 2020. DeNNeS: deep embedded neural network expert system for detecting cyber attacks. Neural Computing and Applications, 32(18), pp.14753-14780.
- [13] Dias, T., Oliveira, N., Sousa, N., Praça, I. and Sousa, O., 2021. A Hybrid Approach for an Interpretable and Explainable Intrusion Detection System. arXiv e-prints, pp.arXiv-2111.
- [14] Szczepański, M., Choraś, M., Pawlicki, M. and Kozik, R., 2020, July. Achieving explainability of intrusion detection system by hybrid oracle-explainer approach. In 2020 International Joint Conference on neural networks (IJCNN) (pp. 1-8). IEEE.
- [15] McGuinness, Deborah L., and Frank Van Harmelen. “OWL web ontology language overview.” W3C recommendation 10.10 (2004): 2004.
- [16] Pope, P.E., Kolouri, S., Rostami, M., Martin, C.E. and Hoffmann, H., 2019. Explainability methods for graph convolutional neural networks. In Proceedings of the IEEE/CVF Conference on Computer Vision and Pattern Recognition (pp. 10772-10781).
- [17] Sarkar, S., Kumar, A., Mohanpuria, S.K. and Maiti, J., 2017, November. Application of Bayesian network model in explaining occupational accidents in a steel industry. In 2017 Third International Conference on Research in Computational Intelligence and Communication Networks (ICRCICN) (pp. 337-392). IEEE.
- [18] Chen, J., Lécué, F., Pan, J.Z., Horrocks, I. and Chen, H., 2018, September. Knowledge-based transfer learning explanation. In Sixteenth International Conference on Principles of Knowledge Representation and Reasoning.
- [19] Kuppa, A. and Le-Khac, N.A., 2020, July. Black box attacks on explainable artificial intelligence (XAI) methods in cyber security. In 2020 International Joint Conference on neural networks (IJCNN) (pp. 1-8). IEEE.
- [20] Zhang, M. and Chen, Y., 2018. Link prediction based on Graph Neural Networks. Advances in Neural Information Processing Systems, 31, pp.5165-5175.
- [21] S. Barnum. “Standardizing cyber threat intelligence information with the structured threat information expression (STIX)”. In: Mitre Corporation 11 (2012).
- [22] Eckhart, M., Ekelhart, A. and Weippl, E.R., 2020. Automated Security Risk Identification Using AutomationML-based Engineering Data. IEEE Transactions on Dependable and Secure Computing.
- [23] Seeliger, A., Pfaff, M. and Krcmar, H., 2019. Semantic Web Technologies for Explainable Machine Learning Models: A Literature Review. PROFILES/SEMEX@ ISWC, 2465, pp.1-16.
- [24] Kiesling, E., Ekelhart, A., Kurniawan, K. and Ekaputra, F., 2019, October. The SEPSES knowledge graph: an integrated resource for cybersecurity. In International Semantic Web Conference (pp. 198-214). Springer, Cham.
- [25] Z. Syed et al. “UCO: A Unified Cybersecurity Ontology”. In: AAAI Workshop: Artificial Intelligence for Cyber Security. 2016.
- [26] Ying, R., Bourgeois, D., You, J., Zitnik, M. and Leskovec, J., 2019. Gnnexplainer: Generating explanations for Graph Neural Networks. Advances in neural information processing systems, 32, p.9240.
- [27] Garcez, A.D.A. and Lamb, L.C., 2020. Neurosymbolic AI: the 3rd Wave. arXiv preprint arXiv:2012.05876.
- [28] Mahnke, W., Leitner, S.H. and Damm, M., 2009. OPC unified architecture. Springer Science & Business Media.
- [29] Kovalenko, O., Wimmer, M., Sabou, M., Lüder, A., Ekaputra, F.J. and Biffl, S., 2015, September. Modeling automationml: Semantic web technologies vs. model-driven engineering. In 2015 IEEE 20th Conference on Emerging Technologies & Factory Automation (ETFA) (pp. 1-4). IEEE.
- [30] Zeek documentation. https://docs.zeek.org/en/stable/intro/. Accessed: 2021-02-04.
- [31] Narayanan, S.N., Ganesan, A., Joshi, K., Oates, T., Joshi, A. and Finin, T., 2018, October. Early detection of cybersecurity threats using collaborative cognition. In 2018 IEEE 4th international conference on collaboration and internet computing (CIC) (pp. 354-363). IEEE.
- [32] Musen, M.A., 2015. The protégé project: a look back and a look forward. AI matters, 1(4), pp.4-12
- [33] Lehmann, J., 2009. DL-Learner: learning concepts in description logics. The Journal of Machine Learning Research, 10, pp.2639-2642.
- [34] Hamilton, W.L., Ying, R. and Leskovec, J., 2017, December. Inductive representation learning on large graphs. In Proceedings of the 31st International Conference on Neural Information Processing Systems (pp. 1025-1035).
- [35] Dold, D. and Soler Garrido, J., 2021. An energy-based model for neuro-symbolic reasoning on knowledge graphs. In Proceedings of the 20th IEEE International Conference on Machine Learning and Applications (ICMLA).