xFBD: Focused Building Damage Dataset and Analysis
Abstract
The xView2 competition and xBD dataset [7] spurred significant advancements in overhead building damage detection, but the competition’s pixel level scoring can lead to reduced solution performance in areas with tight clusters of buildings or uninformative context. We seek to advance automatic building damage assessment for disaster relief by proposing an auxiliary challenge to the original xView2 competition. This new challenge involves a new dataset and metrics indicating solution performance when damage is more local and limited than in xBD. Our challenge measures a network’s ability to identify individual buildings and their damage level without excessive reliance on the buildings’ surroundings. Methods that succeed on this challenge will provide more fine-grained, precise damage information than original xView2 solutions. The best-performing xView2 networks’ performances dropped noticeably in our new limited/local damage detection task. The common causes of failure observed are that (1) building objects and their classifications are not separated well, and (2) when they are, the classification is strongly biased by surrounding buildings and other damage context. Thus, we release our augmented version of the dataset with additional object-level scoring metrics (https://drive.google.com/drive/folders/1VuQZuAg6-Yo8r5J4OCx3ZRpa_fv9aaDX?usp=sharing ) to test independence and separability of building objects, alongside the pixel-level performance metrics of the original competition. We also experiment with new baseline models which improve independence and separability of building damage predictions. Our results indicate that building damage detection is not a fully-solved problem, and we invite others to use and build on our dataset augmentations and metrics.
1 Introduction
When natural disasters occur, humanitarian agencies leverage satellite imagery to assess damage. Such assessments inform distribution of aid in the hours and days after a disaster. Automatic methods to detect buildings and assign damage levels could save hours of work, reducing the time needed to make crisis relief decisions. To be dependable, such methods must be robust to variations including unseen geography, weather, and damage distribution.
The release of the xBD dataset [7] sparked a substantial growth in approaches to automatic building damage assessment. Our contribution to the growing damage assessment field includes the proposal of new scoring metrics for xBD and augmentations of xBD which we believe will enable more robust building damage assessment. In particular, we focus on cases where the independence of adjacent building classifications is important. For example, in earthquakes adjacent buildings can react in markedly different ways due to differences in construction, leading to little correlation between nearby damage levels.
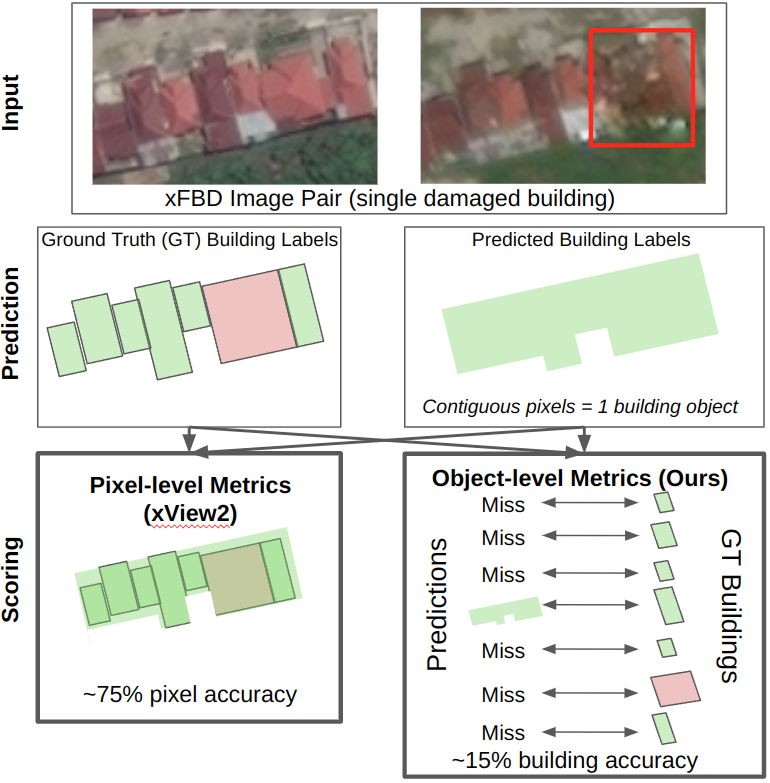
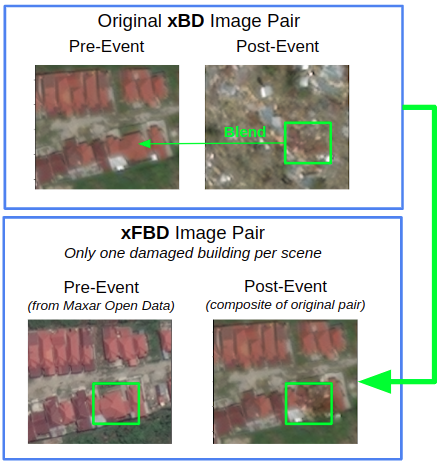
In summary, we find that in xBD adjacent buildings’ labels are highly correlated, damage labels often do not relate to the appearance of the building but to its context, and that all of the “top-five” xView2 solutions are surprisingly blind to damaged buildings in undamaged surroundings. To quantify this “context independent classification” capability, we release an augmented version of xBD called xFBD (Focused Building Damage). Our augmented post-event images contain pre-disaster undamaged content, except for one damaged building which is realistically spliced in. We introduce some baselines that are compared to the top five xView2 solutions using the original xView2 metrics, alongside new metrics. These new metrics help quantify network decisions at the building-level instead of the individual pixel scale (see Figure 1).
2 Description of xView2 challenge
The xView2 challenge and the related xBD dataset were released in 2019 to advance “change detection and building damage assessment for humanitarian assistance and disaster recovery research” [7]. For 16 disasters of 6 types, pre- and post-disaster geo-registered satellite imagery is provided as RGB chips. About 850,000 human-labeled building geo-polygons are also provided. Each polygon has a damage level based on a four-level scale (Table 1).
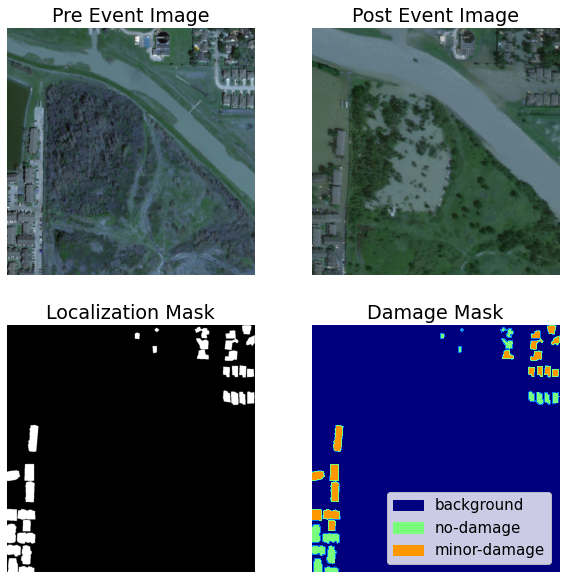
The xView2 challenge tasked participants to provide a system . Given a pre-disaster image () and a post-disaster image (), the system should output a building localization mask () and a damage-level prediction mask for pixels predicted to be buildings (), i.e. . Solutions are scored first on the F1 score of their localization prediction, compared pixel-wise against a ground truth mask (Figure 2, lower left). For pixels where a building is predicted, the class-wise damage F1 is also computed pixel-wise against a ground truth mask (Figure 2, lower right). The overall “score” for xView2 is a weighted mean of 30% localization F1 and 70% overall damage F1.
| Name | Description |
|---|---|
| Undamaged | Undisturbed. No sign of water, structural, or shingle damage, or burn marks |
| Minor Damage | Partially burnt, water surrounding structure, volcanic flow nearby, roof elements missing, or visible cracks. |
| Major Damage | Partial collapse, encroaching volcanic flow, or surrounded by water/mud. |
| Destroyed | Scorched, collapsed, covered with water/mud, or no longer present. |
3 Related Work
After the xView2 challenge the top five solutions were released to GitHub [4, 18, 10, 20, 12]. As can be seen in the first row of Table 3, all of the top results have very close competition scores. These scores imply the presence of some performance “ceiling” for this data. Furthermore, of the 75 published works which have since cited the xBD dataset[7], there does not appear to be a method which significantly outperforms the top-5 solutions.
The first-place solution [4] implements 4 pre-trained networks re-trained mostly on pre-event xBD images, with occasional post-event images used as augmentation. Dice [16] and focal [13] loss are used to incentivize high-resolution localization, which is important for dense building clusters.
Like the first place solution, the second [18] and third [10] place solutions use network ensembles. The fourth [20] and fifth [12] place solutions are much lighter while maintaining close to top level performance. Most notable for the work described in this paper, the fourth place solution is described in [21]. This solution uses a siamese network: a pre-event image ResNet [9] generates location predictions, and a post-event ResNet fuses pre-event branch features with post-event image features to predict damage.
Since the xView2 competition ended a number of works have used the xBD dataset. However, we have not seen marked improvement over the top-5 solutions. Da et al. [2] reported a slight improvement in damage F1 scores using a Siamese Hierarchical Transformer Framework.
Bouchard et al. [1] notes that the challenge does not capture how well a damage assessment network will adapt to an entirely-unseen city or disaster type. This uncertainty is due to the train/test data splits being based on different parts of the same general areas of the same disasters.
4 Need for Further Analysis of xView2
4.1 Inconsistency of Labelling
The xView2 challenge can be considered to be a 5-class pixel-wise classification problem. Every location in an image must be classified as one of: not-building (background), no-damage, minor-damage, major-damage, or destroyed. Upon visual inspection, it is not clear that the 4 damage categories are always distinguishable by any visible feature on the roof. Figure 3 shows an example of such a case. The features of each building do not provide obvious evidence that these buildings belong to different classes. This class ambiguity is supported by the challenge’s descriptions of damage classes (Table 1). These descriptions do not all pertain to pixels belonging to a building (building pixels) but frequently to the building’s context. The lack of distinguishing features between classes may lead to network confusion and lower performance across categories.

In order to further analyze the xView2 challenge solutions, we select the fourth place solution (which we call 4PS) developed by Zheng et al. [21] as an exemplar. The 4PS was selected to avoid lengthy model ensemble training/inference time while maintaining top xView2 performance. All top 5 solutions’ overall scores are within 0.03, so it is likely they will perform similarly in our experiments. We re-implemented the 4PS in Pytorch-Lightning [5].
Using the 4PS, we can analyze if the four damage categories contain enough signal for networks to usefully distinguish them. We collapse the classification problem into two classes (low-/high-damage) from the original four. The 4PS has relatively low performance on the minor and major damage classes of the original problem, but when predictions are collapsed into two categories the overall performance improves (Table 2). The network is able to distinguish between mostly untouched vs. damaged buildings, but has more difficulty making decisions in the 4 class space. The four damage categories may be too subtly defined for a network to effectively distinguish them.
| Pixel Level F1 Scores | Sample Count | |
|---|---|---|
| No Damage | 0.9264 | 313,033 |
| Minor damage | 0.5969 | 38,860 |
| Major Damage | 0.7442 | 29,904 |
| Destroyed | 0.8317 | 31,560 |
| Pixel Level F1 Scores | |
|---|---|
| No Damage + Minor Damage | 0.9377 |
| Major Damage + Destroyed | 0.8234 |
4.2 Object-level Performance
The xView2 challenge focused on pixel-level F1 scores. However, it may be more intuitive to understand damage at a building (instead of pixel) level. For example, we may wish to understand how many homes have been destroyed to determine relief requirements, instead of the “destroyed area” estimate that a pixel-level paradigm produces. Thus, we propose a set of object-level metrics to quantify how networks understand damage on a building level.
The object-level metrics are formulated using the xBD label files containing building polygons associated with labels. These are converted to a COCO object-detection dataset [14]. A similar COCO dataset is built from a solution’s localization and damage prediction masks. The localization mask is converted into objects using connected component labeling. For each predicted building, the damage mask pixels belonging to it determine the its label via majority vote. Object F1 scores are calculated via KWCOCO [11] at IoU=0.5 for overall localization and the 4 damage categories.
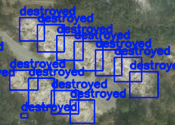
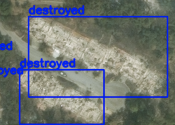
Table 3 shows the top-5 solutions’ xBD holdout set performance on our object-level metrics. The original xView2 overall score is provided to verify that our codebases have similar performance to the originally submitted solutions. Performance in all object-level scores is fairly low. While these numbers cannot be directly compared to the pixel-wise scores, as they measure very different things, the low object-level scores indicate that top-5 networks do not tend to make per-building decisions. Instead, they group and predict labels for ‘swathes’ of buildings together (see Figure 4). In the xView2 challenge, the network is not penalized for making one prediction for a group of several buildings if they all share a damage label, leading to the formation of connected swathes of buildings.
| xView2 Solution # | ||||||
|---|---|---|---|---|---|---|
| 1 | 2 | 3 | 4 | 5 | ||
|
0.78 | 0.81 | 0.79 | 0.76 | 0.73 | |
|
0.44 | 0.43 | 0.42 | 0.40 | 0.45 | |
|
0.45 | 0.41 | 0.40 | 0.36 | 0.41 | |
|
0.16 | 0.25 | 0.21 | 0.24 | 0.21 | |
|
0.24 | 0.27 | 0.25 | 0.30 | 0.32 | |
|
0.33 | 0.38 | 0.37 | 0.37 | 0.40 | |
4.3 Influence of Context on Network Performance
Experimental Setup. From our understanding that xView2 solutions tend to predict swathes of damage, as opposed to making building-wise decisions, the question of the importance of context arises. Are solutions making damage decisions based on building features or on the appearance of the surrounding area? For disasters such as flooding, this is understandable. Buildings may be left standing but the surrounding water makes it clear the structure is destroyed. However, for other disasters this prior may cause unintended consequences. A tornado may rip through a town, but a building next to the destruction may be spared. If xView2 solutions have a heavy dependence on context and are used to determine disaster relief allocations, resources are likely to be sent to areas with widespread damage. But, single damaged buildings surrounded by undamaged buildings might be missed and not receive needed aid. Thus, we seek to quantify context’s importance to xView2 solutions.
In order to test the influence of context we form a composite post-disaster image, containing one damaged building from the original post-disaster image. All other buildings, along with the background, are drawn from the pre-disaster image. An example of this blending procedure is shown in Figure 5. Blending in a single building tests whether solutions can detect hyper-local damage.
Our composite image is formed via Poisson Blending [17] to enable a realistic blend. The original xBD labels are used to form a mask of which semantic area (i.e. the damaged building of interest) of the post-image to blend into the pre-image. The target network output masks are updated accordingly, with all buildings re-labeled as “undamaged” except for the blended building which retains its label. In generating our augmented data, we seek to avoid creating a very simple change detection problem where the only pixel-level change between pre- and post-disaster is the blended building. Thus, a secondary pre-disaster image is downloaded from Maxar’s Open Data Program [15] from a different date than the original. The Palu Tsunami disaster is chosen for this experiment as it has a balanced mixture of damage levels in both damaged and undamaged contexts, and the secondary pre-images chosen for it are high-quality and well geo-aligned with the originals.
To verify that these secondary pre-images are appropriate for use we predict on the holdout set using the 4PS, giving the network the secondary pre-image as its pre-event input and the original post-image as its post-event input. The results in Table 4 indicate that performance does not drop significantly with the new pre-images, which gives us confidence that we have not missed some artifact in the new imagery that could affect results. Further experiments all test using the new pre-images. Therefore, comparisons between methods which are trained on the original pre-images remain fair, since all methods would experience the relatively small drop in performance from using the new pre-image.
| Pre-Image: |
|
|
|||
| Pixel Level Scores | Localization F1 | 0.8953 | 0.7812 | ||
| No Damage F1 | 0.9578 | 0.9056 | |||
| Minor Damage F1 |
|
|
|||
| Major Damage F1 | 0.1845 | 0.2169 | |||
| Destroyed F1 | 0.7701 | 0.6968 | |||
| Object Level Scores | Localization F1 | 0.13 | 0.06 | ||
| No Damage F1 | 0.12 | 0.05 | |||
| Minor Damage F1 |
|
|
|||
| Major Damage F1 | 0.02 | 0.01 | |||
| Destroyed F1 | 0.16 | 0.07 |

Results. 4PS pixel and object-level results are shown in Table 6, column 4. Damage F1 scores for buildings blended in are low, indicating that the network is not triggering on the damage features of a given building. Instead, it is likely classifying based on surrounding buildings/context.
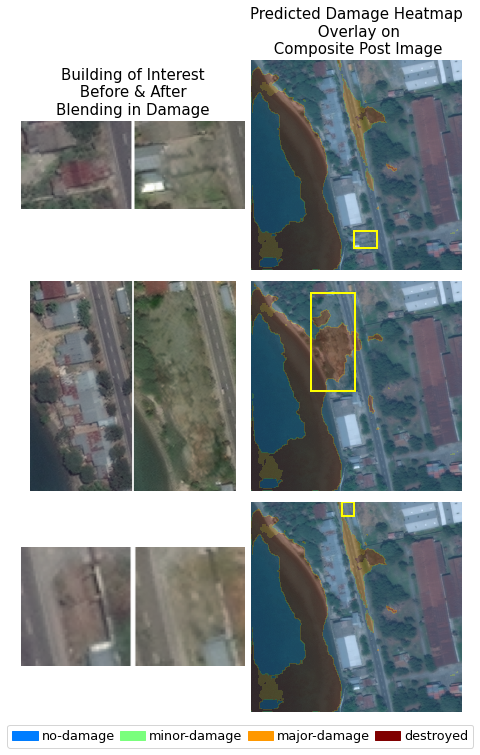
Further qualitative understanding can be gained from analyzing the underlying damage heatmap output by the 4PS. The heatmap is the final stage of the 4PS damage branch, which is later combined with the predicted building locations to generate the final output. In Figure 7, different damaged buildings (left) are blended into the same undamaged pre-event image. The heatmap output from the composite images is shown on the right. Of interest is the relatively minor changes in the damage heatmap, even as the building which is damaged changes. The only significant change in the heatmap occurs when the largest building is replaced with its damaged post-event counterpart. Small buildings being damaged appear to not affect the network’s output, further evidence that the network is not classifying on a building-level basis. Instead, wide areas are used to make more global decisions for all buildings in particular areas. Further evidence of this issue is shown in Figure 6, which shows several examples of damaged buildings surrounded by undamaged buildings in the original xBD dataset. The 4PS network is unable to correctly classify these samples, instead lumping them in with nearby buildings.
5 xFBD dataset & challenge formulation
In order to further research in this area, we release the dataset created for the single damaged building blend experiment. We also formulate an auxiliary challenge to xView2 called xFBD: Focused Building Damage Assessment. xFBD is not intended to replace xView2, which provides valuable damage prediction performance information. xFBD instead supplements the understanding of a solution’s performance in two areas: 1) The ability to distinguish buildings from each other and thus provide more accurate building counts, and 2) The ability to make classifications from individual buildings’ features instead of wider areas of damage, increasing confidence in individual building assessments. Table 5 shows descriptive statistics of the xFBD dataset. Not all Palu Tsunami images in xBD are used to generate samples as some do not have a high quality secondary pre-event image available.
Solutions are scored on both the original xBD dataset and the new xFBD dataset. Better performance on xFBD, ideally, would not cause a drop in xBD performance. Each solution is scored on both the original pixel-level xView2 metrics and the object-level metrics introduced here.
A connected component analysis was used in our experiments with the top xView2 solutions to generate object-level predictions from the predicted semantic masks. We do not require this method be used: solutions may generate object- and pixel-level predictions in parallel or in any order. For example, Mask-RCNN [8] first generates an object-level prediction, then a pixel mask for the object.
| train (tier1) | test | hold | ||
|---|---|---|---|---|
|
5287 | 1466 | 1274 | |
| # source images used | 76 | 27 | 28 | |
|
4747 | 1235 | 940 | |
|
539 | 231 | 334 | |
|
1 | 0 | 0 |
5.1 xFBD Results for Current SOTA
In comparison to the original xView2 results, the top-5 solutions perform poorly on the xFBD dataset (Table 6). In the case of a single destroyed building in an otherwise-undamaged landscape one might expect still-reasonable performance, but the best object-level F1 from the top-5 is 0.06. This indicates that the top networks are more dependent on adjacent buildings and other damage context than is useful for hyper-local damage detection.

| 1 | 2 | 3 | 4 | 5 | |||
| Pixel-Level |
|
0.76 | 0.77 | 0.76 | 0.76 | 0.75 | |
|
0.88 | 0.91 | 0.91 | 0.91 | 0.85 | ||
|
n/a | n/a | n/a | n/a | n/a | ||
|
0.00 | 0.01 | 0.01 | 0.02 | 0.01 | ||
|
0.08 | 0.11 | 0.07 | 0.07 | 0.07 | ||
| Object-Level |
|
0.06 | 0.06 | 0.05 | 0.04 | 0.06 | |
|
0.06 | 0.06 | 0.05 | 0.04 | 0.06 | ||
|
n/a | n/a | n/a | n/a | n/a | ||
|
0.00 | 0.00 | 0.00 | 0.00 | 0.00 | ||
|
0.00 | 0.00 | 0.01 | 0.00 | 0.00 |
5.2 Realism of xFBD Images
We must ensure that xFBD images are realistic enough to be useful training and evaluation data. To do so, we use xFBD samples to finetune the 4PS network. We examine the finetuned performance on a test set of real isolated damaged buildings drawn from original xBD data.
Our test set is generated by first filtering all xBD building labels present in the xFBD test and hold sets. Major-damage or destroyed buildings were selected which did not have other damaged buildings within a 50 pixel radius. These buildings were then hand-filtered to ensure they represented true isolated damage: samples where the building was surrounded by obvious evidence of destruction such as destroyed forest were removed. This filtering left 45 damaged samples. 45 undamaged buildings were also selected from xFBD to balance the test set.
A 4PS network trained on xBD was finetuned using the xFBD train split. We then evaluated both the original and finetuned version of the 4PS on our real isolated damage test images. Scoring was done only on pixels belonging to the 90 buildings from our test set. Results are shown in Table 7.
| Original | Finetuned xFBD | |
|---|---|---|
| No-damage F1 | 0.696 | 0.661 |
| Minor-damage F1 | n/a | n/a |
| Major-damage F1 | 0.000 | 0.508 |
| Destroyed F1 | 0.000 | 0.192 |
The original 4PS network fails to detect the isolated damaged buildings in our test set. However, by introducing xFBD samples during training the network begins to detect such situations in real life. These results suggest that our synthetic samples are realistic enough to be a good proxy for real buildings where damage has occurred but damage to the building’s surroundings has not.
5.3 Tight Building Chip Experiment
We wish to verify that there is enough information present in the dataset we provide to get better object-level results than the current top-5 solutions. Thus, we use EfficientNet-b7 [19] as a simple classifier to show that with ideal localization performance, it is possible to improve on current best object-level damage F1 scores. An example input to the EfficientNet is shown in Figure 8. Individual buildings are chipped from the images available in the xBD training set, and are cropped to the xBD annotated building polygon. Both the pre-event and post-event chips are combined to form a six channel image, which is then padded to create a consistent input size. The network is asked to classify the building chip as one of the four damage classes. This is a relatively unoptimized experiment but is able to outperform xView2 solutions on object-level metrics for the holdout set of buildings, as seen in Table 8. We compare against the 5th place xView2 solution as a representative of the performance level of xView2 solutions overall. Thus, we feel there is more object-level performance a network could achieve on xFBD by just looking at detected building pixels and not relying so heavily on context.
| Object Level Results | Chip Classifier | xView2 5th Place Model |
|---|---|---|
| Localization F1 | n/a (pre-chipped) | 0.45 |
| No-damage F1 | 0.68 | 0.41 |
| Minor-damage F1 | 0.46 | 0.21 |
| Major-damage F1 | 0.47 | 0.32 |
| Destroyed F1 | 0.36 | 0.40 |
6 New Baseline Models
| Method | Localization | Destroyed | Major Damage | Minor Damage | No Damage | |
|---|---|---|---|---|---|---|
| Pix-Level | 4PS | 0.860 | 0.822 | 0.719 | 0.508 | 0.922 |
| 4PS-Focal | 0.857 | 0.794 | 0.694 | 0.513 | 0.907 | |
| 4PS-Contour | 0.849 | 0.787 | 0.703 | 0.569 | 0.908 | |
| Mask-RCNN | 0.699 | 0.605 | 0.429 | 0.277 | 0.675 | |
| Obj-Level | 4PS | 0.440 | 0.420 | 0.340 | 0.240 | 0.420 |
| 4PS-Focal | 0.440 | 0.430 | 0.360 | 0.210 | 0.400 | |
| 4PS-Contour | 0.410 | 0.350 | 0.310 | 0.240 | 0.360 | |
| Mask-RCNN | 0.470 | 0.280 | 0.300 | 0.180 | 0.450 |
| Method | Localization | Destroyed | Major Damage | Minor Damage | No Damage | |
|---|---|---|---|---|---|---|
| Pix-Level | 4PS | 0.758 | 0.066 | 0.016 | n/a | 0.907 |
| 4PS-Focal | 0.742 | 0.042 | 0.000 | n/a | 0.873 | |
| 4PS-Contour | 0.741 | 0.060 | 0.000 | n/a | 0.887 | |
| Mask-RCNN | 0.494 | 0.013 | 0.011 | n/a | 0.522 | |
| Obj-Level | 4PS | 0.040 | 0.000 | 0.000 | n/a | 0.040 |
| 4PS-Focal | 0.040 | 0.010 | 0.000 | n/a | 0.010 | |
| 4PS-Contour | 0.050 | 0.000 | 0.000 | n/a | 0.050 | |
| Mask-RCNN | 0.210 | 0.000 | 0.000 | n/a | 0.200 |
We develop new xFBD baselines by refactoring the 4PS loss function and exploring the original xView2 baseline. Tables 9(a) and 9(b) show these methods are able to outperform the original 4PS on our object-level metrics, but more work is needed to achieve significant improvements. The following losses and models are proposed to improve damage prediction by better separating connected objects:
4PS-Focal. Extended from binary cross entropy loss, focal loss [13] was initially designed to improve one-stage object detection. We train a soft dice (SD) loss alongside a version of the focal loss where a modulating factor is added to the cross entropy loss with tuneable focusing parameter . The 4PS-Focal loss is:
| (1) | |||
| (2) | |||
| (3) | |||
| (4) |
is the total number of pixels in an image, and is element-wise product. controls the effect of the modulating factor. We found to work best in our experiments.
4PS-Contour. A contour loss [3, 6] is introduced to help the network learn more accurate (and separable) boundaries for buildings. The contour loss function is:
| (5) | |||
| (6) |
where . is a pixel loss [3], describing the similarity of two sets of image pixels. To avoid a zero denominator, is 1.
Mask-RCNN [8] is the original baseline model for xView2. While this model did not yield good results on pixel-level metrics, it has a built-in understanding of objects as an object-detection network. It is thus able to achieve the best object-level xBD localization and performs significantly better than 4PS-based models in xFBD object-level localization. Further work is needed to improve object classification and pixel scores, but Mask-RCNN shows promise in resolving some issues present in xView2 solutions.
7 Conclusion
We have demonstrated that xView2 solution networks are highly dependent on a building’s surrounding context for performance. Isolated damaged buildings present a considerable challenge. In scenarios where accurate localization of individual damaged buildings is important, incentivizing networks to independent decisions for separate building objects could help disaster analysts significantly. The augmented dataset we propose features pre/post event image pairs with only one building changing damage state between the two images, through a Poisson Blend process.
Future versions augmenting the entire xBD dataset for all disasters may enable an increase in “independent building analysis” performance, as measured by a “single-building paste” experiment (Table 6). A filter must be applied to exclude buildings from the blending process whose damage is not visible from roof pixels, like many buildings in flooding disasters. The current baseline methods have room to grow for the new object-level metrics proposed. More saliency-related research is also needed to understand any artifacts of the augmentation and how those may influence network localization and classification decisions.
By developing object-level damage metrics and a dataset focused on isolated building damage detection, our paper helps to advance artificial intelligence for disaster relief.
Acknowledgements: This material is based upon work supported by Air Force Research Laboratory, Analytical Systems Branch (AFRL/RIED) under contract number FA8750-21-C-1514.
References
- [1] Isabelle Bouchard, Marie-Ève Rancourt, Daniel Aloise, and Freddie Kalaitzis. On transfer learning for building damage assessment from satellite imagery in emergency contexts. Remote Sensing, 14(11):2532, 2022.
- [2] Yifan Da, Zhiyuan Ji, and Yongsheng Zhou. Building damage assessment based on siamese hierarchical transformer framework. Mathematics, 10(11):1898, 2022.
- [3] Ruoxi Deng, Chunhua Shen, Shengjun Liu, Huibing Wang, and Xinru Liu. Learning to predict crisp boundaries. In Proceedings of the European Conference on Computer Vision (ECCV), pages 562–578, 2018.
- [4] Victor Durnov. xview2_first_place. https://github.com/DIUx-xView/xView2_first_place, 2020.
- [5] William Falcon and The PyTorch Lightning team. PyTorch Lightning, 3 2019.
- [6] Fang Fang, Kaishun Wu, Yuanyuan Liu, Shengwen Li, Bo Wan, Yanling Chen, and Daoyuan Zheng. A coarse-to-fine contour optimization network for extracting building instances from high-resolution remote sensing imagery. Remote Sensing, 13(19):3814, 2021.
- [7] Ritwik Gupta, Bryce Goodman, Nirav Patel, Ricky Hosfelt, Sandra Sajeev, Eric Heim, Jigar Doshi, Keane Lucas, Howie Choset, and Matthew Gaston. Creating xbd: A dataset for assessing building damage from satellite imagery. In Proceedings of the IEEE/CVF Conference on Computer Vision and Pattern Recognition (CVPR) Workshops, June 2019.
- [8] Kaiming He, Georgia Gkioxari, Piotr Dollár, and Ross Girshick. Mask r-cnn. In 2017 IEEE International Conference on Computer Vision (ICCV), pages 2980–2988, 2017.
- [9] Kaiming He, Xiangyu Zhang, Shaoqing Ren, and Jian Sun. Deep residual learning for image recognition, 2015.
- [10] Eugene Khvedchenya. xview2_third_place. https://github.com/DIUx-xView/xView2_third_place, 2020.
- [11] Jon Crall Kitware. Kwcoco. https://github.com/Kitware/kwcoco, 2021.
- [12] Jamyoung Koo. xview2_fifth_place. https://github.com/DIUx-xView/xView2_fifth_place, 2020.
- [13] Tsung-Yi Lin, Priya Goyal, Ross Girshick, Kaiming He, and Piotr Dollár. Focal loss for dense object detection. In Proceedings of the IEEE international conference on computer vision, pages 2980–2988, 2017.
- [14] Tsung-Yi Lin, Michael Maire, Serge Belongie, Lubomir Bourdev, Ross Girshick, James Hays, Pietro Perona, Deva Ramanan, C. Lawrence Zitnick, and Piotr Dollár. Microsoft coco: Common objects in context, 2014.
- [15] Maxar. Maxar open data program. https://www.maxar.com/open-data, 2022.
- [16] Fausto Milletari, Nassir Navab, and Seyed-Ahmad Ahmadi. V-net: Fully convolutional neural networks for volumetric medical image segmentation. In 2016 fourth international conference on 3D vision (3DV), pages 565–571. IEEE, 2016.
- [17] Patrick Pérez, Michel Gangnet, and Andrew Blake. Poisson image editing. ACM Trans. Graph., 22(3):313–318, jul 2003.
- [18] Selim Seferbekov. xview2_second_place. https://github.com/DIUx-xView/xView2_second_place, 2020.
- [19] Mingxing Tan and Quoc V. Le. Efficientnet: Rethinking model scaling for convolutional neural networks, 2019.
- [20] Zhuo Zheng. xview2_fourth_place. https://github.com/DIUx-xView/xView2_fourth_place, 2020.
- [21] Zhuo Zheng, Yanfei Zhong, Junjue Wang, Ailong Ma, and Liangpei Zhang. Building damage assessment for rapid disaster response with a deep object-based semantic change detection framework: From natural disasters to man-made disasters. Remote Sensing of Environment, 265:112636, 2021.