The role of beta-amyloid and tau proteins in Alzheimer’s disease: a mathematical model on graphs
Abstract
In this Note we study a mathematical model for the progression of Alzheimer’s Disease in the human brain. The novelty of our approach consists in the representation of the brain as two superposed graphs where toxic proteins diffuse, the connectivity graph which represents the neural network, and the proximity graph which takes into account the extracellular space. Toxic proteins such as -amyloid and play in fact a crucial role in the development of Alzheimer’s disease and, separately, have been targets of medical treatments. Recent biomedical literature stresses the potential impact of the synergetic action of these proteins. We numerically test various modelling hypotheses which confirm the relevance of this synergy.
Keywords: Alzheimer’s disease, models on graphs, A and -proteins, Smoluchowski equations, numerical simulations.
Mathematics Subject Classification: 05C90, 35A01, 35B40, 35Q92,92C50.
1 Introduction
Alzheimer’s disease (AD) is a neurodegenerative disease characterized by a progressive decline in memory and other cognitive functions, leading ultimately to dementia. According to the 2019 World Alzheimer Report, it is estimated that there are presently 50 million people living with AD and related disorders, and this figure is expected to increase to 150 million by 2050 due to an increasingly aged population.
AD was first described in 1907 by Alois Alzheimer who associated AD with histopathological hallmarks in the brain: senile plaques and neurofibrillary tangles (NFTs). Only after 1980 it was discovered that plaques consist primarily of aggregates of amyloid beta peptides (A) [25], whereas the main constituent of neurofibrillary tangles is misfolded tau protein () [32]. In 1992, Hardy and Higgins ([33]) formulated the so-called amyloid cascade hypothesis for the progression of AD: “the deposition of A, the main component of the plaques, is the causative agent of Alzheimer’s pathology and the neurofibrillary tangles, cell loss, vascular damage, and dementia follow as a direct result of this deposition”. Subsequently, this hypothesis has been revised along the years: although senile plaques are associated with AD, their presence is not strictly related to the severity of the disease. High levels of soluble A correlate better with the presence and degree of cognitive deficits. Indeed, diffuse amyloid plaques are commonly present in the brains of cognitively intact elderly people. Some authors (see for instance [35]) overturn the traditional perspective, and claim that large aggregates of A can actually be inert or even protective to healthy neurons. Analogously, A monomers have been shown to lack neurotoxicity [79] and have in fact been suggested to be neuroprotective [80, 71].
In addition, experimental data have shown that the amyloid cascade hypothesis fails to provide a fully satisfactory description of the evolution of AD, since A and seem to act in a synergistic fashion to cause cell death (see, e.g., [37] and [78]). On the basis of these results, it has been postulated that, in the AD progression, “A is the trigger and is the bullet” ([10]).
Thus, though A and remain currently the major therapeutic targets for the treatment of AD (but so far effective therapies are lacking), we shall see in Section 2 that recent literature suggests that the interplay between the two proteins should be crucial in the development of the disease and must be taken into account for the development of new therapies that should not be targeted to the two proteins separately. We refer for instance to [7] for a discussion on the current medical literature.
Mathematical models are the basis for computer simulations, the so-called in silico research which effectively supplements in vivo and in vitro research. An exhaustive historical overview of existing mathematical models for AD up to 2018 can be found in [66]. Among more recent contributions to macroscopic modeling, we mention [63],[6],[70], [21], [72], [73], [74], [67], [75], [76], [68], and references therein. Several mathematical models, their difficulties, pros and cons are discussed in [7], where the authors propose a highly flexible mathematical model aimed to take into account as many features of the current research as possible. For a detailed presentation of the connections between this model and various bio-medical interpretations, we refer to [7].
In this Note we present a reduced form of the model in [7], focused on the study of the interplay of A and and their toxic effect on neurons, though with progressive completeness and complexity. In particular, we face the mathematical difficulty that A is mainly found in the extracellular space and propagates by proximity, while the greater part of is located within the neurons and propagates by neural connectivity [64] (see Section 3).
The core of this paper is the discussion of several numerical simulations, which, thanks to the flexibility of the model, enable us to compare different hypotheses, such as the amyloid cascade hypothesis and different models for the interaction between A and .
Our mathematical model relies on a conceptual scheme that is currently largely accepted in bio-medical literature. Roughly speaking, AD is described as a sequence of the following events: (a) the first pathological event in AD onset is the overproduction (or the inefficient clearance) of the A peptide. The polymerization of the extracellular toxic A leads ultimately to plaque deposition. (b) Toxic A triggers -pathology, inducing misfolding of the physiological within neurons and its agglomeration, yielding the formation of toxic polymers and NFT. (c) Tau pathology spreads to connected brain regions, driving the neurodegenerative process (we refer for instance to [26], Fig.16.1).
2 Interplay of A and proteins in AD
Let us start by sketching the most relevant properties of the two proteins. At the microscopic level of the neuronal membrane, monomeric A peptides originate from the proteolytic cleavage of a transmembrane glycoprotein, the amyloid precursor protein (APP). By unknown and partially genetic reasons, some neurons present an imbalance between produced and cleared A. On the other hand, macroscopic phenomena take place at the level of the cerebral parenchyma. The monomeric A diffuses through the microscopic tortuositiy of the brain and undergoes a process of agglomeration, leading eventually to the formation of long, insoluble amyloid fibrils, which accumulate in spherical deposits known as senile plaques (those observed by Alzheimer in his post-mortem studies).
The -protein is mainly found within axons where it stabilizes microtubules, but is also present in smaller amounts in dendrites and in the extracellular space. In AD and other taupathies the protein undergoes two pathological transformations: hyperphosphorylation and misfolding (see e.g. [28]). In the disease state, the amount of hyperphosphorylated is at least three times higher than that in the normal brain [36]. Hyperphosphorylation of negatively regulates the binding of to microtubules, compromizing microtubule stabilization and axonal transport. It also increases the capacity of to self-assemble and form aggregates from oligomers to fibrils, eventually leading to its deposition as NFTs [27]. Furthermore, it has been observed that excess aggregates can be released into the extracellular medium, to be internalized by surrounding neurons and induce the fibrillization of endogenous ; this suggests a role for seeding in neurodegeneration [30]. This is the so-called mechanisms of release and uptake of the protein.
The soluble monomers and oligomers of the two proteins move in the brain parenchyma. We distinguish two different mechanisms for their diffusion, one for the intracellular inside the connectome (by connectivity, i.e. along neural connections in the brain), and the other one by proximity in the extracellular space for the extracellular A.
In AD both A oligomers and misfolded oligomers are known to have a toxic effect on neurons (synaptic dysfunction, neurofibrillary tangle mediated neuron loss, and behavioral deficits), though it is still not well understood which is the precise role of each protein in the progression of the neurodegeneration. In particular, recent studies stress that it is crucial to understand the interplay between the two proteins (see e.g. [14], [40], [42], [37], [52]). In [37] possible A- interactions are extensively discussed, suggesting that A drives pathology by causing hyperphosphorylation of , which in turn mediates toxicity in neurons, whereas mediates A toxicity and A and amplify each others toxic effects.
3 Parcellation and connectome
The geometric setting of our mathematical model for the interactions between A and must take into account the respective diffusion modes: by proximity (i.e. with a local character) and by connectivity (possibly with a non-local character). Therefore we identify the cerebral parenchyma with a pair of superposed graphs associated with a parcellation of the brain, i.e. a subdivision of the human cerebral cortex into a patchwork of anatomically and functionally distinct areas (parcels).
Following the approach proposed in [69], we consider a parcellation of the brain and an associated network of white-matter fiber pathways connecting these structures. As in [69], [70], [73] we represent this network by means a finite weighted graph in which the vertices , are identified with points , and represent the -th cortical or subcortical gray matter structure (i.e.the -th parcel), while the edges represent the connections by white-matter fiber pathways between the -th structure and the -th structure. Coherently, we introduce a family of coefficients that measure how much the -th structure and the -th structure are connected and are measured by fiber tractography [77], [69]. The coefficients are said the connectivity weights of the graph and we call the “connectivity graph”.
We also consider a second graph with the same vertices as , by taking a new family of edges that keep into account the Riemannian distance of the vertices and the heterogeneity of the cerebral parenchyma. We assume that, roughly speaking, two vertices are adjacent if they are “close enough”. We call the “proximity graph” and we associate with a family of weights that take into account the geodesic distance of the -th structure and the -th structure in the cerebral parenchyma. The use of two superposed graphs makes it possible to consider simultaneously the local diffusion of A and the non-local diffusion of . We refer to Remark 1 for a discussion and a comparison with the model in [63].
The weights and make possible to introduce the notion of (weighted) Laplacian on and . More precisely, If is a vertex of , we set
Associated with the graph , we can define the so-called graph Laplacian operator, as follows. Let be any function defined over the vertices of the graph. Then, for any :
| (1) |
The graph Laplacian is defined analogously.
4 The mathematical model
Arguing as in [7], the mathematical model for the interaction between A and consists of a set of equations on the graphs and for the densities of the two proteins, describing their aggregation, diffusion and interactions. Moreover, to describe the evolution of the disease, we introduce a kinetic-type equation for a function meant to describe the health state of the neurons in a fixed parcel . Roughly speaking, is the probability density of the degree of malfunctioning of neurons located in the -th parcel at time and is such that represents the fraction of neurons in the -th parcel which at time have a degree of malfunctioning between and . For a precise mathematical formulation in terms of probability measures, see [9]. We assume that close to stands for “the neuron is healthy” whereas close to stands for “the neuron is dead”. This parameter, although introduced for the sake of mathematical modeling, can be compared with medical images from Fluorodeoxyglucose PET (FDG-PET [49]).
In the present Note we consider a simplified formulation of the diffusion-agglomeration model described in [7]. This will enable us to carry on numerical simulations, enlightening the peculiar features of different possible scenarios for the disease, as well as the role played by the mutual relationships of the involved parameters. First of all, we ignore the presence of in the extracellular space (see, e.g., [30]) and hence the so-called mechanisms of release and uptake of the protein. These processes are carefully described in [7] with references to biomedical literature. Here, their contribution to the spreading of the intraneuronal is integrated in the diffusion equation within the neuronal network. As in [7], we keep the intra-neural diffusion process of governed only by the Laplace operator on the connectivity graph. Moreover, instead of considering oligomers of (almost) arbitrary length, we divide them in 5 compartments: monomers, dimers, short oligomers, long oligomers and plaques or tangles.
As for Smoluchowsi’s system, originally, in [59] Smoluchowski introduced a system of infinite discrete differential equations (without diffusion) for the study of rapid coagulation of aerosols. Smoluchowski’s theory was successively extended to cover different physical situations. In fact, this type of equations, describing the evolving densities of diffusing particles that are prone to coagulate in pairs, models various physical phenomena, such as, e.g. polymerization, aggregation of colloidal particles, formation of stars and planets as well as biological populations, behavior of fuel mixtures in engines. We refer to [19] for an historical account.
As far as we know, Smoluchowski’s equations for the description of the agglomeration of A first appears in [50] and then in [1] and [5]. Let us sketch qualitatively the arguments leading to these equations: for , let denote a polymer of length , that is a set of identical particles (monomers) that is clustered but free to move collectively in a given medium. In the course of time, polymers diffuse and, if they approach each other sufficiently close, with some probability they merge into a single polymer whose size equals the sum of the sizes of the two colliding polymers. For sake of simplicity we admit only binary reactions. This phenomenon is called coalescence and we write formally
for the coalescence of a polymer of size with a polymer of size .
Smoluchowski’s equations will be presented below. On the other hand, the progression of AD in the -th parcel is determined by the deterioration rate through a transport equation. More precisely, the equation for has the form (see (10) and (11) below):
| (2) |
where the deterioration rate depends on the average health state of the neurons in as well on the concentrations of toxic oligomers of A and in .
Thus we are lead to the following system in : if , let us denote by the molar concentration of A-polymers of length at the -th vertex of the graph at time , and by the molar concentration of misfolded polymers of length at the -th vertex of the graph at time .
If and , then the equation for A monomers is
| (3) |
where is the probability of two polymers to coalesce, takes into account the clearance of monomers, and is a source term that will be discussed later.
If , the equations for oligomers are
| (4) |
where takes into account the clearance of oligomers. Finally, the evolution of amyloid plaques is described by the equation
| (5) |
The equation for misfolded -monomers at and reads as
| (6) |
where, according to Braak staging ([18]) and denoting by the vertices in the entorhinal cortex, the source term for is for and elsewhere (see also [70]).
In addition, is the probability of two polymers to coalesce. If , the equations for oligomers are
| (7) |
for . Finally, the evolution of tangles is described by the equation
| (8) |
We choose the source term in equation (3) as:
| (9) |
where is the probability density of the degree of malfunctioning of neurons located at the -th cerebral region at time . We assume that close to stands for “the neuron is healthy” whereas close to stands for “the neuron is dead”. The function satisfies:
| (10) |
where
| (11) |
Here, and are meant to represent the toxic effect of and , respectively.
5 Numerical simulations and discussions
First of all, in this Section we present several numerical simulations of the mathematical model introduced in Section 4. Subsequently, we shall discuss variants of this model corresponding to different scenarios that have been considered in the biomedical literature.
As in [69], [70], the map of connectomes is extracted from a dataset of the MRI of a cohort of healthy subjects and diffusion-weighted MRI (dMRI) scans acquired previously and processed with a custom pre-processing connectomics pipeline. In our simulations, we retrieve the data from [53], [54], as well as the web site https://braingraph.org.
To perform numerical simulations, the choice of parameters is a crucial issue. Since the data available in the medical literature do not provide uniquely all the values we need, and, in addition, our model is meant to be descriptive and not predictive, we perform arbitrary but realistic choices. By “realistic” we mean that the outputs of our numerical simulations are in some way comparable with clinical data. The parameters that will be kept fixed are summarized in Table 1.
| 1015 | 1/i | 1/i | 0.1 | 4 | 10 | 0.001 | 0.1 | 0.01 | 0.01 | 0.001 | 0.001 | 10 | 0.01 |
The remaining parameters will be discussed later, testing various hypotheses concerning the progression of neurodegenerative processes associated with different choices of the constants . These parameters control respectively the A agglomeration, the production of monomeric driven by A oligomers and the seeding at the entorhinal cortex (modeled through the Gamma-shaped functions ).
As for the initial data, we choose of the form of a function approximating the Dirac delta centered in a point close to . Thus represents an (almost) healthy brain. Moreover, again in the spirit of starting from a healthy brain, we choose
| (12) |
In order to provide global pictures of the evolution of the disease in the brain (or in large portions of the brain), we introduce some macroscopic quantities (the total burden of A and and the average degree of malfunctioning): assuming that all parcels have the same volume, the global amounts of A and polymers are given (up to dimensional constants) by
| (13) |
where we recall that is the number of vertices of and . The evolution of the disease is described in each node of the brain network by:
| (14) |
Thus, the evolution of the disease in the whole brain in given by:
| (15) |
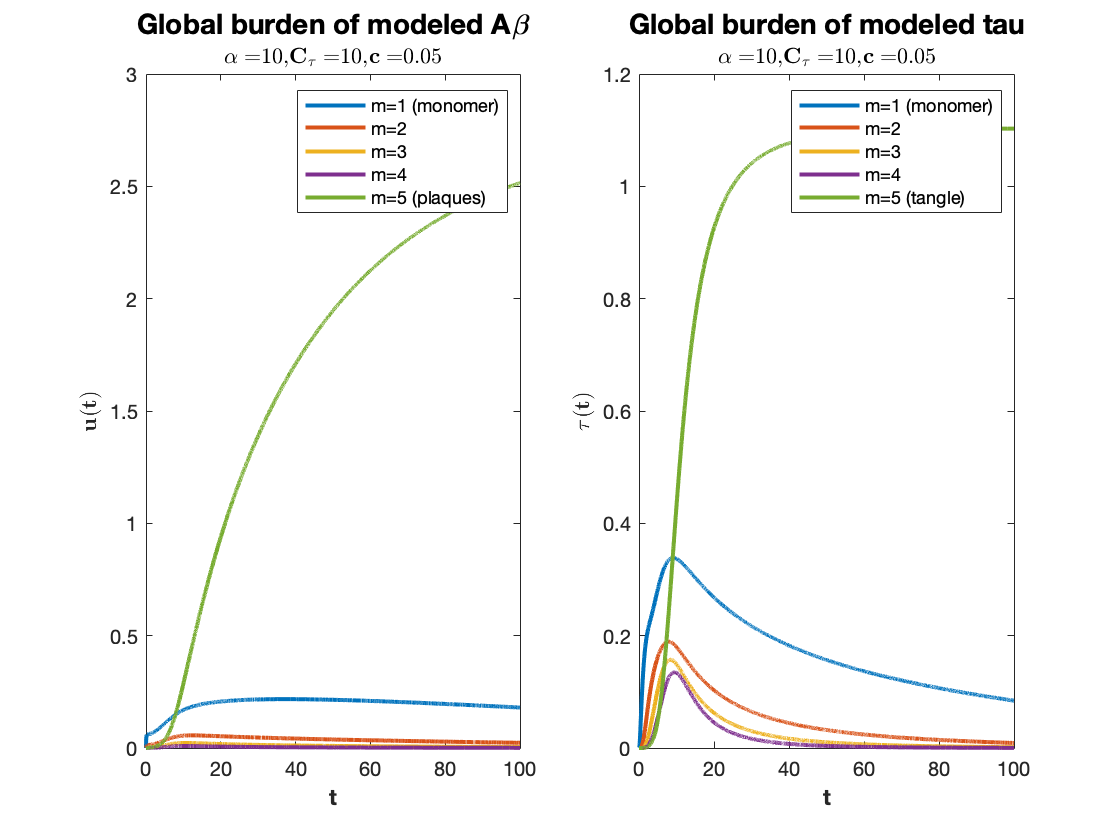
5.1 Total burden of A and in the whole brain
For both proteins, monomers’ curves are the first to rise followed by those of the oligomers in increasing length. Each monomeric and oligomeric curve peaks and subsequently begins to decrease. This corresponds to the clinical experience of advanced AD (see, e.g. [13]). Moreover, low concentration of A in CSF (Celebral Spinal Fluid) is listed among diagnostic criteria and differential diagnosis of Alzheimer’s disease from other dementias. This behavior is consistent with several factors. First, as for the A, the imbalance between the source and the clearance leads monomers to increase, while concerning -protein, the monomers’ growth is due to the seeding at EC and the effect of A oligomers. The first process drives the production of misfolded tau monomers at earlier times but then declines compatibly with the fact that the available pool of cleavable protein is limited, due to the loss of neurons. On the other hand, the production of misfolded -monomers, governed mainly by the effect of by A oligomers is lagged in time with respect to Gamma-shaped seeding since oligomers have to reach a certain amount to damage the neuron. The coagulation process described by means of Smoluchowski equation causes progressively the formation of larger oligomers leading to insoluble aggregates, taking active oligomers out of circulation. Insoluble clusters (plaques and tangles) are the last to develop and their curves show an increase while oligomers decrease.
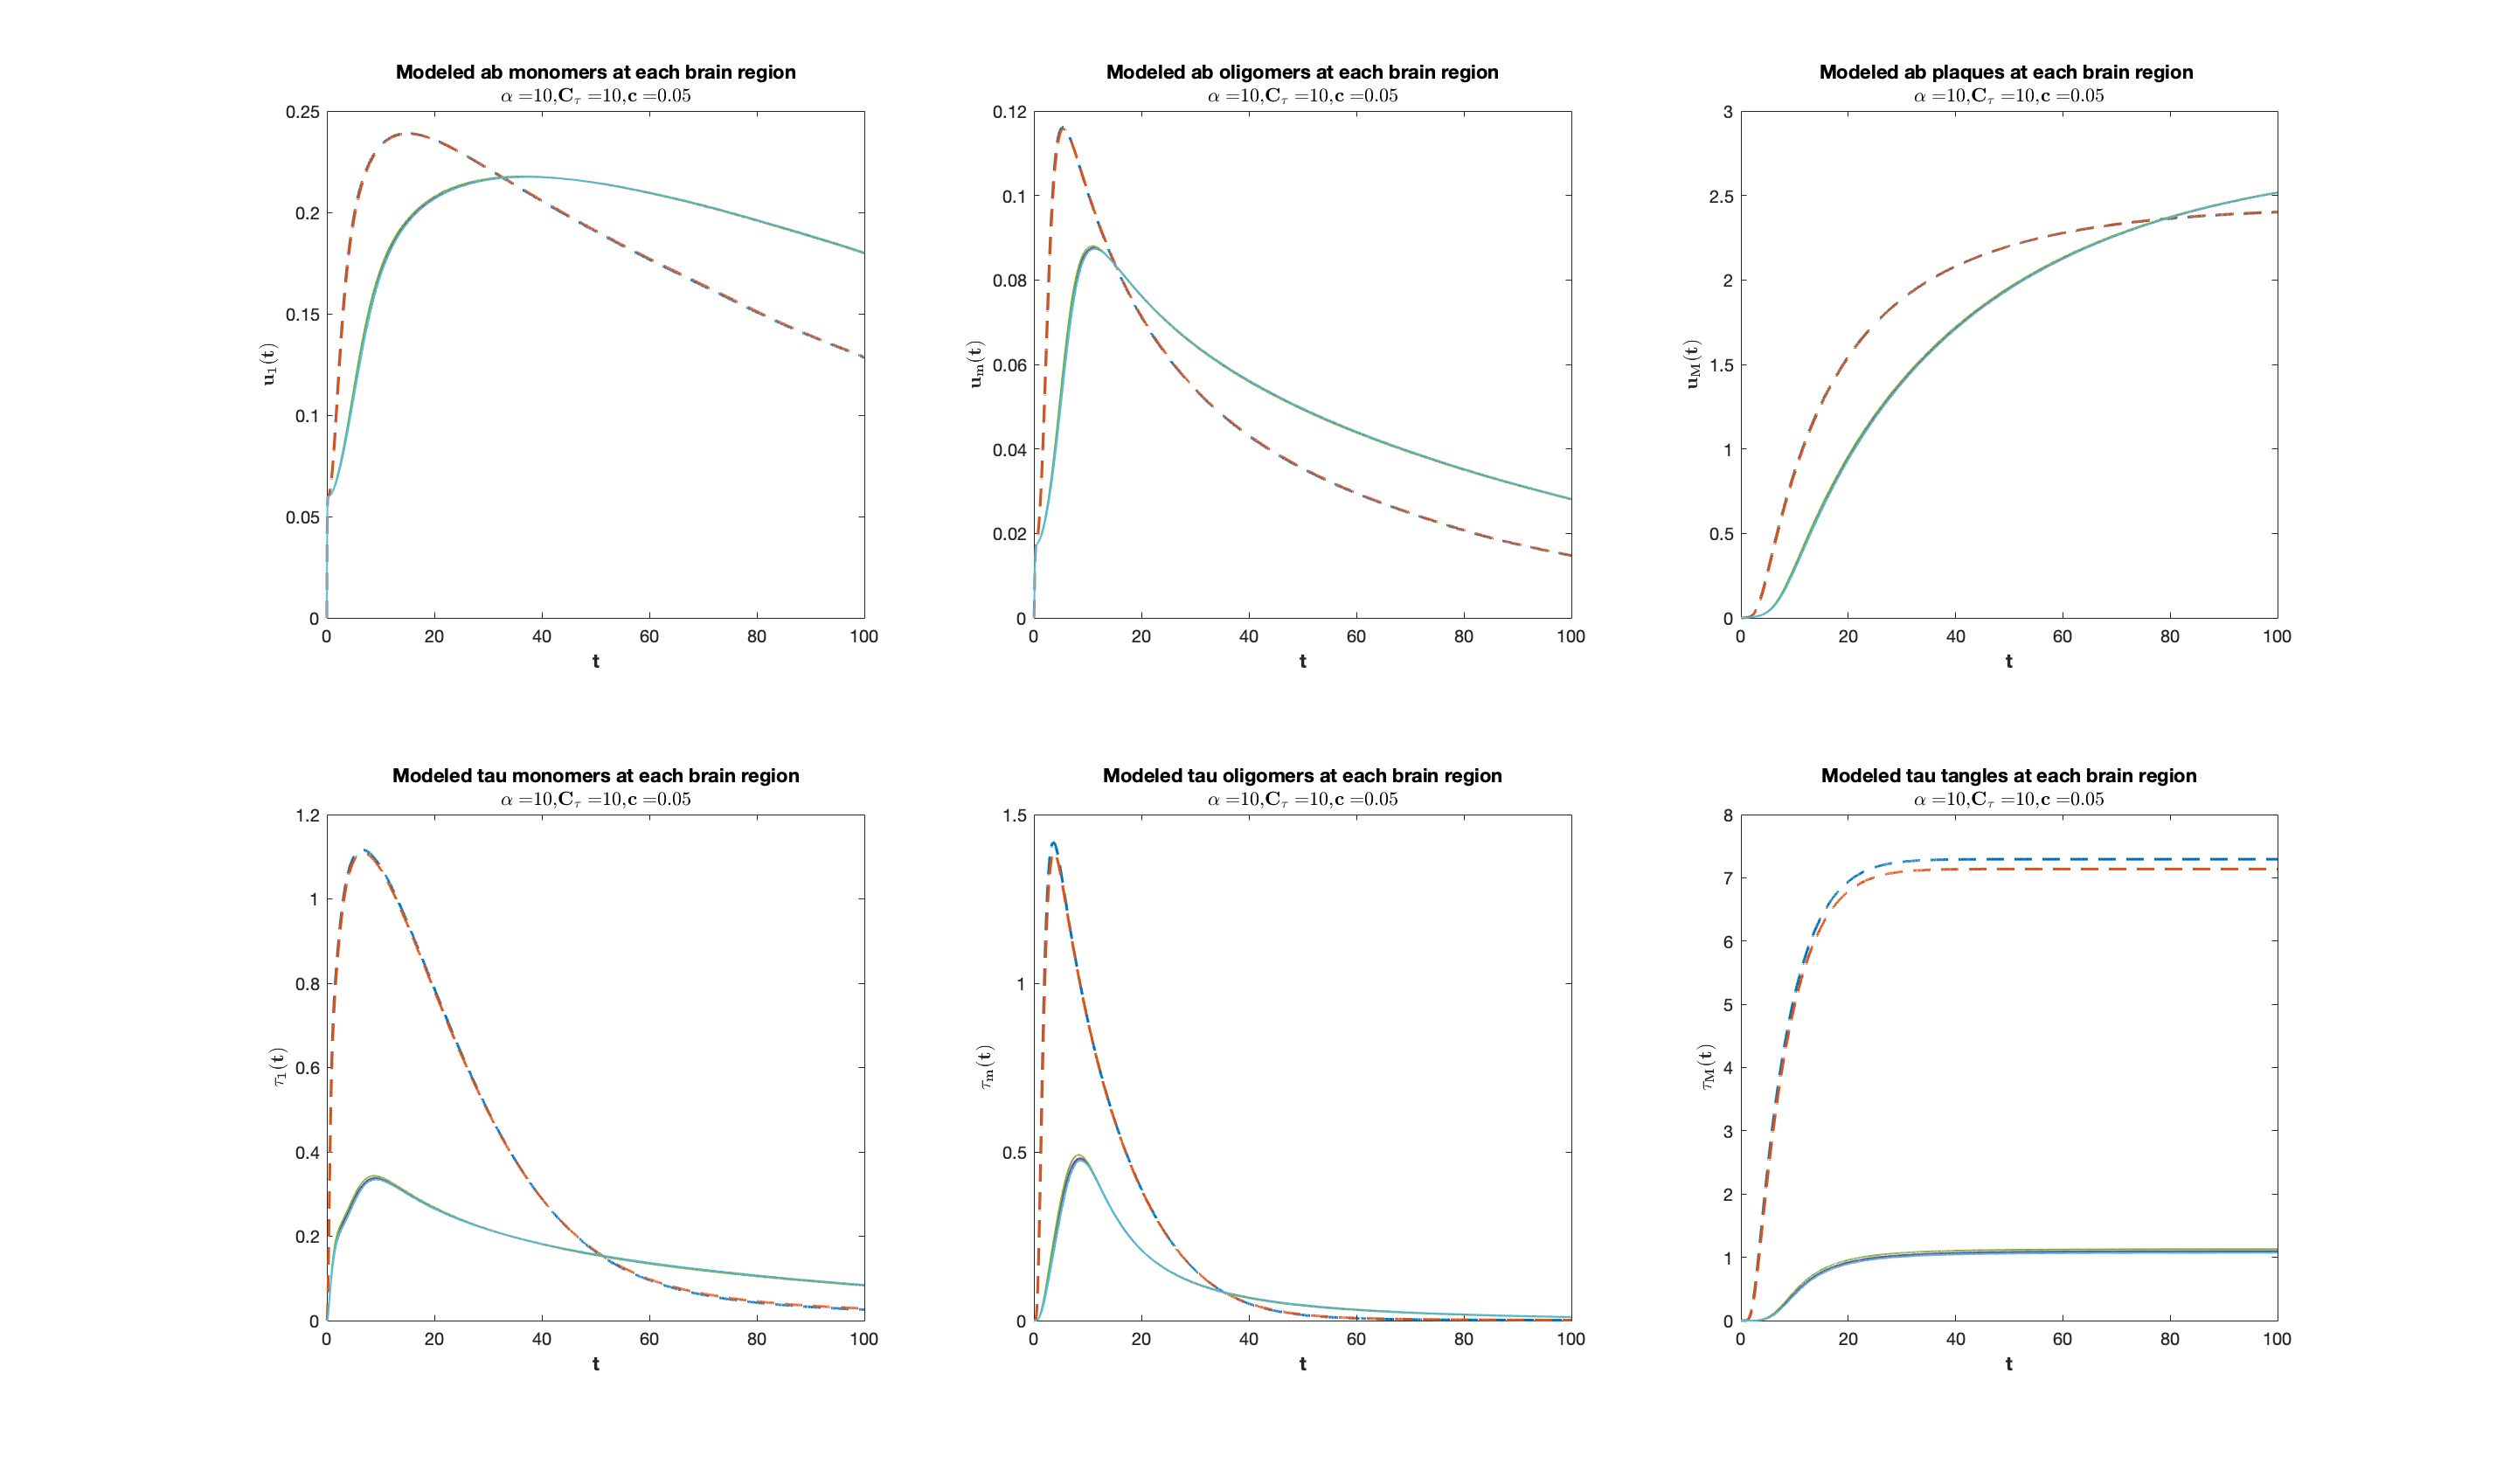
5.2 Local burden of A and in different regions
The aim of this Section is to simulate the progress of the formation of oligomers, plaques and tangles in different regions of the cerebral parenchyma. To this end, we localize the total burden functions of (13) into different regions as follows. Let be a finite partition of , where each subset can be considered as a region of the brain. Thus, for the -th region, setting , we define:
| (16) |
| (17) |
The evolution in time of monomeric, oligomeric and insoluble clusters of A and -proteins in each brain region are shown in Figure 2 for , , and . Each curve corresponds to a distinct region. The dashed lines indicate the regions of the entorhinal cortices (EC), more precisely the right entorhinal cortex and the left entorhinal cortex. Consistently with the plots in figure 1, monomers and oligomers’s regional curves rise, peak and subsequently begin to decline while plaques and tangles’ regional curves increase until they reach a plateau. Longitudinal graphs for different brain’s regions of both A and -proteins overlap, except for the entorhinal cortex. Here, as expected, the concentrations of both soluble A and soluble are bigger than in other brain areas at earlier times. Indeed, in the EC monomeric and A rise from zero faster and consequently oligomers as well as insoluble clusters form earlier than in other brain areas. While the plaques burden in EC is bigger at least at earlier times, the tangle burden in EC is more sizable than in other areas during all the course of the disease. Although regional differences in the distribution of A and distribution as well as in the disease’s evolution are not very evident except than in the seeding zone, small variations in A and burdens are present. Next, the regions near the entorhinal cortex where the burden of A and clusters is more considerable, are (in order): amygdala, hippocampus, temporal pole, isthmus of cingulate cortex, insula cortex and parahippocampal cortex). Consistently, in these regions the evolution of the disease is more severe.
5.3 Global and regional behavior under different medical hypotheses
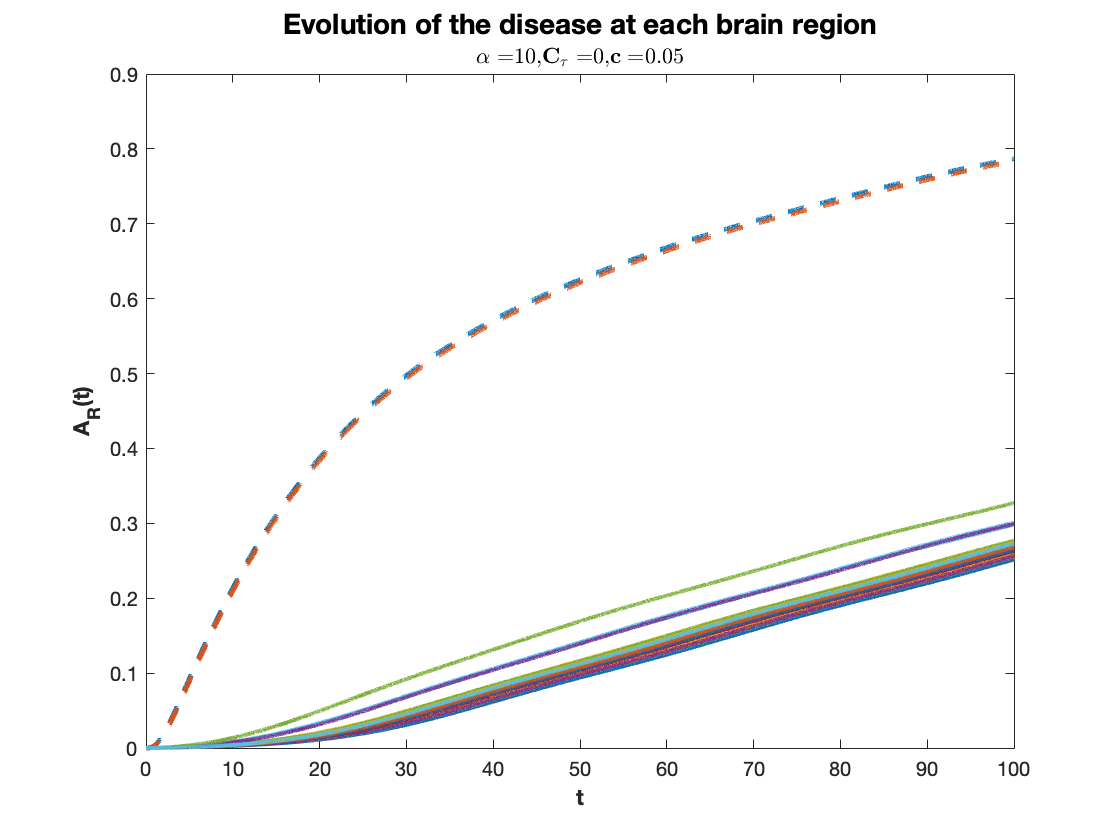
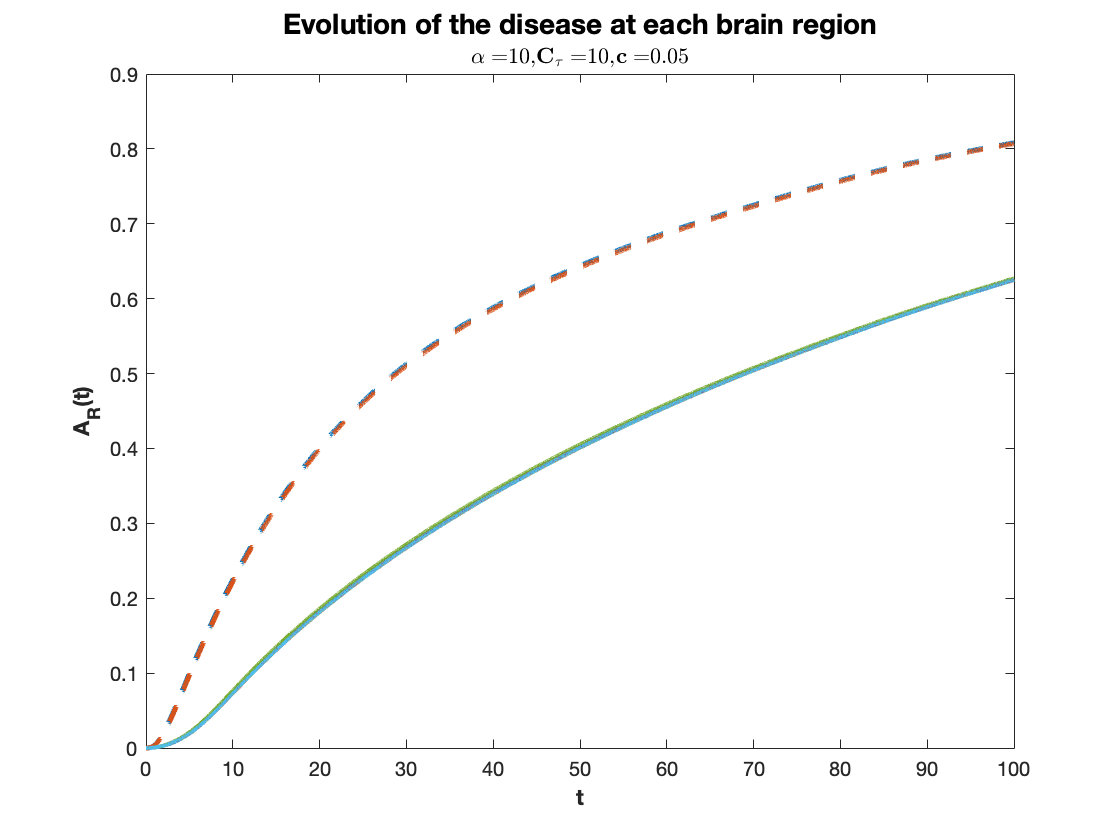
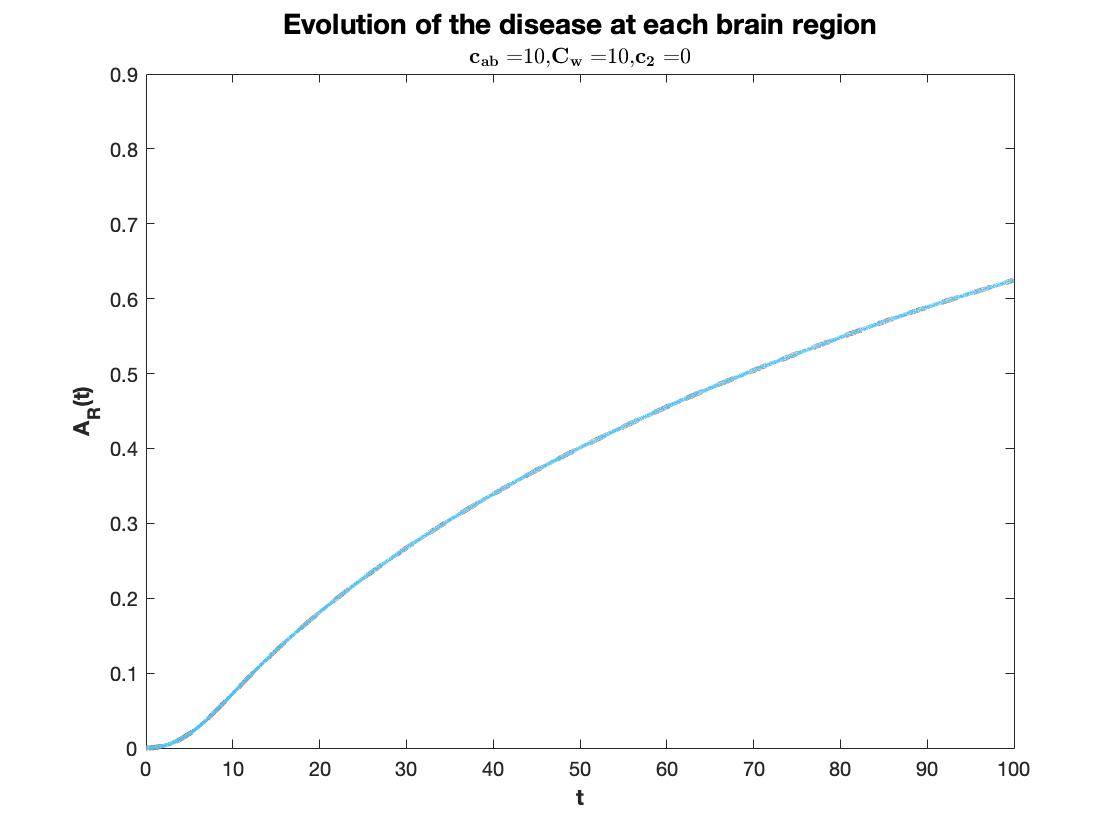
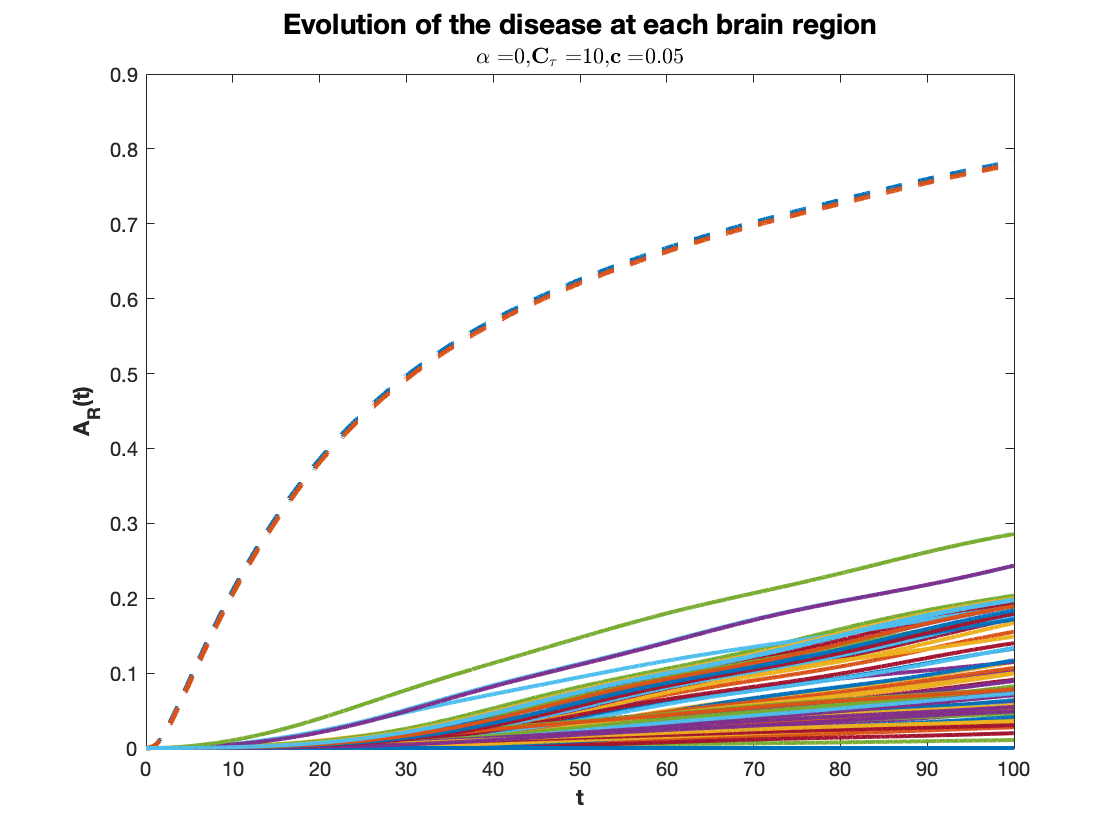
We then test various hypotheses concerning the progression of neurodegenerative processes which are associated to different choices of the constants . We recall that these parameters control respectively the A agglomeration, the production of monomeric driven by A oligomers and the seeding at the entorhinal cortex.
| Case A | 10 | 0 | 0 |
| Case B | 10 | 0 | 0.05 |
| Case C | 10 | 10 | 0.05 |
| Case D | 10 | 10 | 0 |
| Case E | 0 | 10 | 0.05 |
The situations considered are listed in table 2. In case A the sources of -monomers are taken out; hence, -protein is not produced. This situation might represent a simplified amyloid cascade hypothesis. In cases B and D, we remove, one by one, the sources of -monomers, represented respectively by -amyloid oligomers and by seeding at EC, while in case C all these processes are included. Notice that case C has already been considered in Sections 5.1 and 5.2. In case E, we inhibit the agglomeration of A in clusters and consequently, the process of misfolding driven by A oligomers is not triggered independently from the value of the constant . This might represent a possible effect of a drug.
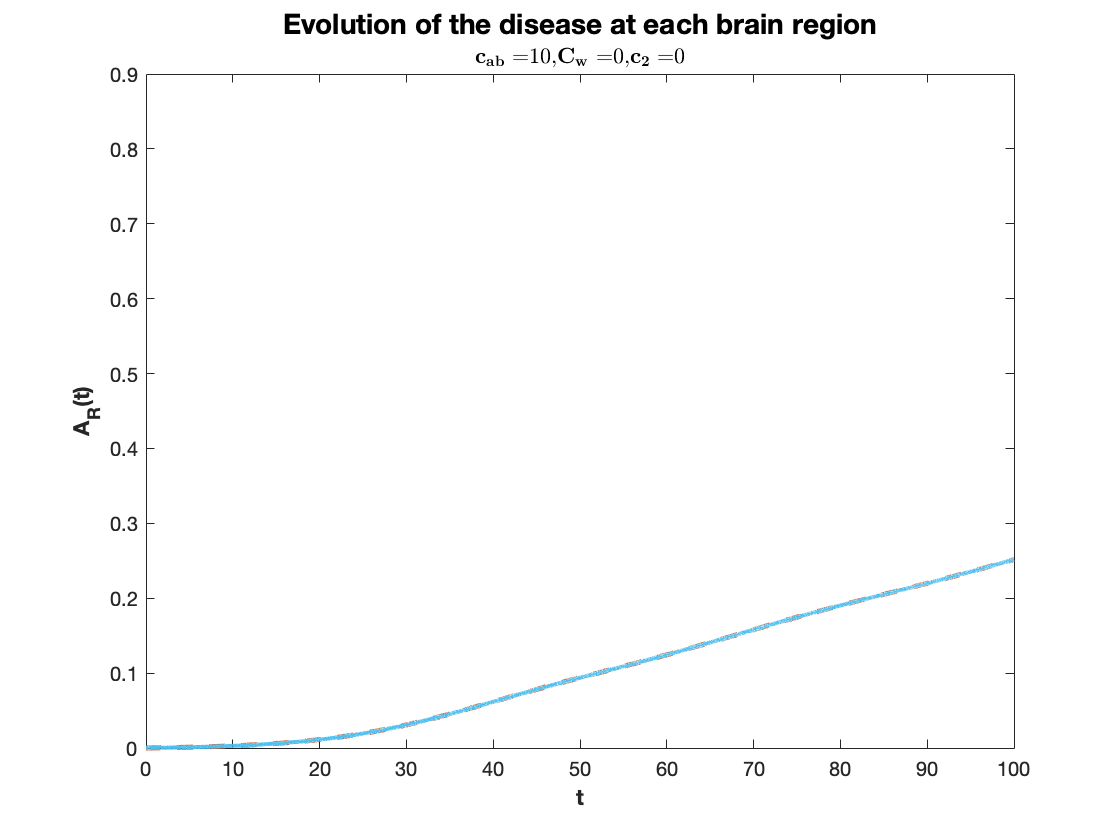
In figure 4, longitudinal graphs of are shown in each of cases summarized in table 2. The curves increase in time in each brain region, consistently with the fact that the cerebral damage grows as long as the AD pathology progresses. Each curve indicate a distinct region. The dashed lines correspond to the regions of the entorhinal cortices (more precisely the right entorhinal cortex and the left entorhinal cortex) where misfolding is seeded. In case A, the neuronal damage is mild and roughly homogeneous in all regions, thus, the disease progression is slow almost everywhere. In case B, the injury is not critical in most of the cerebral areas, but, compared to case A, it is much more serious at the areas of the entorhinal cortex, where monomeric is seeded. Compared to cases A and B, in cases C and D the evolution of the disease is more severe in all cerebral regions, and, in particular, in case C the EC is the most damaged brain area. Case E resembles case B, since the harm is moderate in all regions, except in the EC. In such regions, the AD pathology starts and its progression in time is more severe than in other areas of the brain.
It is interesting to observe that when the production of monomeric driven by oligomeric A is neglected (cases B and E), the neuronal damage is mild and localized to some brain areas. As expected, it is serious in the region of entorhinal cortex. On the other hand, when the oligomeric A directly induces the production of monomeric (case C and D), the evolution of the disease is severe in all the cerebral regions.
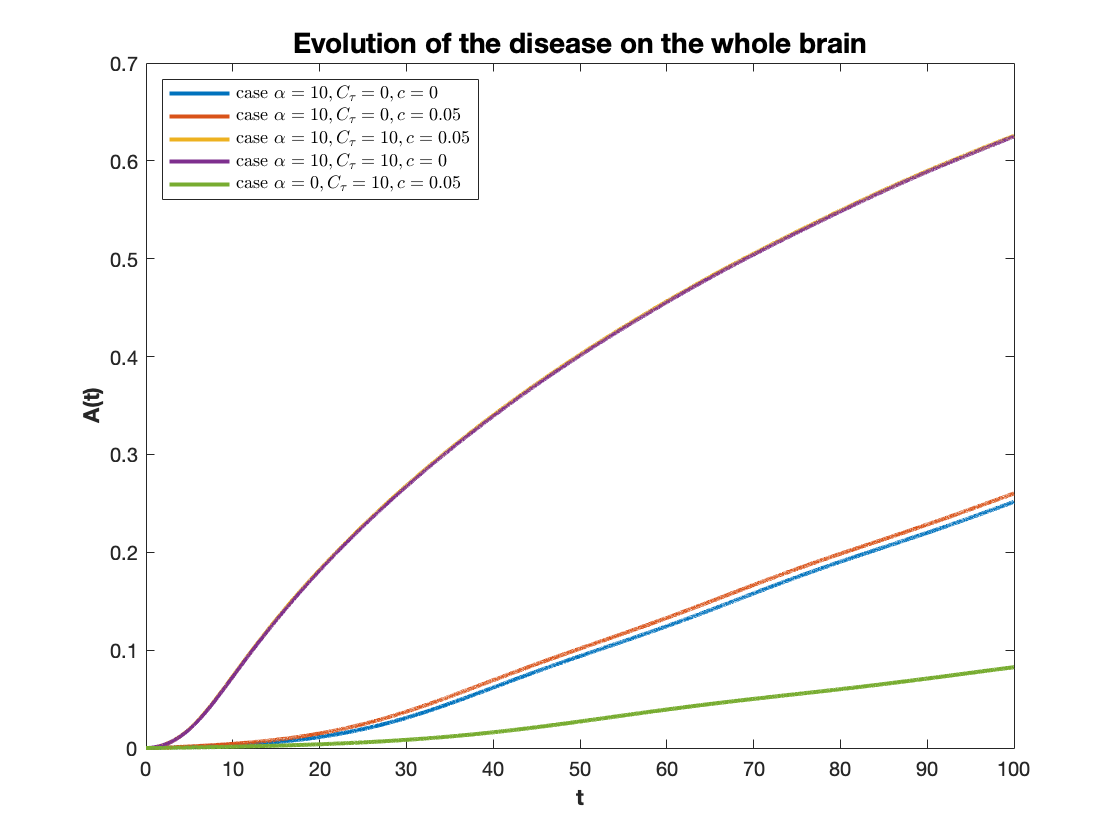
In cases B, C, E the -seeding region (entorhinal cortex) remains the most damaged area, followed by amygdala, hippocampus, temporal pole, isthmuscingulate cortex, insula cortex and parahippocampal cortex although the differences in the evolution of AD between regions are minimal (excluded the seeding zone) in case C and more relevant in cases B and E. In case D, tau seeding at EC is not considered; consistently, the evolution of the disease at EC is not very different from any other cerebral region, suggesting that the effect of this process targets specific brain areas, that are the EC and a few more regions connected with it like amygdala and hippocampus. This fact is more evident in cases B and E, where the tau seeding at EC is the only source for monomeric tau and in addition to EC, the most impaired cerebral zones are those connected to EC, as amygdala and hippocampus, and a few more areas connected with the latter, like, temporal pole, isthmus cingulate cortex, insula cortex and parahippocampal cortex. In figure 3 longitudinal graphs of , describing the evolution of the disease in the whole brain, are shown for each of the cases listed in table 2. Within the cases considered, the neuronal damage is the most severe in case C (yellow curve), followed with minimal differences by case D (purple curve), indicating, consistently, that the effect of the gamma-shaped seeding affects certain cerebral regions rather than the whole cerebral network. In cases A (blue curve) and B (red curve), the overall cerebral damage is milder than in cases C and D. This fact is interesting since it expresses the phenomenon that the injury exerted by the A or by both A and when the first does not directly induce the production of the latter, is much less severe than in the case of misfolded tau injection enhanced by A. Thus, these observations suggest that A and are more harmful when they act together. The simulation in figure 3 may provide support to the fact that the interaction between and A increases the toxicity of both proteins and, combined with the process of seeding, plays a crucial role in brain damaging.
In case E, when monomeric A does not coagulate in longer clusters, the cerebral damage is less serious than in the other cases, confirming once again the central role of A oligomers in neuronal impairment also through their involvement in misfolding. Case E may represent the theoretical action of a drug able to completely inhibit the aggregation of A. Although such action seems to be successful in limiting the overall brain’s damage, it is ineffective in controlling the impairment of specific regions (see figure 4 case E ) where the disease becomes more and more serious as time goes on.
We observe that in case E summarized in table 2 we inhibit the agglomeration of A in clusters and consequently, the process of seeding driven by A oligomers is not triggered independently of the value of the constant .
Case A
Case B
Case C
Case D
Case E
References
- [1] Y. Achdou, B. Franchi, N. Marcello, and M. C. Tesi. A qualitative model for aggregation and diffusion of -amyloid in Alzheimer’s disease. J. Math. Biol., 67(6-7):1369–1392, 2013.
- [2] J. Acosta-Cabronero, G. B. Williams, G. Pengas, and P. J. Nestor. Absolute diffusivities define the landscape of white matter degeneration in Alzheimer’s disease. Brain, 133(2):529–539, 11 2009.
- [3] A. L. Alexander, J. E. Lee, M. Lazar, and A. S. Field. Diffusion tensor imaging of the brain. Neurotherapeutics, 4(3):316–329, 2007.
- [4] W. Y. Aung, S. Mar, and T. Ls Benzinger. Diffusion tensor mri as a biomarker in axonal and myelin damage. Imaging in medicine, 5(5):427–440, October 2013.
- [5] M. Bertsch, B. Franchi, N. Marcello, M. C. Tesi, and A. Tosin. Alzheimer’s disease: a mathematical model for onset and progression. Math. Med. Biol., 34(2):193–214, 2017.
- [6] M. Bertsch, B. Franchi, L. Meacci, M. Primicerio, and M.C. Tesi. The amyloid cascade hypothesis and Alzheimer’s disease: A mathematical model. European Journal of Applied Mathematics, pages 1–20, 2020.
- [7] M. Bertsch, B. Franchi, A. Raj, and M.C. Tesi. Macroscopic modelling of Alzheimer’s Disease: difficulties and challenges. Brain Multiphysics, 2, pages 1-13 2021.
- [8] M. Bertsch, B. Franchi, M. C. Tesi, and A. Tosin. Microscopic and macroscopic models for the onset and progression of Alzheimer’s disease. J. Phys. A: Math. Theor., 50(41):414003/1–22, 2017.
- [9] M. Bertsch, B. Franchi, M. C. Tesi, and A. Tosin. Well-posedness of a mathematical model for Alzheimer’s disease. SIAM J. Math. Anal., 50(3):2362–2388, 2018.
- [10] Bloom GS. Amyloid-beta and tau: the trigger and bullet in Alzheimer disease pathogenesis. JAMA Neurol. 2014 Apr;71(4):505-8. doi: 10.1001/jamaneurol.2013.5847. PMID: 24493463.
- [11] K. Bordji, J. Becerril-Ortega, O. Nicole, and A. Buisson. Activation of extrasynaptic, but not synaptic, nmda receptors modifies amyloid precursor protein expression pattern and increases amyloid- production. Journal of Neuroscience, 30(47):15927–15942, 2010.
- [12] C. Bouter, Philipp Henniges, Timon N. Franke, Caroline Irwin, Carsten Oliver Sahlmann, Marius E. Sichler, Nicola Beindorff, Thomas A. Bayer, and Yvonne Bouter. 18f-fdg-pet detects drastic changes in brain metabolism in the model of Alzheimers disease. Frontiers in Aging Neuroscience, 10:425, 2019.
- [13] Ballard C., Gauthier S, Corbett A, Brayne C, Aarsland D, and Jones E. Alzheimer’s disease. Lancet, 377(9770):1019–1031, 2011.
- [14] M. A. Busche & B. T. Hyman Synergy between amyloid- and tau in Alzheimers disease Nature Neuroscience 23, 1183-1193, 2020.
- [15] C. Y. Chen, Y. H. Tseng, and J. P. Ward. A mathematical model demonstrating the role of interstitial fluid flow on the clearance and accumulation of amyloid in the brain. Math. Biosci., 317:108258, 17, 2019.
- [16] Carlos Cruchaga, John S. K. Kauwe, Kevin Mayo, Noah Spiegel, Sarah Bertelsen, Petra Nowotny, Aarti R. Shah, Richard Abraham, Paul Hollingworth, Denise Harold, Michael M. Owen, Julie Williams, Simon Lovestone, Elaine R. Peskind, Ge Li, James B. Leverenz, Douglas Galasko, The Alzheimer’s Disease Neuroimaging Initiative, John C. Morris, Anne M. Fagan, David M. Holtzman, and Alison M. Goate. Snps associated with cerebrospinal fluid phospho-tau levels influence rate of decline in alzheimer’s disease. PLOS Genetics, 6(9):1–10, 09, 2010.
- [17] B.C. Dickerson, D.A. Wolk, and A.D.N. Initia. Biomarker-based prediction of progression in mci: comparison of ad signature and hippocampal volume with spinal fluid amyloid-beta and tau. Alzheimers Dement, pp. 5–55, 2013.
- [18] H. Braak & E. Braak. Neuropathological Stageing of Alzheimer-Related Changes. Acta Neuropathologica 82 (4): 239–59, 1991.
- [19] R. L. Drake. A general mathematical survey of the coagulation equation. In Topics in Current Aerosol Research (Part 2), International Reviews in Aerosol Physics and Chemistry, pages 203–376. Pergamon Press, Oxford, UK, 1972.
- [20] Dujardin S, Hyman BT. Tau Prion-Like Propagation: State of the Art and Current Challenges, in Tau Biology, Advances in Experimental Medicine and Biology, 1184:305–325, 2019.
- [21] B. Franchi, M. Heida, and S. Lorenzani. A mathematical model for Alzheimer’s disease: an approach via stochastic homogenization of the Smoluchowski equation. Commun. Math. Sci., 18(4):1105–1134, 2020.
- [22] B. Franchi and S. Lorenzani. From a microscopic to a macroscopic model for Alzheimer disease: two-scale homogenization of the Smoluchowski equation in perforated domains. J. Nonlinear Sci., 26(3):717–753, 2016.
- [23] B. Franchi and S. Lorenzani. Smoluchowski equation with variable coefficients in perforated domains: homogenization and applications to mathematical models in medicine. In Harmonic analysis, partial differential equations and applications, Appl. Numer. Harmon. Anal., pages 49–67. Birkhäuser/Springer, Cham, 2017.
- [24] C. Gabelli. Blood and cerebrospinal fluid biomarkers for Alzheimer’s disease. Journal of Laboratory and Precision Medicine, 5(0), 2020.
- [25] G.G. Glenner and C.W. Wong. Alzheimers disease: initial report of the purification and characterization of a novel cerebrovascular amyloid protein. Biochem Biophys Res Commun, 120(3):885–890, 1984.
- [26] G. Gallardo and D. M. Holtzman Amyloid- and Tau at the Crossroads of Alzheimer’s Disease Tau Biology, Advances in Experimental Medicine and Biology, 1184:187–203, 2019.
- [27] M. Goedert, M.G. Spillantini. Propagation of Tau aggregates. Molecular Brain, 10:18, 2017.
- [28] M. Goedert, M.G. Spillantini. Ordered Assembly of Tau Protein and Neurodegeneration in Tau Biology, Advances in Experimental Medicine and Biology, 1184:3–22, 2019.
- [29] J. Götz, F. Chen, J. van Dorpe, and R.M. Nitsch. Formation of neurofibrillary tangles in p301l tau transgenic mice induced by a fibrils. Science, 293(5534):1491–1495, 2001.
- [30] J.L. Guo and V.M. Lee. Seeding of normal tau by pathological tau conformers drives pathogenesis of Alzheimer-like tangles. The Journal of Biological Chemistry, 286(17):15317–15331, 2011.
- [31] Lin Wai Hung, Giuseppe D Ciccotosto, Eleni Giannakis, Deborah J Tew, Keyla Perez, Colin L Masters, Roberto Cappai, John D Wade, and Kevin J Barnham. Amyloid-beta peptide (abeta) neurotoxicity is modulated by the rate of peptide aggregation: Abeta dimers and trimers correlate with neurotoxicity. The Journal of neuroscience : the official journal of the Society for Neuroscience, 28(46):11950–11958, November 2008.
- [32] Grundke Iqbal I, Iqbal K, Tung YC, Quinlan M, Wisniewski HM, and Binder LI. Abnormal phosphorylation of the microtubule-associated protein tau in alzheimer cytoskeletal pathology. Biochem Biophys Res Commun, 83(13):4913–4917, 1986.
- [33] Hardy JA, Higgins GA. Alzheimer’s disease: the amyloid cascade hypothesis. Science. 1992 Apr 10;256(5054):184-5. doi: 10.1126/science.1566067. PMID: 1566067.
- [34] J. J. Iliff, M. Wang, Y. Liao, B. A. Plogg, W. Peng, G. A. Gundersen, H. Benveniste, G. E. Vates, R. Deane, S. A. Goldman, E. A. Nagelhus, and M. Nedergaard. A paravascular pathway facilitates CSF flow through the brain parenchyma and the clearance of interstitial solutes, including amyloid . Sci. Transl. Med., 4(147):147ra111, 2012.
- [35] C. Haass and D. J. Selkoe. Soluble protein oligomers in neurodegeneration: lessons from the Alzheimer’s amyloid beta-peptide. Nat. Rev. Mol. Cell. Biol., 8(2):101–112, 2007.
- [36] K. Iqbal, F. Liu, C. Gong, and I. Grundke-Iqbal. Tau in alzheimer disease and related taupathies. Curr. Alzheiemr Research, 7(8):656–664, 2010.
- [37] Lars M Ittner and JÃŒrgen Götz. Amyloid- and tau–a toxic pas de deux in Alzheimer’s disease. Nature reviews. Neuroscience, 12(2):65–72, February 2011.
- [38] Clifford R Jr Jack, David A Bennett, Kaj Blennow, Maria C Carrillo, Billy Dunn, Samantha Budd Haeberlein, David M Holtzman, William Jagust, Frank Jessen, Jason Karlawish, Enchi Liu, Jose Luis Molinuevo, Thomas Montine, Creighton Phelps, Katherine P Rankin, Christopher C Rowe, Philip Scheltens, Eric Siemers, Heather M Snyder, and Reisa Sperling. Nia-aa research framework: Toward a biological definition of alzheimer’s disease. Alzheimers Dement, 14(4):535–562, Apr 2018.
- [39] C. R. Jack Jr., D. S. Knopman, W. J. Jagust, L. M. Shaw, P. S. Aisen, M. W. Weiner, R. C. Petersen, and J. Q. Trojanowski. Tracking pathophysiological processes in Alzheimer’s disease: an updated hypothetical model of dynamic biomarkers. Lancet Neurol., 12(2):207–216, 2013.
- [40] Eleanna Kara, Jordan D. Marks, and Adriano Aguzzi. Toxic protein spread in neurodegeneration: Reality versus fantasy. Trends in Molecular Medicine, 24(12):1007 – 1020, 2018.
- [41] Sunil Koundal, Rena Elkin, Saad Nadeem, Yuechuan Xue, Stefan Constantinou, Simon Sanggaard, Xiaodan Liu, Brittany Monte, Feng Xu, William Van Nostrand, Maiken Nedergaard, Hedok Lee, Joanna Wardlaw, Helene Benveniste, and Allen Tannenbaum. Optimal mass transport with lagrangian workflow reveals advective and diffusion driven solute transport in the glymphatic system. Scientific Reports, 10(1):1990, 2020.
- [42] Jada Lewis, Dennis W. Dickson, Wen-Lang Lin, Louise Chisholm, Anthony Corral, Graham Jones, Shu-Hui Yen, Naruhiko Sahara, Lisa Skipper, Debra Yager, Chris Eckman, John Hardy, Mike Hutton, and Eileen McGowan. Enhanced neurofibrillary degeneration in transgenic mice expressing mutant tau and app. Science, 293(5534):1487–1491, 2001.
- [43] Jinping Liu, Lirong Chang, Yizhi Song, Hui Li, and Yan Wu. The role of nmda receptors in Aheimers disease. Frontiers in Neuroscience, 13:43, 2019.
- [44] Vargas-Caballero M., Denk F., Wobst H.J., Arch E., Pegasiou C.M., Oliver P.L., Shipton O.A., Paulsen O., and R. Wade-Martins. Wild-type, but not mutant n296h, human tau restores a-mediated inhibitio of ltp in tau in mice. Front. Neurosci., 11(201), 2017.
- [45] Charles Marcus, Esther Mena, and Rathan M. Subramaniam. Brain pet in the diagnosis of alzheimer’s disease. Clinical Nuclear Medicine, 39(10), 2014.
- [46] M. Menéndez-González, P. Pérez-Pinera, M. Martínez-Rivera, M. T. Calatayud, and B. Blázquez Menes. App processing and the app-kpi domain involvement in the amyloid cascade. Neurodegenerative Diseases, 2(6):277–283, 2005.
- [47] M Meyer-Luehmann, TL Spires-Jones, C Prada, M Garcia-Alloza, A De Calignon, A. Rozkalne, J. Koenigsknecht-Talboo, D. M. Holtzman, B. J. Bacskai, and B. T. Hyman. Rapid appearance and local toxicity of amyloid- plaques in a mouse model of Alzheimer’s disease. Nature, 451(7179):720–724, 2008.
- [48] J. C. Miller. Neuroimaging for dementia and Alzheimer’s disease. Radiology Rounds, 4(4):1–4, 2006.
- [49] L. Mosconi, V. Berti, L. Glodzik, A. Pupi, S. De Santi, and MJ. de Leon. Pre-clinical detection of Alzheimer’s disease using FDG-PET, with or without amyloid imaging. J. Alzheimer’s Dis., 20(3):843–854, 2010.
- [50] R. M. Murphy and M. M. Pallitto. Probing the kinetics of -amyloid self-association. Biophysical Journal, 130(2-3):109–122, 2000.
- [51] Tharick A. Pascoal, Sulantha Mathotaarachchi, Monica Shin, Andrea L. Benedet, Sara Mohades, Seqian Wang, Tom Beaudry, Min Su Kang, Jean-Paul Soucy, Aurelie Labbe, Serge Gauthier, and Pedro Rosa-Neto. Synergistic interaction between amyloid and tau predicts the progression to dementia. Alzheimer’s & Dementia, 13(6):644 – 653, 2017.
- [52] Amy M. Pooler, Manuela Polydoro, Eduardo A. Maury, Samantha B. Nicholls, Snigdha M. Reddy, Susanne Wegmann, Christopher William, Lubna Saqran, Ozge Cagsal-Getkin, Rose Pitstick, David R. Beier, George A. Carlson, Tara L. Spires-Jones, and Bradley T. Hyman. Amyloid accelerates tau propagation and toxicity in a model of early alzheimer’s disease. Acta Neuropathologica Communications, 3(1):14, 2015.
- [53] Balázs Szalkai, Csaba Kerepesi, Bálint Varga, Vince Grolmusz, The Budapest Reference Connectome Server v2.0. Neuroscience Letters, 595, 60–62, 2015.
- [54] Balázs Szalkai, Csaba Kerepesi, Bálint Varga, Vince Grolmusz. Parameterizable Consensus Connectomes from the Human Connectome Project: The Budapest Reference Connectome Server v3.0. Cognitive Neurodynamics, 11, 113–116, 2017.
- [55] Stephen William Scheff, Douglas A. Price, Frederick A. Schmitt, Steven DeKosky, and Elliott J. Mufson. Synaptic alterations in ca1 in mild alzheimer disease and mild cognitive impairment. Neurology, 68:1501–1508, 2007.
- [56] Dennis J Selkoe and John Hardy. The amyloid hypothesis of Alzheimer’s disease at 25 years. EMBO Molecular Medicine, 8(6):595–608, 2016.
- [57] U. Sengupta, A.N. Nilson, and R. Kayed. The role of amyloid oligomers in toxicity, propagation and immunotherapy. EBioMedicine, 6:42–49, 2016.
- [58] J.-M. Serot, J. Zmudka, and P. Jouanny. A possible role for CSF turnover and choroid plexus in the pathogenesis of late onset Alzheimer’s disease. J. Alzheimer’s Dis., 30(1):17–26, 2012.
- [59] M. Smoluchowski. Versuch einer mathematischen Theorie der Koagulationskinetik kolloider Lösungen. IZ. Phys. Chem., 92:129-168, 1917.
- [60] I.C. Stancu, B. Vasconcelos, D. Terwel, and I. Dewachter. Models of beta-amyloid induced tau-pathology: the long and road to understand the mechanism. Mol Neurodegener., 9(51):1–14, 2014.
- [61] Craig J Thalhauser and Natalia L Komarova. Alzheimer’s disease: rapid and slow progression. J R Soc Interface, 9(66):119–126, Jan 2012.
- [62] Lulu Xie, Hongyi Kang, Qiwu Xu, Michael J. Chen, Yonghong Liao, Meenakshisundaram Thiyagarajan, John O’Donnell, Daniel J. Christensen, Charles Nicholson, Jeffrey J. Iliff, Takahiro Takano, Rashid Deane, and Maiken Nedergaard. Sleep drives metabolite clearance from the adult brain. Science, 342(6156):373–377, 2013.
- [63] M. Bertsch, B. Franchi, V. Meschini, M. C. Tesi & A. Tosin A sensitivity analysis of a mathematical model for the synergistic interplay of amyloid beta and tau on the dynamics of Alzheimers disease. Brain Multiphysics, 2:100020, 2021.
- [64] Z. Ahmed, J. Cooper, T.K. Murray et al. A novel in vivo model of tau propagation with rapid and progressive neurofibrillary tangle pathology: the pattern of spread is determined by connectivity, not proximity. Acta Neuropathol 127, 667–683, 2014
- [65] H. Asai, S. Ikezu, S. Tsunoda, M. Medalla, J. Luebke, T. Haydar, B. Wolozin, O. Butovsky, S. Kügler and T. Ikezu Depletion of microglia and inhibition of exosome synthesis halt tau propagation. Nat Neurosci. 18(11), 1584–1593, 2015
- [66] F. Carbonell, Y. Iturria, & A. Evans Mathematical Modeling of Protein Misfolding Mechanisms in Neurological Diseases: A Historical Overview. Frontiers in Neurology, 9, 2018.
- [67] S. Fornari, A. Schäfer, M. Juncker, A. Goriely & E. Kuhl Prion-like spreading of Alzheimers disease within the brain’s connectome. J. R. Soc. Interface, 16, 20190356, 2019
- [68] S. Fornari, A. Schäfer, A. Goriely & E. Kuhl Spatially-extended nucleation-aggregation-fragmentation models for the dynamics of prion-like neurodegenerative protein-spreading in the brain and its connectome Journal of Theoretical Biology, 486, 110102, 2020
- [69] A. Raj, A. Kuceyeski and M. Weiner A Network Diffusion Model of Disease Progression in Dementia Neuron, 73, 1204–1215, 2012
- [70] A. Raj, V. Tora, H. Cho, J. Yong Choi, Y. Hoon Ryu, C Hyoung Lyoo, B. Franchi, Combined Model of Aggregation And Network Diffusion Recapitulates Alzheimer’s Regional Tau-PET. Brain Connect. 2021 Oct;11(8):624-638. doi: 10.1089/brain.2020.0841. Epub 2021 Jul 16. PMID: 33947253.
- [71] Giuffrida ML, Caraci F, Pignataro B, Cataldo S, De Bona P, Bruno V, Molinaro G, Pappalardo G, Messina A, Palmigiano A, Garozzo D, Nicoletti F, Rizzarelli E, Copani A. Beta-amyloid monomers are neuroprotective. J Neurosci. 2009 Aug 26;29(34):10582-7. doi: 10.1523/JNEUROSCI.1736-09.2009. PMID: 19710311; PMCID: PMC6665714.
- [72] P.G. Kevrekidis,T.B. Thompson & A. Goriely, Anisotropic diffusion and traveling waves of toxic proteins in neurodegenerative diseases. Phys. Lett. A, 384 (36), 126935, 2020
- [73] A. Goriely, E. Kuhl & C. Bick, Neuronal Oscillations on Evolving Networks: Dynamics, Damage, Degradation, Decline, Dementia, and Death. Phys. Rev. Lett., 125 (12), 128102, 2020.
- [74] J. Weickenmeier, M. Jucker, A. Goriely & E. Kuhl A physics-based model explains the prion-like features of neurodegeneration in Alzheimer’s disease, Parkinson’s disease, and amyotrophic lateral sclerosis Journal of the Mechanics and Physics of Solids, 124, p. 264-281, 2019.
- [75] T.B. Thompson, P. Chaggar, E. Kuhl & A. Goriely Protein-protein interactions in neurodegenerative diseases: A conspiracy theory. PLoS Comput. Biol., 16(10): e1008267, 2020.
- [76] T. B. Thompson, G. Meisl, T. P. J. Knowles & A. Goriely, The role of clearance mechanisms in the kinetics of pathological protein aggregation involved in neurodegenerative diseases The Journal of Chemical Physics, 154, 125101, 2021.
- [77] Raj, Ashish, Eve LoCastro, Amy Kuceyeski, Duygu Tosun, Norman Relkin, and Michael Weiner. Network Diffusion Model of Progression Predicts Longitudinal Patterns of Atrophy and Metabolism in Alzheimer’s Disease. Cell Reports, 10, 359–369, 2015.
- [78] Ricciarelli R, Fedele E. The Amyloid Cascade Hypothesis in Alzheimer’s Disease: It’s Time to Change Our Mind. Curr Neuropharmacol. 2017;15(6):926-935. doi: 10.2174/1570159X15666170116143743. PMID: 28093977; PMCID: PMC5652035.
- [79] Shankar GM, Li S, Mehta TH, Garcia-Munoz A, Shepardson NE, Smith I, Brett FM, Farrell MA, Rowan MJ, Lemere CA, Regan CM, Walsh DM, Sabatini BL, Selkoe DJ. Amyloid-beta protein dimers isolated directly from Alzheimer’s brains impair synaptic plasticity and memory. Nat Med. 2008;14:837–842.
- [80] Zou, K., Gong, J. S., and Yanagisawa, K.and Michikawa, M. A novel function of monomeric amyloid-protein serving as an antioxidant molecule against metal-induced oxidative damage. J. Neurosci. 22 (2002), 4833–4841.