PMODE - Prototypical Mask based Object Dimension Estimation
Abstract
Can a neural network estimate an object’s dimension in the wild? In this paper, we propose a method and deep learning architecture to estimate the dimensions of a quadrilateral object of interest in videos using a monocular camera. The proposed technique does not use camera calibration or handcrafted geometric features; however, features are learned with the help of coefficients of a segmentation neural network during the training process. A real-time instance segmentation-based Deep Neural Network with a ResNet50 backbone is employed, giving the object’s prototype mask and thus provides a region of interest to regress its dimensions. The instance segmentation network is trained to look at only the nearest object of interest. The regression is performed using an MLP head which looks only at the mask coefficients of the bounding box detector head and the prototype segmentation mask. We trained the system with three different random cameras achieving 22% MAPE for the test dataset for the dimension estimation.
Keywords : Street View, Scene Understanding, Signboard, Autonomous Driving, Digital Mapping, Smart cities
1 Introduction
Measuring the dimension of common objects of interest like buildings, footpaths, parking spaces, and shop signages is essential for municipalities worldwide for asset tracking and maintenance. Traditionally, humans used to obtain the dimensions of objects by measurements using tapes and necessary tools. But in the long run, using human labor to estimate these objects’ dimensions is very difficult. Very tall objects require ladders or similar helpful instruments to reach the object. These procedures are risky, and they cause damage to the workers involved. Today, there are laser-equipped devices in the market for objects that are out of reach from the human hand. However, this is a very tedious and time-consuming procedure. Usually, it needs multiple persons take the measurements. The expected error in this process is very high due to the data collection process, supervision, and review, as well as the error of the instruments used.
Computer Vision using Convolutional Neural Networks[1] and deep learning can perform classification, detection, and segmentation of objects with high accuracy using state-of-the-art techniques. Deep learning has advanced to the level of self-driving cars fueled by data collected from the roads and eventually operated by many Neural Networks running in parallel and sequentially. Self-driving vehicles use the fusion of multiple sensor inputs from cameras, radars, and LiDARs. Long-range LiDARs and short-range LiDARs have become imperative to get the distance and depth of objects accurately. To navigate an environment, self-driving cars do not necessarily need to know the dimensions of objects they come across. They only need to detect the boundaries and navigate without collision. However, to make decisions about overtaking, gauging the distance to a target, generating occupancy grids, etc., they need to estimate the dimensions of particular objects. Such critical decision-making solutions should be real-time and quick so that the systems benefit the most from them.
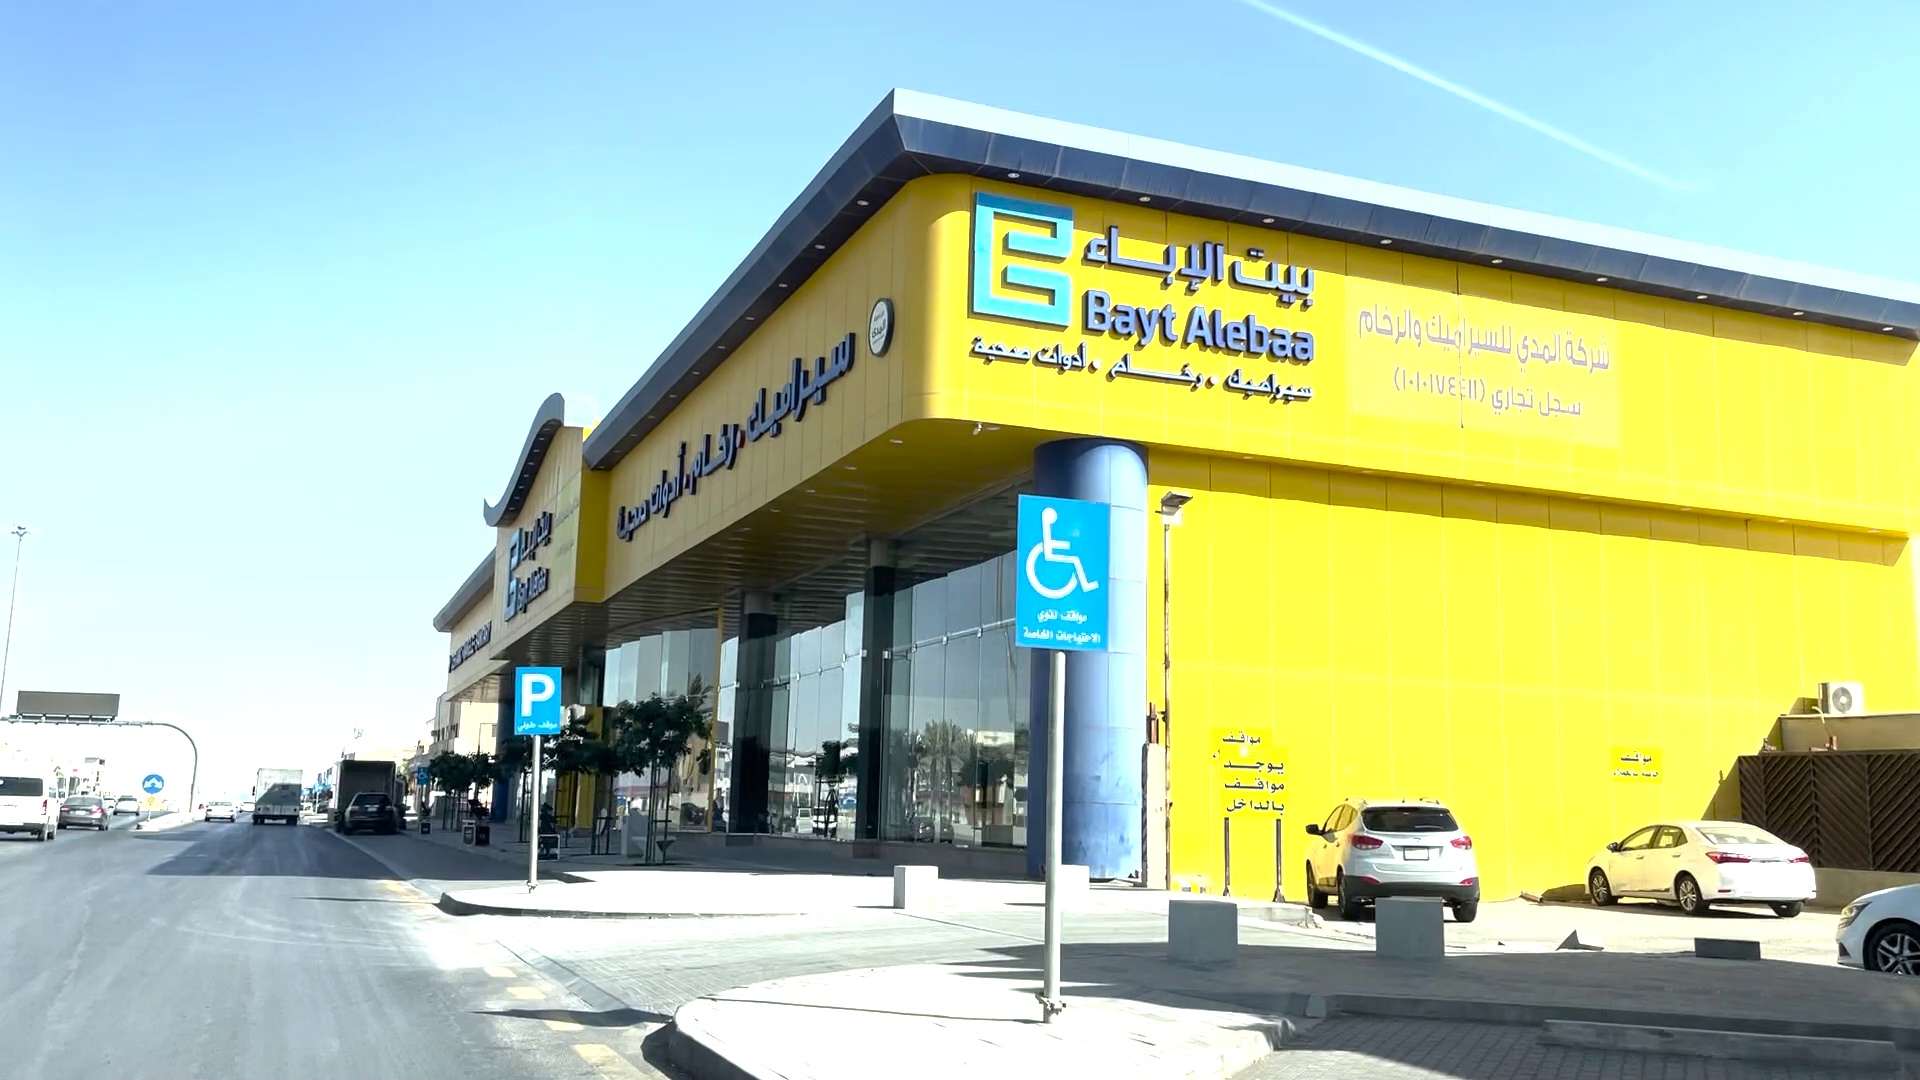
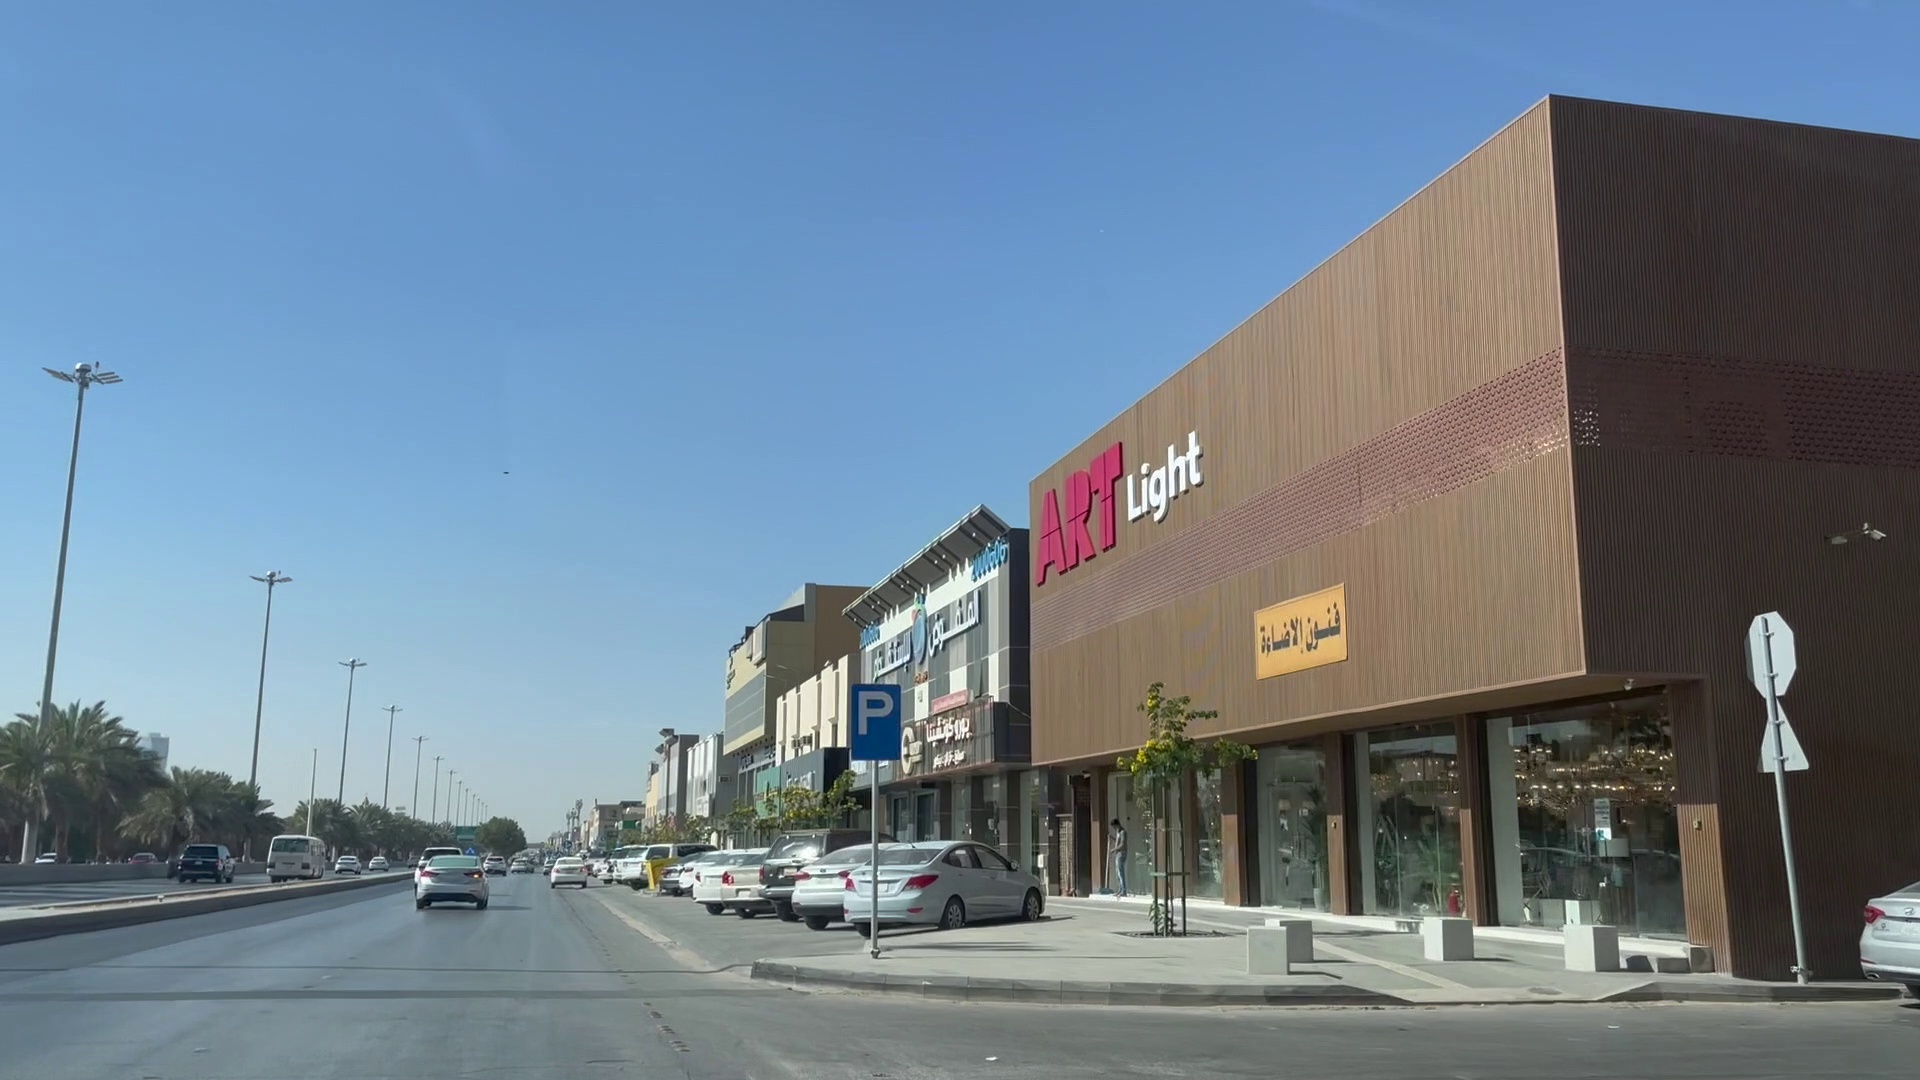
Shop signages are common objects which can be found publicly on the roadsides. Measuring the dimensions of objects such as shop signage could provide value in planning for smart city objectives related to real estate and compliance. In this work, we propose a Deep Neural Network architecture to estimate the dimensions of shop signages in videos. In the process, we also created a novel video dataset containing shop signages and their corresponding dimensions. The videos were collected from cities in two countries using cameras with varied settings from inside a moving car. During the model evaluation, the estimations are done using the video stream of a camera placed inside the moving car.
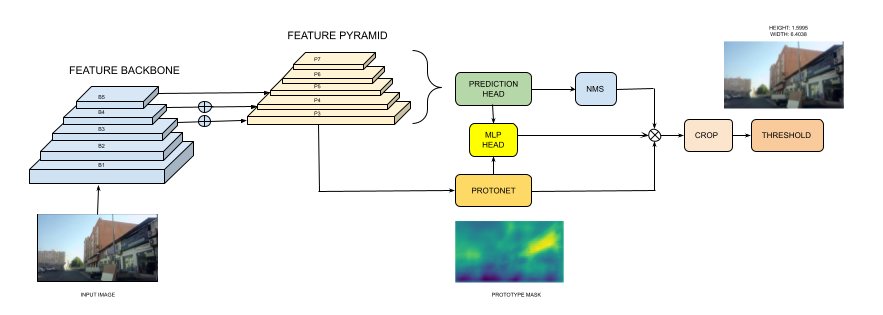
Following the architecture of YOLACT[2], which is highly suitable for real-time Instance segmentation performance on videos, our deep neural network has a Resnet-50-based backbone[3]. The backbone is connected to a feature pyramid. Our network then uses a prototype mask and the bounding box detector-based mask coefficients to predict the dimensions of the shop signage with the help of a Multi-Layer Perceptron. We achieve 22% MAPE on the test dataset for the regression of dimensions. We also shed some light on the novel dataset we collected through our industrial process and provided the statistics.
The main contribution of our work is the dimension estimation component in the Neural Network architecture using the MLP that takes the mask coefficients from the detector head and, at the same time, applies them to the prototype mask generated from the protonet. The novelty of this work is that the network is trained to learn to look at the segmented pixels and predict the dimension of the shop signage object. The shop signage dimension is evaluated using a moving car setting with a camera fitted in the dash. The camera is directed towards the right side of the road, which is mainly populated with shops having signages on top of them.
During the evaluation, we also check the semantic consistency of the object dimension estimation. We define semantic consistency by the robustness of the model, wherein it can estimate the dimension of the same board with marginal deviation. It is done by making inference on multiple image frames of the same shop signage from the video and performing inference for nearby shop signages that can be measured in the subsequent frames.
In the remaining part of this paper, we present the related work for dimension estimation, shop signage dataset, and instance segmentation. We present the dataset details in the following section. We explain the details of our method by stating the approach, the overall architecture of the neural network, and the loss function details. We further elaborate on our experiments using various standard augmentations and custom augmentations, followed by a monocular depth estimation experiment. Finally, we submit our results on real-world test data and mention the future contribution to this work by incorporating a feedback system to improve the model performance using supplementary labeled data.
2 Related Work
2.1 Shop Signage
ShopSign [4] is a related dataset containing diverse Chinese shop sign images and their text; however, it doesn’t have the dimension information. The dataset helps in solving Chinese scene text recognition. Signboard Text [5] is a recent and related work focusing on Latin and Vietnamese text recognition. Zhang et al. [6] is another work where they perform street view text spotting using segmentation to support autonomous driving.
2.2 Instance Segmentation
Mask-RCNN[7] has been the predominantly used neural network architecture, for instance segmentation tasks in videos and images. As mentioned in [8], it is a two-stage approach like other existing methods such as [9, 10, 11, 12]. Mask-RCNN uses RoIAlign feature pooling and RPN(Region Proposal Network) to derive features for each region proposal. These features are then used for bounding box detection and segmentation mask prediction. Latest techniques such as Mask Scoring R-CNN[11] or Path Aggregation Network(PAN)[9] needed re-pooling of the features and more computations. They become less relevant in real-time applications, which need 30fps or even more.
YOLACT[2], on the other hand, is a real-time instance segmentation neural network that has proven strong segmentation results. The additional computational overhead after the on-stage backbone detector like ResNet-50 or ResNet-101 is minor for YOLACT. And especially during the evaluation time, it takes only approximately 5ms for the mask branch.SipMask[8] is a more recent instance segmentation neural network; however, the latency is more compared to YOLACT. A significant advantage of YOLACT is its generic nature, where the prototypes and mask coefficients can be applied to object detector networks. It should be noted that YOLACT has a Fast NMS (Non-Max Suppression) approach, which is 12ms faster than the traditional NMS. YOLACT also utilizes pixel-wise binary cross entropy loss during training which helps in the dimension estimation.
2.3 Dimension Estimation
In recent years, a lot of work has been done using Deep Learning for regression problems[13] using computer vision. However, most of it has been on tasks such as pose estimation, facial landmark detection, and age estimation. Angela Tam et al. [14] is one of the earliest works done in quadrilateral signboard detection and text extraction. They use Hough transforms[15] and other image processing techniques to detect the standard quadrilateral signboards. Similarly, [15] makes use of OpenCV canny edge detection[16], dilation, and erosion algorithms. [17] makes use of a 3D camera for the depth, and apart from that, they have preprocessing, object detection, key points extraction, and depth interpolation before size calculation. [18] uses thresholding, canny edge detector[16], Harris corner detector[19], and mathematical estimations based on pixel values and reference objects.
3 Dataset
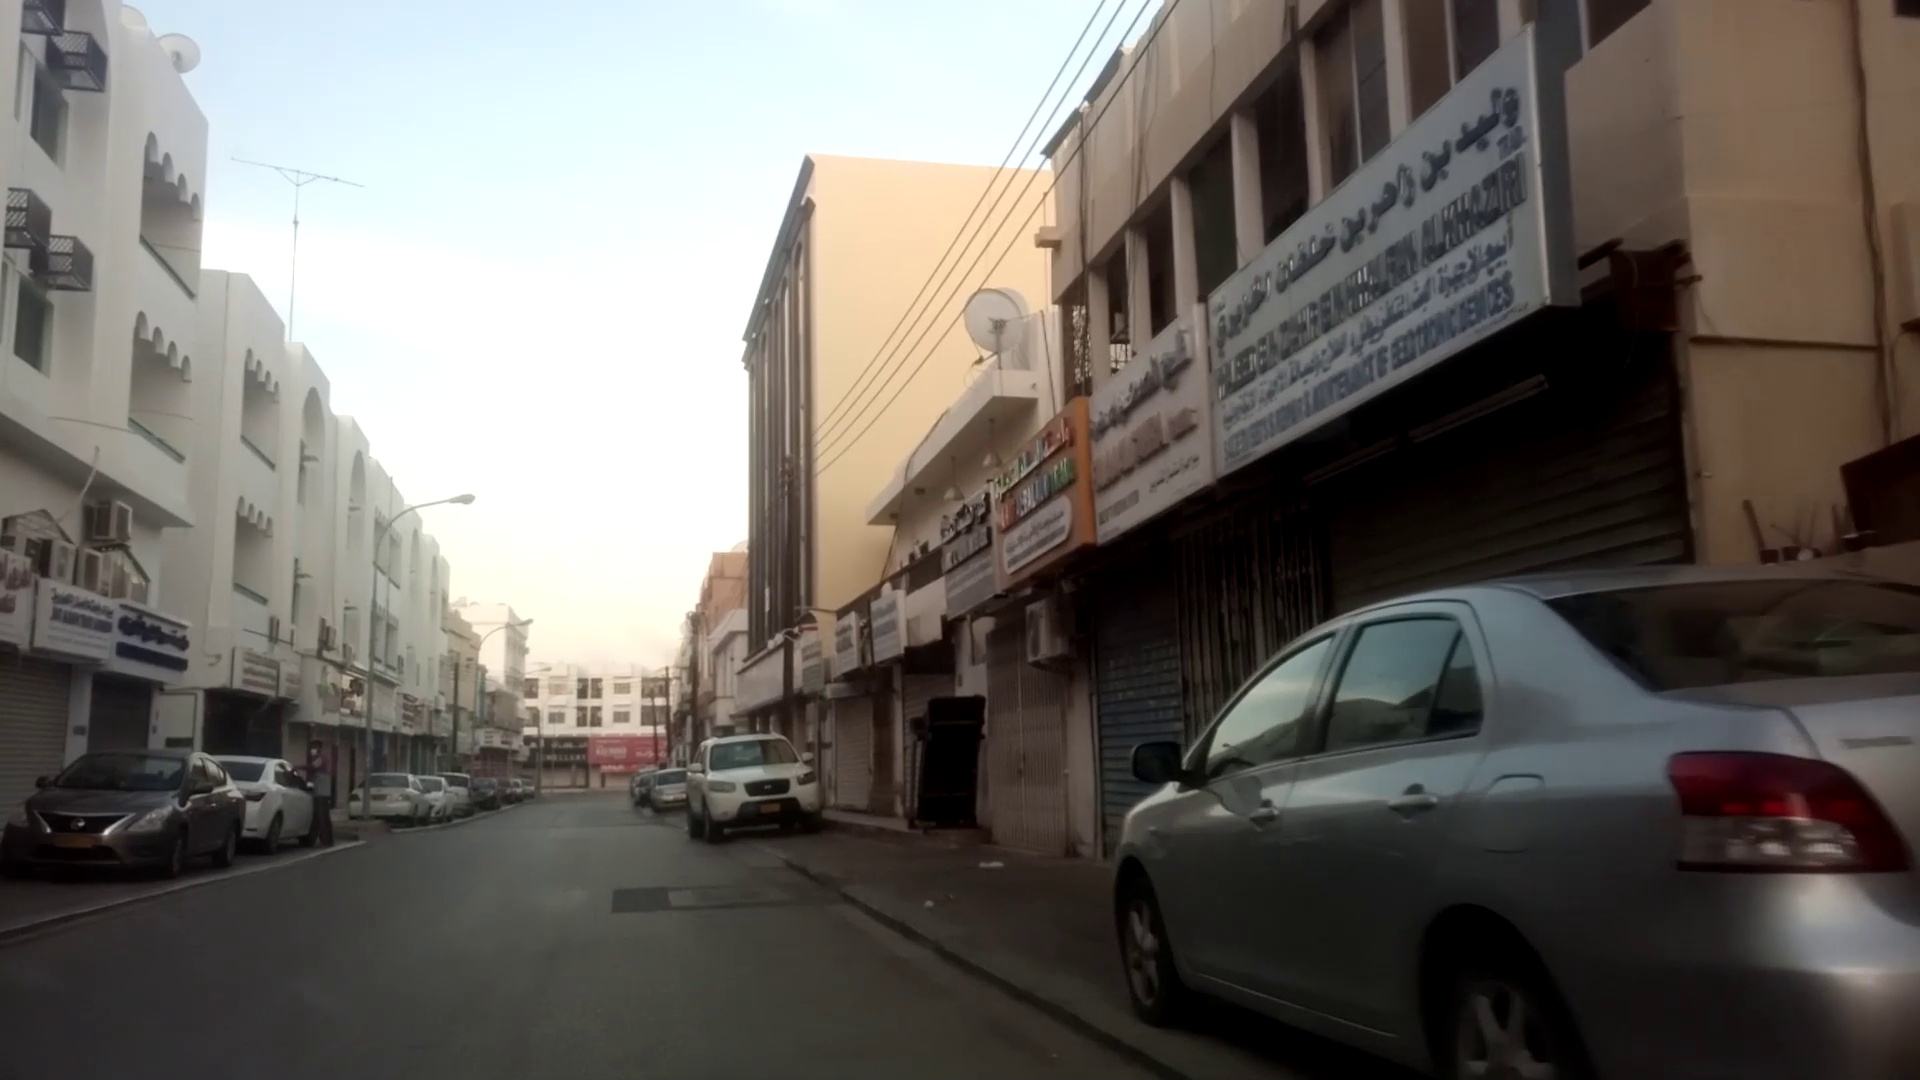
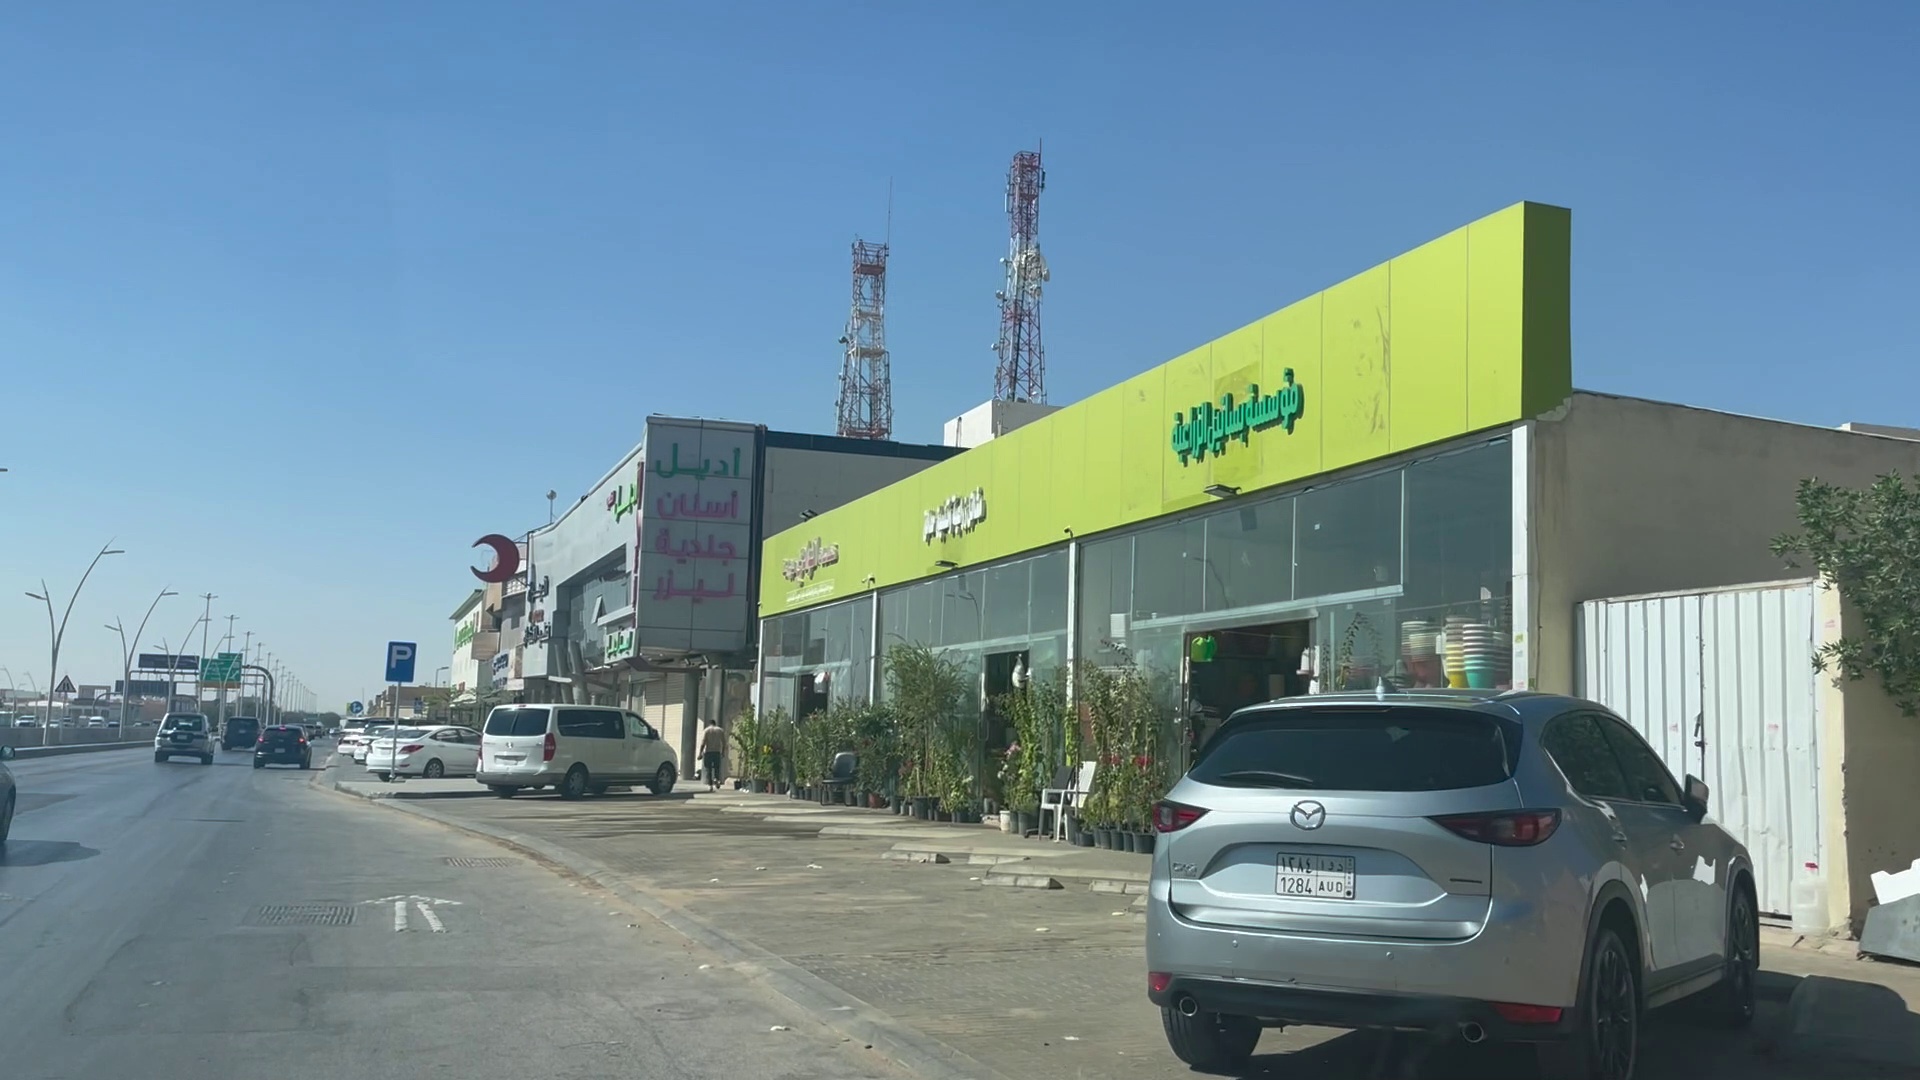
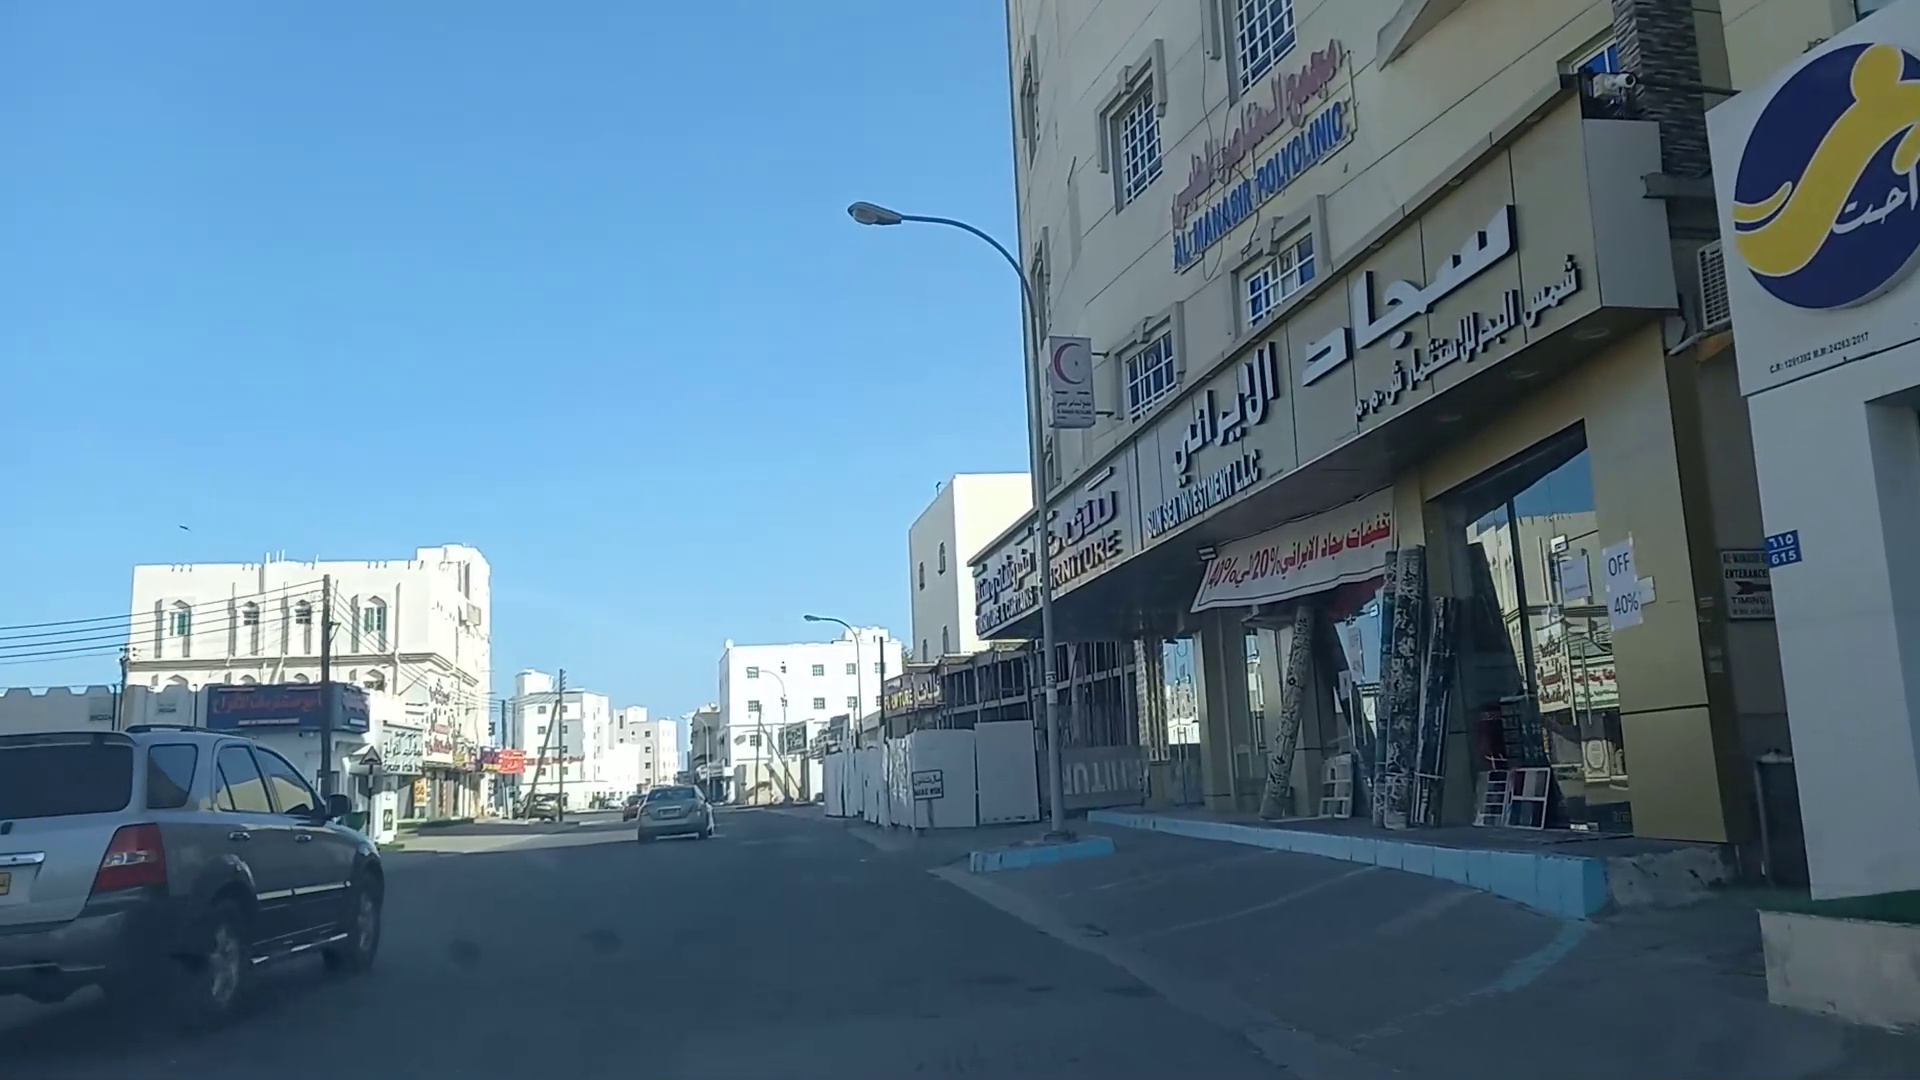
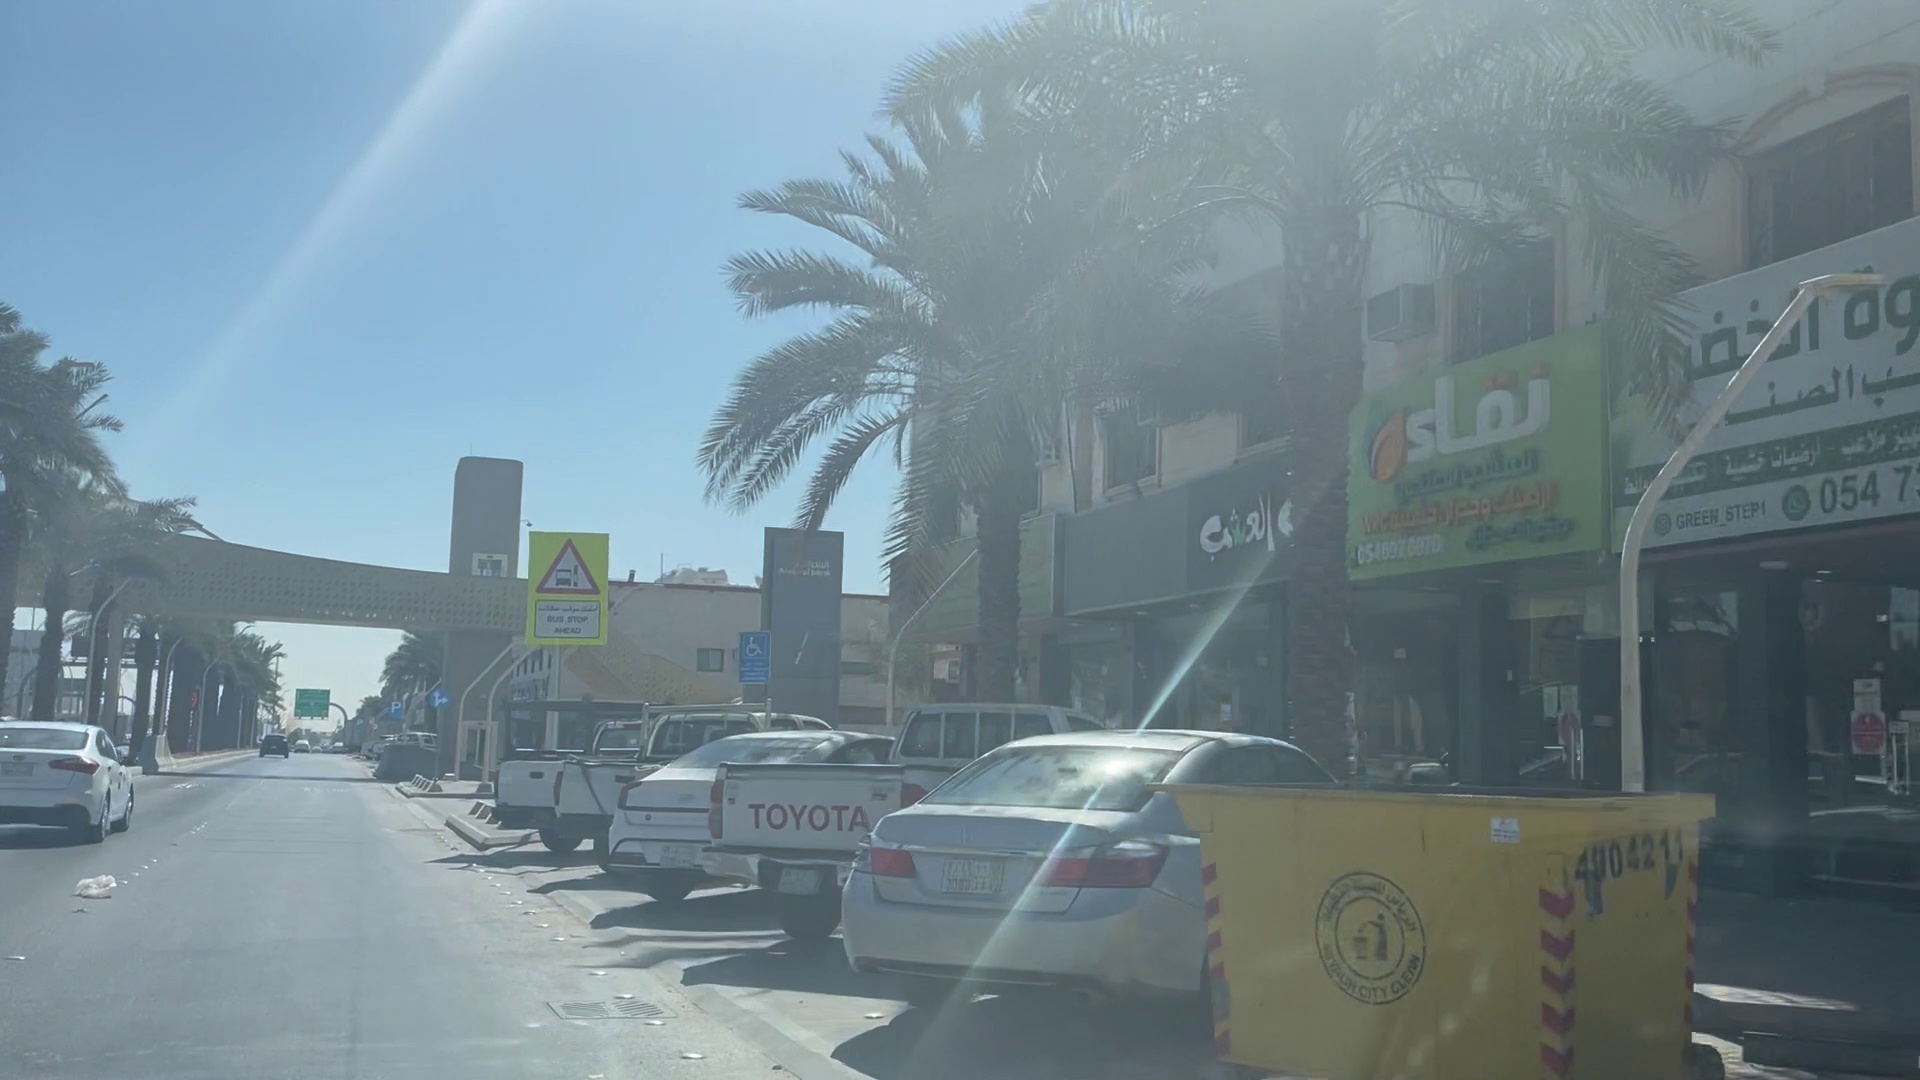
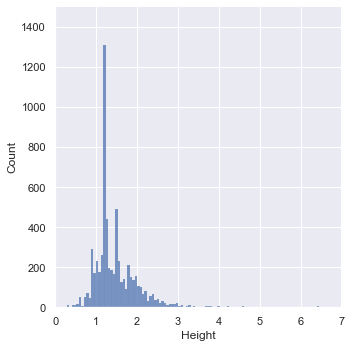
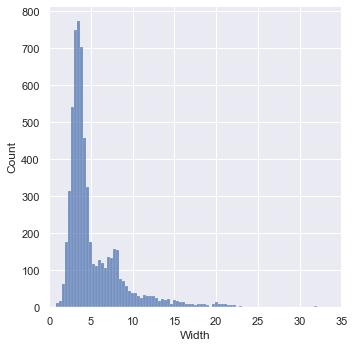
We collected a novel dataset that comprises videos of the shop signs and their actual dimension measurements for this work. The dataset consists of 6500 shop signs with their dimensions. For a shop sign board with the dimension labeled with it, three frames contain it from different views. The dataset also contains shop signs that were taken during the night. The dataset includes shop sign boards that are incomplete and occluded due to the presence of trees and other objects on the street, like traffic signs.
3.1 Data Collection
The shop signage dimension dataset was collected from multiple countries in the Arab-speaking world. Hence the shop signages are filled with either Arabic shop names or English shop names and mostly a mix of both. The problem of dimension estimation and the solution is not limited to the region. The videos of shop signages were collected using mobile phones, which are kept horizontally on the windshield of a car. The videos were taken at Full HD resolution (1920x1080) and recorded at 30fps.
The dimension of shop signage is defined as the width and height (in meters) of the frontal part of the shop signage. The depth of the shop signage is not included in the estimated dimension. In an image, the width and height comprise the physical quadrilateral board, which is kept on top of a shopfront to display the shop name correctly. During data collection, the dimensions of the shops were measured using laser tools with the support of tripods. At least two persons are required to take each shop sign’s dimensions accurately.
Some shop signages are very tall. They are more than 3 meters in height, and some may even be as tall as the building façade. The dataset also contains certain shop signages in the videos whose dimensions are not recorded. Their dimensions could not be captured due to the limitations of the laser tool used during the process. During the manual data collection process, Shop signages that are black or blue do not reflect the laser properly.
3.1.1 Data Annotation
Three nearest image frames from the video of each shop signage were annotated using polygon masks to get the correct quadrilateral. The right-most shop signage, which is fully visible, was annotated in each image frame. Faraway shop signages were not annotated because their borders would probably meet at the horizon. The dimension estimation of such signages would be highly error-prone. Partially visible shop signages were not annotated because they will not help estimate correct signage dimensions. Occluded shop signages are also annotated so that the model learns to detect and segment the signage regardless of the occlusion.
4 Method
4.1 Approach
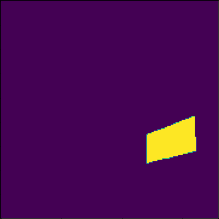
First, the object of interest, the shop signage, must be segmented using instance segmentation. Furthermore, only the nearest visible shop signage must be segmented to estimate the shop signage dimension individually and more accurately. The annotated images are combined with the width and height information from the excel sheet to form a final JSON file which contains the dimension information and mapping of the corresponding shop signage image. The images are resized from 1920x1080 to 500x500 for optimal computation of the feature maps using ResNet-50. The shop signages must be segmented first to get the correct quadrilateral pixels. Each shop signage should be of different segmentation pixel masks. Hence the right choice for architecture would be instance segmentation.
4.2 Overall Architecture
YOLACT is a real-time one-stage instance segmentation neural network architecture. It has the advantage over other instance segmentation algorithms like MASK-RCNN in that it produces the object detection vector of mask coefficients for each anchor box and the prototype mask through two parallel branches. Once each instance goes through the NMS (Non-Max Suppression) with a high threshold, a mask is constructed by linearly combining the prototype branch with the mask coefficient branch. YOLACT has a faster NMS module than its predecessors, which is at least 12ms faster than the normal NMS. A sigmoid non-linearity follows this to produce the final masks. We use ResNet-50 as our default backbone feature extractor with a base image size of 500x500. Once the image features are extracted, it is sent to the Feature Pooling Network, which acts as the neck in the Neural Network. In our training configuration of YOLACT, there is a bounding box regression head with the object detection class with cross-entropy loss and a mask head for the prototypes with k channels of a maximum of 100 prototype masks to be trained. It also has a segmentation head that uses cross-entropy loss. The Multi Layer Perceptron (MLP) eventually performs the signficant job of the dimension estimation. The protonet mask is detached from the Protonet along with the coefficients from the detector head to give input to the MLP head.
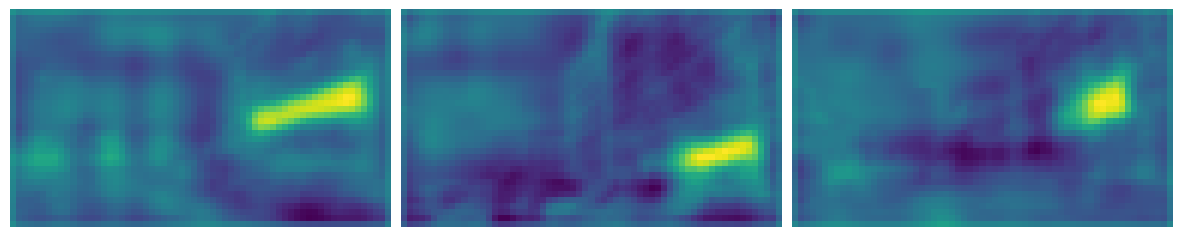
4.3 Prototype Mask
The prototype mask is one of the k prototype mask candidates obtained from the Protonet layer. The Fully Convolutional Network(FCN)[20] generates it parallel to the detector head. We use the prototypes generated from the predictions using foreground and background prototypes for the segmentation loss.
Then we use the masks taken from different prototypes to calculate the mask loss using Binary Cross Entropy which is given by the equation
4.4 Dimension Estimation
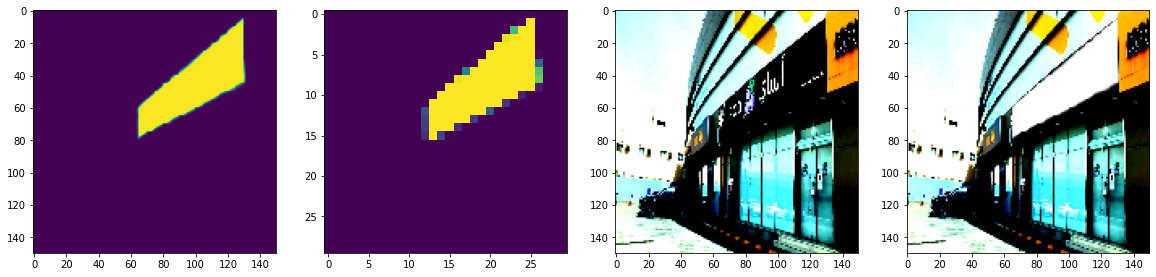
The configuration mentioned in section 4.2 is enough for training a neural network with a dataset containing polygon masks of the shop signages. However, to do the regression of the height and width of the shop signages, we need to regress the two values in the correct head of the YOLACT network. We created a simple Multi-Layer Perceptron(MLP) with six layers of neurons that have Rectified Linear Units (ReLU) as the activation function. The input of the MLP is the mask of shop signage, and the regression output of this neural network will be two values representing the height and width dimensions. We selected the protonet head to add the loss of creating a prototype representative mask that can be used for regressing the height and width of the shop signage. We have empirically concluded that the loss value converges well when the mask size is 150x150. This loss is referred to as hnw-loss . It is further aggregated to the prototype mask loss.
4.5 Loss Function
The total loss of the PMODE network consists of terms corresponding to segmentation mask generation, bounding-box detection (classification and regression), and height and width regression. For mask generation, we use the Binary Cross(BCE) Entropy loss mentioned in section 4.3. This will help the dimension estimation since YOLACT looks at all pixels. During training, we use the smooth L1 loss for the height and width regression of . The classification loss is Cross Entropy loss, and the bounding box detection loss, , is Smooth L1 loss.
5 Experiments
We prototyped the solution on NVIDIA 3070 RTX and 3090 RTX computers and further developed the high-performance models on NVIDIA DGX-1 with 8 V100 GPUs. We conducted the experiments with various shuffle configurations. Since the dataset was collected from two countries, we did the training and validation with a mix of shop signage images from these countries. The dataset contains 5000 shop signage images and their dimensions from one country and 1300 shop signages and their respective dimensions from the other country. All experimentation has been done using the MMdetection[21] library.
5.1 Augmentations
We experimented with light and heavy data augmentation using Albumentations[22]. The results provided an extra performance on rainy and dusty days. The augmentations techniques include photometric distortion, random flips horizontally and vertically, slight rotation up to 15 degrees, random brightness contrast, RGB shift, hue saturation value, jpeg compression, channel shuffle, and median blur, as shown in the image below.
We made custom augmentation related to the methodology to improve the robustness of height and width estimations; such augmentation includes object mask length extension and 90 degrees rotation, flipping the ground truth height and width of the object of interest. The tests resulted in more robust estimations.
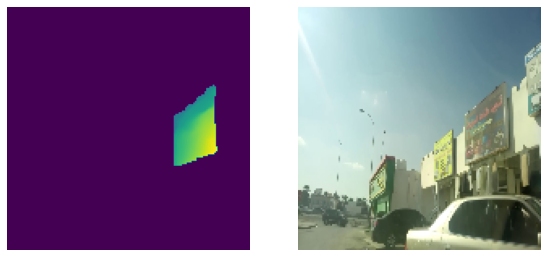
5.2 Depth Estimation
We trained the estimator as embedded depth estimated masks using a monocular camera with MiDas[23]. The system shows robustness against further away shops while showing similar performance for closer shops. The depth estimation was integrated over the mask before the dimension estimation, as shown in the figure below. The depth augmentation and the corner loss mentioned in section 5.3 produced the best segmentation mAP of 0.720 and Height and Width MAPE of 0.223, as seen in Table 1. It is pretty intuitive that the depth feature adds a lot of value to any object dimension estimation. However, we are limited by the constraint of a monocular camera and the setting of a moving car.
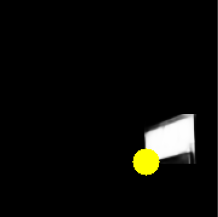
5.3 Corner Loss
While testing the height and width estimations, we noticed that while we are accounting for pixel prediction confidence, there is still the issue of the model predicting artifacts interfering with the height and width estimated values. So we made the corner loss as an extra loss embedded with the cross entropy to focus more on vertices, allowing height and width estimated values to be more accurate by concentrating more on segmentation shape than simply activating most pixels with the mask prediction. The corner loss starts by identifying corner positions in the ground truth label using the Harris Corner detection algorithm[19]. Then we proceed to cluster the corners using radius-based clustering algorithm DBSCAN[24] as shown below in the figure:
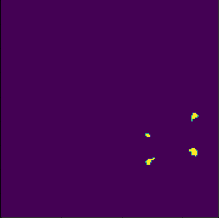
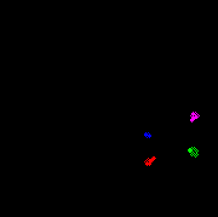
After that, we calculate the centroid of each clustered group; we use that as the center of the circle used in the final step to estimate the corner alignment between ground truth and mask prediction. We then proceed to estimate the shape edge using the canny edge algorithm
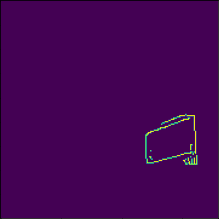
We then use the circular radius over the edge detected mask to measure the center of the ground truth and for each corner for both predicted and ground truth. We then calculate the (1-r2) score for the position of both as our regression loss. If we faced the issue of the predicted mask not having active pixels in the radius, we proceeded with a maximum loss of 1 for the cluster group while accounting for the predicted pixels within the radius for the high loss. During the tests done. The corner loss has resulted in around 0.1 mAP increase over the shop signage data and increased visual and dimension estimation accuracy over the test data. The overall loss would then be re-written as
where
refers to the coordinate pixel being part of the shop signage prediction and refer to the set of all corners
6 Results
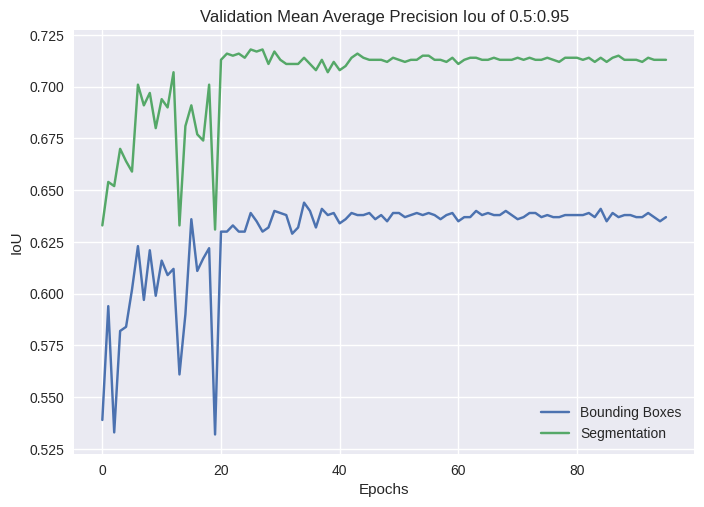
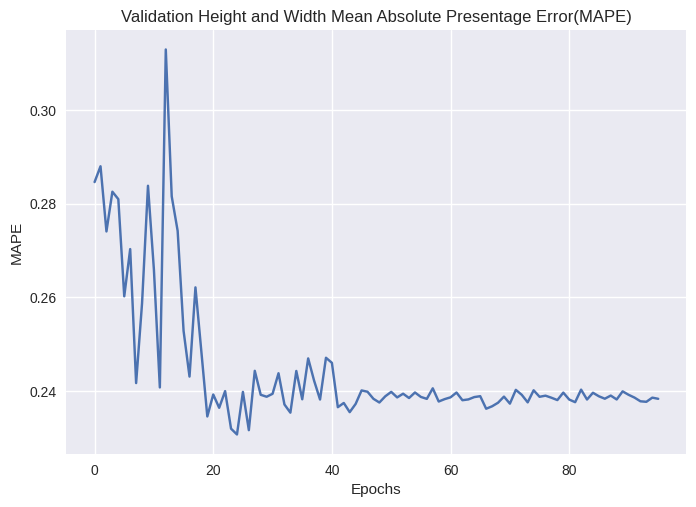
We trained the network for under 100 epochs with the dataset from both countries and observed that the dimension estimation converges ideally at the 21st epoch. As shown in Table 1, we find out the mean Average Precision for the bounding box loss, segmentation loss, and Height and Width loss using MAPE(Mean Absolute Percentage Error). The rows represent various training experiments with only Protonet Mask, the experiment with the protonet mask and DDepth the experiment with the protonet mask, and Depth with Corners loss and augmentations as explained in the Experiments section.
| Method | Bounding Box mAP 0.5:0.95 | Segmentation mAP 0.5:0.095 | Height and Width MAPE |
|---|---|---|---|
| Protonet Mask | 0.634 | 0.717 | 0.235 |
| With Depth | 0.645 | 0.645 | 0.238 |
| Depth Aug. and Corner Loss | 0.642 | 0.720 | 0.223 |
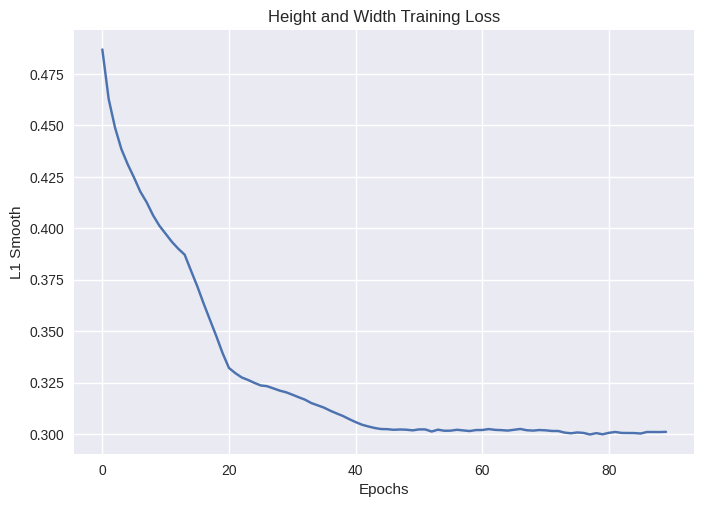
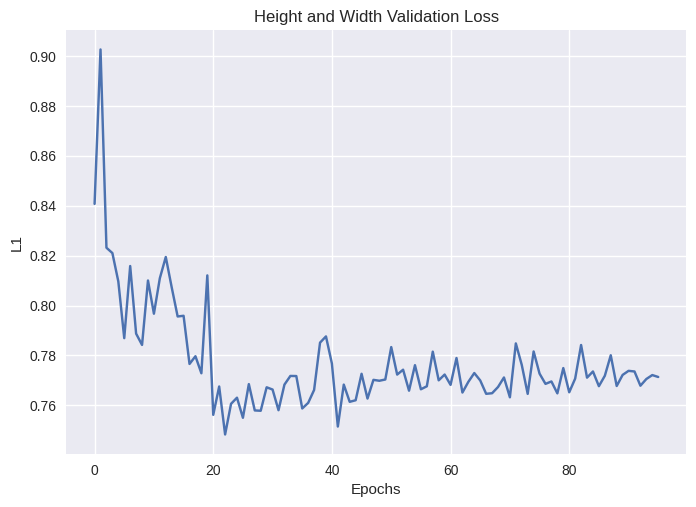
The mask experiment is wherein we look at the pixel confidence and perform the dimension estimation. In Figure 10, we show the training loss with Smooth L1 loss for the Height and Width regression, whereas the validation loss is L1. The third graph shows the IOU values saturation for the bounding box and segmentation from the 21st epoch while keeping the mAP value 0.5:0.95. The Height and Width Validation is done using Mean Absolute Percentage Error(MAPE).
6.1 Semantic consistency in video
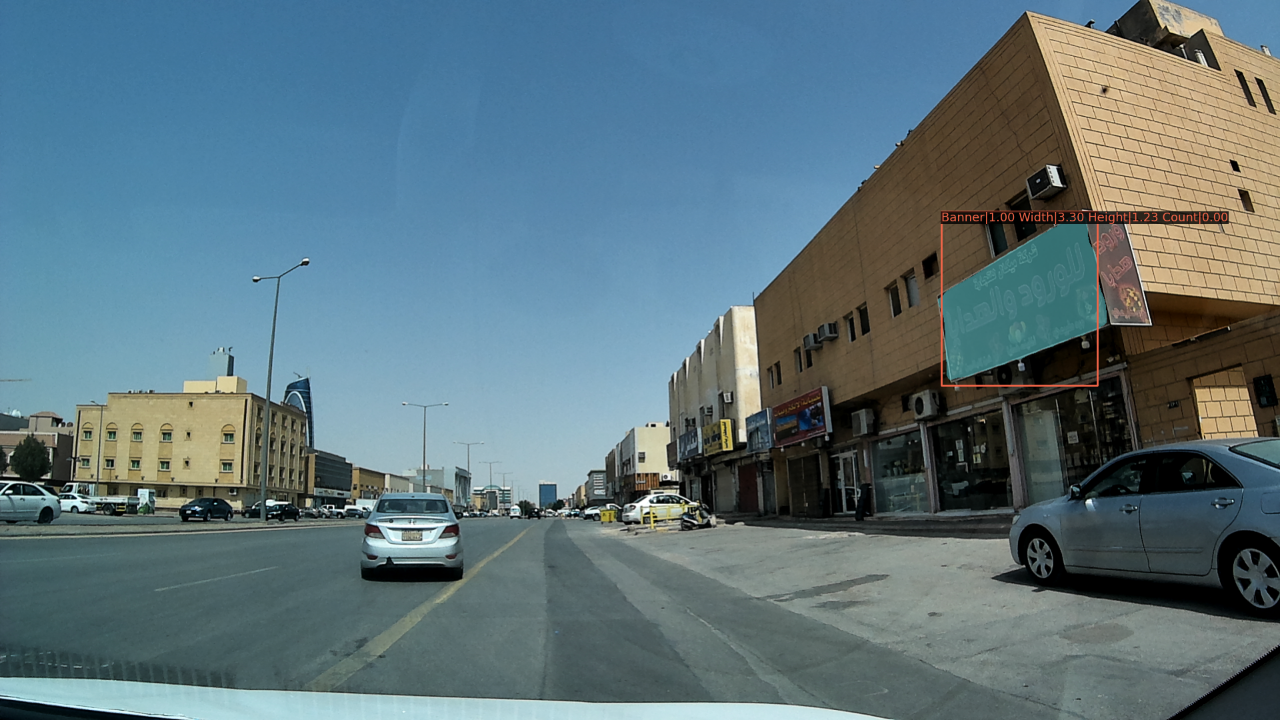
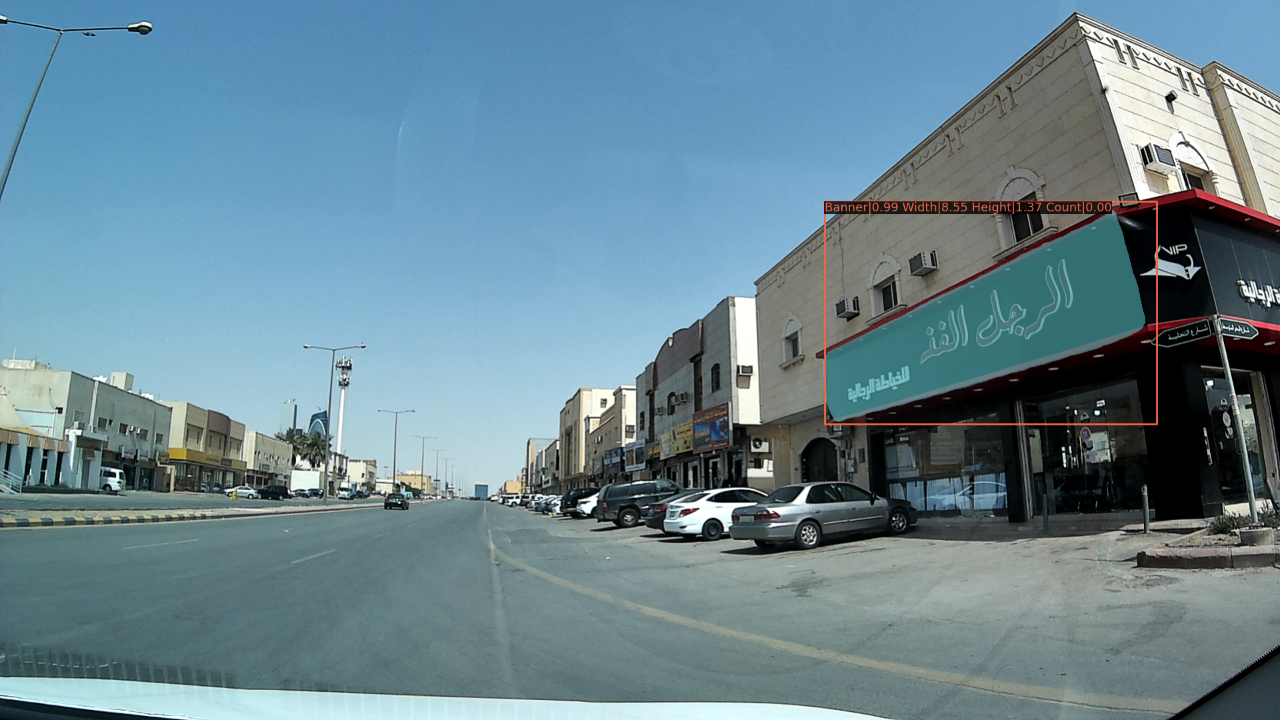
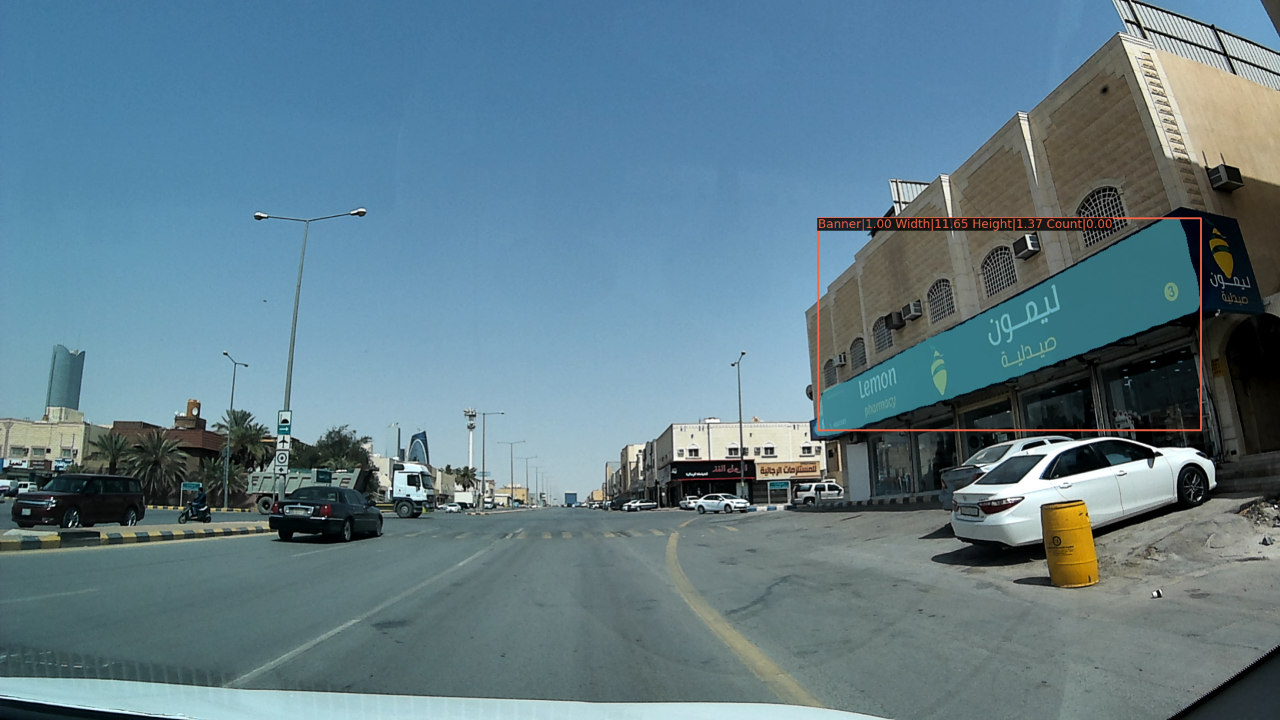
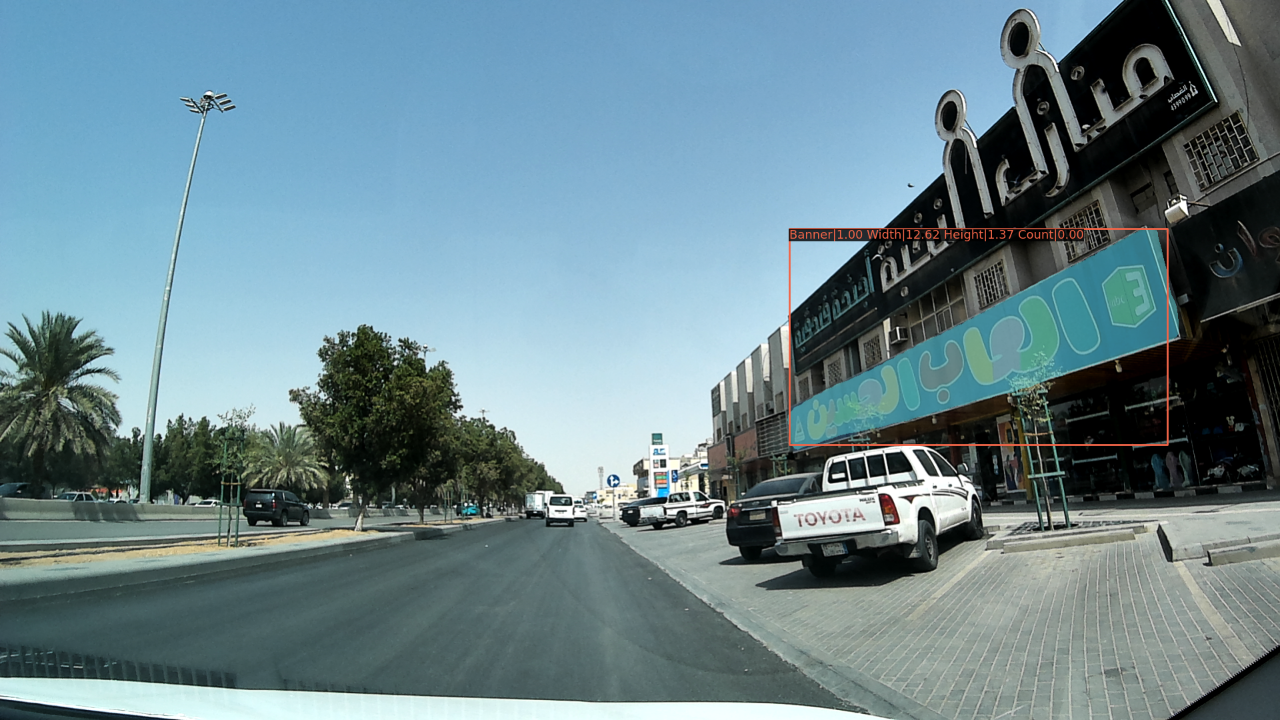
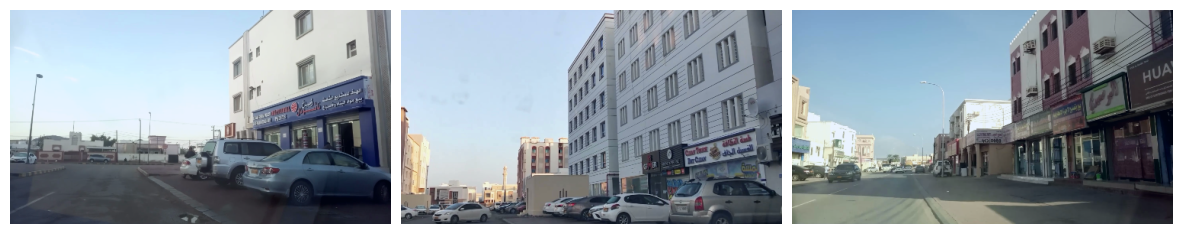
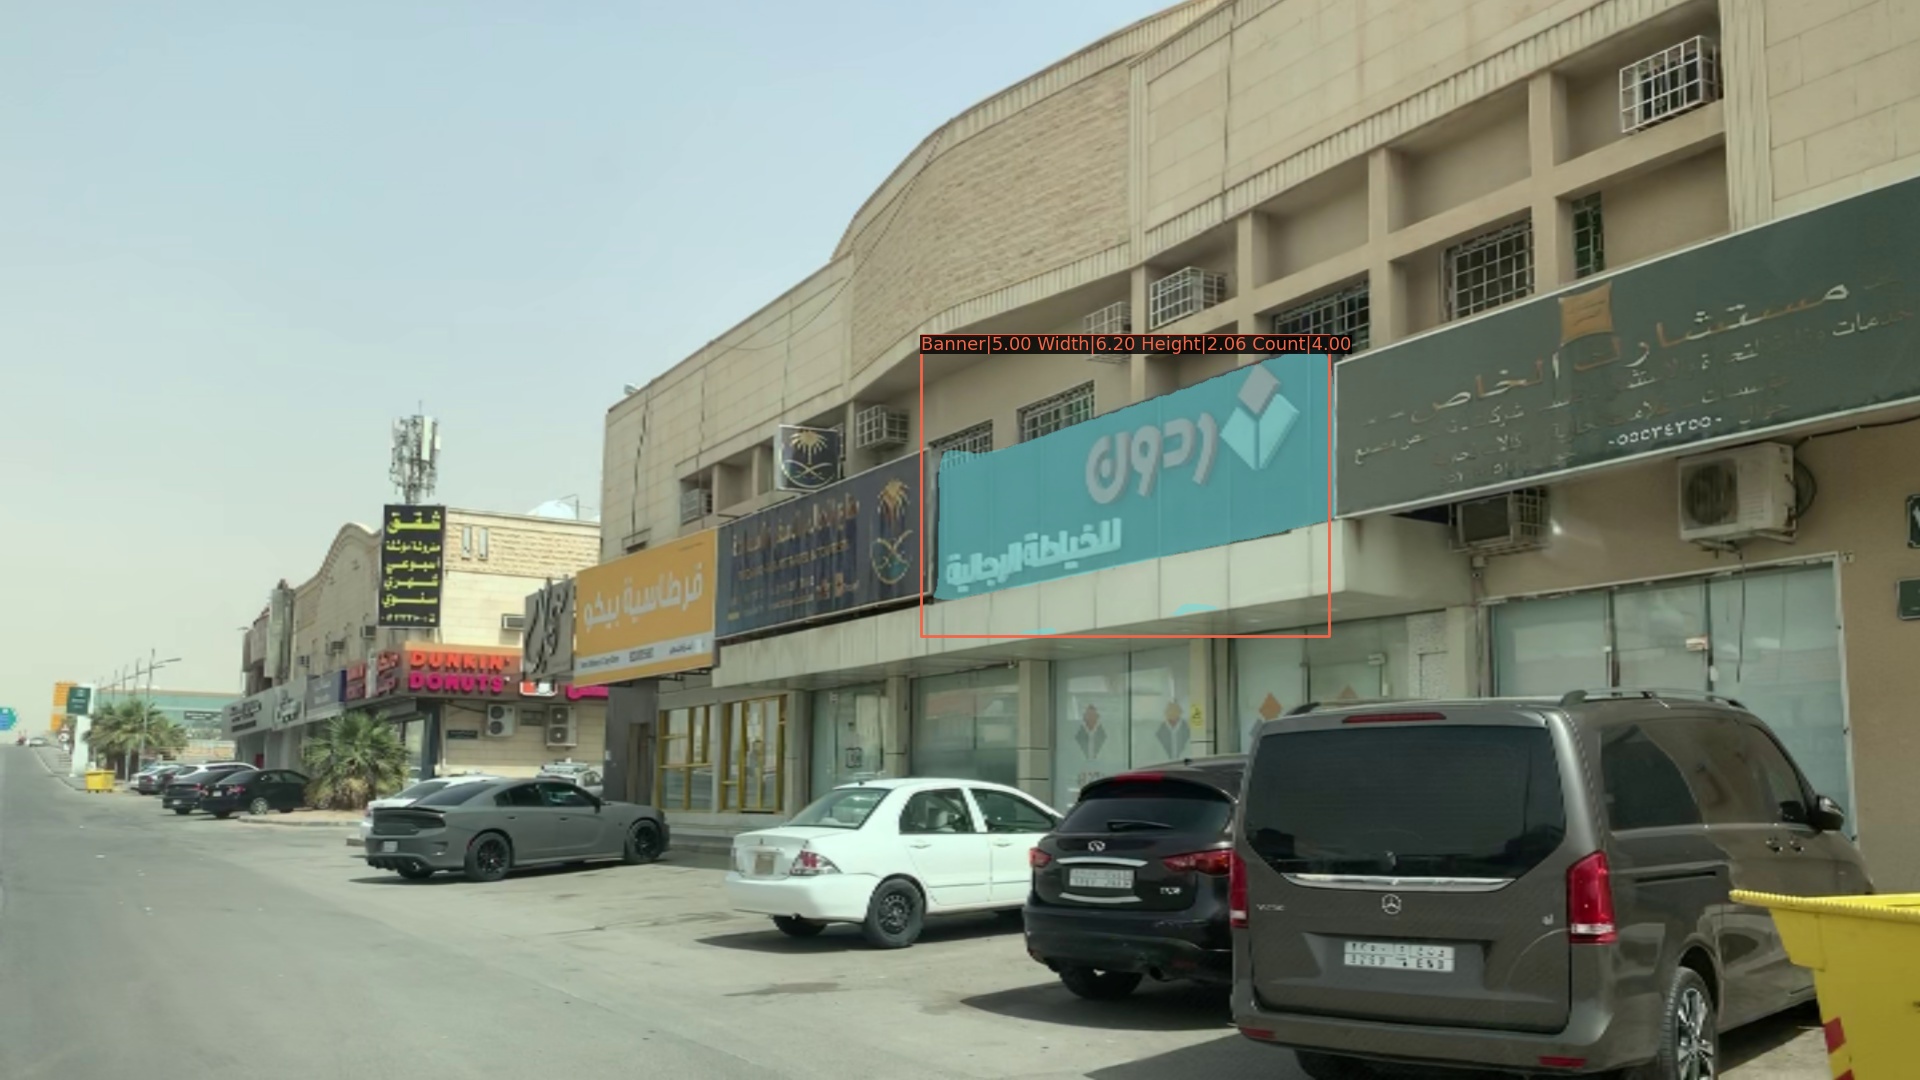
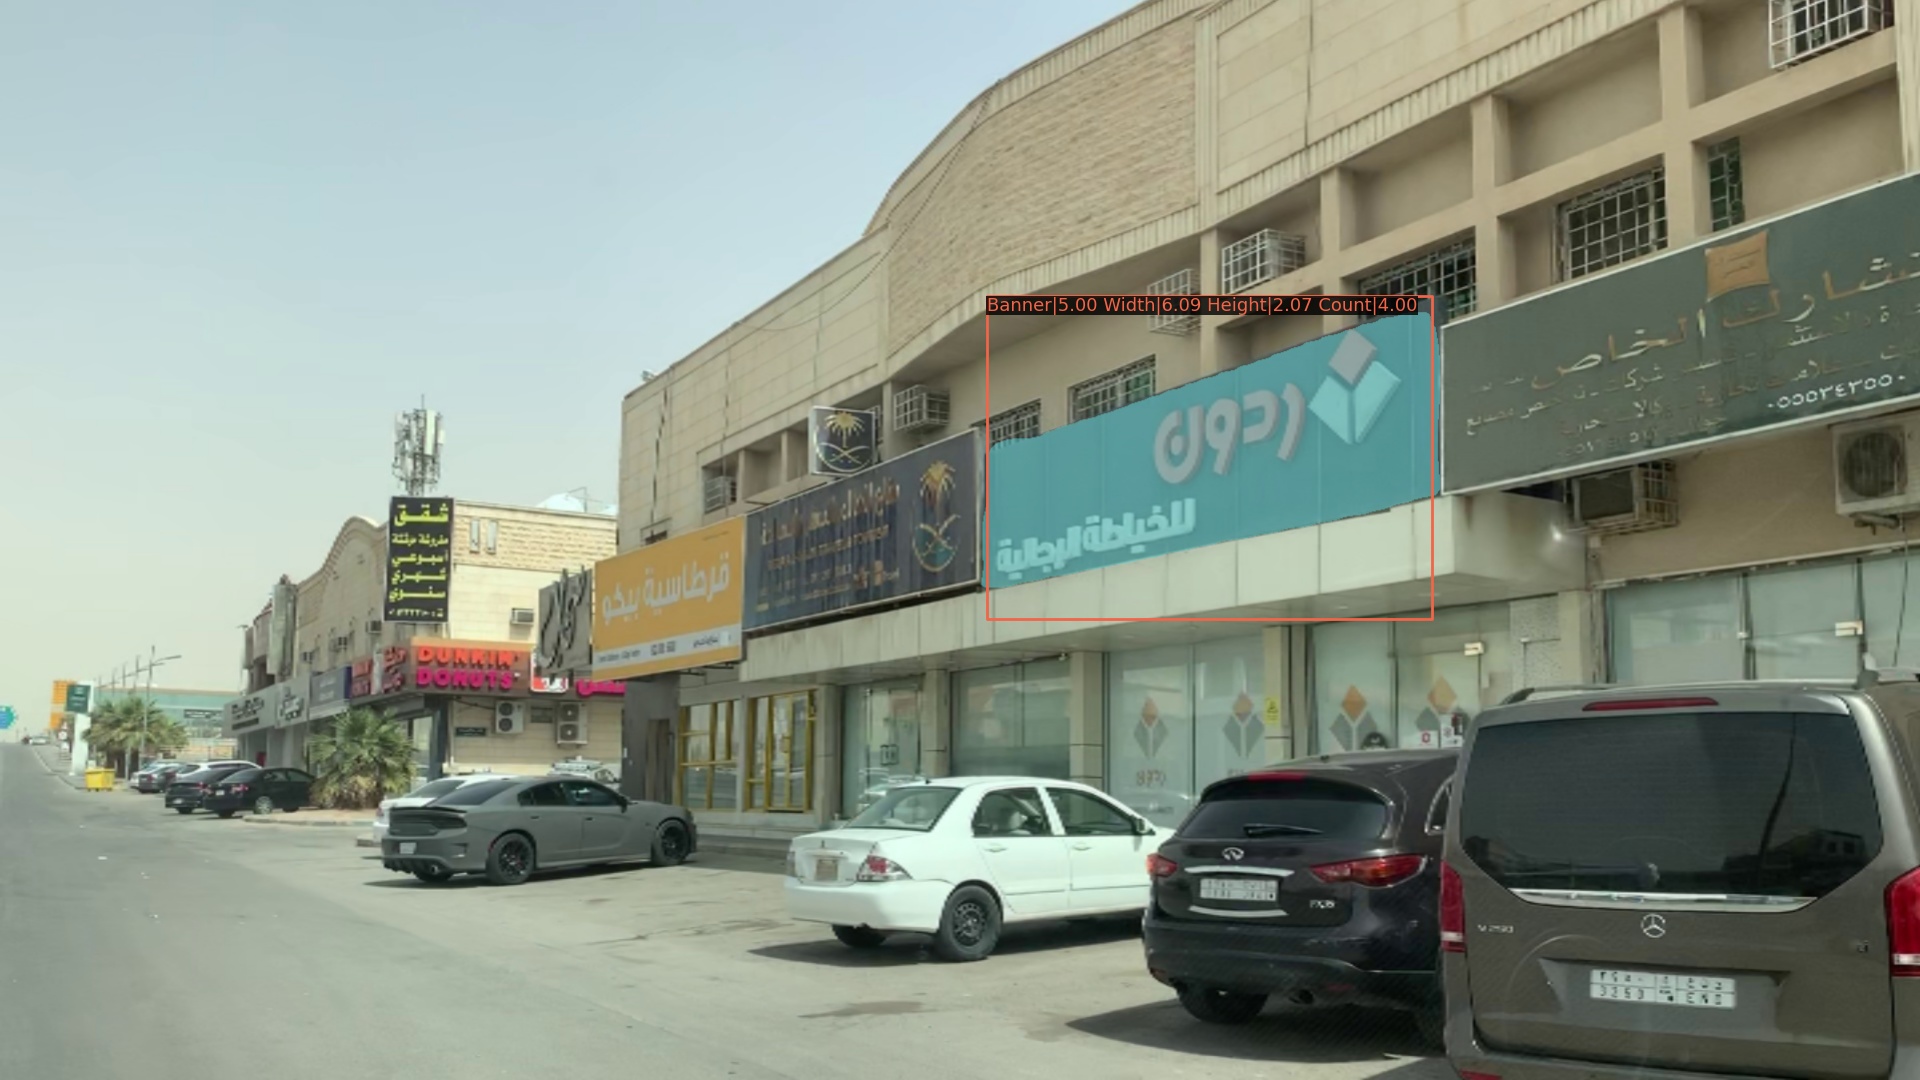
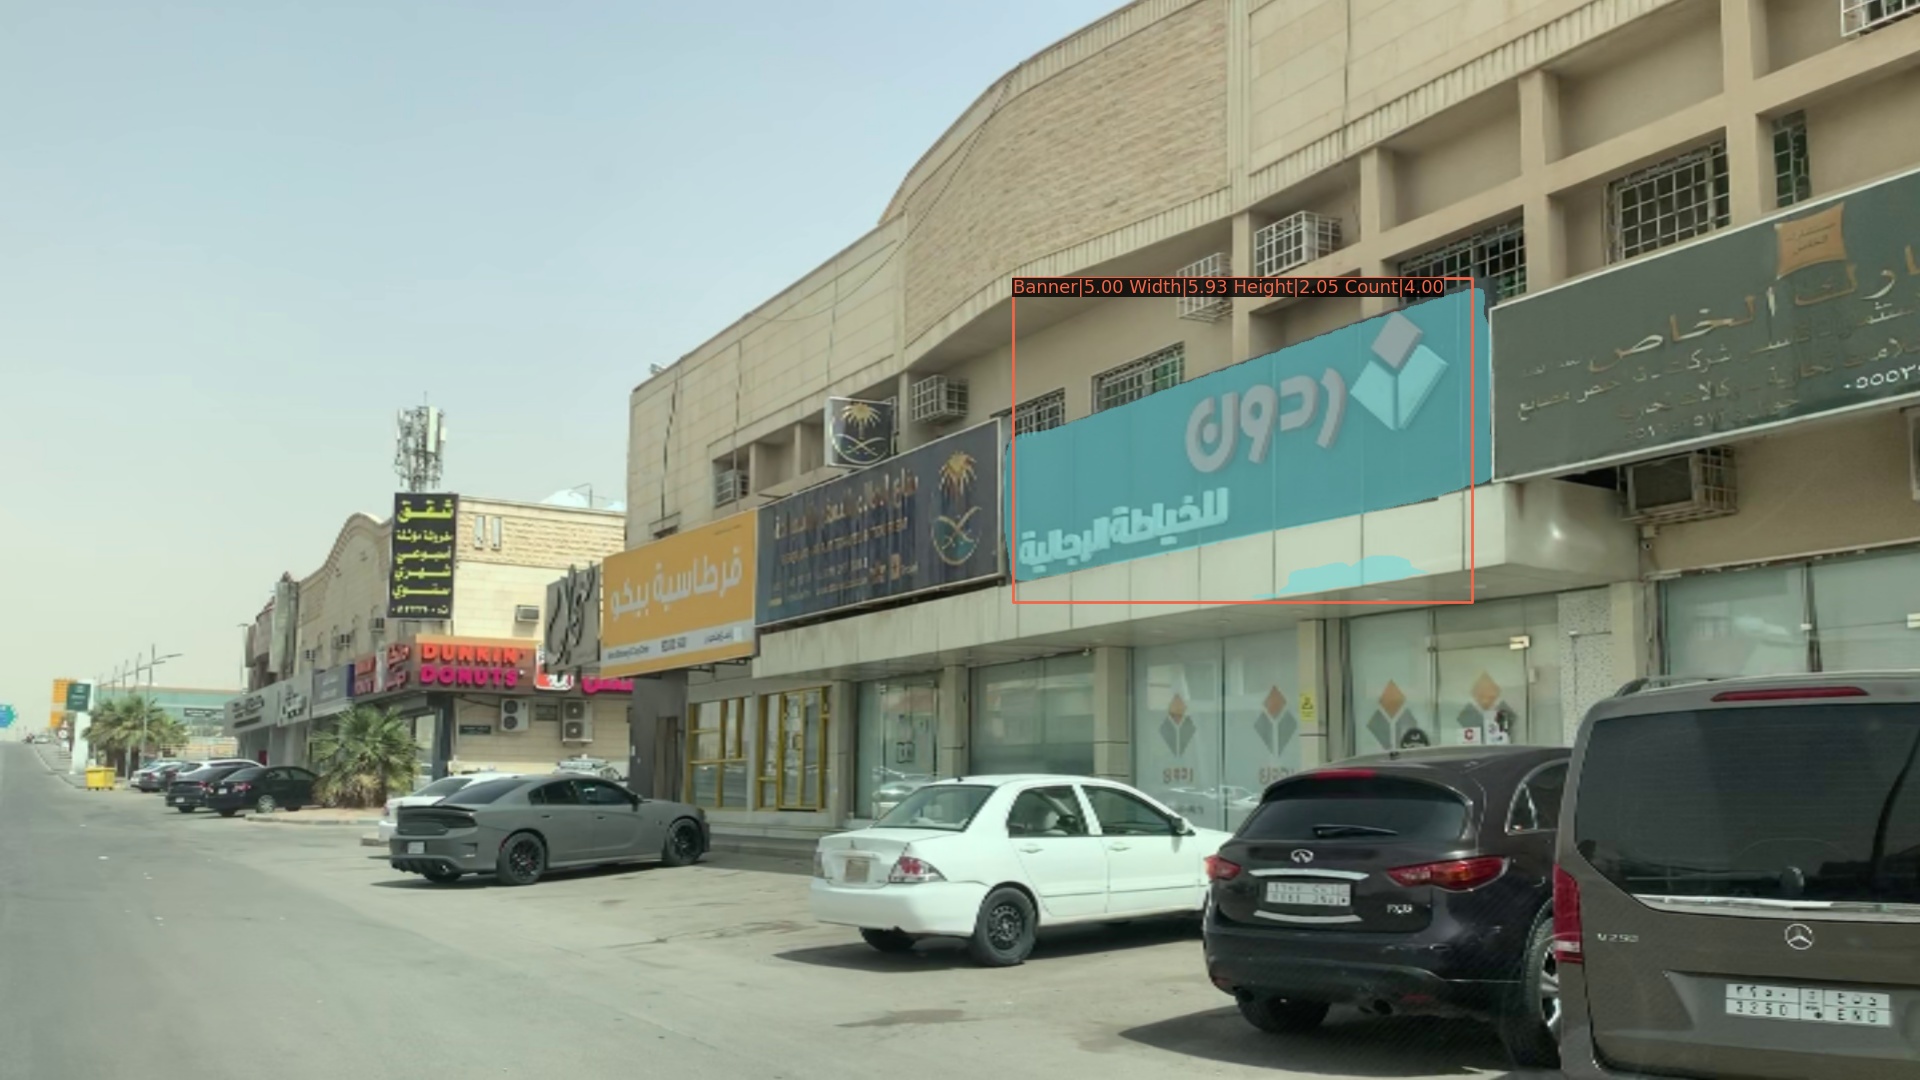
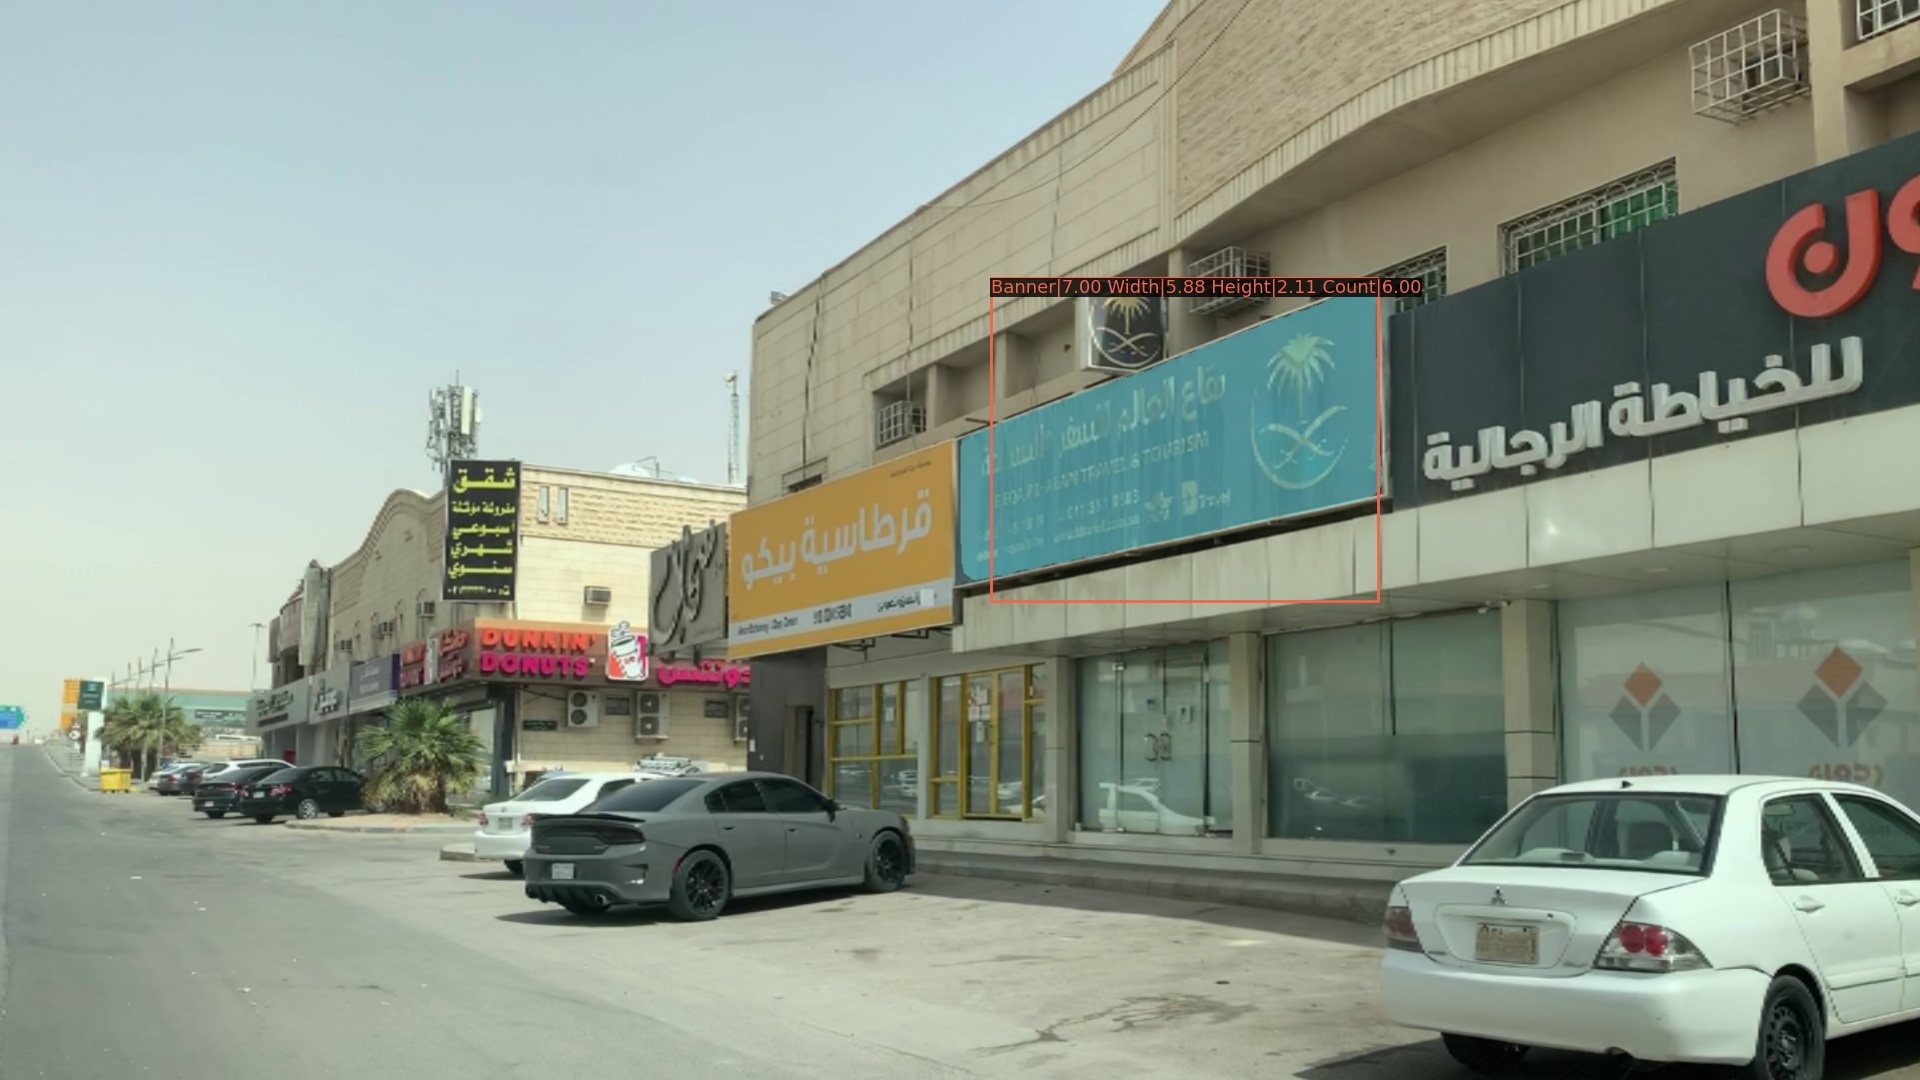
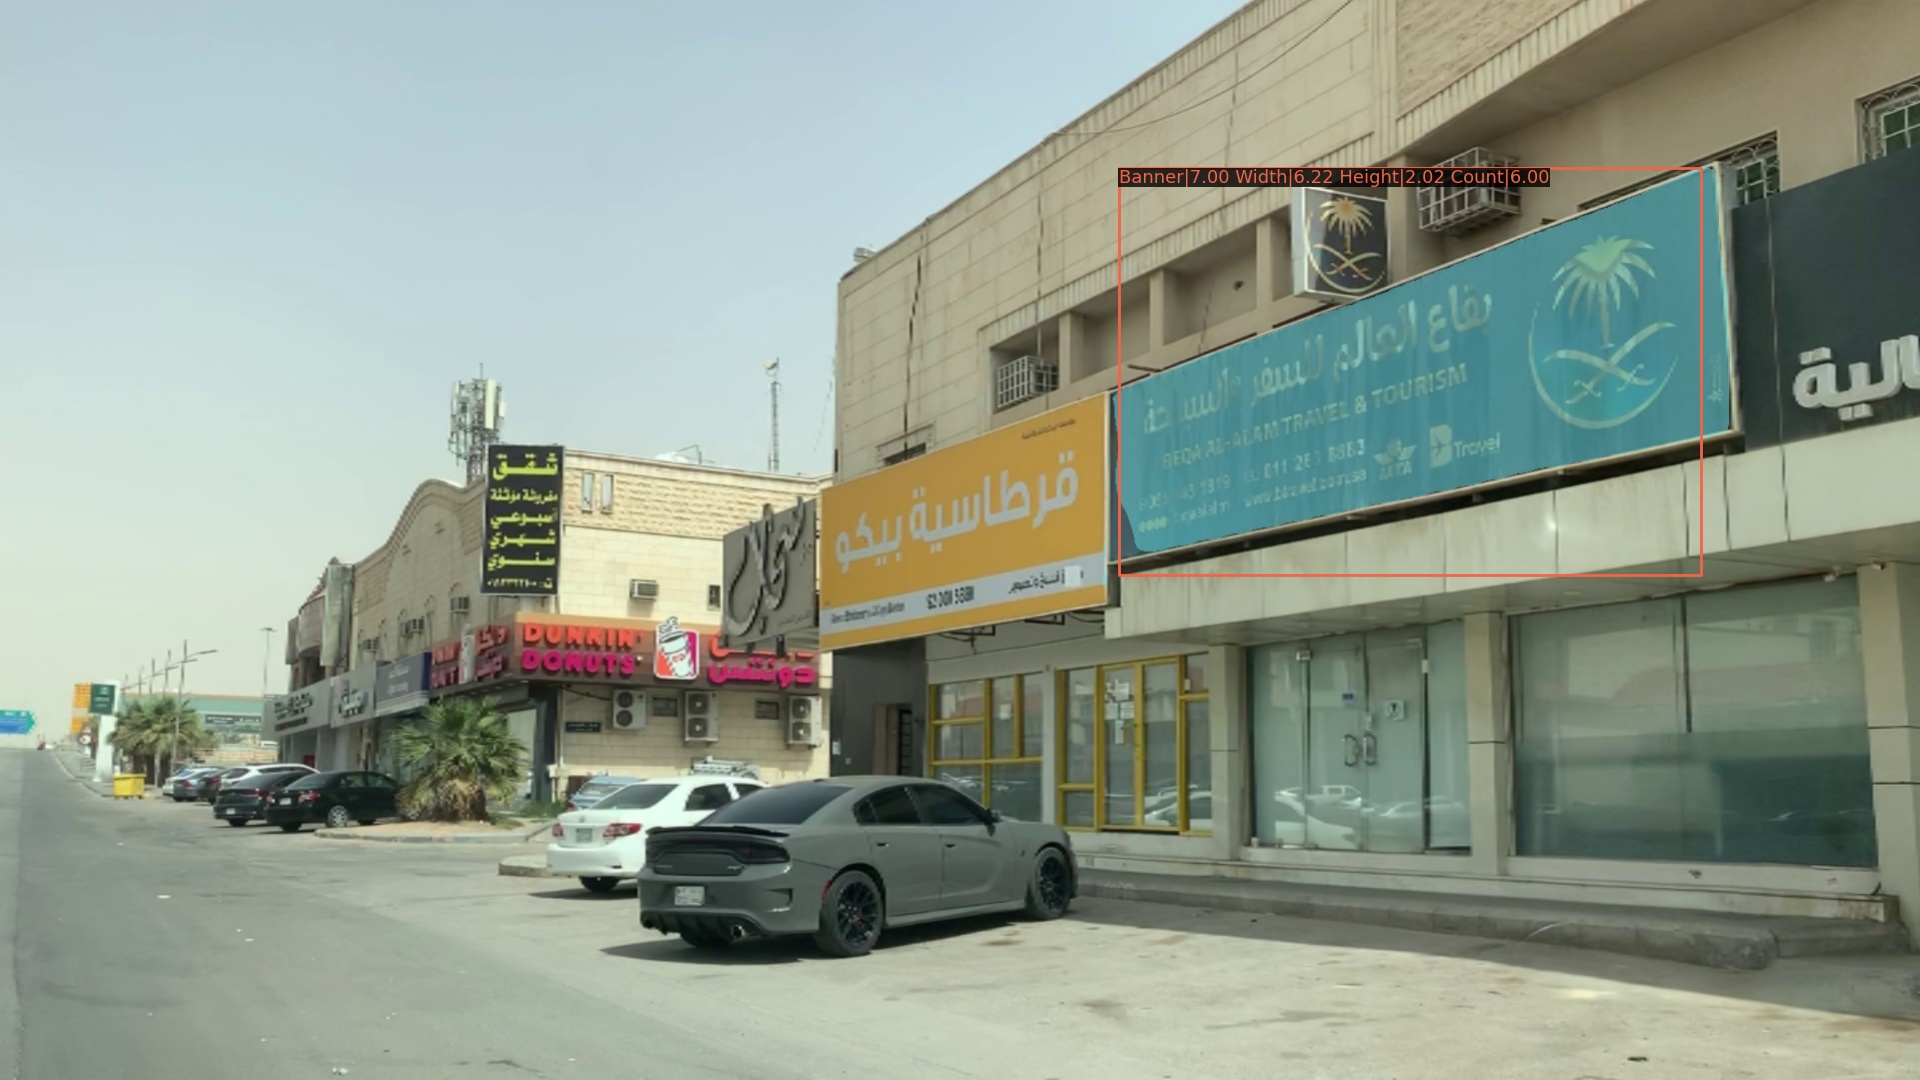
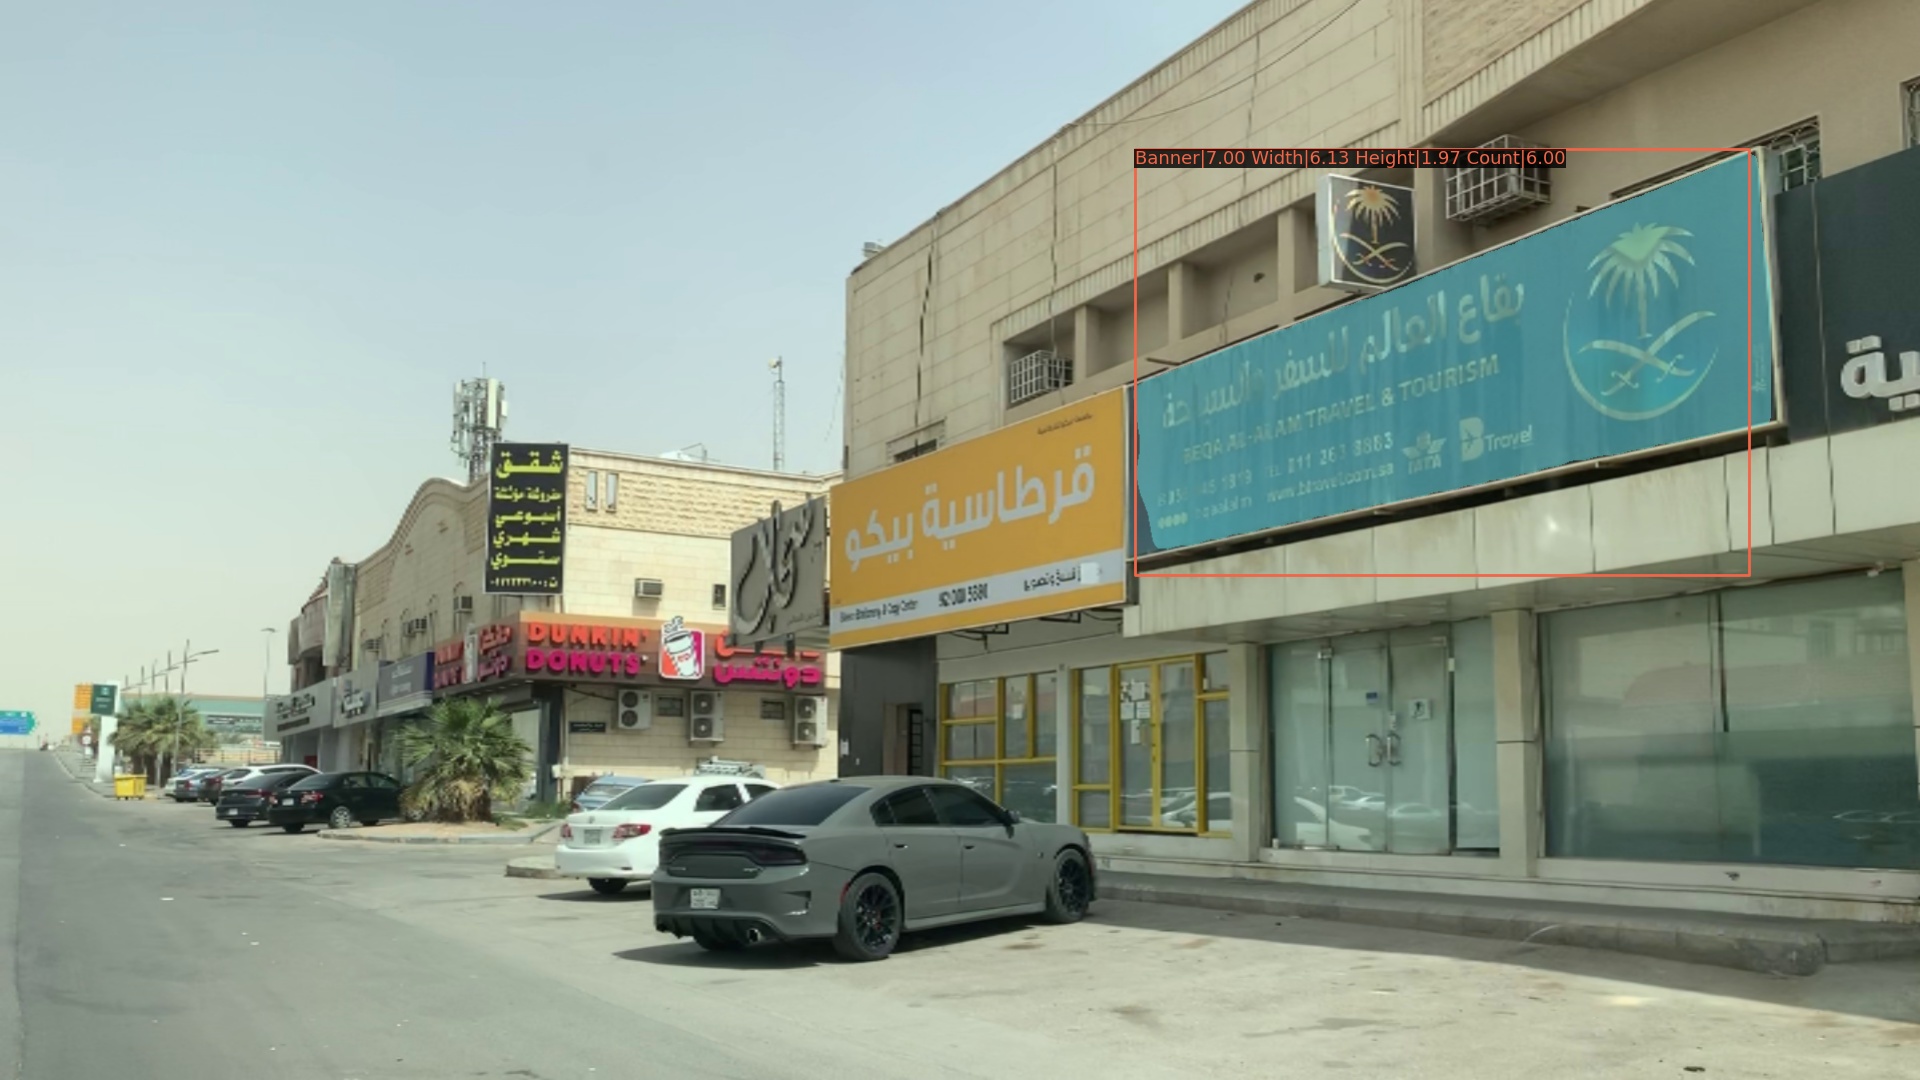
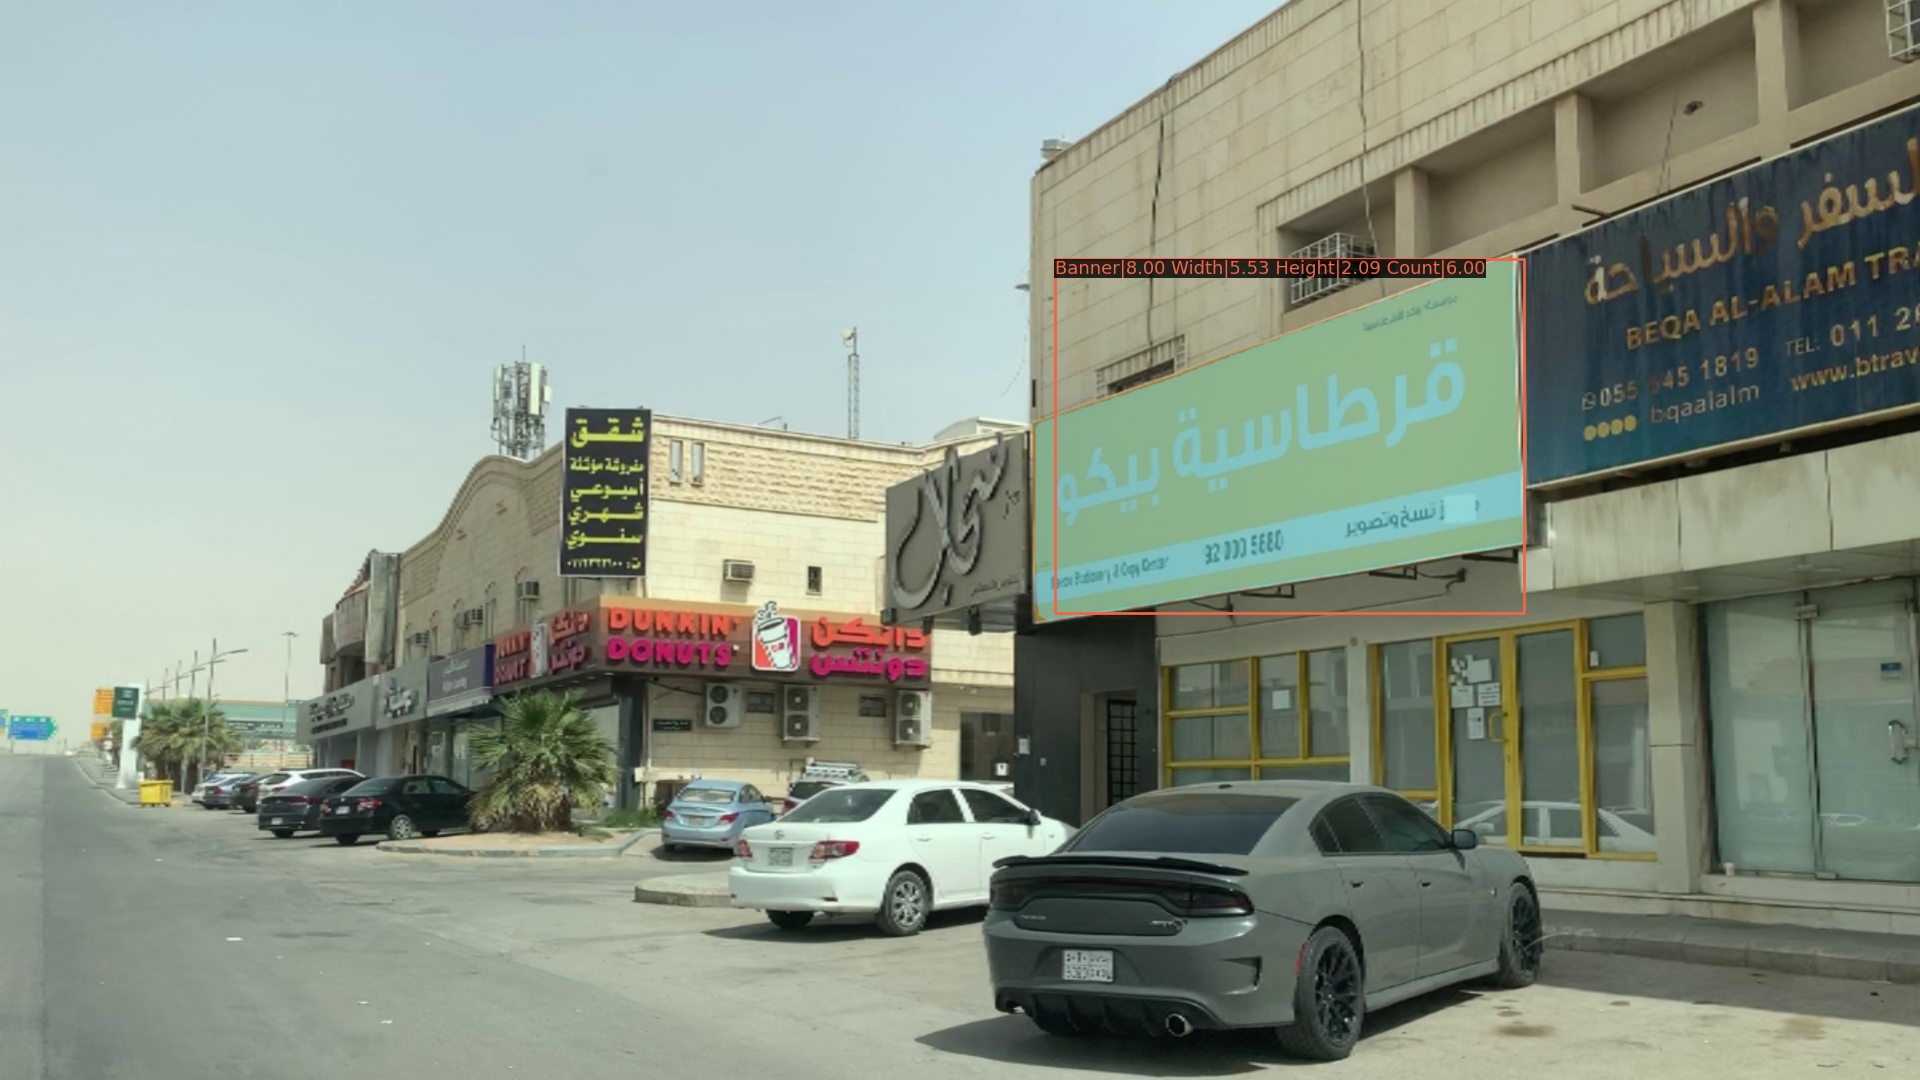
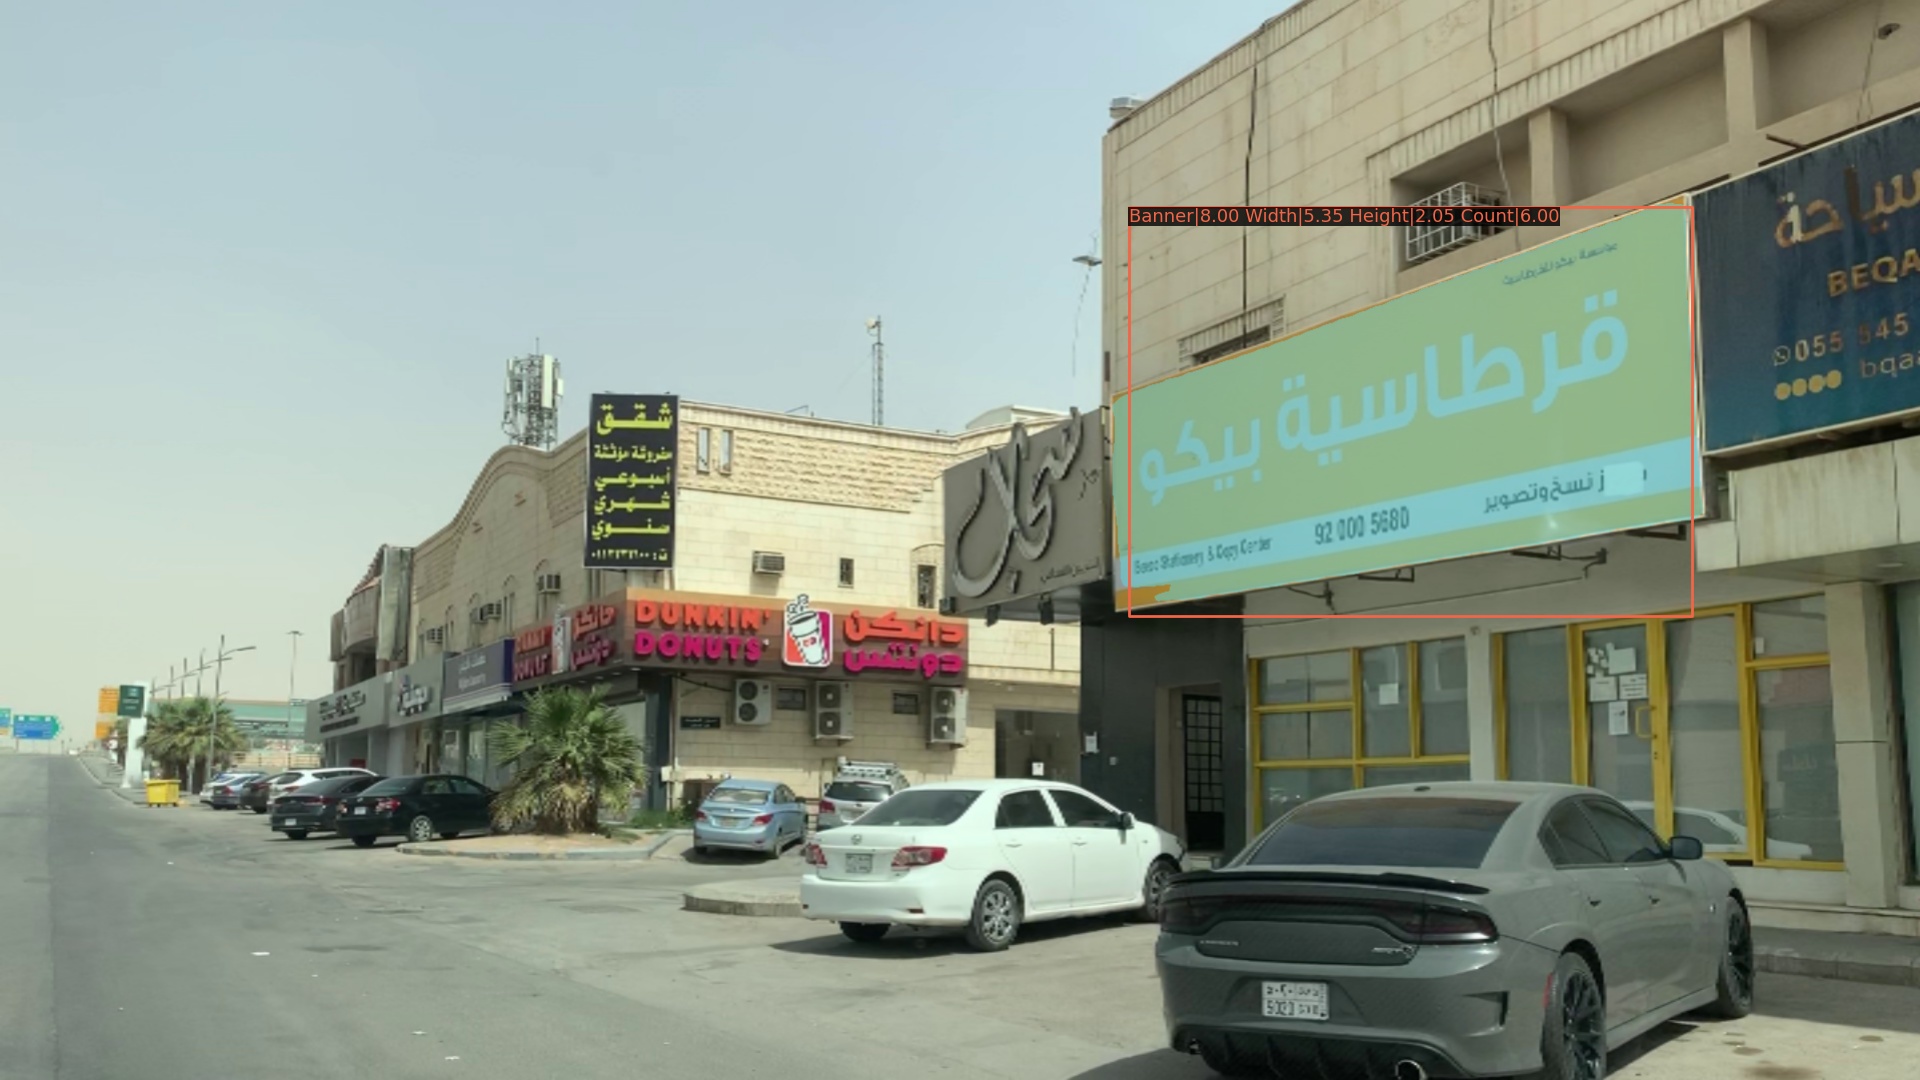
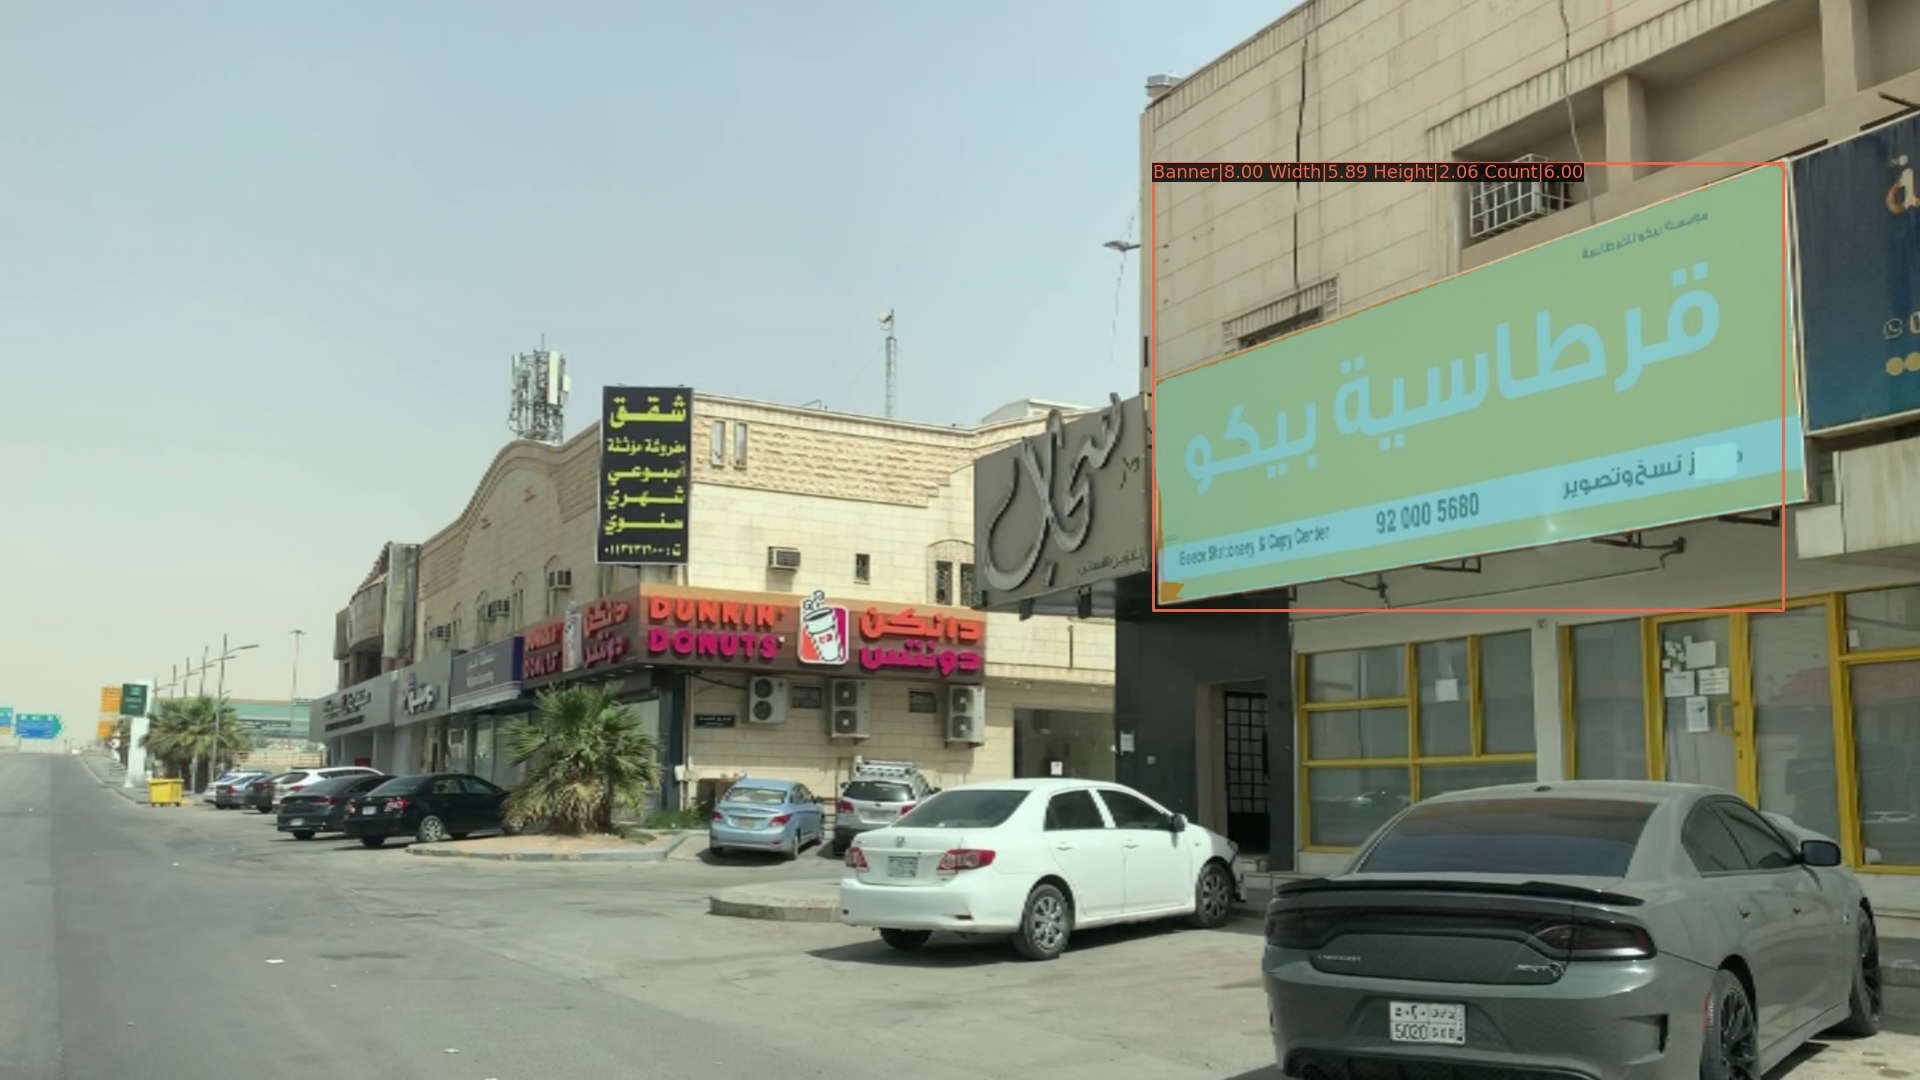
We evaluated real-world scenarios to validate the real-time performance of the model and to check how the estimation is across objects that are comparable in size. A moving car equipped with a camera goes by the street with the shop signage on the right side of the road. The camera takes in the video stream at 30 fps. As shown in figure 11, when PMODE looks at the same shop signage, the dimensions are consistent with trivial variation in the dimensions. When the car moves forward to look at the next shop signages, as depicted in the further rows, the dimensions change according to the variation in the pixel information obtained from the prototype masks of PMODE. We observed that the model is quite robust in estimating the dimensions, given that the angle and orientation of the camera are kept intact.
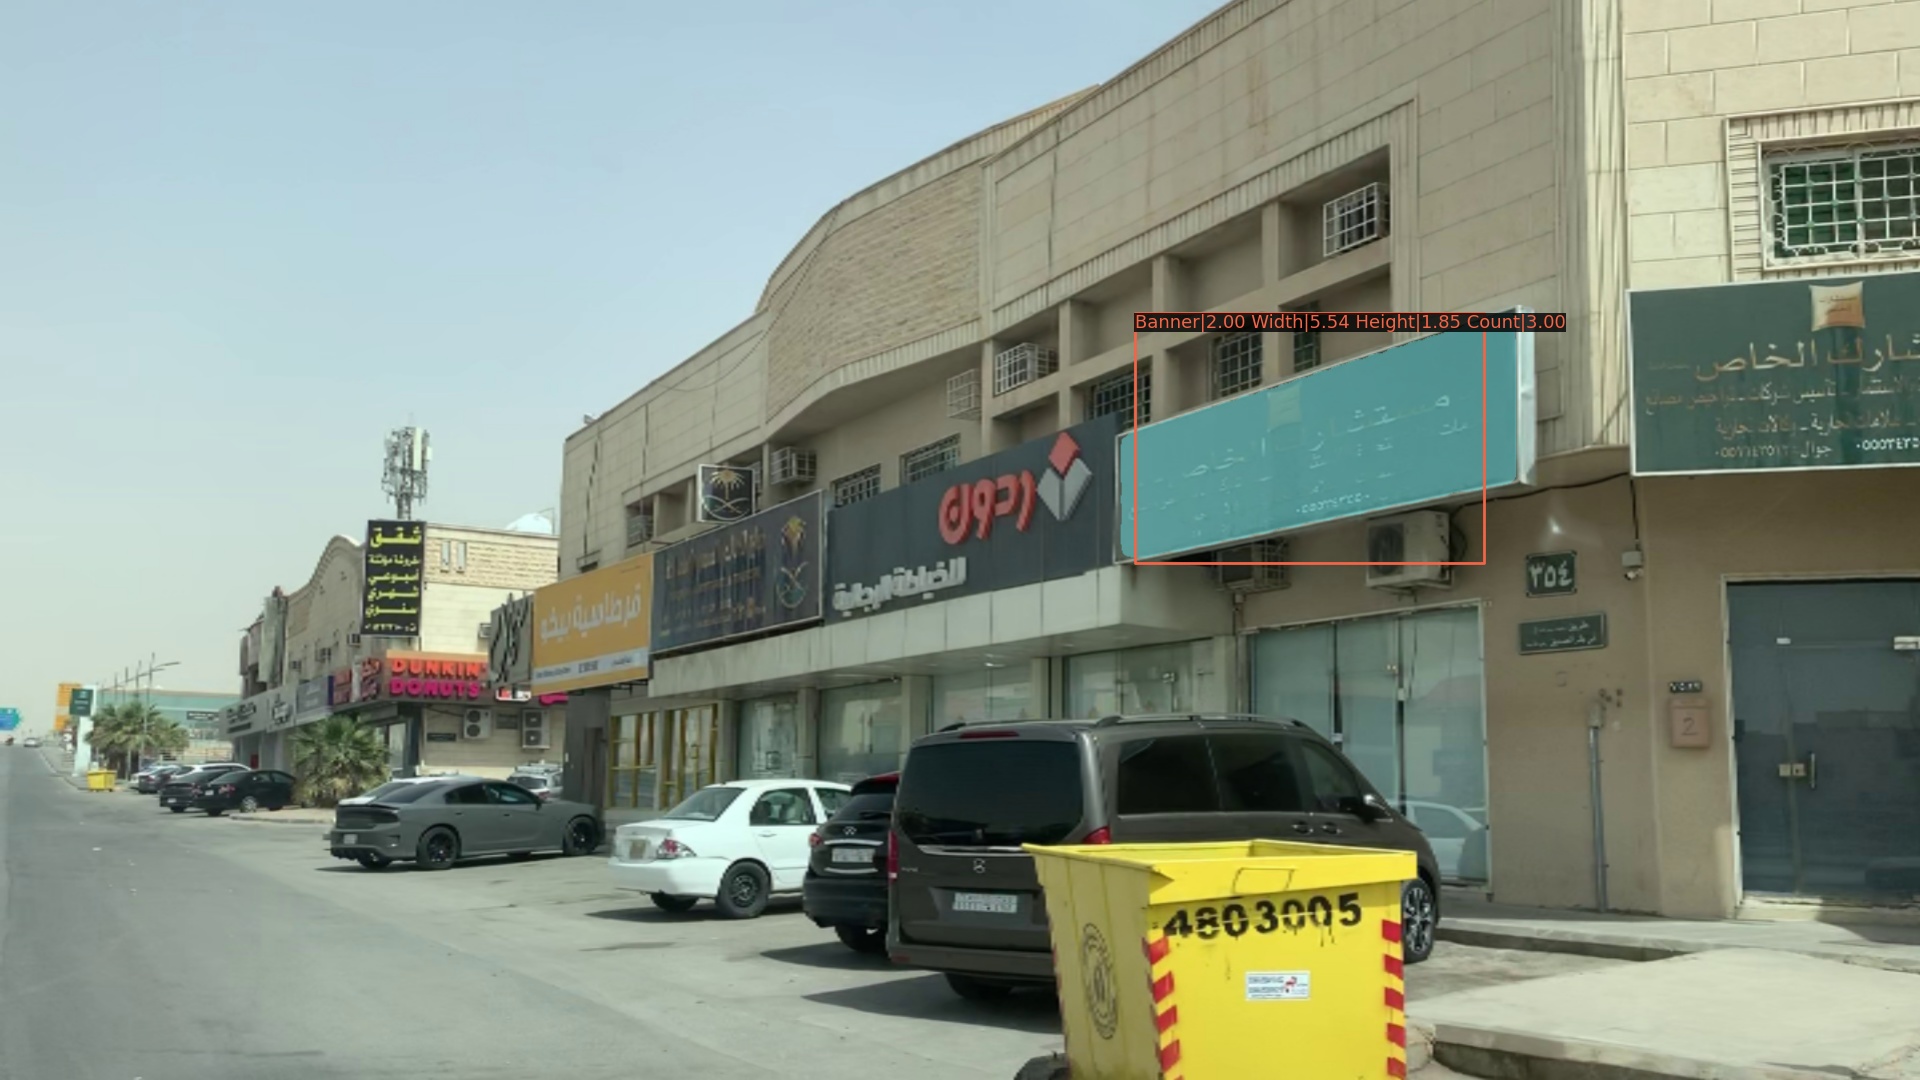
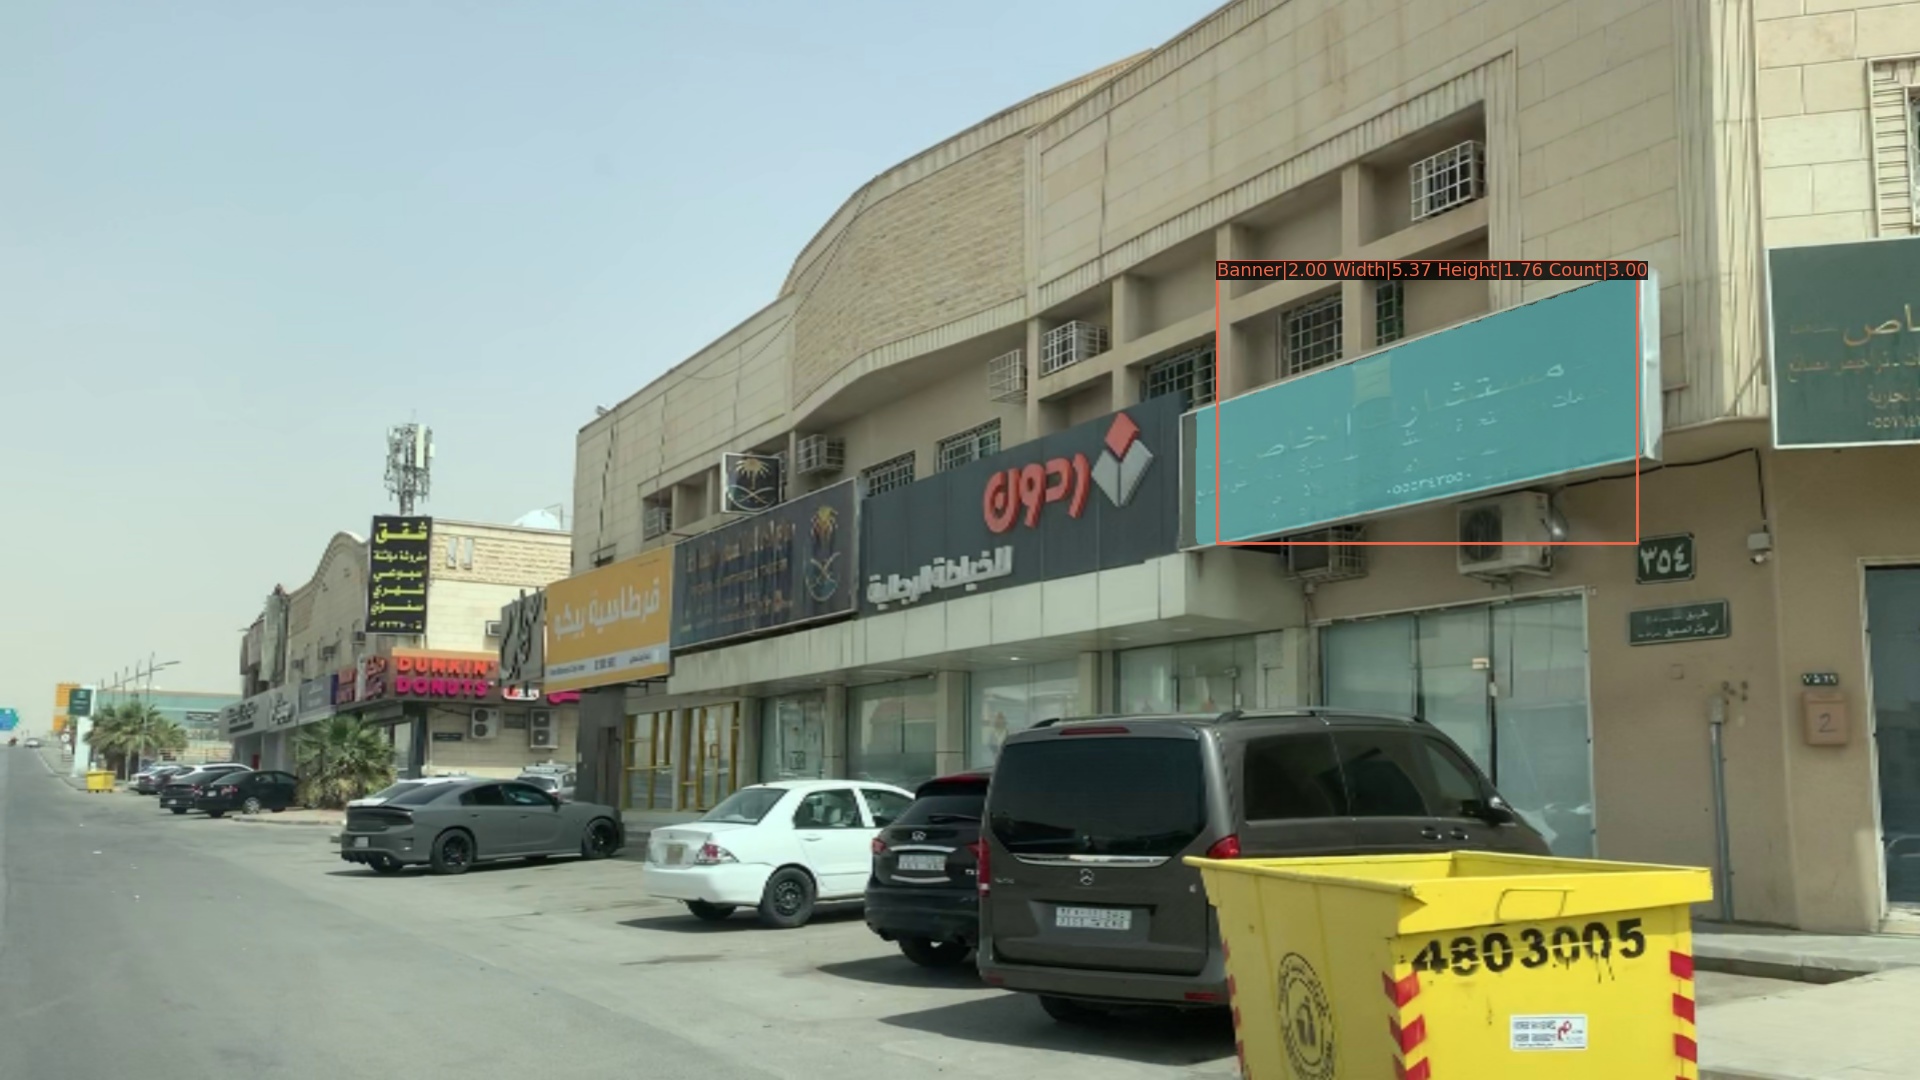
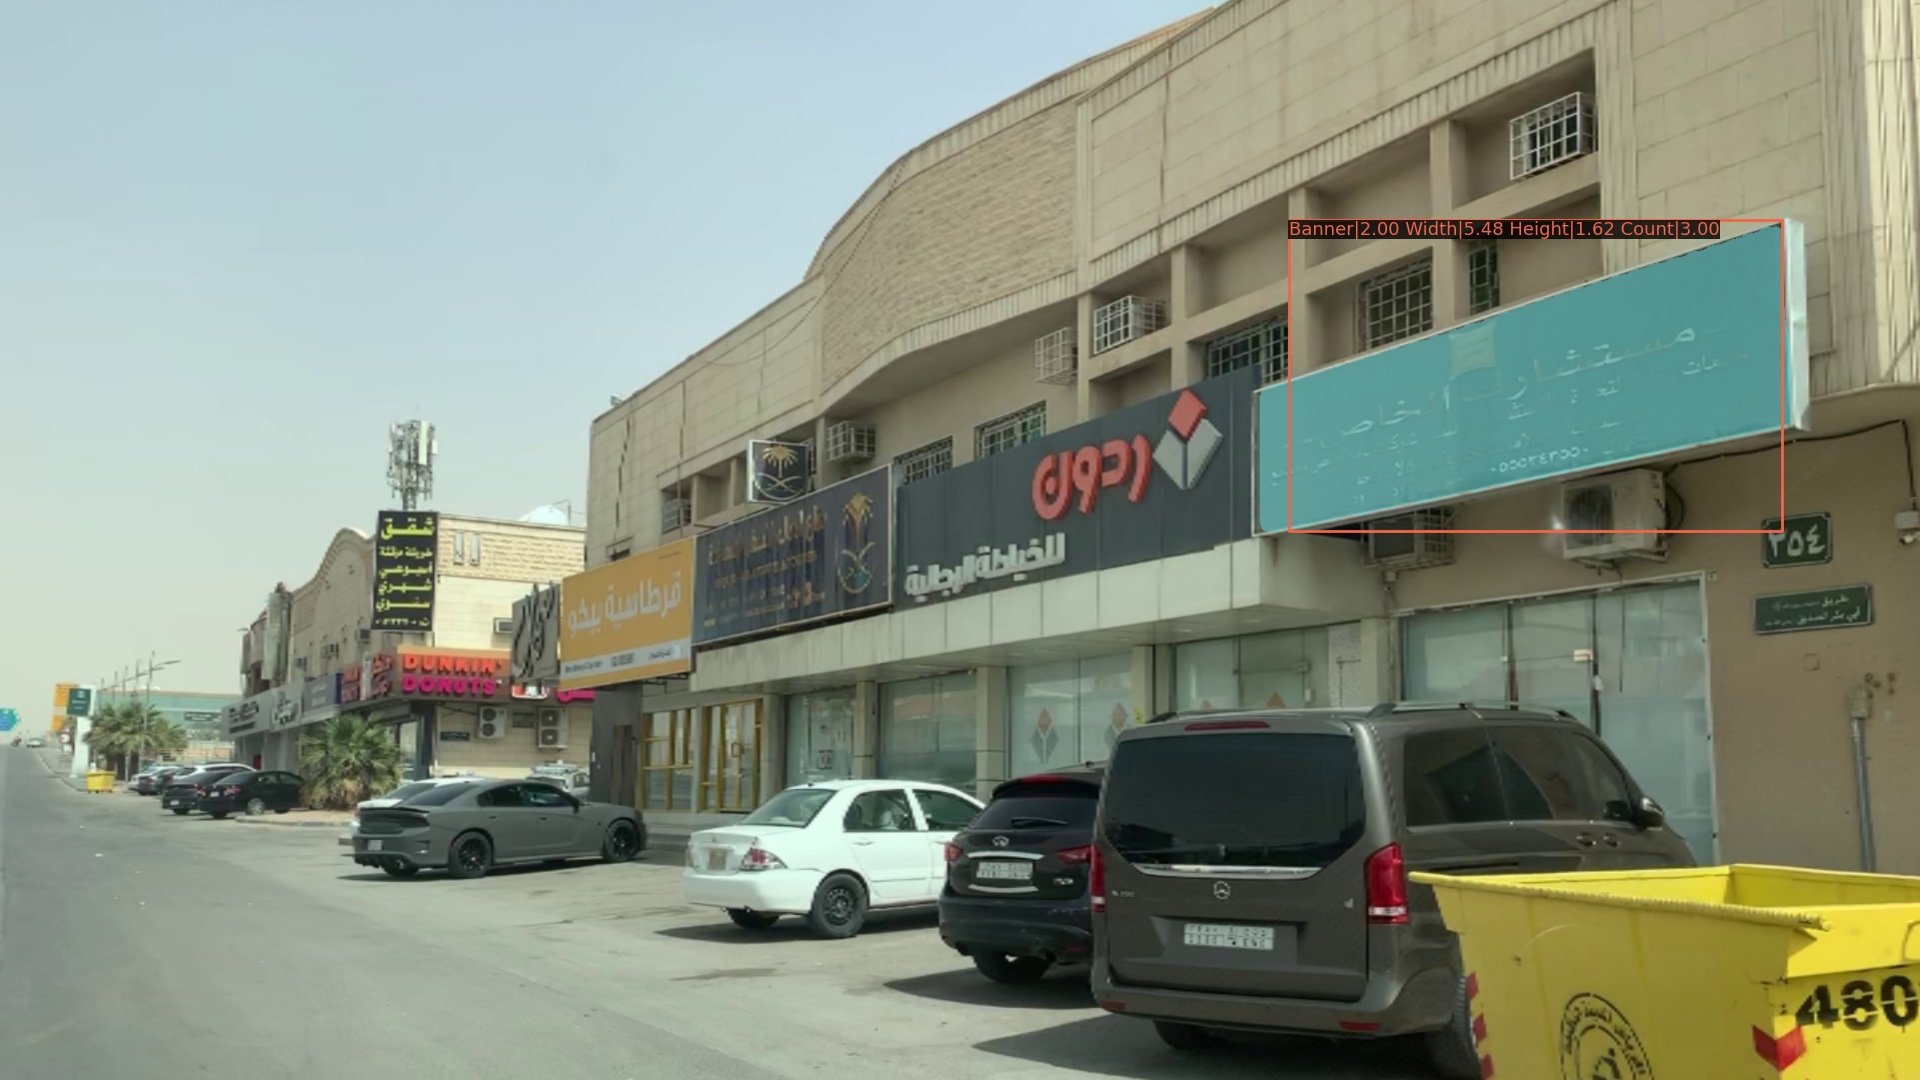
I row : Image1 Width: 5.54m Height: 1.84m Image2 Width: 5.54m Height: 1.84m Image3 Width: 5.48m Height: 1.62m
II row : Image1 Width: 6.20m Height: 2.06m Image2 Width: 6.09m Height: 2.07m Image3 Width: 5.93 Height: 2.05m
III row: Image1 Width: 5.88m Height: 2.11m Image2 Width: 6.22m Height: 2.02m Image3 Width: 6.13m Height: 1.97m
IV row: Image1 Width: 5.53m Height: 2.09m Image2 Width: 5.35m Height: 2.05m Image3 Width: 5.89m Height: 2.06m
7 Conclusion
Our work shows the application of Deep Neural Networks using the segmentation of pixels into prototype masks to measure the dimension of a common object. We estimated the 2D dimensions of a quadrilateral object based on the pixel-level segmentation objects adapted to instances. Our framework is generic to enclosed polygons. During the experiments, we noticed that the system would learn three cameras’ intrinsic and extrinsic properties. We also validated the robustness of the PMODE model with semantic consistency in videos by applying the model in real-world scenarios.
In the future, we intend to perform keypoint detection-based object dimension estimation wherein the network implicitly learns the object’s Depth without performing pixel-wise segmentation. Key points of the shop signage or an object would be the inputs to the neural network where it does not have to be concerned about the pixel details.
We would like to express our sincere thanks to Muhammad AlQurishi for the valuable review and feedback on this paper.
References
- [1] Yann LeCun, Yoshua Bengio, et al. Convolutional networks for images, speech, and time series. The handbook of brain theory and neural networks, 3361(10):1995, 1995.
- [2] Daniel Bolya, Chong Zhou, Fanyi Xiao, and Yong Jae Lee. Yolact: Real-time instance segmentation. In Proceedings of the IEEE/CVF international conference on computer vision, pages 9157–9166, 2019.
- [3] Kaiming He, Xiangyu Zhang, Shaoqing Ren, and Jian Sun. Deep residual learning for image recognition. In Proceedings of the IEEE conference on computer vision and pattern recognition, pages 770–778, 2016.
- [4] Chongsheng Zhang, Guowen Peng, Yuefeng Tao, Feifei Fu, Wei Jiang, George Almpanidis, and Ke Chen. Shopsign: A diverse scene text dataset of chinese shop signs in street views. arXiv preprint arXiv:1903.10412, 2019.
- [5] Tien Do, Thuyen Tran, Hung Le, Thua Nguyen, Thanh Duc Ngo, and Duy-Dinh Le. Signboardtext: Text detection and recognition in in-the-wild signboard images. Available at SSRN 3988103.
- [6] Chongsheng Zhang, Yuefeng Tao, Kai Du, Weiping Ding, Bin Wang, Ji Liu, and Wei Wang. Character-level street view text spotting based on deep multisegmentation network for smarter autonomous driving. IEEE Transactions on Artificial Intelligence, 3(2):297–308, 2021.
- [7] Kaiming He, Georgia Gkioxari, Piotr Dollár, and Ross Girshick. Mask r-cnn. In Proceedings of the IEEE international conference on computer vision, pages 2961–2969, 2017.
- [8] Jiale Cao, Rao Muhammad Anwer, Hisham Cholakkal, Fahad Shahbaz Khan, Yanwei Pang, and Ling Shao. Sipmask: Spatial information preservation for fast image and video instance segmentation. In European Conference on Computer Vision, pages 1–18. Springer, 2020.
- [9] Shu Liu, Lu Qi, Haifang Qin, Jianping Shi, and Jiaya Jia. Path aggregation network for instance segmentation. In Proceedings of the IEEE conference on computer vision and pattern recognition, pages 8759–8768, 2018.
- [10] Kai Chen, Jiangmiao Pang, Jiaqi Wang, Yu Xiong, Xiaoxiao Li, Shuyang Sun, Wansen Feng, Ziwei Liu, Jianping Shi, Wanli Ouyang, et al. Hybrid task cascade for instance segmentation. In Proceedings of the IEEE/CVF Conference on Computer Vision and Pattern Recognition, pages 4974–4983, 2019.
- [11] Zhaojin Huang, Lichao Huang, Yongchao Gong, Chang Huang, and Xinggang Wang. Mask scoring r-cnn. In Proceedings of the IEEE/CVF conference on computer vision and pattern recognition, pages 6409–6418, 2019.
- [12] Hao-Shu Fang, Jianhua Sun, Runzhong Wang, Minghao Gou, Yong-Lu Li, and Cewu Lu. Instaboost: Boosting instance segmentation via probability map guided copy-pasting. In Proceedings of the IEEE/CVF International Conference on Computer Vision, pages 682–691, 2019.
- [13] Stéphane Lathuilière, Pablo Mesejo, Xavier Alameda-Pineda, and Radu Horaud. A comprehensive analysis of deep regression. IEEE transactions on pattern analysis and machine intelligence, 42(9):2065–2081, 2019.
- [14] Angela Tam, Hua Shen, Jianzhuang Liu, and Xiaoou Tang. Quadrilateral signboard detection and text extraction. In CISST, pages 708–713, 2003.
- [15] Linda G Shapiro, George C Stockman, et al. Computer vision, volume 3. Prentice Hall New Jersey, 2001.
- [16] John Canny. A computational approach to edge detection. IEEE Transactions on pattern analysis and machine intelligence, (6):679–698, 1986.
- [17] Cuong Vo-Le, Pham Van Muoi, Nguyen Hong Son, Nguyen Van San, Vu Khac Duong, and Nguyen Thi Huyen. Automatic method for measuring object size using 3d camera. In 2020 IEEE Eighth International Conference on Communications and Electronics (ICCE), pages 365–369. IEEE, 2021.
- [18] Ondrej Kainz, František Jakab, Matúš W Horečnỳ, and Dávid Cymbalák. Estimating the object size from static 2d image. In 2015 International Conference and Workshop on Computing and Communication (IEMCON), pages 1–5. IEEE, 2015.
- [19] Chris Harris, Mike Stephens, et al. A combined corner and edge detector. In Alvey vision conference, volume 15, pages 10–5244. Citeseer, 1988.
- [20] Jonathan Long, Evan Shelhamer, and Trevor Darrell. Fully convolutional networks for semantic segmentation. In Proceedings of the IEEE conference on computer vision and pattern recognition, pages 3431–3440, 2015.
- [21] Kai Chen, Jiaqi Wang, Jiangmiao Pang, Yuhang Cao, Yu Xiong, Xiaoxiao Li, Shuyang Sun, Wansen Feng, Ziwei Liu, Jiarui Xu, et al. Mmdetection: Open mmlab detection toolbox and benchmark. arXiv preprint arXiv:1906.07155, 2019.
- [22] Alexander Buslaev, Vladimir I Iglovikov, Eugene Khvedchenya, Alex Parinov, Mikhail Druzhinin, and Alexandr A Kalinin. Albumentations: fast and flexible image augmentations. Information, 11(2):125, 2020.
- [23] René Ranftl, Katrin Lasinger, David Hafner, Konrad Schindler, and Vladlen Koltun. Towards robust monocular depth estimation: Mixing datasets for zero-shot cross-dataset transfer. IEEE transactions on pattern analysis and machine intelligence, 2020.
- [24] Martin Ester, Hans-Peter Kriegel, Jörg Sander, Xiaowei Xu, et al. A density-based algorithm for discovering clusters in large spatial databases with noise. In kdd, volume 96, pages 226–231, 1996.