Accretion geometry of the neutron star low mass X-ray binary Cyg X-2 from X-ray polarization measurements
Abstract
We report spectro-polarimetric results of an observational campaign of the bright neutron star low-mass X-ray binary Cyg X-2 simultaneously observed by IXPE, NICER and INTEGRAL. Consistently with previous results, the broad-band spectrum is characterized by a lower-energy component, attributed to the accretion disc with 1 keV, plus unsaturated Comptonization in thermal plasma with temperature keV and optical depth , assuming a slab geometry. We measure the polarization degree in the 2–8 keV band per cent and polarization angle , consistent with the previous X-ray polarimetric measurements by OSO-8 as well as with the direction of the radio jet which was earlier observed from the source. While polarization of the disc spectral component is poorly constrained with the IXPE data, the Comptonized emission has a polarization degree per cent and a polarization angle aligned with the radio jet. Our results strongly favour a spreading layer at the neutron star surface as the main source of the polarization signal. However, we cannot exclude a significant contribution from reflection off the accretion disc, as indicated by the presence of the iron fluorescence line.
keywords:
accretion, accretion discs – polarization – stars: neutron – techniques: polarimetric – X-ray: binaries – X-rays: individual: Cyg X-21 Introduction
The physics of X-ray binaries systems (XRBs) hosting either a neutron star (NS) or a black hole (BH), has been a long-time matter of study by theoreticians and observers. Both spectral and temporal features have been investigated across decades with different space observatories, but some questions remain still unanswered. One of the most debated topics concerns the shape and location of the region which is responsible for the strong Comptonization feature observed in the X-ray spectra of these sources and dominating the spectral emission at high energies (for a review, see Done et al., 2007). Often this component has been attributed to a so-called “Compton corona” (e.g., Haardt & Maraschi, 1993; Poutanen & Svensson, 1996; Titarchuk & Fiorito, 2004; Bałucińska-Church et al., 2010). Several models and configurations have been proposed across years, but the issue has not yet been solved unambiguously.
Is the corona located above the accretion disc or is it the region between the truncated cold accretion disc and the compact object (hot flow) (Poutanen et al., 2018)? How the geometry of the emitting region is affected by the presence of an event horizon or a solid surface ? How do its properties change with the mass accretion rate? In this context, X-ray polarimetry has long been considered the key new window of X-ray astronomy, and with the launch of the Imaging X-ray Polarimetry Explorer (IXPE, Weisskopf et al., 2022), there are now great expectations on the possibility to disentangle among degenerate parameters which can equally well describe spectral and temporal properties of XRBs.
Among the NS low-mass XRBs (LMXBs), Cyg X-2 has long been studied because of its high X-ray flux erg cm-2 s-1. It is classified as a Z-source from the shape of the tracks in the colour–colour and hardness-intensity diagram on the time-scales ranging from hours to days (Hasinger & van der Klis, 1989). From the spectral point of view, Z-sources are characterised by parameters which remain relatively stable during the motion along the Z pattern (Di Salvo et al., 2000; Lavagetto et al., 2004; Di Salvo et al., 2001; Di Salvo et al., 2002; Farinelli et al., 2009; Bałucińska-Church et al., 2010). The most noticeable transient feature is instead a hard X-ray excess above 30 keV which occurs when the source is in the Horizonthal Branch (HB) and appears to be correlated to the episodic radio emission indicating the presence of a jet (D’Amico et al., 2001; Paizis et al., 2006; Farinelli et al., 2009). Joint observations of Cyg X-2 with Swift/XRT and the VLBI at 5 GHz have shown the presence of a sub-relativistic jet when the source was in the HB (Spencer et al., 2013). In particular, the radio observations of 2013 February 22 and 23 revealed a single core at 0.59 mJy the first day, while in the second day the core emission had weakened in favour of a bright head in the south-east direction, 141° east of north. Using broad-band BeppoSAX data (0.1–200 keV), Di Salvo et al. (2002) described the spectrum of Cyg X-2 in terms of a soft multi-colour disc component plus unsaturated thermal Comptonization in a plasma with low temperature ( keV) and moderately high Thomson optical depth (, depending on the geometry). This spectral modelling falls in the so-called ‘eastern-model’ scenario, where the soft component is attributed to the accretion disc, while Comptonization originates in a hot boundary or spreading layer (BL/SL) close to the NS. By the BL we mean part of the accretion disc where the gas decelerates (e.g., Popham & Sunyaev, 2001), while by the SL we mean the gas layer at the NS surface, which can extend to high latitudes (Inogamov & Sunyaev, 1999; Suleimanov & Poutanen, 2006).
The eastern-model framework has gained stronger support from the analysis of a sample of atoll- and Z-sources using Fourier-frequency resolved spectroscopy of the archival RXTE data (Gilfanov et al., 2003; Revnivtsev & Gilfanov, 2006; Revnivtsev et al., 2013), and it was shown that the SL spectrum resembles the Fourier-frequency resolved spectrum at frequencies of quasi-periodic oscillations.
Recently, Ludlam et al. (2022, hereafter L22) performed a spectral analysis of NICER and NuSTAR data at different positions of the source in its Z-track. Using, among others, a reflection model for reprocessed radiation in the accretion disc, they inferred the inner disc radius close to the innermost stable circular orbit and rather stable when the source moves in the hardness-intensity diagram. The model also provided an orbital inclination 60°–70°, consistent with the optical results (Orosz & Kuulkers, 1999).
Optical polarimetric observations of Cyg X-2 were performed in the , and bands by Koch Miramond & Naylor (1995), who found statistically significant linear polarization. Comparing the position in the Stokes plane with that of nearby stars, the authors concluded that part of the observed polarization is intrinsic to the source, with a polarization degree (PD) of 0.290.07 per cent and a polarization angle (PA) of . This is off from the jet direction, which is not surprising because of the uncertainty in the measurements of the interstellar polarization. Previous X-ray polarimetric observations of Cyg X-2 in 1975 with OSO-8 gave a marginal detection of PD= per cent at PA, while the later observations in 1976–1977 gave null result (Weisskopf et al., 1976; Long et al., 1980). Interestingly, the PA coincides with the position angle of the radio jet.
If polarization is produced in the accretion disc dominated by electron scattering, the linear PD drops from 11.7 per cent for edge-on systems () to zero for a face-on observer at (Chandrasekhar & Breen, 1947; Sobolev, 1949; Chandrasekhar, 1960; Sobolev, 1963) with the dominant direction of the electric field oscillations along the disc plane (i.e. perpendicular to the disc rotation axis). Because at higher orbital inclination the object is expected to have a higher polarization in systems like LMXBs, Cyg X-2, with a likely inclination angle of , is a good of candidate to be observed by IXPE. On the other hand, previous OSO-8 results contradict this simple interpretation, because the polarization was aligned with the jet, which is likely perpendicular to the disc. Thus it is important to determine the X-ray PD and PA and their energy dependence with a higher precision, which is now possible with IXPE.
2 Observations and data reduction
2.1 IXPE
Observations with IXPE have been carried out from 2022 April 30 11:27 to 2022 May 02 11:05 UT for about 75.5 ks of net exposure time. Data reduction and analysis were performed by using the ixpeobssim 111https://ixpeobssim.readthedocs.io/en/latest/?badge=latest software v26.3.2 (Baldini et al., 2022) and heasoft tools v6.30.1.222https://heasarc.gsfc.nasa.gov/docs/software/heasoft/ The ixpeobssim tools include xppicorr to locally apply the energy calibration with in-flight calibration sources (which at the time of writing was not included in the pipeline producing publicly available data), xpselect to filter data and xpbin to apply different binning algorithms for generating images and spectra. Rebinning and spectro-polarimetric analysis was performed by means of heasoft ftools including xspec.333xspec was used by means of the pyxspec interface. See the documentation at https://heasarc.gsfc.nasa.gov/xanadu/xspec/python/html/index.html Source and background regions where selected from the image of each of the three detector units (DU), with the source centred in a circular region of 60″ in radius. The background is extracted from an annular region with the inner and outer radii of 180″ and 240″, respectively. The background counts are negligible with respect to the source (about per cent). The data analysis was performed following the unweighted method.444In the unweighted analysis method, equal weights are assigned to each photo-electron track, regardless of its shape.
The normalized Stokes parameters and , corresponding PD and PA, as well as their uncertainties are calculated using the pcube binning algorithm of ixpeobssim, which assumes that they are uncorrelated and that PD and PA are independent (Kislat et al., 2015). We also compared the results of the polarimetric analysis obtained with both xspec and pcube. While xspec requires the definition of a spectro-polarimetric model, pcube is a model-independent tool that computes the polarization parameters only on the basis of the properties of the detected photons and instrument response matrices.
| Instrument/Satellite | ||
|---|---|---|
| NICER (Obs. 1) | 2022–04–30 02:07:20 | 2022–04–30 23:58:40 |
| NICER (Obs. 2) | 2022–05–01 01:13:29 | 2022–05–01 23:08:00 |
| IXPE | 2022–04–30 11:27:00 | 2022–05–02 11:05:00 |
| INTEGRAL | 2022–04–30 21:44:31 | 2022–05–01 12:03:00 |
The uncertainties from the xspec analysis are computed with the error command of xspec for one parameter of interest. It is worth noting that because the PD and PA are actually not independent, then a more appropriate way to report results is by means of contours representing, e.g., , and per cent confidence levels of the joint measurement of the two parameters. The contour plot with pcube are derived following Weisskopf et al. (2010), Strohmayer & Kallman (2013), and Muleri (2022) by using the parameters obtained by the algorithm itself. In xspec on the other hand, this can be achieved by using the steppar command by specifying the two parameters of interest (in this case, PD and PA).
2.2 INTEGRAL and NICER
We extract data of the public INTEGRAL (Winkler et al., 2003) target-of-opportunity observation carried out from 2022 April 30 21:44 to 2022 May 01 12:03 UT using the latest available calibration and software (Offline Scientific Analysis v11.2) from the multi-messenger online analysis platform.555https://www.astro.unige.ch/mmoda/ The INTEGRAL spacecraft has on board four co-aligned instruments: we used data from the ISGRI coded-mask imager (Lebrun et al., 2003), which is sensitive above 25 keV in this late phase of the mission, and JEM-X (Lund et al., 2003), consisting of two identical detectors sensitive in the 3–30 keV band. We first extract images for ISGRI and JEM-X1 which are obtained as a mosaic from different dither pointing of the satellite. This intermediate step is necessary to select the sources present in the field of view of each instrument in addition to Cyg X-2, and which contribute as ‘background’ for the extraction of the spectra and light curves: for ISGRI they are Cyg X-3, EXO 2030+375, and SS Cyg while for JEM-X it is only SS Cyg, because of its smaller field of view. It is worth noting that Cyg X-2 is detected in the ISGRI image with poor statistical significance, on the contrary to what happen in the JEM-X1 mosaic image.
We then extracted the JEM-X spectra from the two units in sixteen standard energy bins and added a 5 per cent systematic uncertainty to them. The ISGRI spectrum is extracted at the natural resolution of 256 bins and then grouped in 20 equally spaced logarithmic bins from 25 to 200 keV; an additional 1.5 per cent systematic error is added in quadrature.666https://gitlab.astro.unige.ch/reproducible_INTEGRAL_analyses/cygx-2.git.
Two observations of the source were performed also by NICER (Gendreau et al., 2016) on 2022 April 30 (ObsID 5034150102) and 2022 May 1 (ObsID 5034150103), with a total exposure of 8.1 ks. We reduced the NICER data using heasoft v6.30 and the nicerl2 task and applying standard calibration and screenings, with caldb v20210707. The presence of sharp changes in the instrument effective area due to gold edges on the mirror coating, which may be seen in residuals, is a known issue of the instrument, and would suggest to perform spectral analysis starting from about 2.5 keV (Miller et al., 2018). In order to achieve a trade-off between spectral coverage and instrumental uncertainties, we set the lower threshold for NICER at 1.5 keV.
3 Results
3.1 Temporal properties
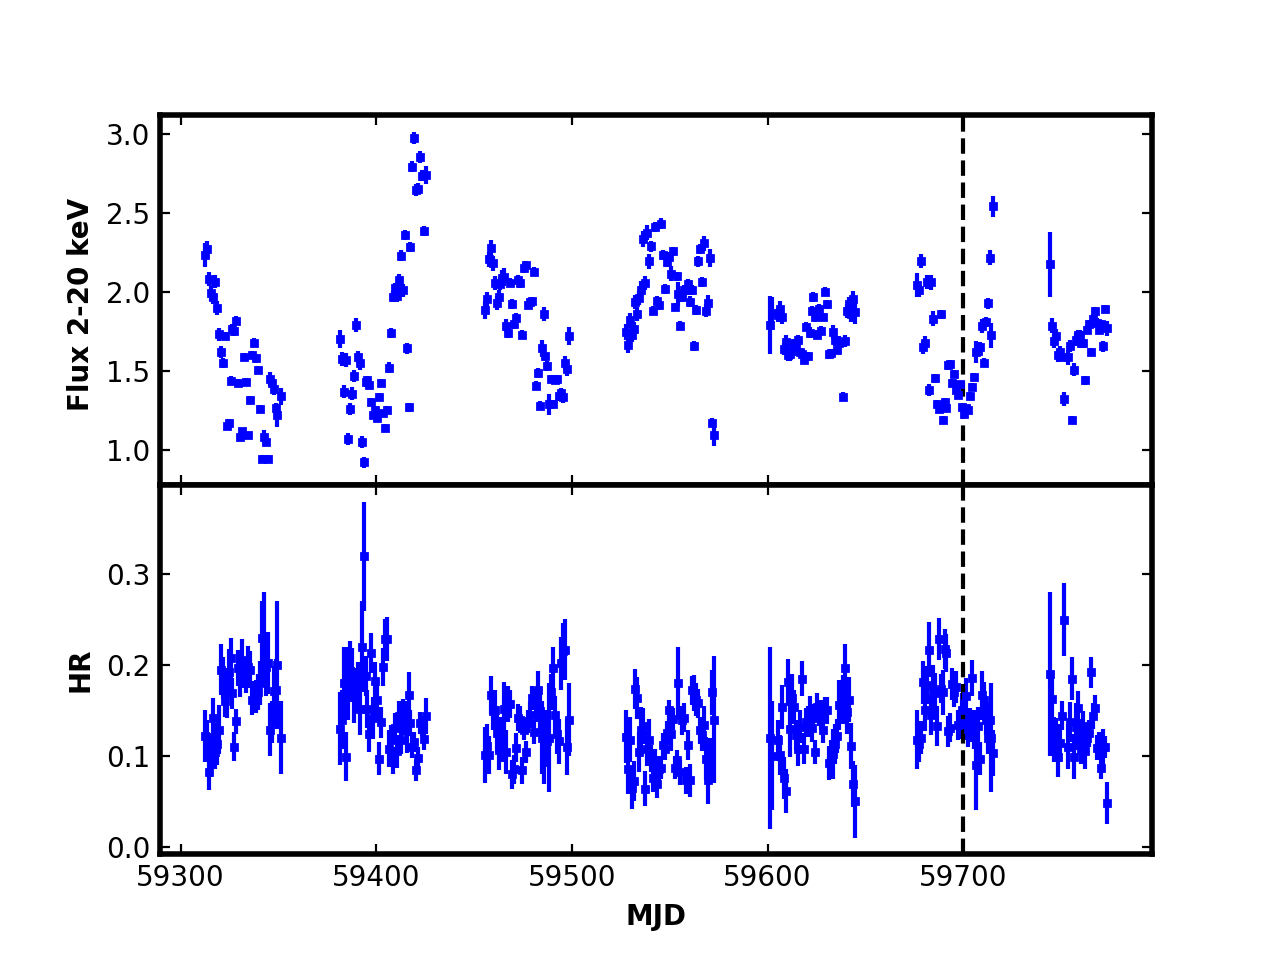
In Fig. 1 we show the 2–20 keV photon flux and the hardness ratio (HR) of Cyg X-2 using data from the public MAXI (Matsuoka et al., 2009) archive.777http://maxi.riken.jp/top/lc.html In particular, we consider the time starting one year before the observations of NICER, IXPE and INTEGRAL (MJD=59699–59700). The source flux varied by about a factor of three over months and at the time of the observations it was close to its minimum. The HR variations instead were less pronounced, remaining within a factor two. This is consistent with the fact that spectral changes in Z-sources remain fairly moderate even when they cross the full Z-pattern (e.g., Di Salvo et al., 2000; D’Amico et al., 2001).
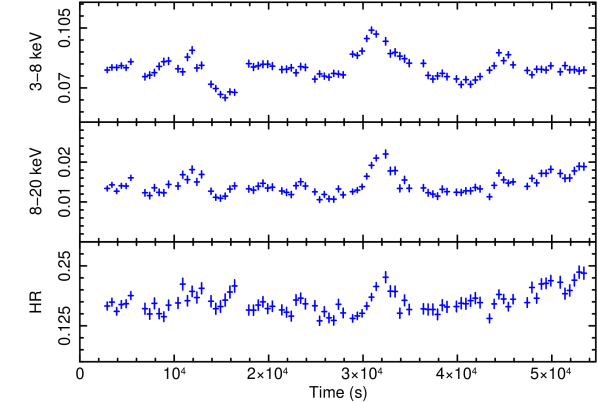
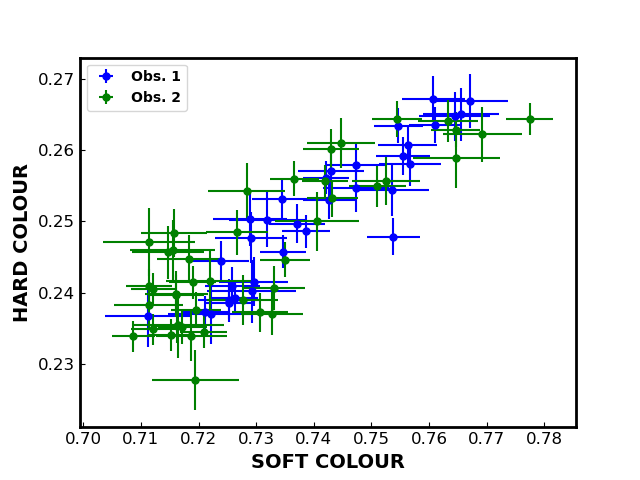
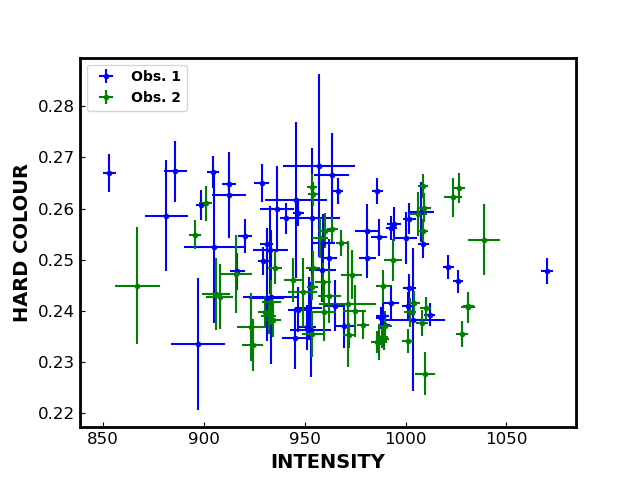
The time variability on a shorter time-scale was first investigated using JEM-X1, which allows to cover the energy range up to about 20 keV. We selected two energy bands (3–8 keV and 8–20 keV) plotting the count rate behaviour as well as their HR over time. As shown in Fig. 2, both soft and hard band demonstrate a qualitatively similar pattern, albeit the peak in the hard band is relatively higher, being reflected in the HR. Motivated by the overlapping between the energy range of JEM-X with that selected by L22 to produce hardness intensity diagrams (HIDs) of previous NuSTAR observations of Cyg X-2, we also tried to make a corresponding HID, but because of the statistics we did not observe a clear evolution along the Z-like pattern – just something which is reminiscent of an Upper Normal Branch. As a next step, we produced both a colour-colour diagram (CCD) and HID from the two NICER observations (see Fig. 3). The source pattern in the CCD reminds a Normal Branch (NB), albeit it cannot be excluded that its upper right portion does represent part of the Horizontal Branch (HB). Similarly, the CCD of the Cyg X-2 from observations performed in 1996 and 1997 with BeppoSAX appeared to be an extended NB, while the first data set revealed its HB nature when plotted on a HID (Farinelli et al., 2009). Unlike the work mentioned above, the intensity variations in the NICER data were less pronounced, showing no definite pattern in the HID. Qualitatively similar CCD and HID have been obtained in the same energy bands with IXPE, but with larger errors owing to a smaller effective area of the instrument. Having neither simultaneous radio observations nor information about the presence of a high-energy X–ray tail, which are characteristic features of the HB, we shall cautiously consider the source as having traced the NB.
3.2 Spectral analysis
When considering all instruments which performed the pointing on Cyg X-2 (see Table 1), the source has been monitored for a bit less than 2.5 d. This duration is nearly as long as the 1997 BeppoSAX observation, during which only the NB was traced out. The INTEGRAL observation ( ks) has been performed nearly between the two NICER pointings and fully within the IXPE exposure, which lasted for about one day after the end of the INTEGRAL exposure. If on one side, the time-resolved spectropolarimetry would be highly desirable to provide unique information about, e.g., the orbital phase dependence, from the other it is necessary to achieve a trade-off between source evolution and statistics. In this context, having observed no dramatic source variations and, in particular, no flaring phase, we extracted a single average spectrum of the source for the whole observation from JEM-X, ISGRI and NICER.
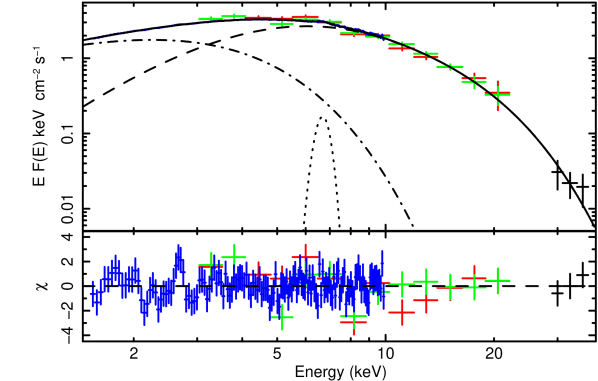
We fitted the spectrum with a two-component model consisting of the multi-colour disc blackbody (diskbb, Mitsuda et al., 1984) for the low-energy part and a Comptonization model comptt (Titarchuk, 1994) for higher energies. For comptt we select the flag which reports the value of the optical depth for the slab geometry. The gap in the data between 20 and 30 keV together with the low energy resolution of JEM-X, however, does not allow us to constrain simultaneously the electron temperature and optical depth, so we fixed keV, consistently with previous results (Farinelli et al., 2008). The case of spherical geometry provides statistically equivalent results with .
It is worth mentioning that unlike L22, who performed spectral analysis starting from 0.5 keV, we model the interstellar absorption with the simple tbabs model in xspec. The residuals between the data and the model of the NICER spectrum in the range 2–3 keV show some narrow features, resembling an absorption edge at 2 keV and an emission line around 2.7 keV. However, they are marginal and do not affect significantly the goodness of (see Fig. 4). Indeed, we also tried a fit leaving free the relative abundances of oxygen and iron (tbfeo model in xspec), but despite providing smaller residuals, no real improvement was observed in the and the two additional parameters remained largely unconstrained.
On the other hand, the NICER data shows clear evidence of the emission iron line at keV, which was detected in BeppoSAX and NuSTAR observations (see references in Sect. 1), and that we modelled by adding to the continuum the gaussian component.
The best-fitting parameters are presented in Table 2, while the model residuals and the deconvolved spectrum are shown in Fig. 4. The parameters of the Comptonized component are typical of the soft state of LMXBs, while the uncertainty in the value of the inner disc radius derived from comptt, assuming an inclination angle of , is a factor of two, because the diskbb model assumes the radial emissivity profile , valid only in the outer part of accretion disc (Shakura & Sunyaev, 1973; Page & Thorne, 1974).
We used IXPE data only for the polarimetric studies, and did not include the spectra in the joint analysis with NICER and INTEGRAL. The reason resides in a not yet proper correction of the telescope vignetting in the response matrix, leading in turn to a slightly different slope in the spectra of each DU. This effect was still present at the time of the (off-axis) pointing of Cyg X-2, and becomes noticeable for a source with its brightness ( mCrab in the 2–8 keV energy band).
Nevertheless, skipping IXPE for the spectral fit has no impact on the results because its energy band is fully covered by NICER (see Fig. 4). On the other hand, as the Stokes parameters and are normalized quantities of photon counts, their derivation (as well as PD and PA) is not affected by different changes of efficiency over energy for the single DUs and the results can be safely summed.
| Parameter | Value |
|---|---|
| 0.12 | |
| (keV) | 0.95 |
| (km) a | 18 |
| (keV) | 1.23 |
| (keV) | [3] |
| b | 4.0 |
| 0.40 | |
| (keV) | 6.67 |
| (keV) | 0.29 |
| 2.78 | |
| (eV) | 40 |
| /dof | 159/155 |
| c | 0.44 |
| d | 0.47 |
| e |
-
•
a Assuming a distance of 7 kpc and an inclination angle of .
-
•
b Obtained with slab geometry flag in comptt.
-
•
c Percentage of disk photon flux in the energy range 2–8 keV.
-
•
d Percentage of disk energy flux in the energy range 0.1–50 keV.
-
•
e Model flux (ergs cm-2 s-1) in the energy range 0.1–50 keV.
3.3 Polarimetric analysis
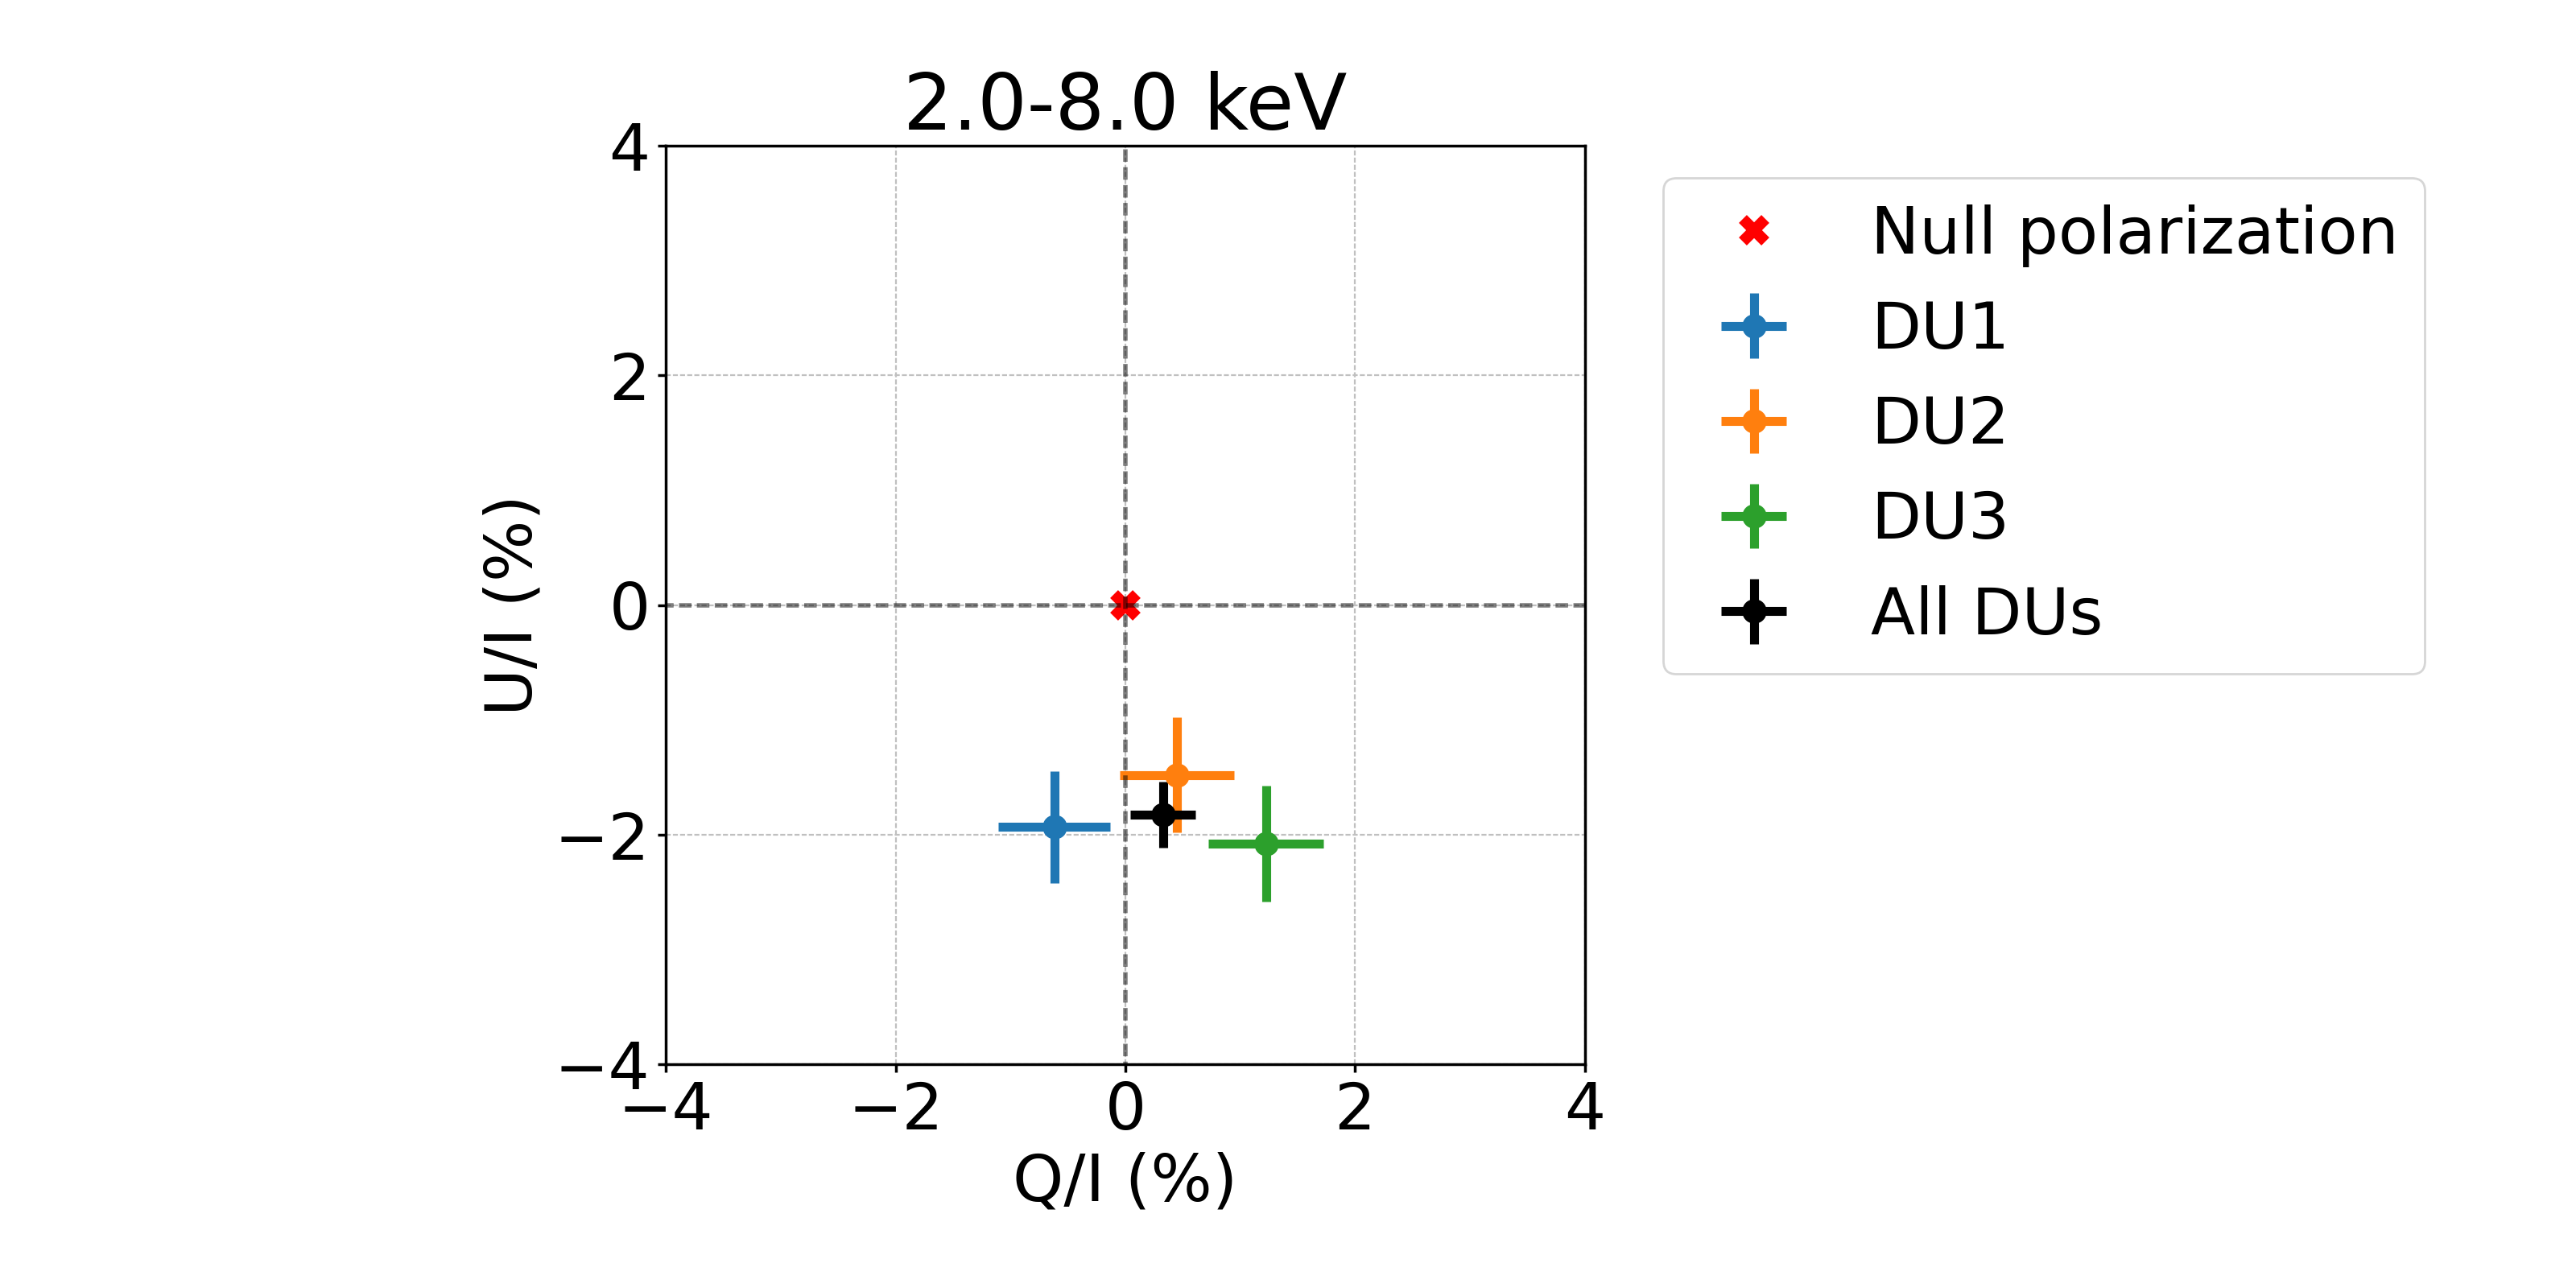
We have followed two different approaches for the analysis of the polarimetric properties of Cyg X-2. The first one is based on a model-independent analysis performed with the tool pcube, with Stokes parameters for each DU and total counts in different energy bands reported in Table 3. The same results are also reported graphically in the top panel of Fig. 5. The Stokes parameters from events detected by each DUs reveal the presence of significant polarization at in the signal when data from all three DUs are taken into account.
| DU1 | DU2 | DU3 | All DUs | |
| 2–8 keV | ||||
| () | ||||
| () | ||||
| 2–4 keV | ||||
| () | ||||
| () | ||||
| 4–8 keV | ||||
| () | ||||
| () | ||||
The second method is model-dependent and is based on fitting the Stokes parameter (, , ) data with the xspec. We considered the model polconst *tbabs *(diskbb +comptt +gaussian) used for the broad-band spectral analysis with addition of the polconst components which carries the additional polarimetric information. This model assumes that the whole spectrum has a constant (i.e., energy-independent) PD and PA. In principle both polconst and the spectral parameters should be left free, but data statistics and especially the IXPE limited energy band do not allow to tightly constrain all the parameters simultaneously.
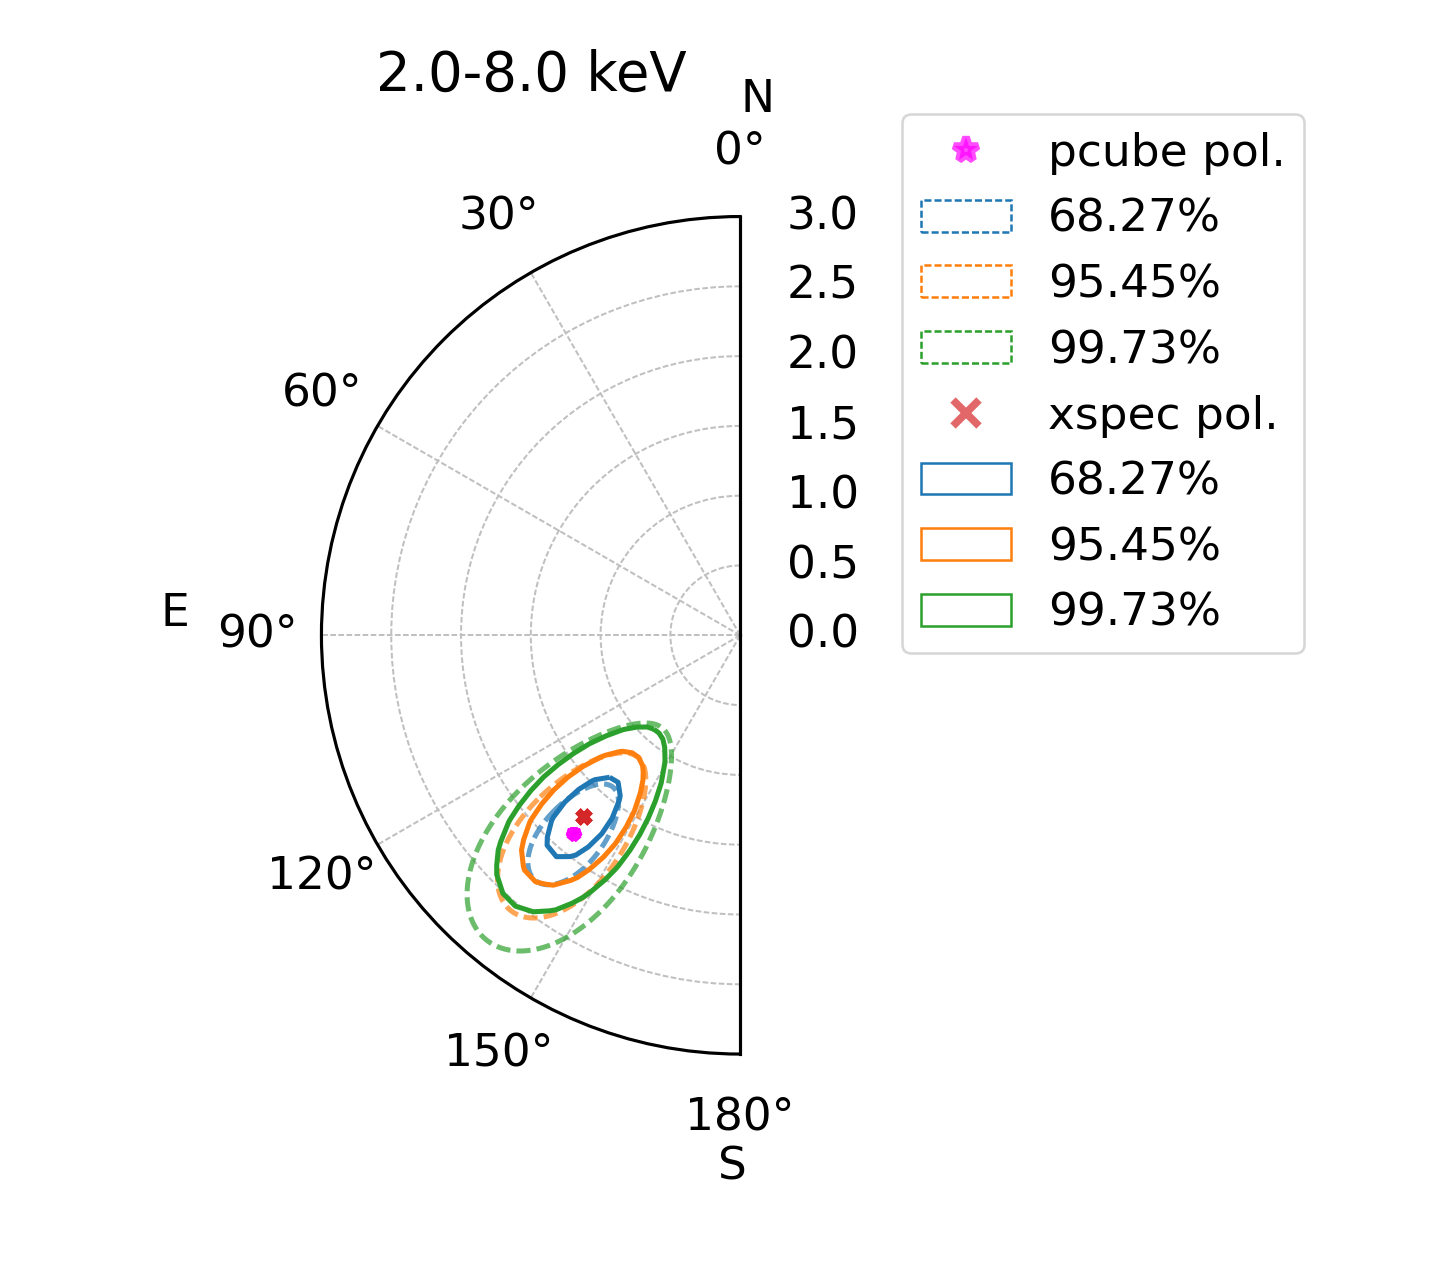
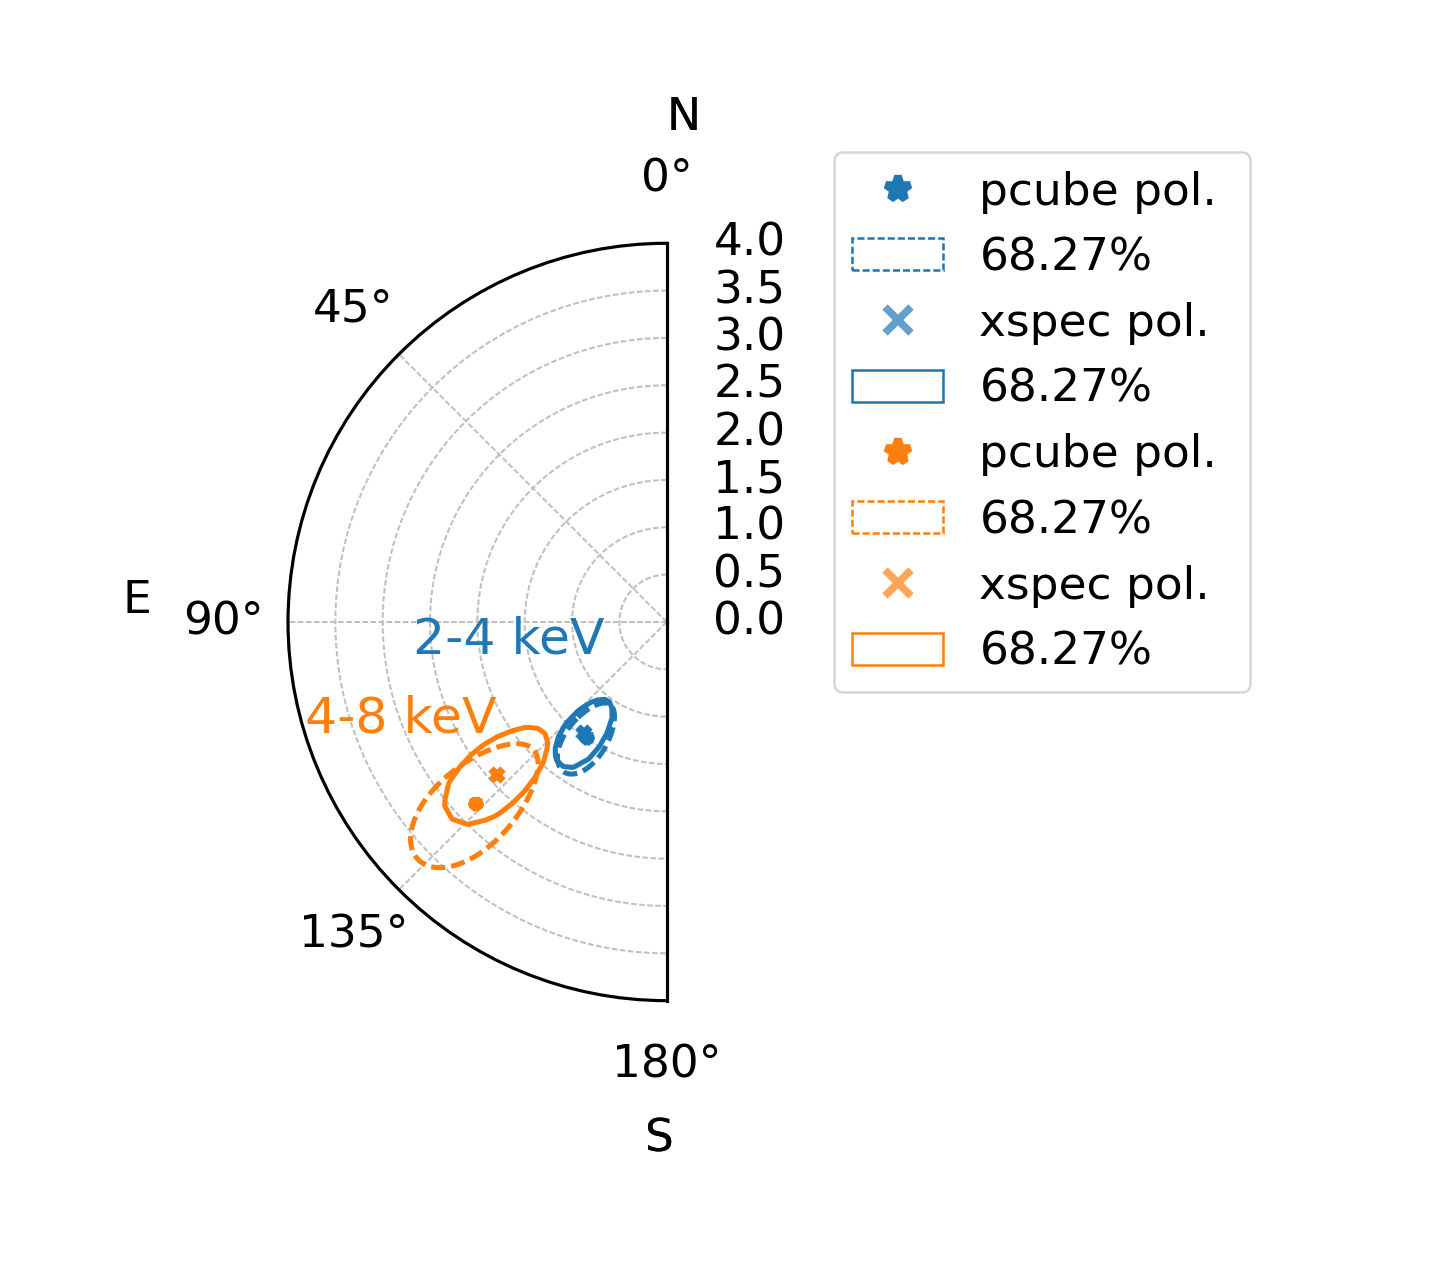
We thus have frozen all spectral parameters to the values obtained from the spectral fitting of the NICER + INTEGRAL data (see Table 2) leaving only polconst free. The final results are given in Table 4 in which the procedure described above is applied in the 2–8 keV, 2–4 keV and 4–8 keV energy bands together with pcube results for a most direct comparison. The same results are also graphically shown in Fig. 6, and it is encouraging to observe the good agreement between the two methods, which strengthens the robustness of the measurements.
As expected, there is not a perfect overlap of the contour plots because of the methodological different approach. One caveat, for instance, may come from a simplified assumption of the energy-independent polarization in the xspec model. Whether this is true or not cannot be statistically inferred from the model-independent analysis with ixpeobssim, as can be seen from the associated errors in Table 4. Moreover, we outline again that the fit of the IXPE spectra has been performed while keeping the continuum parameters frozen to the values obtained with NICER and INTEGRAL. The vignetting issue of the telescope might provide some slight (albeit not critical) differences in the derived spectral parameters which would be obtained from the IXPE spectrum alone, in turn leading to a non-exact overlapping of the contour plots.
| pcube | xspec | |
| 2–8 keV | ||
| PD () | 1.850.87 | 1.720.71 |
| PA (deg) | 14012 | 13912 |
| 2–4 keV | ||
| PD () | 1.490.84 | 1.46 |
| PA (deg) | 14415 | 14318 |
| 4–8 keV | ||
| PD () | 2.791.68 | 2.411.30 |
| PA (deg) | 13418 | 13217 |
As a further step, we exploited the capability of xspec to disentangle the relative contribution to the polarization signal from the two spectral components (soft and hard) which are observed in the X-ray spectrum. We considered the simplest case of a model with energy-independent PD and PA (polconst), which lead a model in the form tbabs *(polconst *diskbb +polconst *comptt + gaussian) in xspec terminology. Again, we fixed the parameters of the spectral model to the best-fitting values reported in Table 2.
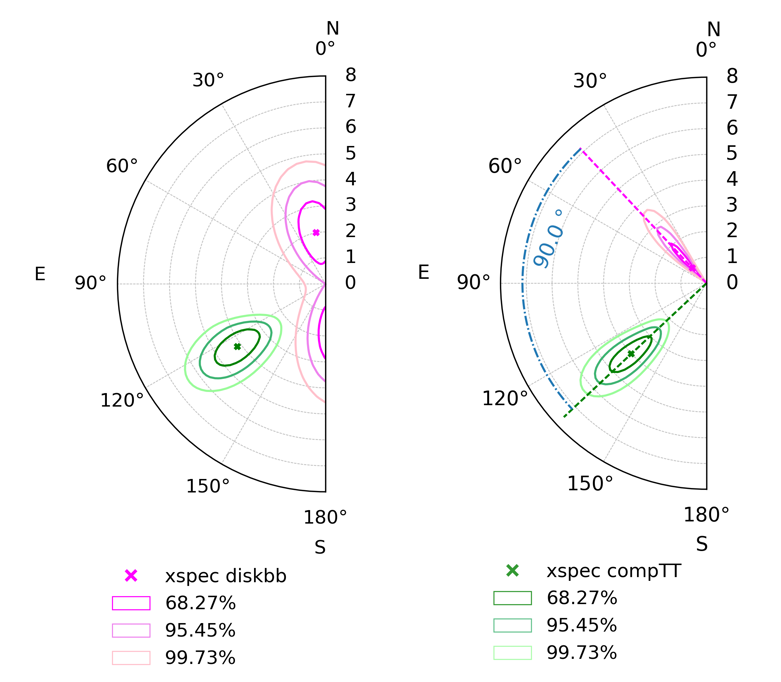
The contour plots are shown in Fig. 7 (left panel), while the polarimetric parameters are reported in Table 5. We find that the PD and PA of the comptt component are well constrained, while the polarization of the diskbb component is consistent with zero within the per cent confidence level. However, there is a hint that the PA of diskbb is nearly perpendicular to that of the comptt, which is expected theoretically (see Sect. 4). We thus allowed to vary only the PA of the comptt component, with the PA of diskbb being linked by a relation . The results with this specific setup are reported in Fig. 7 (right panel) and again in Table 5, where we note that uncertainties in comptt PD do not vary significantly, while the upper limit on diskbb PD decreases from about 4.4 to 3.3 per cent.
| PD () | PA (deg) | ||
|---|---|---|---|
| Free | diskbb | unconstrained | |
| and | comptt | ||
| diskbb | |||
| comptt |
4 Discussion
In this work, we report the significant detection by IXPE of X-ray polarization from a weakly magnetized NS LMXB Cyg X-2. After decades of discussions about the physics and geometry of the accretion in these system, polarimetric observations can now provide a fundamental contribution, allowing to remove at least partially the degeneracy of proposed spectral models which describe the broad-band spectral of LMXBs, particularly in the soft state.
The most intriguing result so far is the value of the PA, which is within errors consistent with the direction of the radio jet, episodically occurring when the source is in the HB of the Z-track. This is in line with recent observations of Sco X-1 with PolarLight in the 3–8 keV energy band by Long et al. (2022), who came to the same conclusion: polarization is in the direction of the axis of symmetry of the system. Moreover, the PA obtained from model-independent analysis (pcube algorithm) is fully consistent within errors with that of the hard (Comptonized) part of the spectrum as obtained by a two-component fit of the X-ray continuum (see Sect. 3.3).
Using Fourier-frequency resolved spectroscopy, it has been claimed that in the soft state of NS LMXBs the hard component originates in the BL (or rather spreading layer, SL) covering the NS surface up to some latitude (see references in Sect. 1). To the first approximation, the SL is perpendicular to the disc plane, and the PA is expected to be rotated by with respect to that of polarized radiation (if any) emerging from the electron-scattering dominated disc atmosphere (Chandrasekhar, 1960; Sobolev, 1963). Because we measure a PA consistent with the jet position angle, we exclude the possibility that the polarization signal directly comes from the accretion disc or a BL which is coplanar with the disc. Note also that the PD=4.30.8 per cent measured for Sco X-1 in the 4–8 keV range by Long et al. (2022) is not compatible with the disc scattering atmosphere at the low inclination angle of the source (Cherepashchuk et al., 2021).
Do all these results indicate that the disc is not polarized at all? Not necessarily. The spectro-polarimetric fit provides only an upper limit of 3 per cent to the PD value (and thus is principle consistent with zero). The opacity in the inner disc is dominated by the electron scattering (Shakura & Sunyaev, 1973; Page & Thorne, 1974), and polarized radiation is expected to come from there, the PD depending, apart from system inclination, on the radial extension of the electron scattering dominated region and the optical depth (Kallman & Bautista, 2001). It is important to bear in mind that the classical Chandrasekhar’s result is valid for initial radiation at the bottom of a scattering medium with . As shown in Sunyaev & Titarchuk (1985), the PD for can be higher than the corresponding value for semi-infinite atmosphere with the polarization vector being aligned with the surface normal. The spectro-polarimetric analysis for Cyg X-2 (see Fig. 7), provides a hint in favour of a disk atmosphere with with PA at right angle to both the observed one and to that associated to the Comptonized component.
Another complementary possibility to have a PA aligned to the system symmetry axis is through reflection from the disc. This has been clearly shown in simulations of BH accretion disc in the soft state where disc self-irradiation with scattering at the top surface induces a rotation of the PA (Schnittman & Krolik, 2009). While self-irradiation is important only for a spin parameter close to unity, not achieved in NS LMXBs, the SL itself at the NS surface can serve as a source of photons. The reflection spectrum is produced essentially by photons scattered once and twice and these photons are highly polarized (Matt, 1993; Poutanen et al., 1996) contributing significantly to the polarization signal even if the fraction of the reflection component to the total flux is small (Iaria et al., 2016; Mondal et al., 2020). A geometry where the SL illuminates the accretion disk has been studied by Lapidus & Sunyaev (1985), who predicted a PD up to 6 per cent for an inclination angle of for X-ray bursters during the phase between bursts. This value is however overestimated as it does not consider the direct disk contribution, which tends to produce a net lower polarization signal, unless the disk is polarized with PA perpendicular to the disk plane, as discussed above.
The present spectroscopic data quality does not allow us to perform a thorough investigation of the contribution of the reflection, which instead has been studied by Mondal et al. (2018, hereafter M18) and L22 using NuSTAR observations. Their results show, however, that estimation of the source inclination as well as the disc inner radius from spectral analysis should be taken carefully because these parameters are strongly model-dependent. Indeed, while M18 found for both dipping and non dipping states occurring in the observation of 2015-01-07, L22 newly analysing the NuSTAR data of M18 with two additional observations performed on 2019-09-10 and 2019-09-12 joint with NICER, reported a value of for a non-dipping state, more consistent with the optical data. Further, M18 considered the model diskbb plus comptt (like in our fit) plus illumination of the accretion disc by a blackbody convolved with a relativistic disc kernel (relconv * reflionx), while the parameters reported by L22 have been obtained with two different components in which the illuminating source is either a blackbody (relxillns) or a Comptonized blackbody (rfxconv), but with the direct Comptonized spectrum described by a power law instead of comptt.
We do not attempt to provide an estimation of the system inclination based on the IXPE polarimetric data, rather we point out that the value per cent (at per cent confidence level) as obtained from the xspec modelling for the comptt component does not imply that it comes necessarily from the BL/SL at all. If polarization potentially comes from three regions (direct and reflected radiation from disc, plus BL) and spectro-polarimetric modelling is performed with only two components as in the present analysis, the situation is mathematically equivalent to having a system of two equations and three unknowns. The problem becomes degenerate and xspec cannot do anything but attribute globally to the hard component (comptt) a polarization which actually comes both directly from the BL/SL and from the fraction of radiation which is reflected from the disc before reaching the observer. The marginal hint of increase of the PD with energy (see Fig. 6) albeit to be taken cautiously, could be explained if the softer accretion disc is weaker polarized (and/or at right angle) than the harder BL/SL component.
It is worth noticing that Cyg X-2 is a highly variable source on time scales comparable or even shorter than the duration of the IXPE observation, as shown in Figs. 1 and 2 as well as in more recent NuSTAR analysis by M18 and L22. The measured PD and PA reported in this work are averaged values over a period of about 2 days (albeit with 50% of net exposure, see Table 1) during which no flaring activity was detected and the source traced a NB-like pattern in the CCD. We also claim that the measured polarization parameters probably are not the average between, e.g., two extreme boundaries but they are rather stable for the source status caught during the IXPE exposure. On the other hand, any dependence on the orbital phase should be less significant, because the IXPE exposure covered about 20 per cent of the source orbital period of d. Nevertheless, phase-dependent studies for NS-LMXBs are expected to be of great interest, particularly to investigate deviations from the azimuthal symmetry induced by disc-warping effects (Abarr & Krawczynski, 2020) or misalignment between the orbital and disc plane, as recently proposed by Krawczynski et al. (2022) to explain IXPE results of Cyg X-1. Our claims about disc reflection and SL contribution to the observed PD and PA need detailed Monte Carlo simulations which we are currently implementing and will be presented in a forthcoming paper. The codes for computing polarization of radiation have been focused mostly on accretion discs, where the central object is implicitly or explicitly assumed to be a BH (e.g. Sunyaev & Titarchuk, 1985; Poutanen & Svensson, 1996; Schnittman & Krolik, 2010; Dovčiak et al., 2011; Schnittman & Krolik, 2013; Podgorný et al., 2022; Loktev et al., 2022), and for polar caps of accreting millisecond X-ray pulsars (Viironen & Poutanen, 2004; Poutanen, 2020). To our knowledge, the first systematic attempt to investigate polarization properties in NS LMXBs using Monte Carlo simulations has been performed by Gnarini et al. (2022), who assumed however that the disc absorbs all the impinging radiation, and thus neglecting contribution to polarization from reflection by the disk photosphere.
The presence of such a gap in modelling emission and polarization of LMXBs hosting a NS is probably motivated by the fact that while for BH systems Einstein’s field equations have exact solutions (the Schwarzschild or Kerr metric) and efforts are focused only on the accretion disc properties, for NS systems, even assuming simple Schwarzschild spacetime, the presence of a strong radiation pressure from the NS and the influence of the hard surface on the accretion disc structure makes it more difficult to construct a model of the accretion flow in the NS vicinity.
5 Conclusions
In this work, we have reported the first detection by the IXPE satellite in the 2–8 keV energy band of X-ray polarization in the weakly magnetized NS LMXB Cyg X-2. The direction of the polarization angle is consistent with that of the source radio jet, which is presumably perpendicular to the accretion disc. These measurements exclude the accretion disc and the BL coplanar with the disc as the main source of the polarized radiation while favouring the SL at the NS surface. The data can also be consistent with reflection from the inner disc of the Comptonized radiation emerging from the SL itself. The data statistics, however, did not allow us to investigate the presence of a reflection component in the continuum, albeit we have indirect evidence for it from the presence of an iron fluorescence line. The relative contribution of all these components needs Monte Carlo simulations which will be presented elsewhere.
The measured values of PD and PA allowed us to put strong (albeit not definitive) constraints on the accretion geometry of Cyg X-2, and presumably by deduction to other NS LMXBs in the soft state. Future IXPE observations of other bright atoll- and Z-sources will be helpful in providing a more complete scenario of the accretion geometry of these sources in their soft state.
Acknowledgements
The Imaging X-ray Polarimetry Explorer (IXPE) is a joint US and Italian mission. The US contribution is supported by the National Aeronautics and Space Administration (NASA) and led and managed by its Marshall Space Flight Center (MSFC), with industry partner Ball Aerospace (contract NNM15AA18C).
The Italian contribution is supported by the Italian Space Agency (Agenzia Spaziale Italiana, ASI) through contract ASI-OHBI-2017-12-I.0, agreements ASI-INAF-2017-12-H0 and ASI-INFN-2017.13-H0, and its Space Science Data Center (SSDC) with agreements ASI-INAF-2022-14-HH.0 and ASI-INFN 2021-43-HH.0, and by the Istituto Nazionale di Astrofisica (INAF) and the Istituto Nazionale di Fisica Nucleare (INFN) in Italy.
This research used data products provided by the IXPE Team (MSFC, SSDC, INAF, and INFN) and distributed with additional software tools by the High-Energy Astrophysics Science Archive Research Center (HEASARC), at NASA Goddard Space Flight Center (GSFC). JP and SST were supported by the Russian Science Foundation grant 20-12-00364 and the Academy of Finland grants 333112, 349144, 349373, and 349906.
Data Availability
The data used in this paper are publicly available in the HEASARC database.
References
- Abarr & Krawczynski (2020) Abarr Q., Krawczynski H., 2020, ApJ, 889, 111
- Baldini et al. (2022) Baldini L., et al., 2022, SoftwareX, 19, 101194
- Bałucińska-Church et al. (2010) Bałucińska-Church M., Gibiec A., Jackson N. K., Church M. J., 2010, A&A, 512, A9
- Chandrasekhar (1960) Chandrasekhar S., 1960, Radiative Transfer. Dover, New York
- Chandrasekhar & Breen (1947) Chandrasekhar S., Breen F. H., 1947, ApJ, 105, 435
- Cherepashchuk et al. (2021) Cherepashchuk A. M., Khruzina T. S., Bogomazov A. I., 2021, MNRAS, 508, 1389
- D’Amico et al. (2001) D’Amico F., Heindl W. A., Rothschild R. E., Gruber D. E., 2001, ApJ, 547, L147
- Di Salvo et al. (2000) Di Salvo T., et al., 2000, ApJ, 544, L119
- Di Salvo et al. (2001) Di Salvo T., Robba N. R., Iaria R., Stella L., Burderi L., Israel G. L., 2001, ApJ, 554, 49
- Di Salvo et al. (2002) Di Salvo T., et al., 2002, A&A, 386, 535
- Done et al. (2007) Done C., Gierliński M., Kubota A., 2007, A&ARv, 15, 1
- Dovčiak et al. (2011) Dovčiak M., Muleri F., Goosmann R. W., Karas V., Matt G., 2011, ApJ, 731, 75
- Farinelli et al. (2008) Farinelli R., Titarchuk L., Paizis A., Frontera F., 2008, ApJ, 680, 602
- Farinelli et al. (2009) Farinelli R., Paizis A., Landi R., Titarchuk L., 2009, A&A, 498, 509
- Gendreau et al. (2016) Gendreau K. C., et al., 2016, in den Herder J.-W. A., Takahashi T., Bautz M., eds, Proc. SPIE Vol. 9905, Space Telescopes and Instrumentation 2016: Ultraviolet to Gamma Ray. p. 99051H, doi:10.1117/12.2231304
- Gilfanov et al. (2003) Gilfanov M., Revnivtsev M., Molkov S., 2003, A&A, 410, 217
- Gnarini et al. (2022) Gnarini A., Ursini F., Matt G., Bianchi S., Capitanio F., Cocchi M., Farinelli R., Zhang W., 2022, MNRAS, 514, 2561
- Haardt & Maraschi (1993) Haardt F., Maraschi L., 1993, ApJ, 413, 507
- Hasinger & van der Klis (1989) Hasinger G., van der Klis M., 1989, A&A, 225, 79
- Iaria et al. (2016) Iaria R., et al., 2016, A&A, 596, A21
- Inogamov & Sunyaev (1999) Inogamov N. A., Sunyaev R. A., 1999, Astronomy Letters, 25, 269
- Kallman & Bautista (2001) Kallman T., Bautista M., 2001, ApJS, 133, 221
- Kislat et al. (2015) Kislat F., Clark B., Beilicke M., Krawczynski H., 2015, Astroparticle Physics, 68, 45
- Koch Miramond & Naylor (1995) Koch Miramond L., Naylor T., 1995, A&A, 296, 390
- Krawczynski et al. (2022) Krawczynski H., et al., 2022, Science, 378, 650
- Lapidus & Sunyaev (1985) Lapidus I. I., Sunyaev R. A., 1985, MNRAS, 217, 291
- Lavagetto et al. (2004) Lavagetto G., Iaria R., di Salvo T., Burderi L., Robba N. R., Frontera F., Stella L., 2004, Nuclear Physics B Proceedings Supplements, 132, 616
- Lebrun et al. (2003) Lebrun F., et al., 2003, A&A, 411, L141
- Loktev et al. (2022) Loktev V., Veledina A., Poutanen J., 2022, A&A, 660, A25
- Long et al. (1980) Long K. S., Chanan G. A., Novick R., 1980, ApJ, 238, 710
- Long et al. (2022) Long X., et al., 2022, ApJ, 924, L13
- Ludlam et al. (2022) Ludlam R. M., et al., 2022, ApJ, 927, 112
- Lund et al. (2003) Lund N., et al., 2003, A&A, 411, L231
- Matsuoka et al. (2009) Matsuoka M., et al., 2009, PASJ, 61, 999
- Matt (1993) Matt G., 1993, MNRAS, 260, 663
- Miller et al. (2018) Miller J. M., et al., 2018, ApJ, 860, L28
- Mitsuda et al. (1984) Mitsuda K., et al., 1984, PASJ, 36, 741
- Mondal et al. (2018) Mondal A. S., Dewangan G. C., Pahari M., Raychaudhuri B., 2018, MNRAS, 474, 2064
- Mondal et al. (2020) Mondal A. S., Dewangan G. C., Raychaudhuri B., 2020, MNRAS, 494, 3177
- Muleri (2022) Muleri F., 2022, in Bambi C., Santangelo A., eds, Handbook of X-ray and Gamma-ray Astrophysics. Springer, Singapore (arXiv:2204.12739)
- Orosz & Kuulkers (1999) Orosz J. A., Kuulkers E., 1999, MNRAS, 305, 132
- Page & Thorne (1974) Page D. N., Thorne K. S., 1974, ApJ, 191, 499
- Paizis et al. (2006) Paizis A., et al., 2006, A&A, 459, 187
- Podgorný et al. (2022) Podgorný J., Dovčiak M., Marin F., Goosmann R., Różańska A., 2022, MNRAS, 510, 4723
- Popham & Sunyaev (2001) Popham R., Sunyaev R., 2001, ApJ, 547, 355
- Poutanen (2020) Poutanen J., 2020, A&A, 641, A166
- Poutanen & Svensson (1996) Poutanen J., Svensson R., 1996, ApJ, 470, 249
- Poutanen et al. (1996) Poutanen J., Nagendra K. N., Svensson R., 1996, MNRAS, 283, 892
- Poutanen et al. (2018) Poutanen J., Veledina A., Zdziarski A. A., 2018, A&A, 614, A79
- Revnivtsev & Gilfanov (2006) Revnivtsev M. G., Gilfanov M. R., 2006, A&A, 453, 253
- Revnivtsev et al. (2013) Revnivtsev M. G., Suleimanov V. F., Poutanen J., 2013, MNRAS, 434, 2355
- Schnittman & Krolik (2009) Schnittman J. D., Krolik J. H., 2009, ApJ, 701, 1175
- Schnittman & Krolik (2010) Schnittman J. D., Krolik J. H., 2010, ApJ, 712, 908
- Schnittman & Krolik (2013) Schnittman J. D., Krolik J. H., 2013, ApJ, 777, 11
- Shakura & Sunyaev (1973) Shakura N. I., Sunyaev R. A., 1973, A&A, 24, 337
- Sobolev (1949) Sobolev V. V., 1949, Uch. Zap. Leningrad Univ., 16
- Sobolev (1963) Sobolev V. V., 1963, A Treatise on Radiative Transfer. Van Nostrand, Princeton
- Spencer et al. (2013) Spencer R. E., Rushton A. P., Bałucińska-Church M., Paragi Z., Schulz N. S., Wilms J., Pooley G. G., Church M. J., 2013, MNRAS, 435, L48
- Strohmayer & Kallman (2013) Strohmayer T. E., Kallman T. R., 2013, ApJ, 773, 103
- Suleimanov & Poutanen (2006) Suleimanov V., Poutanen J., 2006, MNRAS, 369, 2036
- Sunyaev & Titarchuk (1985) Sunyaev R. A., Titarchuk L. G., 1985, A&A, 143, 374
- Titarchuk (1994) Titarchuk L., 1994, ApJ, 434, 570
- Titarchuk & Fiorito (2004) Titarchuk L., Fiorito R., 2004, ApJ, 612, 988
- Viironen & Poutanen (2004) Viironen K., Poutanen J., 2004, A&A, 426, 985
- Weisskopf et al. (1976) Weisskopf M. C., Kestenbaum H. L., Long K. S., Novick R., Silver E. H., Wolff R. S., 1976, in Bulletin of the American Astronomical Society. p. 493
- Weisskopf et al. (2010) Weisskopf M. C., Elsner R. F., O’Dell S. L., 2010, in Arnaud M., Murray S. S., Takahashi T., eds, SPIE Conf. Ser. Vol. 7732, Space Telescopes and Instrumentation 2010: Ultraviolet to Gamma Ray. p. 77320E (arXiv:1006.3711), doi:10.1117/12.857357
- Weisskopf et al. (2022) Weisskopf M. C., et al., 2022, J. Astron. Telesc. Instrum. Syst., 8, 026002
- Winkler et al. (2003) Winkler C., et al., 2003, A&A, 411, L1
Affiliations:
1INAF – Osservatorio di Astrofisica e Scienza dello Spazio di Bologna, Via P. Gobetti 101, I-40129 Bologna, Italy
2INAF – IAPS, via del Fosso del Cavaliere 100, I-00113 Roma, Italy
3Department of Physics and Astronomy, FI-20014 University of Turku, Finland
4Space Research Institute of the Russian Academy of Sciences, Profsoyuznaya Str. 84/32, 117997 Moscow, Russia
5Dipartimento di Matematica e Fisica, Università degli Studi Roma Tre, Via della Vasca Navale 84, I-00146 Roma, Italy
6Department of Astronomy, University of Geneva, Ch. d’Ecogia 16, 1290, Versoix, Geneva, Switzerland
7INAF – Osservatorio Astronomico di Cagliari, via della Scienza 5, I-09047 Selargius (CA), Italy
8University of New Hampshire, Department of Physics & Astronomy and Space Science Center, 8 College Rd, Durham, NH 03824, USA
9Instituto de Astrofísica de Andalucía-CSIC, Glorieta de la Astronomía s/n, 18008, Granada, Spain
10INAF Osservatorio Astronomico di Roma, Via Frascati 33, 00078 Monte Porzio Catone (RM), Italy
11Space Science Data Center, Agenzia Spaziale Italiana, Via del Politecnico snc, 00133 Roma, Italy
12Istituto Nazionale di Fisica Nucleare, Sezione di Pisa, Largo B. Pontecorvo 3, 56127 Pisa, Italy
13Dipartimento di Fisica, Università di Pisa, Largo B. Pontecorvo 3, 56127 Pisa, Italy
14NASA Marshall Space Flight Center, Huntsville, AL 35812, USA
15Istituto Nazionale di Fisica Nucleare, Sezione di Torino, Via Pietro Giuria 1, 10125 Torino, Italy
16Dipartimento di Fisica, Università degli Studi di Torino, Via Pietro Giuria 1, 10125 Torino, Italy
17INAF Osservatorio Astrofisico di Arcetri, Largo Enrico Fermi 5, 50125 Firenze, Italy
18Dipartimento di Fisica e Astronomia, Università degli Studi di Firenze, Via Sansone 1, 50019 Sesto Fiorentino (FI), Italy
19Istituto Nazionale di Fisica Nucleare, Sezione di Firenze, Via Sansone 1, 50019 Sesto Fiorentino (FI), Italy
20ASI - Agenzia Spaziale Italiana, Via del Politecnico snc, 00133 Roma, Italy
21Istituto Nazionale di Fisica Nucleare, Sezione di Roma ‘Tor Vergata’, Via della Ricerca Scientifica 1, 00133 Roma, Italy
22Department of Physics and Kavli Institute for Particle Astrophysics and Cosmology, Stanford University, Stanford, California 94305, USA
23Institut für Astronomie und Astrophysik, Universität Tübingen, Sand 1, 72076 Tübingen, Germany
24Astronomical Institute of the Czech Academy of Sciences, Boční II 1401/1, 14100 Praha 4, Czech Republic
25RIKEN Cluster for Pioneering Research, 2-1 Hirosawa, Wako, Saitama 351-0198, Japan
26California Institute of Technology, Pasadena, CA 91125, USA
27Yamagata University,1-4-12 Kojirakawa-machi, Yamagata-shi 990-8560, Japan
28Osaka University, 1-1 Yamadaoka, Suita, Osaka 565-0871, Japan
29University of British Columbia, Vancouver, BC V6T 1Z4, Canada
30Department of Physics, Faculty of Science and Engineering, Chuo University, 1-13-27 Kasuga, Bunkyo-ku, Tokyo 112-8551, Japan
31Institute for Astrophysical Research, Boston University, 725 Commonwealth Avenue, Boston, MA 02215, USA
32Department of Astrophysics, St. Petersburg State University, Universitetsky pr. 28, Petrodvoretz, 198504 St. Petersburg, Russia
33Physics Department and McDonnell Center for the Space Sciences, Washington University in St. Louis, St. Louis, MO 63130, USA
34Finnish Centre for Astronomy with ESO, 20014 University of Turku, Finland
35Université de Strasbourg, CNRS, Observatoire Astronomique de Strasbourg, UMR 7550, 67000 Strasbourg, France
36MIT Kavli Institute for Astrophysics and Space Research, Massachusetts Institute of Technology, 77 Massachusetts Avenue, Cambridge, MA 02139, USA
37Graduate School of Science, Division of Particle and Astrophysical Science, Nagoya University, Furo-cho, Chikusa-ku, Nagoya, Aichi 464-8602, Japan
38Hiroshima Astrophysical Science Center, Hiroshima University, 1-3-1 Kagamiyama, Higashi-Hiroshima, Hiroshima 739-8526, Japan
39Department of Physics, The University of Hong Kong, Pokfulam, Hong Kong
40Department of Astronomy and Astrophysics, Pennsylvania State University, University Park, PA 16802, USA
41Université Grenoble Alpes, CNRS, IPAG, 38000 Grenoble, France
42Center for Astrophysics, Harvard & Smithsonian, 60 Garden St, Cambridge, MA 02138, USA
43INAF Osservatorio Astronomico di Brera, Via E. Bianchi 46, 23807 Merate (LC), Italy
44Dipartimento di Fisica e Astronomia, Università degli Studi di Padova, Via Marzolo 8, 35131 Padova, Italy
45Dipartimento di Fisica, Università degli Studi di Roma ‘Tor Vergata’, Via della Ricerca Scientifica 1, 00133 Roma, Italy
46Department of Astronomy, University of Maryland, College Park, Maryland 20742, USA
47Mullard Space Science Laboratory, University College London, Holmbury St Mary, Dorking, Surrey RH5 6NT, UK
48Anton Pannekoek Institute for Astronomy & GRAPPA, University of Amsterdam, Science Park 904, 1098 XH Amsterdam, The Netherlands
49Guangxi Key Laboratory for Relativistic Astrophysics, School of Physical Science and Technology, Guangxi University, Nanning 530004, China