The environments of Type Ia supernovae with different relative equivalent width of Si II feature in their spectra
Abstract
Although type Ia supernovae are so important in many astrophysical field, e.g. in cosmology, their explosion mechanism and progenitor system are still unclear. In physics, the relative equivalent width (REW) of the Si II 635.5 nm absorption feature reflects the velocity interval of silicon in the supernova ejecta and then may provide constraints on the explosion mechanism of SNe Ia. In this paper, we divide the SNe Ia into broad line (BL) and normal line (NL) subsamples based on their REW of Si II 635.5 nm absorption lines around maximum light, and find that the BL SNe Ia have a dimmer mean brightness than NL ones, which possibly results from their different metallicities. However, based on the pixel statistics study on the environments of two subsamples, we do not find any significant potential difference on the environments between BL and NL SNe Ia, which implies that the explosion mechanism of SNe Ia could be independent of their progenitor populations.
1 INTRODUCTION
Taking type Ia supernovae (SNe Ia) as standard candles to measure cosmological parameters, it is found that the expansion of the Universe is accelerating, which means that the Universe is dominated by a mysterious dark energy (Riess et al. 1998; Perlmutter et al. 1999). Now, SNe Ia are used to measure the equation of dark energy (see Meng et al. 2015 and references in it). On SNe Ia, a consensus has bee achieved that a SN Ia is derived from the thermonuclear explosion of a carbon-oxygen white dwarf (CO WD) in a binary system (Hoyle & Fowler 1960), but as far as the explosion physics and the evolution of the WD towards explosion are concerned, the arguments are endless, i.e. various explosion models and progenitor models are proposed (Hillebrandt & Niemeyer 2000; Goobar & Leibundgut 2011; Wang & Han 2012; Hillebrandt et al. 2013; Maoz, Mannucci & Nelemans 2014; Jha, Maguire & Sullivan 2019). According to the nature of the companion star of the WD, two competing progenitor scenarios have been proposed: the single degenerate (SD) model, where the companion is a nondegenerate star, e.g. a main-sequence (MS), a red-giant (RG) or a helium star (Whelan & Iben 1973; Nomoto, Thielemann & Yokoi 1984), and the double-degenerate (DD) model, which involves the merger of two CO WDs with a total mass of larger than the Chandrasekhar mass limit (MCh) (Iben & Tutukov 1984; Webbink 1984). In addition to the above models, the double-detonation model is also frequently discussed, where the CO WD companion is a helium WD or a helium star (Livne 1990; Woosley & Weaver 1994; Hoeflich et al. 1996; Shen & Moore 2014). At present, which model dominates the production of SNe Ia is still a key subject of debate (Jha, Maguire & Sullivan 2019; Ruiz-Lapuente 2019). Based on the mass of the CO WD at the moment of supernova explosion and the propagating flame style, sub-MCh, MCh and super-MCh explosion models are proposed (Hillebrandt & Niemeyer 2000; Hillebrandt et al. 2013).
Strictly speaking, the research on the explosion model and progenitor model should not be independent, e.g. the initial conditions of the explosion of a WD should be determined by the evolution of its progenitor, but they are generally treated as free parameters. Then, how to connect the explosion model and the progenitor model together is becoming an interesting subjects. On one side, the spectra of SNe Ia may reflect the explosion mechanism to some extents although different explosion models could predict quiet similar spectra (Wang & Wheeler 2008; Hillebrandt et al. 2013). On the other hand, the population of SNe Ia may partly reflect the nature of the progenitor system of SNe Ia (Wang et al. 2013). Therefore, finding a connection between spectral feature and the population of SNe Ia has a potential to link the explosion model and progenitor model of SNe Ia.
It is widely known that SNe Ia are not a homogeneous population for their photometric and spectroscopic diversities (Taubenberger 2017). In 1991, two peculiar SNe Ia were discovered, i.e. SN 1991bg and 1991T. 1991bg is fainter than normal SNe Ia by about 2 magnitudes (Filippenko et al. 1992a; Leibundgut et al. 1993), while SN 1991T is brighter than normal ones by 0.4 magnitudes in the V-band (Filippenko et al. 1992b; Phillips et al. 1992). Since then, SNe Ia was classified into different subclasses based on different measurable properties of SNe Ia (Benetti et al. 2005; Branch et al. 2009; Wang et al. 2009). Such classifications may be helpful to diagnose different progenitor populations and/or different explosion mechanisms that different subclasses are derived from. For example, based on the different ejecta velocities of SNe Ia, Wang et al. (2013) found that normal SNe Ia are derived from two different populations, i.e compared with those with normal-velocity (NV; ) ejecta, SNe Ia with high-velocity (HV; ) ejecta tend to occur in the inner and brighter regions of their host galaxies, i.e. HV SNe Ia favor metal-rich progenitor systems. One of the reasons that supports the existence of the different subclasses is that the distribution of the parameters that describe the properties of SNe Ia may not be simply described by one Gaussian distribution, even though only the so-called normal SNe Ia are considered (Wang et al. 2013). For an example, the distributions of the parameters describing the maximum absolute brightnessof SNe Ia has a peak with a long faint tail and a sharp cut at luminous end (Hicken et al. 2009; Li et al. 2011b; Blondin et al. 2012; Ashall et al. 2016). However, do SNe Ia really need so many subclasses since more and more transitional events are discovered, suggesting a continuous distribution from super-luminous to normal, and to sub-luminous SNe Ia (Parrent et al. 2014; Zhang et al. 2016; Li et al. 2022). In particular, many works argued that 1991bg-like SNe may not be a real physically distinct subgroup (Branch et al. 2009; Doull & Baron 2011; Heringer et al. 2017), and there even exist some SNe Ia, which should belong to normal SNe Ia although they have a very large (Gall et al. 2018). Is there such a parameter which may describe all SNe Ia and whose distribution may be fitted by a simple Gaussian?
Firstly, we tried to find a parameter based on the following two criteria: 1) the parameter may reflect the characteristics of the explosion of SNe Ia, and 2) its distribution is a simple Gaussian. Meng et al. (2017) (Paper I) found a correlation between the polarization and relative equivalent width (REW) of the Si II 635.5 nm absorption feature at -5 days after the maximum light, where the polarization may provide the information of the chemical structure of the supernova ejecta and then constrain the explosion model, and the REW reflect the distribution of silicon in supernova ejecta. Actually, the REW, which is defined as the ratio of the pseudo equivalent width (pEW) to the relative depth () of the Si II 635.5 nm absorption feature (Silverman et al. 2012), reflects the velocity difference between inner and outer boundary of silicon in supernova ejecta, and then the explosion characteristics to some extent (Meng et al. 2017). The parameter, REW, fulfills our two criteria. In this paper, we want to check whether or not SNe Ia with different REWs originates from different populations.
In section 2, we describe our method, and present the calculation results in section 3. We show discussions and our main conclusions in section 4.

2 DATA
As described in Silverman et al. (2012), the measurement of pEW and is illustrated in Fig. 1. For a given absorption line in the spectra of a SN Ia, different line profiles may lead to the same pEW. To eliminate the effect of the different line profiles, Meng et al. (2017) introduce the REW. The definition and the measurement of the REW value here are the same to that in Paper I, i.e.
| (1) |
Following Paper I, we measured the REW value of the Si II 635.5 nm absorption feature of SNe Ia around maximum light, which is the most significant feature in the optical spectra around the maximum light and almost not blend with other features in the optical spectra. All the data about SNe Ia used in this paper have been published. The SN Ia sample is mainly from Silverman et al. (2012) and Wang et al. (2013), and there was no bias in the collection of the sample (see also Paper I). Some parameters of SNe Ia, e.g. and intrinsic B - V color, are from Blondin et al. (2012). In Paper I, we found that the intrinsic distribution of the REW around maximum light may be fitted by a Gaussian with an average value of 159.7 and . Here, we do not classify SNe Ia as people usually did (Branch et al. 1993). We divide SNe Ia into two subclasses based on the REW value, i,e. broad line (BL) one with and normal line (NL) one with . If BL and NL SNe Ia share the same origin, they would occur in similar stellar environments, and vice versa. Then, we try to investigate whether or not there are any signatures that the different subclasses originate from different populations following the method in Wang et al. (2013) and Anderson et al. (2015a, b). The stellar environments at the location of supernova explosion may reflect the information of the populations of SNe Ia, and can be tested by checking SN positions in their host galaxies and the properties of the host galaxies. The location information of SNe Ia in their host galaxies is mainly from Wang et al. (2013), Anderson et al. (2015b) and Karapetyan (2022). Some of the parameters of the SN host galaxies are from Wang et al. (2013) and the others are obtained from two online astronomical databases: NASA/IPAC Extragalactic Database (NED) (2019)111http://ned.ipac.caltech.edu/ and HyperLeda222http://leda.univ-lyon1.fr/(Makarov et al. 2014).
3 RESULT
3.1 Relations between the photospheric velocity and REW
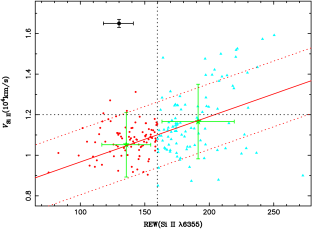
In Wang et al. (2013), SNe Ia are divided into NV and HV groups based the photospheric expansion velocity of supernova ejecta, where 12000 km/s is the velocity boundary. In Fig. 2, we show the relation between the velocity and REW of Si II 635.5 nm absorption feature around maximum light. As found in Wang et al. (2013), most of SNe Ia belong to NV SNe Ia, and most of SNe Ia have a photospheric velocity between 10000 and 12000 km/s. Generally, there is trend that the higher the photospheric velocity, the higher the REW value, as shown by the linear fit in Fig. 2, although the scatter is still large. However, the subclasses based on different photospheric velocities and on the REW do not correspond one to one, e.g. only a small part of BL SNe Ia belong to HV SNe Ia, and most of them belong to NV group, which results in a small difference of the average photospheric velocity between BL and NL SNe Ia. Nevertheless, almost all HV SNe Ia tend to belong to BL SNe Ia and at the same time, almost all NL SNe Ia belong to NV ones.
3.2 and REW
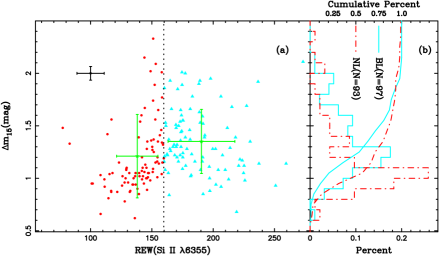
, the B band magnitude drop during the first 15 days following the maximum brightness, is usually taken as the measurement of the maximum absolute brightness of SNe Ia, i.e. the larger the value of , the dimmer the maximum absolute brightness (Phillips 1993). However, the distribution of can not be fitted by a Gaussian as REW (Hicken et al. 2009; Blondin et al. 2012). In panel (a) of Fig. 3, we show the distribution of SNe Ia in the plane of and REW. On the point of average, the BL SNe Ia have a larger average value of than the NL SNe Ia, which means that the BL SNe Ia are dimmer than the NL ones on average although the dimmest SNe Ia belong to NL SNe Ia. The mean for BL and NL SNe Ia are mag and mag, respectively. The distribution of for BL and NL SNe Ia also show such a trend [panel (b) of Fig. 3]. The distribution of BL SNe Ia peaks at mag, a value larger than that of NL SNe Ia by 0.2 mag. A Kolmogorov-Smirnov (K-S) test only gives a probability of that BL and NL SNe Ia come from the same mother sample for the distributions. Here, we must emphasize that we do not classify SNe Ia as people usual did. Roughly, 60% of 1991bg-like SNe belong to BL and 40% are to NL one. At the same time, about 20% of 1991T-like SNe belong to BL SNe Ia and 80% are NL one. Such a distribution of 1991bg- and 1991T-like SNe partly contributes to the difference of the mean between BL and NL SNe Ia, but may not explain their different peak positions of the distributions since the peak positions are for normal SNe Ia. We discuss the possible origin of the different average brightness between BL and NL SNe Ia in Sec. 4.
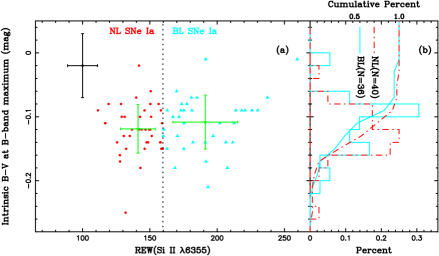
Similarly, the intrinsic (B-V) color at the B-band maximum brightness for BL SNe Ia is on average redder than that for NL ones by mag (see Fig. 4), which is consistent with previous discovery that intrinsically dim SN Ia are redder (Riess et al. 1996; Branch 1998). However, the observational error of the intrinsic (B-V) color is much larger than the difference of the average color between BL and NL SNe, and then the distributions of the intrinsic (B-V) color are not significantly different between BL and NL SNe, i.e. a K-S test shows a probability of 27% that the distributions for BL and NL SNe are from the same mother sample.
Generally, the 56Ni production during the explosion dominates the maximum luminosity of SNe Ia (Arnett 1982), but no consensus has been achieved for the origin of the variation in the 56Ni production of different SNe Ia (Podsiadlowski et al. 2008). In observations, the age, metallicity of the population as well as the mass of their host galaxy may affect the maximum brightness of SNe Ia (see the review of Meng et al. 2015). However, whether or not the difference of the brightness between NL and BL SNe Ia originates from different populations is still needed to be carefully investigated. To this end, we will show whether or not there is a difference between BL and SNe Ia for the characteristics representing the population of SNe Ia in the following sections.
3.3 The host galaxy
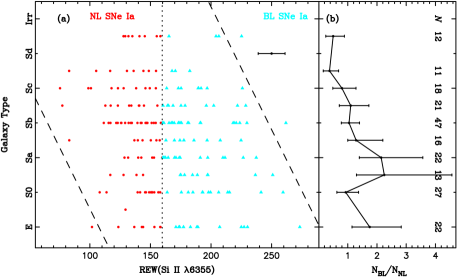
Firstly, the type of the host galaxy of SNe Ia may reflect the population of SNe Ia to some extent. For example, it is well known that the most luminous SNe Ia are always discovered in spiral galaxies, while both spiral and elliptical galaxies may host dimmer SNe Ia, which results in a dimmer mean peak SN brightness in elliptical than in spiral ones (Hamuy et al. 1996; Brandt et al. 2010). For galaxies, there are some systematic trends for the stellar population along the Hubble sequence, i.e. the early the galaxy type, the older the stellar population and the higher the metallicity (Roberts & Haynes 1994; Kennicutt 1998). In panel (a) of Fig. 5, we show the Hubble type of host galaxy vs. the REW of SNe Ia around the maximum brightness and in panel (b) of Fig. 5, we also show the number ratio of BL to NL SNe Ia in different type galaxies. It is clearly shown in panel (a) that compared with the NL ones, the BL SNe Ia tend to occur in relative early type Galaxy. According, we find a trend that, whatever in spiral or early type galaxies, the earlier the galaxy type, the higher the number ratio of BL to NL SNe Ia. These facts are consistent with the results that on average, the BL SNe Ia are dimmer than NL ones in section 3.2.
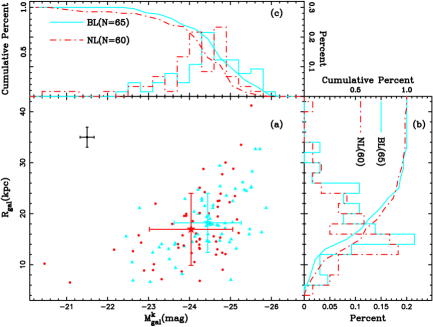
In Fig. 6, we show the comparison of the physical sizes, , and K-band absolute magnitude distributions of the host galaxies for BL and NL SNe Ia. Here, the physical sizes of SN host galaxies are represented by the B-band light radius at 25 mag arcsec-2 isophote (see Wang et al. 2013). In the figure, there are small difference for the sizes and K-band absolute magnitude of the host galaxies between NL and BL SNe Ia. On average, the BL SNe Ia tend to occur in slightly larger and brighter host galaxies than the NL SNe Ia. The average radius of host galaxies for BL and NL SNe Ia are kpc and kpc, respectively and the mean absolute magnitude of the galaxies for BL and NL SNe Ia are mag and mag, respectively. However, the statistical errors are so large that the distributions of the radius and the absolute magnitude of host galaxies for BL and NL SNe Ia are not significantly different. A two-dimensional K-S test shows that there is a probability of 15.9% that the two subclasses come from the same mother sample, i.e. the distributions are indistinguishable.
centerline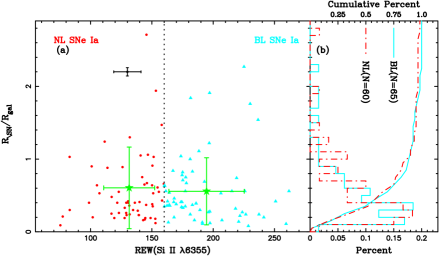
3.4 The fractional radial distance in host galaxies
Generally, the global parameters of the host galaxy of a SN Ia are not a good tracer of the stellar population of the SN Ia at the site of a supernova explosion since the global parameters may just reflect the average information of the stellar population in the host galaxy, and could erase the intrinsic information of the stellar population of the SN Ia. The most direct method constraining the progenitor nature of a SN Ia is to investigate its pre-explosion image, but such cases are too rare to obtain a statistical meaning (Li et al. 2011a; McCully et al. 2014). A statistical analysis of a fractional flux or a fractional radial distance is a viable method to investigate the environments at the position of a SN Ia in its host galaxy and then constrain its progenitor nature (Fruchter et al. 2006; Wang et al. 2013; Anderson et al. 2015a; Meng 2019).
Following Wang et al. (2013), we use the ratio of to to represent the fractional radial distance of a SN Ia in its host galaxy, where the is the radial distance of the SN Ia from its host nucleus (see also Hakobyan et al. 2016). Then, we investigate whether or not there is any bias for the distribution of between BL and NL SNe Ia. Fig. 7 shows the fractional radial distance of a SN Ia in its host galaxy vs. the REW of the SN Ia. It is clearly shown in the figure that the distributions of the for BL and NL SNe Ia are quite similar, i.e. a similar peak position and almost the same cumulative percent of . In addition, whatever for BL or NL SNe Ia, it is difficult to find them in the inmost region of their host galaxies, which is an observational selection bias against SN discovery (Cappellaro et al. 1997, 1999). A K-S test finds a probability of 87.1% that BL and NL SNe Ia have the same radial distribution in their host galaxies. Such a high probability means that there is not difference for the distribution of between BL and NL SNe Ia, i.e. BL and NL SNe Ia originate from the same stellar population.
3.5 The fractional flux
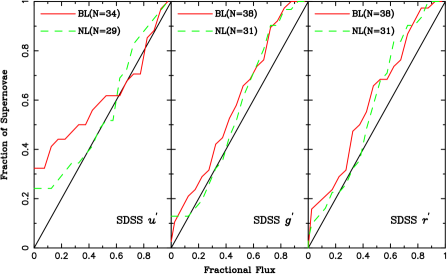
The fractional flux of a SN Ia represents the fraction of total host light in pixels fainter than or equal to the light in the pixel of the SN Ia site in its host-galaxy image. A statistical analysis of the fractional flux of the host galaxies at the SN explosions may reflect the populations of SNe Ia in their host galaxies, and is an additional constrains on the progenitors of SNe Ia besides the radial distance (Fruchter et al. 2006). Generally, the core-collapse SNe approximately linearly trace the star-formation (light) region in their host galaxies, while SNe Ia do not (Anderson et al. 2015a). In Fig. 8, we show the cumulative distributions of the fractional flux of the host galaxies at the SN explosion site in the Sloan Digital Sky Survey (SDSS) , , and bands for BL and NL SNe Ia, respectively, as in Wang et al. (2013). Generally, a young population traces the diagonal line, as core-collapse SNe do, while an old population lies far away from the line in the plot (Anderson et al. 2015a). Clearly, the distributions of the fractional flux for BL and NL SNe Ia are quite similar with each other, whatever the observational band is. In other words, the BL and NL SNe Ia track their hosts’ light as the same pattern, since K-S tests give very high probabilities that the fractional fluxes for BL and NL SNe Ia are from the same mother sample ( in , 93.8% in and 79.7% in band, respectively). In addition, as found by Anderson et al. (2015b), SNe Ia do not trace light, compared with the and bands (with a probabilities of in band), which means that SNe Ia do not trace the star-formation region in their host galaxies as CC SNe do. However, SNe Ia well trace and band lights (with a probabilities of 42% and 50% in and bands, respectively), which indicates that the and band lights would not be good tracers for the star formation in a galaxy. On the contrary, the NUV and H bands are good choices for tracing the star formation (Anderson et al., 2015a, b).
3.6 The NCR pixel value function
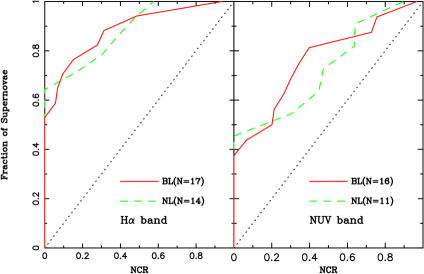
The statistical analysis of a normalized cumulative rank (NCR) pixel value function of the host galaxies at the SN explosion site is another viable method to investigate the population of SNe Ia. The NCR value of a pixel is equal to the flux-count ratio between this pixel and the pixel with the highest flux count within the image of a host galaxy (Anderson & James 2008). Generally, the closer the cumulative line of the NCR line for a SN sample to the diagonal line, the younger the population of the sample (Anderson & James 2008; Anderson et al. 2015b). In Fig. 9, we show the cumulative NCR distributions for BL and NL SNe Ia in H and NUV bands, respectively. It is clearly shown in the figure that cumulative NCR distributions do not trace the diagonal line, which indicates that the progenitors of SNe Ia are not as young as CC SNe (see also Anderson et al. 2015a, b). Nevertheless, no matter what the band is, the cumulative NCR distributions are quite similar between BL and NL SNe Ia. K-S tests for the NCR distributions between the NL and BL SNe Ia show that the probability that the two subsamples are from the same mother sample are 99.96% and 66.9% for the H and NUV bands, respectively, i.e. they arise from the same mother sample.
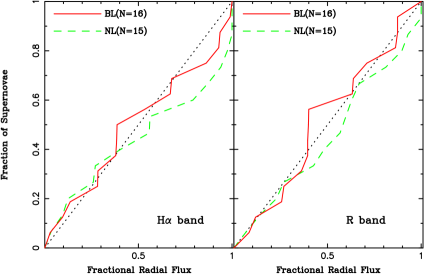
3.7 Radial analysis
It is believed that a SN Ia is much older than a CC SN and then the explosion site of the SN Ia is far away from its birth site. Generally, stellar populations with different ages and/or metallicities locate at different characteristic galactocentric radial positions in a galaxy, and then one may obtain the information of the population (or progenitor) of SNe Ia by exploring a ‘Fr’ fractional flux value at the positions of the SNe Ia in their host galaxies. Here, following Anderson et al. (2015b), H and R bands are considered. Based on the definition of Fr, Fr = 0 for a SN Ia indicates that the SN Ia locates at the central peak pixel in the H or R-band image of its host galaxy, while Fr = 1 means that the SN Ia explodes in the outer region of its host galaxy, where the H or R-band flux is even equal to the sky value (please see Anderson et al. 2015b for the definition of Fr in details). In other words, a low value of Fr means a relatively young population. In Fig. 10, we show the cumulative distribution of the Fr value for the BL and NL SNe Ia in H and R bands, respectively. Again, the distributions are similar with each other, no matter what the band is. A two-dimensional K-S test gives a possibility of 61.1% that two subsamples are from the same mother sample. In addition, all the host galaxies in Anderson et al. (2015b) are star-forming galaxies, which indicates the more SNe Ia in the sample of Anderson et al. (2015b) belong to young population (see also Meng 2019). However, the number ratio of BL to NL is roughly in the sample of Anderson et al. (2015b), which may be taken as another piece of evidence that the classification for BL and NL SNe Ia is independent of their stellar population.
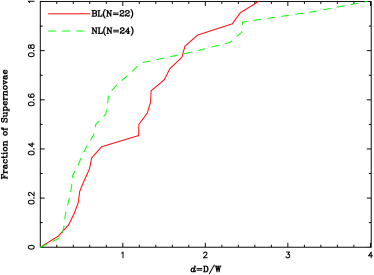
3.8 Distance from spiral arms
Based on the spiral density wave theory, stars form at shock fronts near the edges of spiral arms, as do the newly born SN progenitors (Lin & Shu 1964). Then, the progenitors leaves their birth place until they arrive their explosion site. As a result, the distance of a SN from the arm may be used to constrain the lifetime/population of the SN (Mikhailova et al. 2007; Aramyan et al. 2016). For example, it is found that SNe Ib/c locate closer the leading edges of the spiral arms than SNe II and the distance distribution of SNe Ia relative to the arms have broader wings than those of SNe Ib/c and SNe II (Mikhailova et al. 2007; Aramyan et al. 2016). These facts indicate that SNe Ibc have more massive progenitors than SNe II, and SNe Ia have less massive and older progenitors than CC SNe Ia. In particular, Karapetyan (2022) recently find that the value of the SNe Ia that locates on the arms are typically smaller than those of locating in the interarm region, i.e. on average, the arm SNe Ia are brighter than the interarm ones. The brightness difference between arm and inrerarm SNe Ia are believed from their different ages (Karapetyan (2022) ). In Fig. 11, we show the cumulative distributions of the relative distance from spiral arms for the BL and NL SNe Ia, respectively. Similar to the discussions in above sections, the two distributions are statistically indistinguishable, i.e. a K-S test gives a probability of 21.2% that the two subsample are chosen from the same underlying mother sample.
4 DISCUSSIONS AND CONCLUSIONS
In this paper, we divide SNe Ia into two subclasses based on their REW value, i.e. BL and NL SNe Ia, although the REW distribution of SNe Ia may perfectly fitted by one Gaussian. We want to investigate whether or not there are systemical differences between BL and NL SNe Ia on their environment in host galaxies. We find that comparing with the NL SNe Ia, the distribution of for BL ones has a larger peak, and BL SNe Ia have a larger mean . In addition, for the SNe Ia in spiral galaxies, there seems a trend that the earlier the galaxy type, the larger the number ratio of BL to NL SNe Ia, so do those in early type galaxies. Moreover, on average, BL SNe Ia tend to occur in larger and brighter host galaxies then NL SNe Ia, but the distributions of the size and brightness of the host galaxies between BL and NL SNe Ia are indistinguishable. However, we do not find any significant difference between BL and NL SNe Ia on their environments in their host galaxies, i.e. they have indistinguishable distributions of the fractional radial position, the fractional flux, the NCR pixel vale function and the fractional radial flux at their explosion sites, even similar distance distributions relative to spiral arms. These indistinguishable distributions indicate that BL and NL SNe Ia share the same stellar populations.
In our sample, almost all HV SNe Ia belongs to the BL SNe Ia. Wang et al. (2013) found that HV ones tend to occur in the metal-rich environment, which is confirmed further by Pan et al. (2015) and Pan (2020), who found that HV SNe Ia favor metal-rich massive host galaxies. In addition, Wang et al. (2013) also found that the mean value of the brightness of the HV SNe Ia is slightly dimmer than that of the NV ones. Our discovery that on average, BL SNe Ia are dimmer, and hosted by larger and brighter host galaxies than NL ones are consistent with previous studies. The difference of the brightness between BL and NL SNe Ia could easily associate the higher average value of BL SNe Ia with the higher metallicity of their host galaxies, because it is well known that the global metallicity of a galaxies increase with its size/mass (Henry & Worthey 1999; Tremonti et al. 2004), and a high metallicity leads to a lower production of 56Ni and then a dimmer SN Ia (Timmes et al. 2003)
In observations, the age and metallicity are two factors affecting the properties of SNe Ia (Meng et al. 2015). Many observations have shown that the population age of SNe Ia is a key factor affecting the luminosity of SNe Ia, and the dimmer SNe Ia may have a wide age distribution (Gallagher et al. 2008; Neill et al. 2009; Howell et al. 2009). Base on these observations, one may obtain a conclusion that the average value and range of the luminosity of SNe Ia decrease with their ages. On the other hand, both theory and observation show that a higher metallicity leads to dimmer SNe Ia (Timmes et al. 2003; Howell et al. 2009). In theory, about 25% variation of the peak luminosity of SNe Ia may result from the metallicity, but observations show that metallicity may only contribute tot about 10% variation of the peak luminosity of SNe Ia (Timmes et al. 2003; Howell et al. 2009; Bravo et al. 2010). These could be derived from a kind of degeneracy between the effect of age and metallicity on the brightness of SNe Ia since a high metallicity could also means a relatively younger SNe Ia and then a slightly brighter SNe Ia, whatever its progenitor is (Meng et al. 2011; Meng & Yang 2012). In observations, it is difficult to completely get rid of the effect of the age for the investigations on the correlation between the peak brightness and metallicity of SNe Ia.
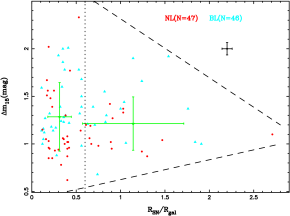
However, considering that the environment may reflect the age information of their populations to some extents (Fruchter et al. 2006; Anderson et al. 2015a), the difference on the average value between BL and NL SNe Ia seems difficult to contribute to the effect of age since there is not a significant difference on the environment in their host galaxies. Especially, Anderson et al. (2015b) divided their SN Ia sample into bright and dim subsamples to investigate the potential difference of their environments within their host galaxies by pixel statistics method, but no statistical significant difference is found. If the metallicity is the main reason of the difference of the average brightness between BL and NL SNe Ia, we would expect that on average, the of the SNe Ia in the inner part of their host galaxies is larger than that in the outer part since on average, the metallicity for all kinds of galaxies systematically decreases outward from their centers (Henry & Worthey 1999). In Fig. 12, we show the relation between and . It is clearly shown in the figure that the scatter of the decrease with , i.e. the peak brightness of SNe Ia varies greater in the inner region of their host galaxies than outer region, as found in Wang et al. (1997) and Riess et al. (1999). Especially, the average value of of SNe Ia in the inner region is larger than that in the outer part by about 0.05 mag, as we expected. At the same time, the 1 statistical error of of the inner SNe Ia is also large than that of the outer ones by about 0.08 mag (Wang et al. 1997; Riess et al. 1999). Nevertheless, it must be emphasized that such a difference on the statistical error of is partly contributed to the age effect.
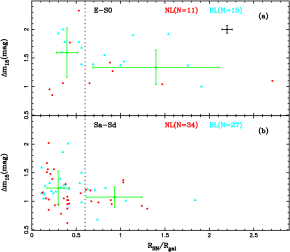
In the above analysis, we mixed the SNe Ia in spiral and elliptical hosts, and such a method can not get rid of the progenitor age effect. Here, we divided the host galaxies of SNe Ia into two classes, i.e. E-S0 and Sa-Sd, which approximatively divides SNe Ia into young and old classes. In Fig. 13, we show the relation between and for the above two classes. The figure shows that the difference of the average between inner and outer SNe Ia is even enlarged compared with that in Fig. 12, and the differences (the average differences between the inner and outer part SNe Ia are 0.25 mag and 0.16 mag for E-S0 and Sa-Sd classes, respectively) are larger enough to explain the average brightness difference between BL and NL SNe Ia shown in Fig. 3. The results in Figs. 12 and 13 indicate that there indeed exists a kind of degeneracy for the effect between the metallicity and progenitor age on the peak brightness of SNe Ia.
The global metallicity of a galaxies increase with its size/mass, and based on the mass - metallicity relation, one may obtain the global gas-phase metallicity (Henry & Worthey 1999; Tremonti et al. 2004; Sullivan et al. 2010). However, such a global mean metallicity could erase the intrinsic information of the population at the explosion site, because the global parameter of a host galaxy may only represent the average information of the stellar population in the host galaxy (Meng 2019). This could be the reason of the fact that on average, BL SNe Ia tend to occur in larger and brighter host galaxies then NL SNe Ia, with the statistically indistinguishable distribution of the brightness and size of the host galaxies for BL and NL SNe Ia. The local gas-phase metallicity around the explosion site of a SN Ia is perfect tracer of the metallicity of the SN Ia (Sullivan et al. 2010; Moreno-Raya et al. 2016). Moreno-Raya et al. (2016) found that the absolute magnitude and color of SNe Ia are well correlated with the local gas-phase oxygen abundance. If the difference of the brightness between BL and NL SNe Ia is derived from their different metallicities, we would expect that the local gas-phase metallicity for BL SNe Ia is statistically higher than those for NL ones. Based on the data in Moreno-Raya et al. (2016), as expected, we notice that the local gas-phase average value of 12 + log(O/H) for BL SNe Ia is , higher than for NL ones. A K-S test shows that the probability that the two subsamples are from the same mother sample is only 4.9%. As a conclusion, the metallicity for BL SNe Ia is statistically larger than that for NL ones. This is consistent with the fact that BL SNe Ia is more possible to occur in elliptical galaxies (Fig. 5). The results here indicate that the progenitor metallicity is a key parameter to affect the photometric and spectroscopic diversities of SNe Ia (Maguire et al. 2012; Wang et al. 2013; Taubenberger 2017).
As far as the progenitor systems are concerned, different pieces of evidence usually favor different progenitor models. For instance, Wang et al. (2019) found that HV SNe Ia have a significant excess flux in blue light 60-100 days past maximum, while NV SNe do not show such an excess blue flux, which indicates that HV SNe Ia are likely from SD systems, while the NV ones may arise from DD systems. However, considering the relation between photospheric velocity and the velocity shift of later-time [Fe II] lines, which indicates an asymmetric explosion for SNe Ia (Maeda et al. 2010; Maguire et al. 2018), Li et al. (2021) suggest the HV and a portion of NV object are from double-detonation model and their different photospheric velocities are from different view angle (see also Pan 2020). Nevertheless, considering the correlation between the progenitor population and the characteristics of the high velocity feature (HVF) of Ca II IR3 absorption feature around maximum light, Meng (2019) suggests that the SD model has a potential to simultaneously explain all the characteristics of HVFs observed. However, we do not notice any significant difference for the environment between BL and NL SNe Ia, although BL SNe Ia are statistically dimmer than NL ones, which seems not to provide a constraint to the progenitors of SNe Ia.
In physics, the REW of the Si II 635.5 nm absorption feature of a SN Ia around maximum light represents the velocity interval of the silicon layer in supernova ejecta to a great extent. Meng et al. (2017) found that, if taking the REW of the Si II 635.5 nm absorption feature of SNe Ia as the parameter describing the SNe Ia, all kinds of SNe Ia follow a universal polarization sequence, which implies that all SNe Ia could share the same explosion mechanism, no matter what their progenitor systems are. If the REW of the Si II 635.5 nm absorption feature of a SN Ia reflects the explosion mechanism of SNe Ia to some extent, our results that there is not difference on the progenitor population of SNe Ia with different REW of the Si II 635.5 nm line imply that no matter what the progenitor systems are, the explosion mechanism of SNe Ia could be similar or the same. The conclusion here is consistent with that suggested by Meng et al. (2017).
In summary, based on the REW of the Si II 635.5 nm line around the maximum light, we divide SNe Ia into BL and NL subsamples, and find that the BL SNe Ia are statistically dimmer than the NL ones. On average, the BL SNe Ia are hosted by brighter and larger host galaxy, and the number ratio of BL to NL SNe Ia increases with their host galaxies becoming early. These facts are possibly derived from the effect of metallicity, i.e. the BL SNe Ia have a higher metallicity than the NL ones. However, according to pixel statistics study, we do not find any potential difference of the explosion environment around the explosion sites between BL and NL SNe Ia. These results indicate that all SNe Ia could share the same/similar explosion mechanism, which does not depend on their stellar population.
Acknowledgments
This work was supported by the National Key R&D Program of China with No. 2021YFA1600403, and the NSFC (Nos. 11973080 and 11733008). XM acknowledges science research grants from the China Manned Space Project, no. CMS - CSST - 2021 - B07. XM acknowledges support from the Yunnan Ten Thousand Talents Plan - Young & Elite Talents Project, and the CAS ‘Light of West China’ Program. J.Z. is supported NSFC (grants 12173082, 11773067 ), the CAS ‘Light of West China’ Program and the Ten Thousand Talents Program of Yunnan for Top-notch Young Talents. We acknowledge the usage of the HyperLeda database (http://leda.univ-lyon1.fr)
References
- Anderson & James (2008) Anderson, J. P., & James, P. A., 2008, MNRAS, 390, 1527
- Anderson et al. (2015a) Anderson, J. P., James, P. A., Habergham, S. M., Galbany, L., Kuncarayakti, H., 2015a, PASA, 32, 19
- Anderson et al. (2015b) Anderson, J. P., James, P. A., Förster, F. et al., 2015b, MNRAS, 448, 732
- Arnett (1982) Arnett W.D., 1982, ApJ, 253, 785
- Aramyan et al. (2016) Aramyan, L. S., Hakobyan, A. A., Petrosian, A. R. et al., 2016, MNRAS, 459, 3130
- Ashall et al. (2016) Ashall, C., Mazzali, P., Sasdelli, M., Prentice, S. J., 2016, MNRAS, 460, 3529
- Benetti et al. (2005) Benetti, S., Cappellaro, E., Mazzali, P. A. et al., 2005, ApJ, 623, 1011
- Blondin et al. (2012) Blondin, S., Matheson, T., Kirshner, R. P. et al., 2012, AJ, 143, 126
- Branch et al. (1993) Branch, D., Fisher, A., Nugent, P., 1993, AJ, 106, 2383
- Branch (1998) Branch, D., 1998, ARA&A, 36, 17
- Branch et al. (2009) Branch, D., Dang, L. C., & Baron, E. 2009, PASP, 121, 238
- Brandt et al. (2010) Brandt, T. D., Tojeiro, R., Aubourg, E., et al. 2010, AJ, 140, 804
- Bravo et al. (2010) Bravo E., Domiínguez I., Badenes C., Piersanti L., Straniero O., 2010, ApJ, 711, L66
- Cameron (2011) Cameron, E., 2011, PASA, 28, 128
- Cappellaro et al. (1997) Cappellaro, E., Turatto, M., Tsvetkov, D.Y., Bartunov, O.S., Pollas, C., Evans, R., Hamuy, M., 1997, A&A, 322,431
- Cappellaro et al. (1999) Cappellaro, E. Evans, R., Turatto, M., 1999, A&A, 351, 459
- Doull & Baron (2011) Doull, B. A. & Baron, E., 2011, PASP, 123, 765
- Filippenko et al. (1992a) Filippenko, A.V., Richmond, M.W., Branch, D., et al., 1992a, AJ, 104, 1543
- Filippenko et al. (1992b) Filippenko, A. V., Richmond, M. W., Matheson, T., et al., 1992, ApJ, 384, L15
- Fruchter et al. (2006) Fruchter, A. S., Levan, A. J., Strolger, L. et al., 2006, Nature, 441, 463
- Gallagher et al. (2008) Gallagher, J. S., Garnavich, P. M., Caldwell, N., et al. 2008, ApJ, 685, 752
- Gall et al. (2018) Gall, C., Stritzinger, M. D., Ashall, C. et al., 2018, A&A, 611, A85
- Goobar & Leibundgut (2011) Goobar, A. & Leibundgut, B., 2011, ARNPS, 61, 251
- Hakobyan et al. (2016) Hakobyan, A. A., Karapetyan, A. G., Barkhudaryan, L. V. et al., 2016, MNRAS, 456, 2848
- Hamuy et al. (1996) Hamuy M., Phillips M.M., Schommer R.A., Schommer R.A.,Suntzeff N.B., Maza J., Avilés R., 1996, AJ, 112, 2391
- Hicken et al. (2009) Hicken, M., Challis, P., Jha, S. et al., 2009, ApJ, 700, 331
- Hillebrandt & Niemeyer (2000) Hillebrandt, W., Niemeyer, J.C., 2000, ARA&A, 38, 191
- Hillebrandt et al. (2013) Hillebrandt, W., Kromer, M., Röpke, F. K., Ruiter, A. J., 2013, FrPhy, 8, 116
- Heringer et al. (2017) Heringer, E., van Kerkwijk, M. H., Sim, S. A., Kerzendorf, W. E., 2017, ApJ, 846, 15
- Henry & Worthey (1999) Henry, R. B. C. & Worthey, G., 1999, PASP, 111, 919
- Hoeflich et al. (1996) Hoeflich, P., Khokhlov, A., Wheeler, J. C., et al. 1996, ApJL, 472, L81
- Howell et al. (2009) Howell, D.A. et al., 2009, ApJ, 691, 661
- Hoyle & Fowler (1960) Hoyle, F. & Fowler, W.A., 1960, ApJ, 132, 565
- Iben & Tutukov (1984) Iben, I., Tutukov, A.V., 1984, ApJS, 54, 335
- Jha et al. (2019) Jha S. W., Maguire K., Sullivan M., 2019, NatAs, 3, 706
- Ilkov & Soker (2012) Ilkov, M., Soker, N., 2012, MNRAS, 419, 1695
- Jha, Maguire & Sullivan (2019) Jha S. W., Maguire K., Sullivan M., 2019, NatAs, 3, 706
- Karapetyan (2022) Karapetyan, A. G., 2022, MNRAS Letter, in press, arXiv: 2209.14796
- Kennicutt (1998) Kennicutt, R. C., 1998, ARA&A, 36, 189
- Leibundgut et al. (1993) Leibundgut, B., Kirshner, R. P., Phillips, M. M., et al., 1993, AJ, 105, 301
- Li et al. (2011a) Li, W.-D., Bloom, J. S., Podsiadlowski, Ph. et al., 2011a, Nature, 480, 348
- Li et al. (2011b) Li, W. D., Leaman, J., Chornock, R., et al. 2011b, MNRAS, 412, 1441
- Li et al. (2021) Li, W., Wang, X., Bulla, M., et al., 2021, ApJ, 906, 99
- Li et al. (2022) Li, Z., Zhang, T., Wang, X. et al., 2022, ApJ, 927, 142
- Lin & Shu (1964) Lin, C. C. & Shu, F. H., 1964, ApJ, 140, 646
- Livne (1990) Livne, E. 1990, ApJL, 354, L53
- Maoz, Mannucci & Nelemans (2014) Maoz D., Mannucci F., Nelemans G., 2014, ARA&A, 52, 107
- Maeda et al. (2010) Maeda, K., Benetti, S., Stritzinger, M., et al. 2010, Natur, 466, 82
- Maguire et al. (2012) Maguire, K., Sullivan, M., Ellis, R. S. et al., 2012, MNRAS, 426, 2359
- Maguire et al. (2018) Maguire, K., Sim, S. A., Shingles, L., et al. 2018, MNRAS, 477, 3567
- Makarov et al. (2014) Makarov D., Prugniel P., Terekhova N., Courtois H., & Vauglin I., 2014, A&A, 570, A13
- McCully et al. (2014) McCully, C., Jha, S. W., Foley, R. J. et al., 2014, Nature, 512, 54
- Meng et al. (2011) Meng, X., Li, Z., Yang, W., 2011, PASJ, 63, L31
- Meng & Yang (2012) Meng X., & Yang W., 2012, A&A, 543, A137
- Meng et al. (2015) Meng X., Gao Y., Han Z., 2015, IJMPD, 24, 14, 1530029
- Meng et al. (2017) Meng, X., Zhang, J., Han, Z., 2017, ApJ, 841, 62 (Paper I)
- Meng (2019) Meng, X., 2019, ApJ, 886, 58
- Mikhailova et al. (2007) Mikhailova, G. A., Bartunov, O. S., Tsvetkov, D. Y., 2007, AstL, 33, 715
- Moreno-Raya et al. (2016) Moreno-Raya, M. E., López-Sánchez, Á. R., Mollá, M. et al., 2016, MNRAS, 462, 1281
- NASA/IPAC Extragalactic Database (NED) (2019) NASA/IPAC Extragalactic Database (NED), 2019, NASA/IPAC Extragalactic Database, Last Accessed: today, IPAC, doi:10.26132/ned1
- Neill et al. (2009) Neill, J. D., Sullivan, M., Howell, D. A., et al. 2009, ApJ, 707, 1449
- Nomoto, Thielemann & Yokoi (1984) Nomoto, K., Thielemann, F-K., Yokoi, K., 1984, ApJ, 286, 644
- Pan et al. (2015) Pan, Y., Sullivan, M., Maguire, K., et al. 2015, MNRAS, 446, 354
- Pan (2020) Pan, Y., 2020, ApJL, 895, L5
- Parrent et al. (2014) Parrent, J., Friesen, B., Parthasarathy, M., 2014, Ap&SS, 351,1
- Podsiadlowski et al. (2008) Podsiadlowski, P., Mazzali, P., Lesaffre, P., Han, Z., & Förster F. 2008, New Astron. Rev., 52, 381
- Perlmutter et al. (1999) Perlmutter, S. et al., 1999, ApJ, 517, 565
- Phillips et al. (1992) Phillips, M. M., Wells, L. A., Suntzeff, N. B., et la., 1992, AJ, 103, 1632
- Phillips (1993) Phillips M.M., 1993, ApJ, 413, L105
- Riess et al. (1996) Riess, A., Press, W. H., Kirshner, R. P., 1996, ApJ, 473, 88
- Riess et al. (1998) Riess, A., Filippenko, A. V., Challis, P., et al., 1998, AJ, 116, 1009
- Riess et al. (1999) Riess, A., Kirshner, R. P., Schmidt, B. P., et al., 1999, AJ, 117, 707
- Roberts & Haynes (1994) Roberts, M.S., Haynes, M.P., 1994, ARA&A, 32, 115
- Ruiz-Lapuente (2019) Ruiz-Lapuente P., 2019, NewAR, 850, 1523
- Shen & Moore (2014) Shen, K., & Moore, K. 2014, ApJ, 797, 46
- Silverman et al. (2012) Silverman, J. M., Kong, J. J., & Filippenko, A. V. 2012, MNRAS, 425, 1819
- Sullivan et al. (2010) Sullivan M., Conley, A., Howell D. A. et al., 2010, MNRAS, 406, 782
- Timmes et al. (2003) Timmes F.X., Brown E.F., Truran J.W., 2003, ApJ, 590, L83
- Taubenberger (2017) Taubenberger S., 2017, Handbook of Supernovae, Springer International Publishing AG, p. 317
- Tremonti et al. (2004) Tremonti, C. A., Heckman, T. M., Kauffmann, G. et al., 2004, ApJ, 613, 898
- Wang et al. (1997) Wang, L., Höflich, P., Wheeler, J.C., 1997, ApJ, 483, L29
- Wang & Wheeler (2008) Wang, L., & Wheeler, J. C. 2008, ARA&A, 46, 433
- Wang et al. (2009) Wang, X., Filippenko, A. V., Ganeshalingam, M. et al., 2009, ApJ, 699, L139
- Wang et al. (2013) Wang, X., Wang, L., Filippenko, A. V., et al. 2013, Sci, 340, 170
- Wang et al. (2019) Wang, X., Chen, J., Wang, L. et al., 2019, ApJ, 882, 120
- Wang & Han (2012) Wang, B., Han, Z., 2012, NewAR, 56, 122
- Webbink (1984) Webbink, R.F., 1984, ApJ, 277, 355
- Whelan & Iben (1973) Whelan, J., Iben, I., 1973, ApJ, 186, 1007
- Woosley & Weaver (1994) Woosley, S. E., & Weaver, T. A. 1994, ApJ, 423, 371
- Zhang et al. (2014) Zhang, J., Wang, X., Bai, J. et al., 2014, AJ, 148, 1
- Zhang et al. (2016) Zhang, J., Wang, X., Sasdelli, M. et al,, 2016, ApJ, 817, 114