Plasmoids, Flows, and Jets During Magnetic Reconnection in a Failed Solar Eruption
Abstract
We report a detailed analysis of a failed eruption and flare in active region 12018 on 2014 April 3 using multiwavelength observations from SDO/AIA, IRIS, STEREO, and Hinode/SOT. At least four jets were observed to emanate from the cusp of this small active region (large bright point) with a null-point topology during the two hours prior to the slow rise of a filament. During the filament slow rise multiple plasma blobs were seen, most likely formed in a null-point current sheet near the cusp. The subsequent filament eruption, which was outside the IRIS field of view, was accompanied by a flare but remained confined. During the explosive flare reconnection phase, additional blobs appeared repetitively and moved bidirectionally within the flaring region below the erupting filament. The filament kinked, rotated, and underwent leg-leg reconnection as it rose, yet it failed to produce a coronal mass ejection. Tiny jet-like features in the fan loops were detected during the filament slow-rise/pre-flare phase. We interpret them as signatures of reconnection between the ambient magnetic field and the plasmoids leaving the null-point sheet and streaming along the fan loops. We contrast our interpretation of these tiny jets, which occur within the large-scale context of a failed filament eruption, with the local nanoflare-heating scenario proposed by Antolin et al. (2021).
1 INTRODUCTION
Coronal bright points are the main sources of coronal jets on a wide range of scales, from barely resolved features in coronal holes and quiet-Sun to small active regions (Raouafi et al., 2016). These jets are often associated with eruptions from a filament channel, with or without a filament (Sterling et al., 2015; Kumar et al., 2019b). The magnetic structure of most bright points is that of an embedded bipole, consisting of a fan of loops bounded by a dome-shaped separatrix surmounted by a null point. A spine line passes through the null, leading to the term “fan-spine” topology for this configuration (Shibata et al., 1994; Priest & Titov, 1996). Slow reconnection between the closed field above the filament channel and the ambient open field, at the current sheet created by deformation of the null, generates faint jets along with opening of the field lines. This slow reconnection associated with the null is a key feature of the breakout model for coronal eruptions on all scales (Antiochos et al., 1999; Wyper et al., 2017), and is hereafter denoted breakout reconnection at the breakout current sheet (BCS). Reconnection at the BCS has been inferred from EUV observations (Kumar et al., 2018, 2019a, 2021) and directly observed in numerical magnetohydrodynamics (MHD) simulations (Wyper et al., 2017, 2018, 2021) of coronal jets. Multiple blobs and bidirectional jets in the BCS have been observed in Solar Dynamics Observatory/Atmospheric Imaging Assembly (SDO/AIA; Lemen et al. 2012) and Interface Region Imaging Spectrograph (IRIS; De Pontieu et al. 2014) images before the onset of explosive flare reconnection (Kumar et al., 2019a). These blobs, which are commonly interpreted as plasmoids or magnetic islands, initially appear near the main BCS null, propagate along the BCS, and continue onto the separatrix dome. Magnetic reconnection at a flare current sheet (FCS) that forms underneath the rising filament builds the encompassing flux rope. The onset of fast flare reconnection is often associated with bidirectionally traveling blobs in the FCS, interpreted as plasmoids. Explosive breakout reconnection destroys the flux rope when it encounters the BCS and produces untwisting jets (Wyper et al., 2017, 2018; Kumar et al., 2018). Before and after eruptive activity, these null-point topologies often produce cool coronal rain emanating from the null point, most likely due to slow interchange reconnection (Mason et al., 2019; Kumar et al., 2019b, 2021). Although a continuum of eruptive events (jets to coronal mass ejections) has been detected from bipolar coronal bright points to complex, multipolar active regions (ARs), it is still unclear why some eruptions are successful while others remain confined. Therefore, understanding failed eruptions is essential to understand the overall eruption process.
We analyzed in depth multi-spacecraft observations of a jet followed by a failed eruption from a small active region, NOAA 12018, on 2014 April 3. Our comprehensive analysis of this event utilized data from the SDO/AIA, IRIS, and Solar TErrestrial RElations Observatory (STEREO) SECCHI-A (Ahead; Wuelser et al. 2004; Howard et al. 2008) missions, providing both high-resolution multithermal coronal imaging over large fields of view (FOVs) and higher-resolution imaging of cooler plasma within a limited FOV. Antolin et al. (2021) reported tiny jet-like features along and transverse to coronal loops during the early phase of the filament eruption, and interpreted them as nanojets associated with nanoflares (Parker, 1988; Klimchuk, 2015). Their study utilized only the IRIS and reduced AIA fields of view encompassing the southern portion of the configuration. In contrast, we conclude that the flows, heating, and plasmoids detected in the EUV were generated by the failed filament eruption that produced a flare without a coronal mass ejection (CME).
2 OBSERVATIONS
We analyzed SDO/AIA full-disk images of the Sun (field-of-view 1.3 R⊙) with a spatial resolution of 1.5 (0.6 pixel-1) and a cadence of 12 s, in the following channels: 304 Å (He II, at temperature MK), 171 Å (Fe IX, MK), 193 Å (Fe XII, Fe XXIV, MK and MK), 211 Å (Fe XIV, MK), AIA 94 Å (Fe X, Fe XVIII, 1 MK, 6.3 MK), and 131 Å (Fe VIII, Fe XXI, Fe XXIII, i.e., 0.4, 10, 16 MK) images. A noise-gating technique (DeForest, 2017) was used to reduce noise in the SDO/AIA images. We also examined available IRIS slit-jaw images (18-s cadence, 0.16 pixel-1) of the jet source region in the 1400 Å (Si IV, log T (K) = 3.7-5.2) channel. We also utilized simultaneous Hinode Solar Optical Telescope (SOT: Tsuneta et al. 2008) Ca II H line observation (0.1 pixel-1) of the source region. STEREO-A observed the same AR on the disk. We used STEREO-A/Extreme UltraViolet Imager (EUVI-A) 195 Å images (10-min cadence) to view the magnetic topology of the active region from a different angle. The separation angle between SDO and STEREO-A was 155∘ on 2014 April 3. The size of the EUVI-A image is 20482048 pixels (1.6 pixel-1), covering a field of view out to 1.7 R☉.
2.1 Magnetic configuration and pre-eruption activity
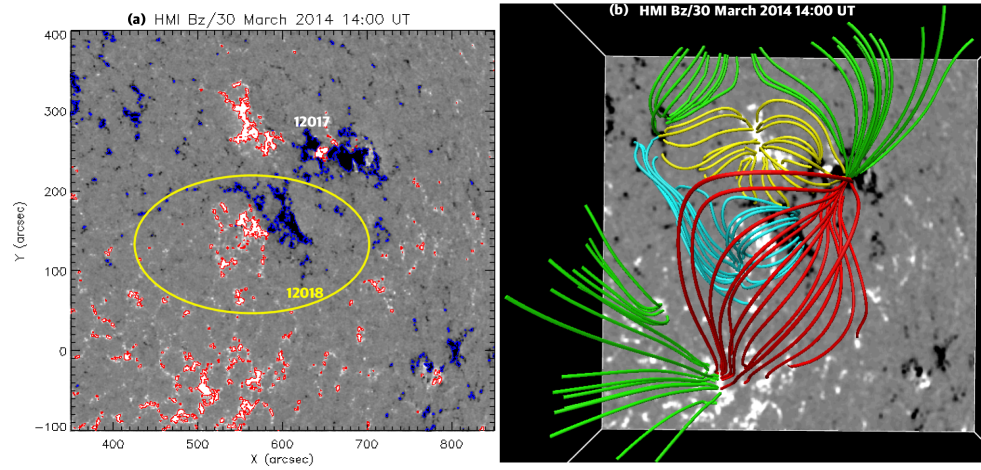
To determine the magnetic topology of the source region, we utilized a potential-field extrapolation code (Nakagawa & Raadu, 1972) from the GX simulator package of SSWIDL (Nita et al., 2015). The code was applied to data obtained by SDO’s Helioseismic and Magnetic Imager (HMI; Scherrer et al., 2012) on 2014 March 30 (Figure 1(a)), four days prior to the failed eruption. The potential-field extrapolation (Fig. 1b) of AR 12018 reveals the fan-spine topology (cyan color) at the filament eruption site and significant flux (red) overlying the eruption site in AR 12018 (cyan). The northern footpoints of these overlying arcades were connected to the sunspot (1200 G) in AR 12017. AIA 193 and STEREO EUVI-A 195 Å images (Figure 1c,d) show NOAA 12018 from two different viewing angles. AIA covered the eastern part of the active region, while the western part was behind the limb (Figure 1(c)). The IRIS FOV (white box in Figure 1(c)) covered only the southern loops. The STEREO image shows the complete AR 12018, consisting of two filaments F1 and F2 (Figure 1(c, d)). F1 was located along the eastern polarity inversion line (PIL) and F2 lay along the western PIL (marked by white arrows in (c) and (d), respectively). F2 was not visible in the AIA because it was behind the limb. F1 was not clearly seen in the AIA images, due to blockage by a foreground filament outside the AR, so only the top of the activated filament was clearly visible to AIA. A portion of F1 erupted but failed to produce a CME, whereas F2 remained stationary.
To determine the 3D coordinates of the identical structures in the AIA and STEREO fields of view, we used the scc_measure routine available in SSWIDL. In Figure 1(c) and (d), the southern loop system is marked by blue plus symbols, the red plus signs indicate a pre-eruption jet, and the yellow arrow marks the cusp. Note that the cusp is near the top of filament F1. The apparent position of the cusp beneath part of F1 is due to projection effects. A system of loops (green plus signs) appears north of the AR. We infer that AR 12018 had a fan-spine magnetic geometry (dome width 50), with a pre-eruptive null about 50-60 above the photosphere.
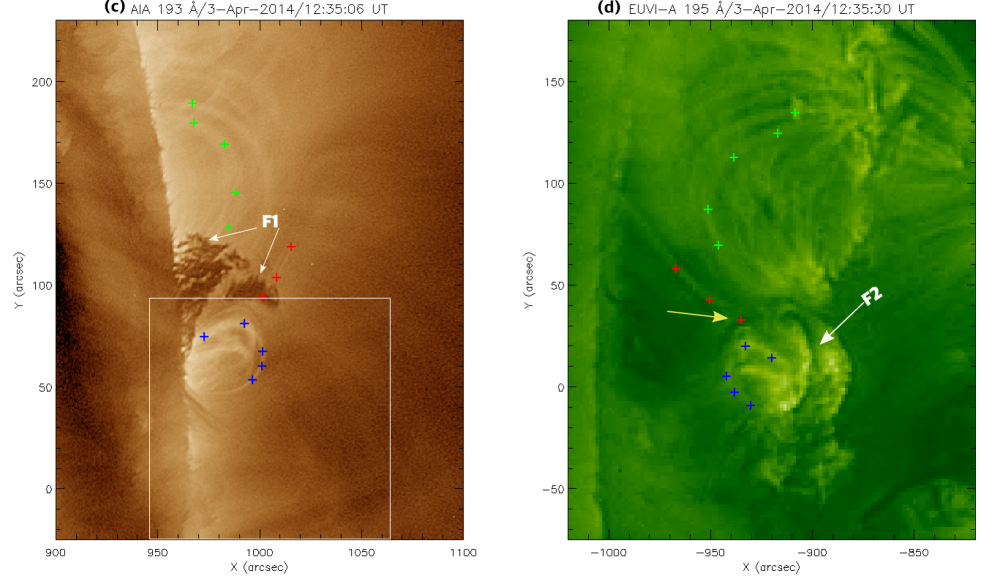
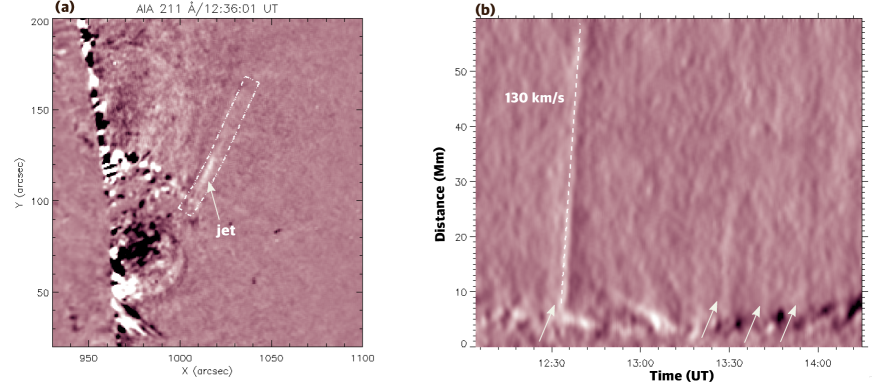
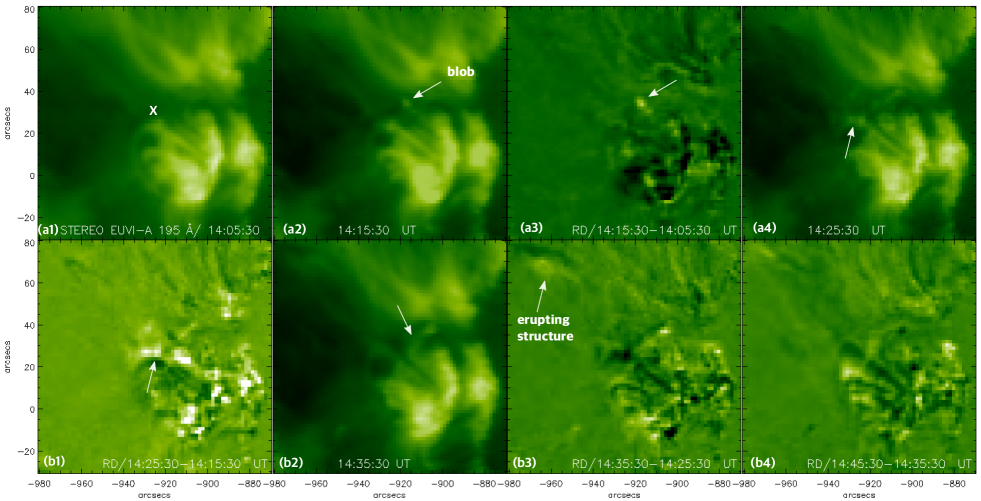
During the two hours prior to the slow rise of F1, we observed repeated pre-eruption jets originating from the cusp region (Figure 2(a)). AIA 211 Å running-difference images and the accompanying movie reveal first jet onset at 12:35 UT (speed 130 km s-1) and at least three faint jets between 13:30-14:00 (marked by arrows in the TD plot, Figure 2(b)). STEREO EUVI-A images also reveal the same narrow jets emanating from the cusp (Figure 2(c-e)). The faint reverse-drift features in the TD plot are coronal rain plasma draining from the top of the cusp, better seen in the AIA 304 Å channel.
2.2 Filament activation and slow rise
The EUVI-A images captured more activity near the cusp after the pre-eruption jets mentioned above. A bright blob was detected north of the cusp (white arrows in Figure 3(a2,a3)) at 14:15:30 UT. Over an hour later, the southern arcade expanded and a small brightening appeared near the cusp at 14:25:30 UT (Figure 3(a4,b1)). In the next image in the sequence, a bright loop appeared above filament F2, on the other side of the PIL (Figure 3(b2), marked by an arrow). Some of the southern loops opened during this phase, as shown in the running-difference plots (Figure 3(b2) and accompanying animation). A structure above the cusp erupted at 14:35:30 UT (Figure 3b2,b3).
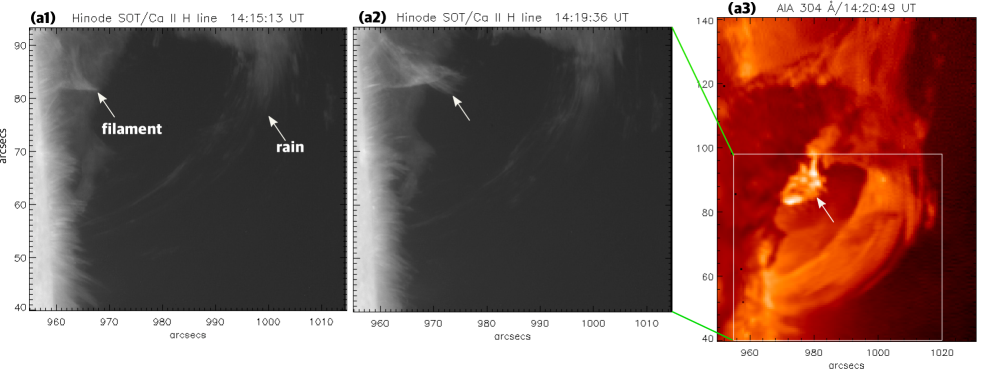
The Hinode/SOT images and accompanying movie show initial activation of filament F1 at 14:15 UT (marked by arrows in Figure 4(a2,a3)). The filament disappeared from the SOT field of view at 14:28 UT, before SOT observations ended at 14:30 UT. Coronal rain was also observed along the southern loop system. These dynamic features are visible most clearly in the animation accompanying Figure 4.
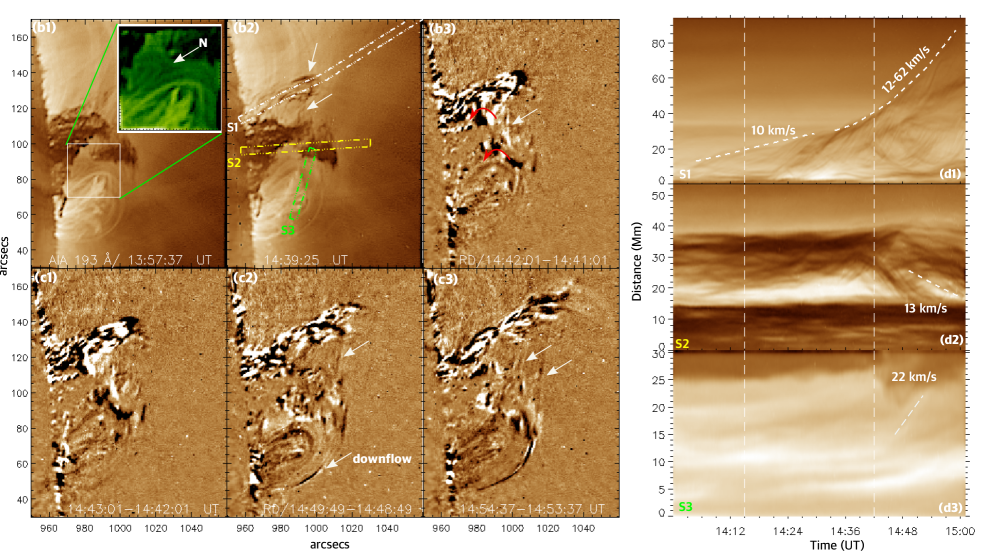
Interestingly, the AIA 193 Å image at 13:57:37 UT (Figure 4(b1)) reveals a likely null point (N) and part of the quasi-circular arcade above F2, located behind the limb. AIA 193 Å running-difference images at around 14:10 UT and the accompanying movie reveal the slow rise of F1. The activated filament, seen in the Hinode/SOT field of view at 14:15 and 14:19 UT, looks like it is a part of F1 (Figure 4(a1,a2)). The accompanying movie shows the rotation of the southern threads (marked by arrows, Figure 4(b2,b3,b4)) of the rising filament. Tracking of the black and white features in the running-difference movie accompanying Figure 4 suggests counterclockwise rotation of the rising filament segment. The presence of multiple threads (Figure 4(c3)) indicates a clear connection between the rising F1 and the southern segment of the filament channel. Along with rain and multiple plasma blobs (Figure 5), we see downflows along the southern loops (Figure 4(c2,c3)).
The 193 Å TD intensity plot along slice S1 shows the slow rise ( 10 km s-1) of filament F1 in absorption during 14:10-14:35 UT. As the filament accelerated from 12 km s-1to 62 km s-1(14:40-15:00 UT), blobs and downflows appeared (Figure 4(d1)). The filament segment near the cusp (slice S2) rotated (Figure 4(b3)) and some of the cool plasma drained along one leg with 13 km s-1(Figure 4(d2)). The southern arcade rose slowly in the interval 14:15-14:42 UT, as revealed by the TD plot of slice S3 (Figure 4(d3)), followed by a sudden rise ( 22 km s-1) and disappearance of loops during rotation/contraction of the prominence segment.
2.3 Blobs and flows during the filament eruption
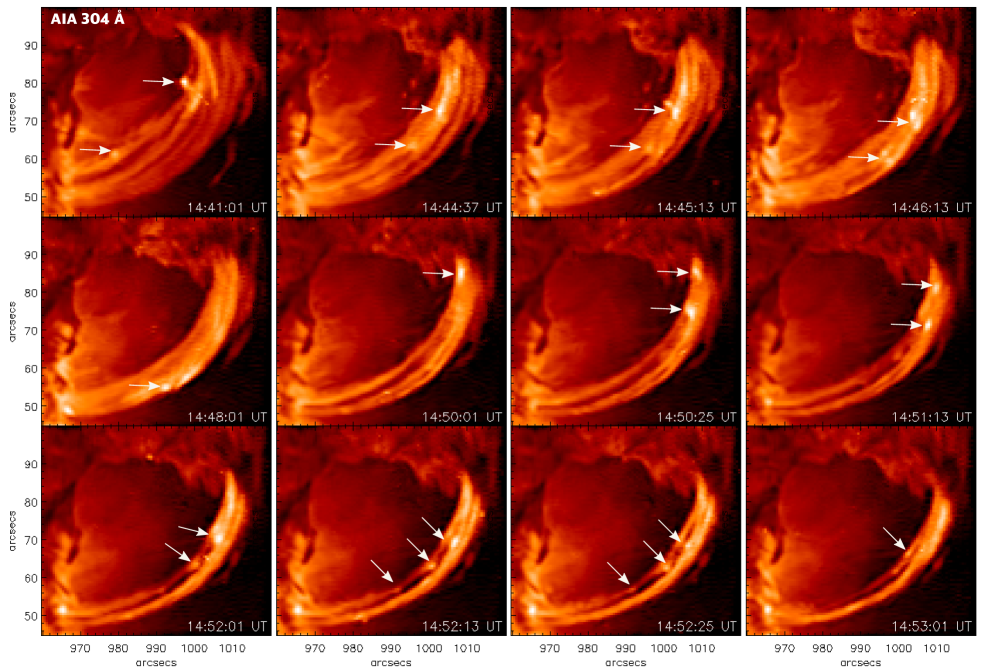
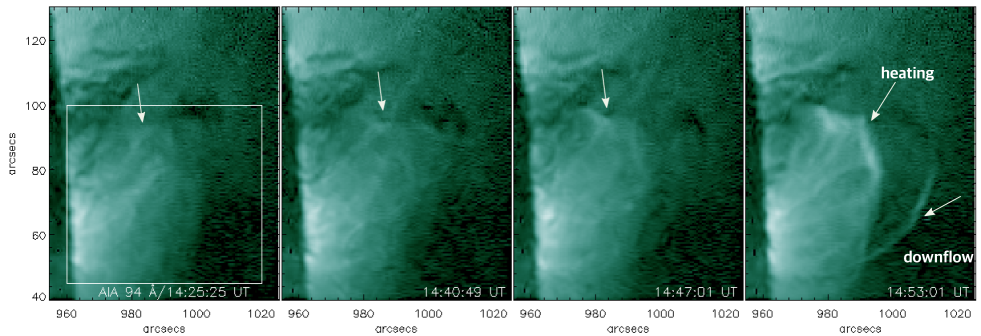
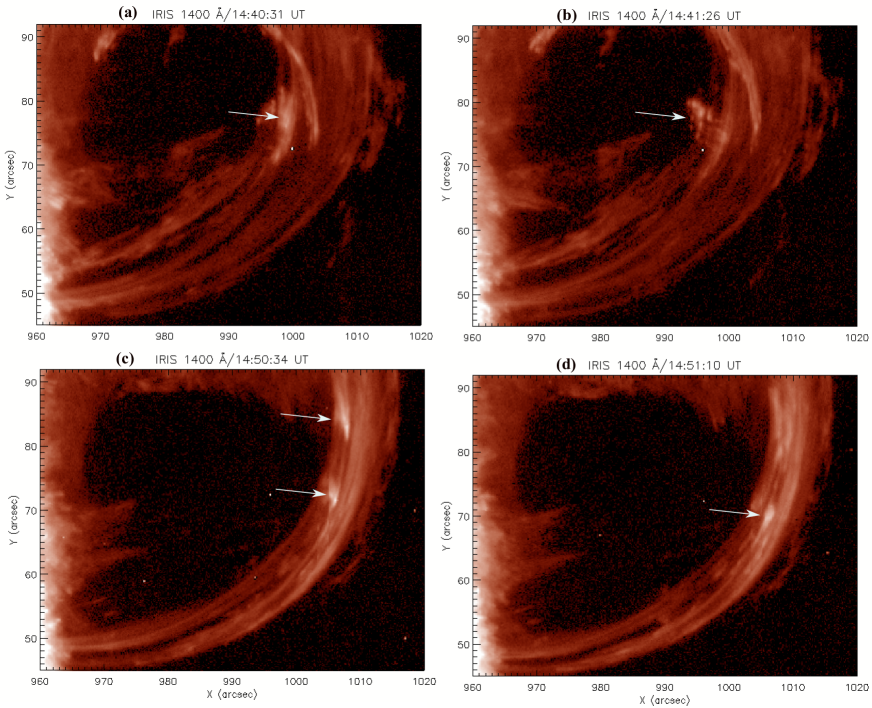
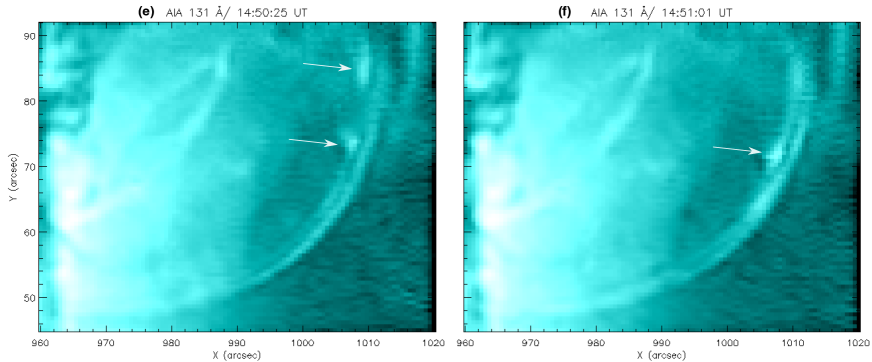
Images in AIA 304 Å and hotter channels (131, 171, 193 Å) reveal multiple plasma blobs (marked by arrows in Figure 5) originating near the cusp and travelling along the loops during 14:41-14:53 UT. IRIS 1400 Å high-resolution images show some of the selected blobs (Figure 6). The nanojets (transient unidirectional jet-like features perpendicular to the loop) reported by Antolin et al. (2021) were observed in the same time interval. Most blobs have widths 2-3 and are accompanied by hot plasma flows along the loops.
AIA 94 Å images exhibit flows and transient heating near the cusp (marked by arrows in Figure 5 bottom panels) during 14:25-14:50 UT. The flows from the vicinity of the cusp are consistent with the flows and blob seen in the STEREO EUVI images (Figure 3(a4, b1)), and are more easily seen in the accompanying animations. Heating of the loops below the cusp and downflows along the dome were observed during 14:25-14:53 UT.
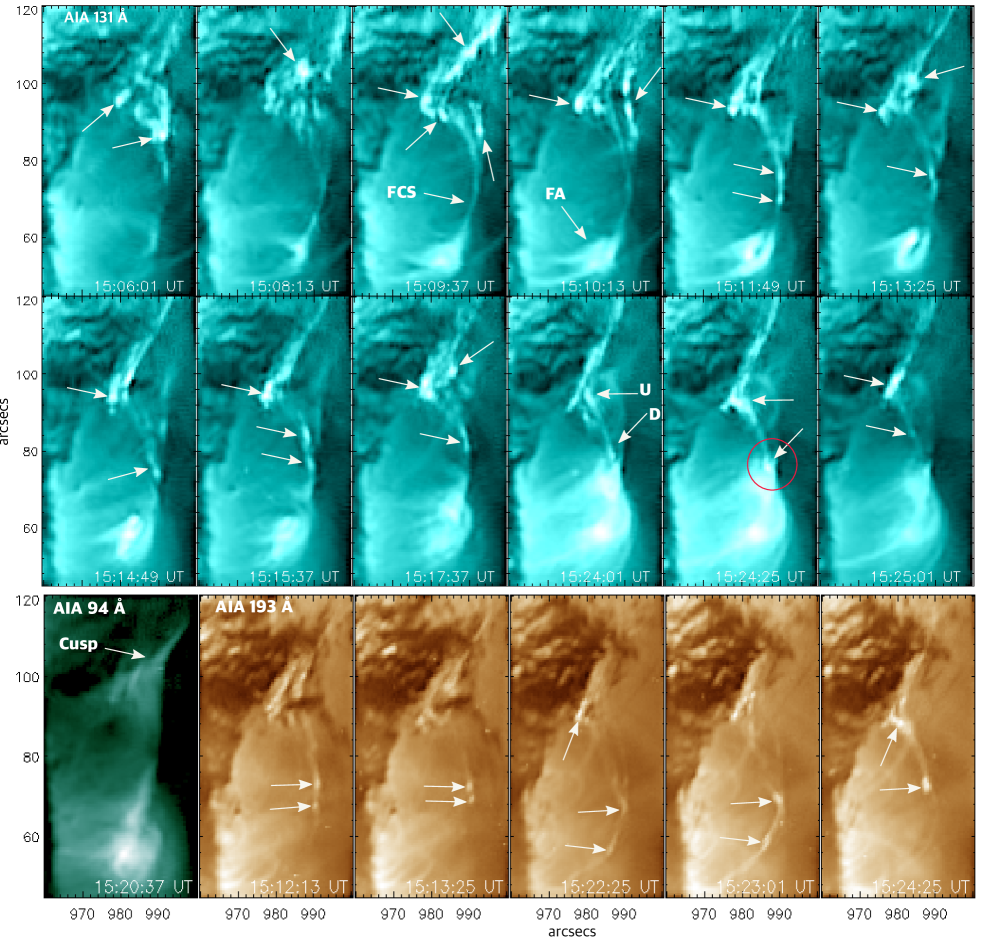
Flaring begins at 14:55 UT with the appearance of multiple blobs near the cusp (see animation accompanying Figure 7), seen in several AIA channels (304, 171, 193, 131 Å). A non-radial plasma sheet structure was observed inside the dome at 15:05 UT onward (Figure 8 top panels). Multiple plasma blobs (width 2-3) were detected along the plasma sheet (marked by arrows in Figure 8) until 15:38 UT. These blobs are similar in size to the blobs seen during the earlier episode of activity (Figure 5). Some of the blobs merge near the cusp and show evidence of heating and/or increased density. Hot flare arcades (FA) appear 15:08 UT onward. A few of the blobs move down (marked by D, Figure 8) along the plasma sheet and collide with the top of the flare arcade (red circle, Figure 8). The plasma sheet disappeared around 15:28 UT. The outflows and some of the blobs near the cusp were also detected in the 94 Å channel, where the cusp appears most clearly (Figure 8). On the other hand, the multiple bidirectional blobs in the plasma sheet appear most clearly in the 193 Å images (Figure 8 bottom panels).
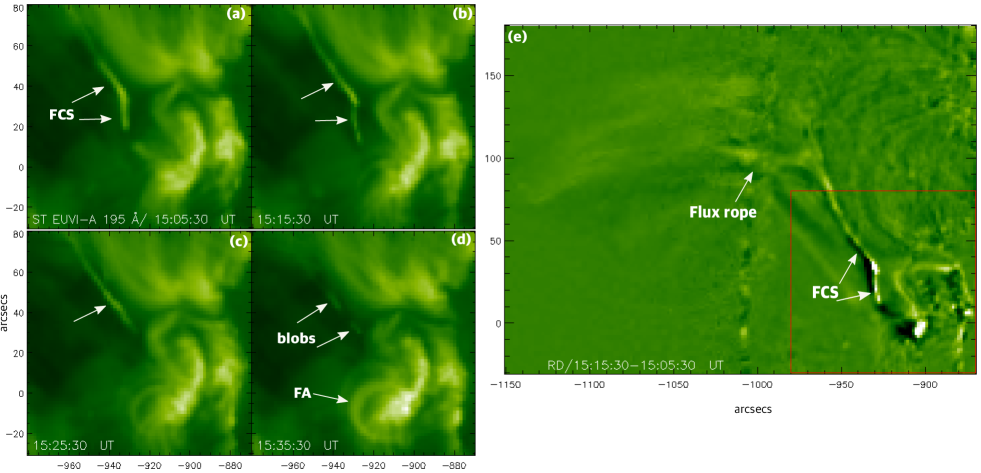
The different point of view of the EUVI-A images, in which the AR is on the disk near the east limb, enables clearer delineation of key features in the region of interest. In particular, EUVI-A 195 Å images reveal a bright plasma sheet (denoted FCS, marked by arrows in Figure 9) that extends 20-25 below the cusp and up to 40-50 above the cusp. We also observed some blobs in the vertical FCS (Figure 9(d)). The non-radial plasma sheet below the cusp is the same plasma sheet seen in the AIA 131 Å channel (Figure 8). The extended part of the FCS above the cusp is less clear in the AIA data (due to projection), but the STEREO images confirm the plasma sheet below the rising ejection (Figure 9(e)).
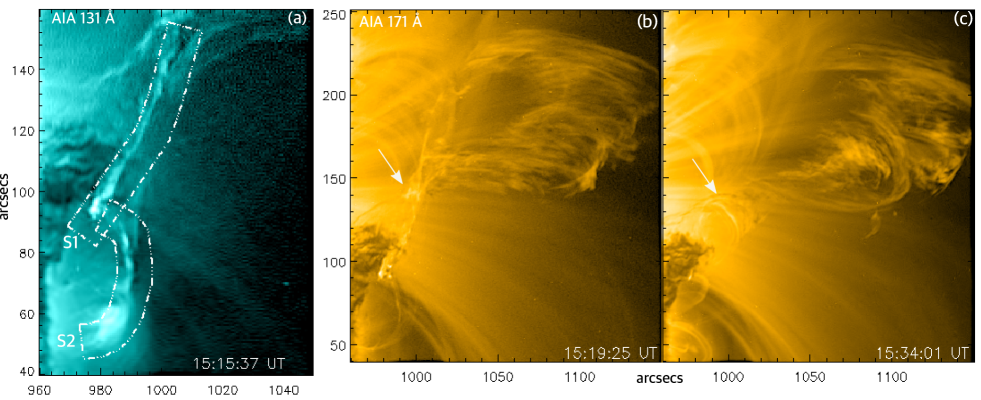
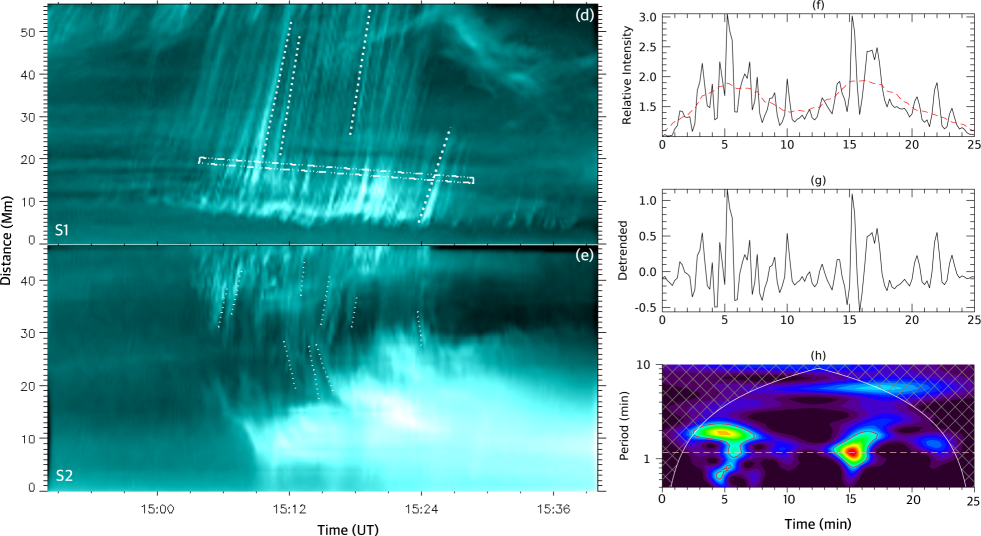
To determine the speed of the blobs moving along the plasma sheet, we tracked selected blob paths in the TD intensity maps (Figure 10(d,e)) along two slits outlined in Figure 10(a). Some of the blobs moving upward from the cusp along slit S1 (marked by dotted lines, Figure 10(d)) have speeds around 150-270 km s-1. Upward-moving blobs along S2 (marked by dotted lines, Figure 10(e)) in the curved plasma sheet have speeds around 148-285 km s-1, whereas the measured downward-moving blobs travel at 98-270 km s-1.
The relative intensity of blobs and outflows along the slit shows a quasiperiodic pattern (Figure 10(f-h)). To obtain a detrended light curve for the wavelet analysis, we subtracted the red dashed pattern from the original light curve. A wavelet analysis of the detrended light curve reveals a period 70 s (pink dashed line) with 99% significance. Similar periods were detected for the upward- and downward-moving blobs in the plasma sheet.
2.4 Flare and associated activity
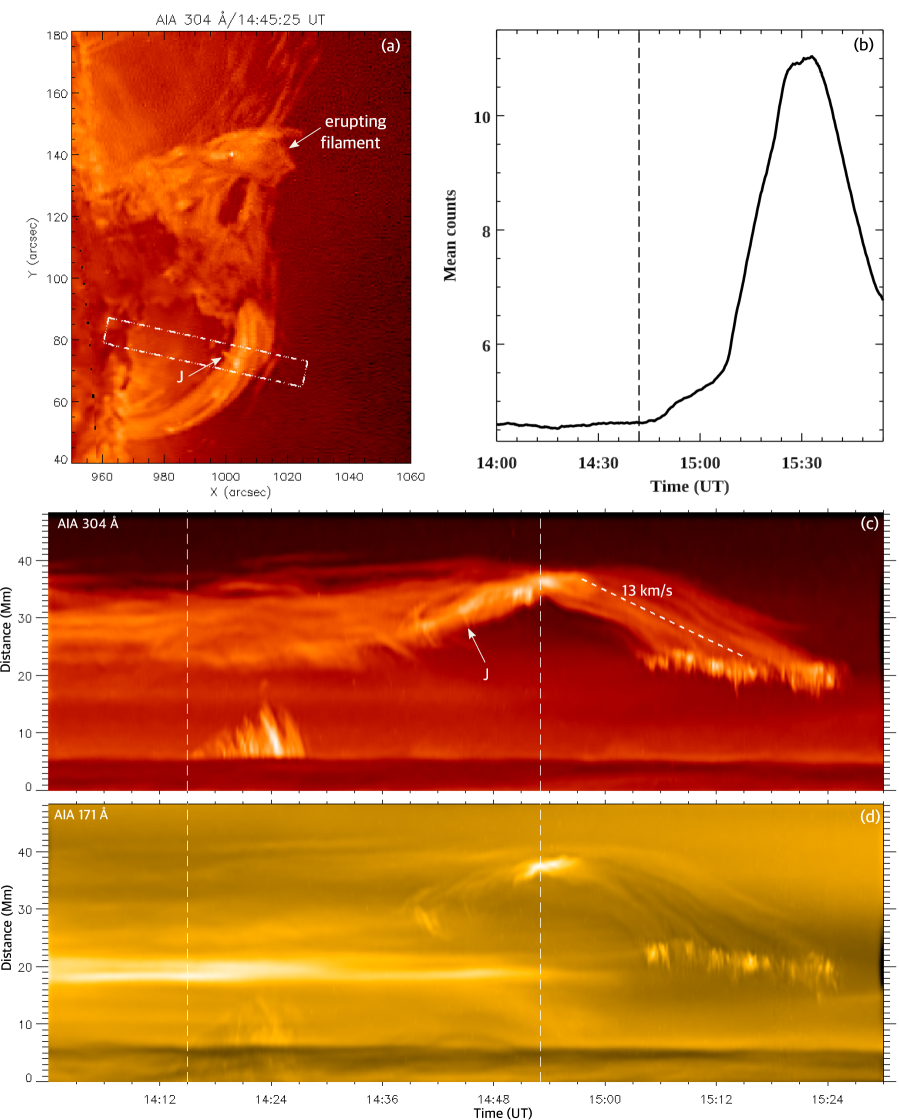
The GOES soft X-ray (1-8 Å) flux profile revealed a C-class flare during the analyzed time interval, but there was another flare from a different active region nearly at the same time. Therefore, we used the AIA 94 Å channel mean counts of the flare region (shown in Figure 5) as a flare proxy (Figure 7(b)), and avoided using the GOES soft X-ray flux measurements that combined two flares from different ARs. The preflare onset was around 14:42 UT, the impulsive phase began at 15:06 UT, and the maximum occurred 15:30 UT. Therefore the blobs, jets, and downflows along the dome at 14:40-14:53 UT occurred during the preflare phase, while the bright plasma sheet beneath the flux rope was associated with the flare impulsive phase (15:06-15:28 UT).
The AIA 304 Å TD intensity plot shows filament activation at 14:15 UT (first vertical dashed line, Figure 7(c)). Jet-like transverse features (marked by J within the slit) were interpreted as nanojets by Antolin et al. (2021). Most of these jet-like features were associated with bright blobs (TD plot during 14:42-14:54 UT) moving through the cool coronal-rain plasma. The erupting prominence segment rotated at the same time (Figure 4(d2)). As seen in several AIA channels (304, 171, 193 Å), the apparent contraction of the dome began at 14:48 UT and became faster ( 13 km s-1) during 14:53-15:27 UT (Figure 7(c,d)). Brightenings around 20 Mm along the slit from 15:05-15:25 UT in the TD plots are from multiple blobs in the plasma sheet crossing the slit.
The top of the filament and surrounding hot plasma reached a maximum height of 145 Mm at 15:28 UT, then oscillated in place until 16:12 UT. A separate analysis of these kink oscillations is discussed by Kumar et al. (2022). Thereafter cool plasma drained along the field. No CME was observed in association with this event.
3 INTERPRETATION
As described above, we analyzed multiwavelength observations from SDO/AIA, IRIS, and STEREO and identified a series of activities associated with a failed filament eruption and a flare. The source was a small active region with a fan-spine topology surmounted by a null point within the observed cusp. When stressed, this type of configuration is well known to produce a wide range of solar eruptions through the breakout mechanism, from tiny jets to eruptive flares (Antiochos et al., 1999; Karpen et al., 2012, 2017; Wyper et al., 2017, 2018, 2021; Dahlin et al., 2019). Our interpretation of the observed features is based on that model.
According to the breakout scenario, the plasma sheet observed near the cusp encompassed a breakout current sheet (BCS) lying along the fan separatrix, while the plasma sheet observed beneath the rising filament encompassed the flare current sheet (FCS) formed in the wake of the rising filament-channel flux. Pre-eruption jets originating from the null during the two hours prior to the filament slow rise were caused by slow reconnection at the BCS (e.g., Lynch & Edmondson, 2013; Kumar et al., 2021; Wyper et al., 2021). Additional evidence for early breakout reconnection was provided by the persistent, strong coronal rain observed well before the eruption. The rain emanated from the vicinity of the null and drained along the envelope of a portion of the fan loops, as reported previously in breakout jet observations (Kumar et al., 2019a, 2021). Interchange reconnection has been proposed as a source of coronal rain in pseudostreamers, which also manifest a fan-spine topology (Mason et al., 2019).
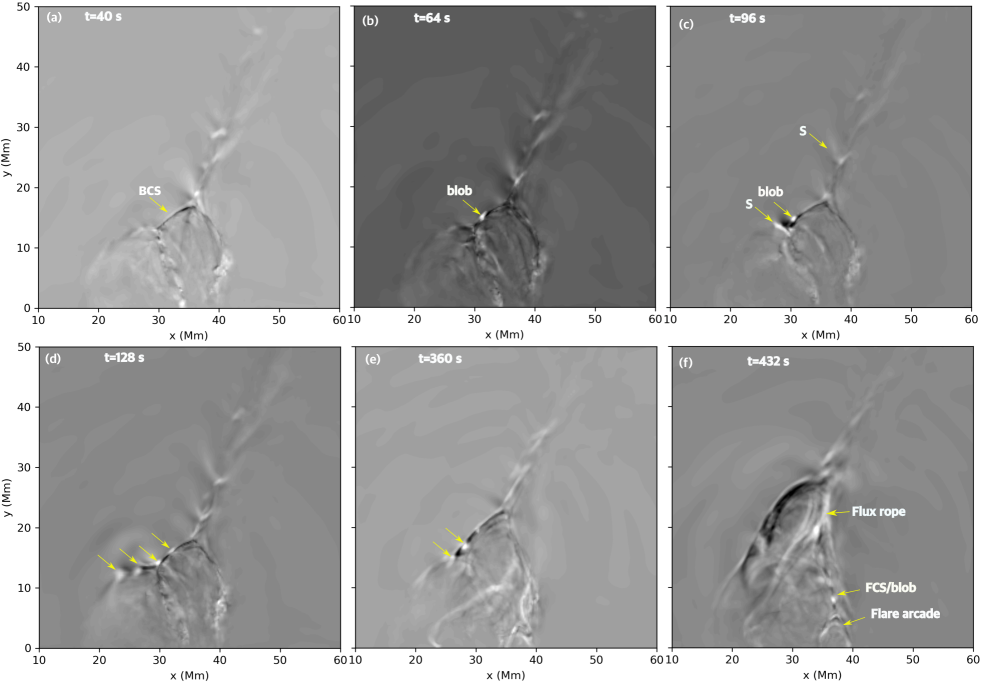
As breakout reconnection proceeded, the filament began to rise slowly and continued at this pace for approximately 35 min. The filament and surrounding flux rope remained relatively small. We interpret the plasma blobs appearing in the AIA and EUVI images of the cusp region during the preflare phase as plasmoids (magnetic islands) formed by repeated episodes of reconnection in the BCS and subsequently released onto the fan loops. In 3D, plasmoids are tiny flux ropes formed by multiple reconnections in current sheets (Guidoni et al., 2016; Dahlin et al., 2019; Lynch, 2020). For comparison, Figure 11 shows results of a high-resolution MHD simulation of a coronal jet by Wyper et al. (2018), which demonstrates formation and propagation of multiple plasmoids (marked by arrows) in the BCS during the slow rise of the filament channel flux (density images in Figure 11). When these plasmoids exit the BCS, their magnetic structures lose their integrity through reconnection with the unidirectional fan field. The density enhancements remain, however, and propagate toward the footpoints (Fig. 11(d)-(f)).
The early flare phase was characterized by jets and downflows along the separatrix, heating of the southern fan loops, and the fast rise of the filament and surrounding flux rope. We interpret these features as key signatures of the onset of flare reconnection, which also increases the reconnection rate at the BCS. Note that the blobs/jets reported by Antolin et al. (2021) were observed during this period, but their analysis was based primarily on IRIS observations of the southern loops and did not include the filament eruption and flare. Based on the simulation results outlined above, we conclude that the transverse jet-like features associated with blobs near the cusp in our event may arise due to component reconnection (Swisdak et al., 2005; Fuselier et al., 2011) between BCS plasmoids and the ambient fan field. Further study of the interactions between these propagating plasmoids and the ambient field is needed to verify this scenario.
An alternative explanation of the transverse jet-like features comes from our high-resolution MHD simulations of CME onset via breakout reconnection (e.g., Karpen et al., 2012; Guidoni et al., 2016). In these simulations, transverse current and density enhancements associated with bright plasmoids moving along the breakout and flare current sheets are simply signatures of compressive bow shocks driven by the plasmoids. Such shocks are likely to appear bright in EUV images, but it is unclear whether they could persist beyond the current sheets of origin.
The flare main phase began with the appearance of multiple plasmoids and jets near the cusp. As the filament accelerated, two new features appeared: a bright, linear plasma sheet beneath it, attributed to the lengthening FCS, and hot plasma entwined with the rising and rotating filament that we interpret as mass residing in the flux rope created by reconnection in this FCS. Plasmoids moved upward and downward in the FCS throughout the eruptive phase, and a bright, hot flare arcade appeared within the dome in the southern portion of the AR. The sunward plasmoids collide and merge with the flare arcade, while the upward plasmoids augment the rising flux rope.
A curved plasma sheet was observed inside the dome during this phase, with the northern end apparently intersecting with the lower end of the linear FCS. We interpret this feature as an extension of the FCS. Multiple plasmoids were detected along the curved plasma sheet, some of which merge near the cusp and show evidence of heating and/or increased density. A few of the plasmoids move down along the plasma sheet and collide with the top of the flare arcade. Numerical simulations of breakout CMEs/eruptive flares and jets confirm the above sequence of activities during the main flare phase, including the generation and evolution of bidirectional plasmoids in the FCS (e.g., Karpen et al., 2012; Wyper et al., 2018). The blob properties are consistent with those of plasmoids observed in other eruptive events (Kumar & Cho, 2013; Kumar et al., 2019a). Similar flare current sheets with multiple plasmoids have also been reported in previous observations of flare reconnection below a flux rope (Takasao et al., 2012; Kumar et al., 2018, 2019a, 2019b, 2021). Therefore, we conclude that these blobs are associated with reconnection in the breakout and flare current sheets rather than nanoflares (Antolin et al., 2021).
The 193 Å animation accompanying Figure 4(b1-c3) reveals the kinking of the filament and its supporting flux rope, as well as possible leg-leg reconnection (Figure 10(b)) that forms an arcade underneath this reconnection site (Figure 10(c)). STEREO images clearly show a vertical current sheet with multiple plasmoids below the rising flux rope (Figure 9(e)). Leg-leg reconnection was predicted by an MHD simulation of a kinking flux rope (Kliem et al., 2010) and previously inferred from observations of other eruptions (Alexander et al., 2006; Cho et al., 2009; Kumar & Cho, 2014).
Quasiperiodic pulsations (QPPs) detected during solar flares have been ascribed to two main mechanisms: MHD waves and bursty reconnection with plasmoids (Nakariakov & Melnikov, 2009; Zimovets et al., 2021). Our observations provide strong evidence that bursty reconnection can produce high-frequency (70-s) QPPs in EUV emissions. Previously, we detected 2.5-3.2 min periodicity in a pseudostreamer FCS with multiple plasmoids (Kumar et al., 2021), and 70-s and 140-s QPPs in radio, X-ray, and EUV emissions associated with fast-mode waves (without plasmoids) in a flaring active region (Kumar et al., 2017). Therefore, both QPP drivers (MHD waves and plasmoids) have been observed in null-point topologies.
We observed progressive removal of the southern loops (inside the dome) starting around 14:53 UT, and found a clear correlation between the apparent contraction and disappearance of fan loops in the AIA 193/171 Å channel. In addition, the cotemporal EUVI-A 195 Å images show an increasing volume of bright loops over F2 (see Figure 9 and accompanying animation). The apparent contraction was detected well above the curved FCS where bidirectional plasmoids were formed intermittently. The apparent contraction of the dome during the event is likely due to fast breakout reconnection accelerated by explosive flare reconnection at the FCS. To the best of our knowledge, this type of contraction in an erupting null-point topology has not been reported before.
Part of the contracting structure in the TD plot (Figure 7) shows associated blobs in the FCS and clearly correlates with the flare energy release. If we assume that the observed contraction speed equals the reconnection inflow speed ( 13 km s-1), and the plasmoid speed (100-285 km s-1) equals the outflow speed, the estimated reconnection rate (inflow/outflow) in the FCS is in the range 0.05 - 0.13. This reconnection rate is consistent with estimates from previous observations of flare reconnection associated with plasmoids (Takasao et al., 2012; Kumar & Cho, 2013). We conclude that the removal via breakout reconnection of closed flux below the separatrix surface reduced the volume of this portion of the fan, and transferred that flux to the portion of the fan overlying F2. Further 3D MHD simulations are required to validate this scenario.
4 SUMMARY AND CONCLUSIONS
We have demonstrated that multiple plasma blobs and jets were detected during a failed filament eruption on 2014 April 3 in NOAA 12018, which had a fan-spine magnetic topology. These blobs are interpreted as multiple magnetic islands (plasmoids) formed by magnetic reconnection in breakout and flare current sheets. Breakout reconnection at the breakout sheet is the most likely candidate for the origin of the plasmoids and flows guided along the separatrix, as detected in our previous observations of coronal jets (Kumar et al., 2019a) and numerical MHD simulations (Wyper et al., 2016). We also observed repetitive bidirectional plasmoids (width 2-3) in the flare current sheet, with a period 70 s during a 25-30 minute interval. The speeds of upward and downward moving plasmoids were 150-285 km s-1and 100-270 km s-1, respectively.
The Interpretation section is aimed at explaining our observations of this complex event in terms of a single, compelling eruption model. The breakout model provides a comprehensive accounting of the observations described (see Section 3). We are unaware of any alternative model that can explain all of the observed phenomena. The eruption clearly undergoes low coronal breakout reconnection at the stressed null, and drives enough flare reconnection to form a significant flux rope. The erupting flux rope undergoes kinking but does not escape.
A major mystery remains: why did this filament eruption fail? We speculate that the flux rope failed to overcome the strapping forces of the overlying large-scale arcades for one or both of the following reasons. First, breakout reconnection between the leading edge of the rising flux rope and overlying arcades would be affected by the rotation of the flux rope during kinking, which can change the direction of the field at the top of the rope. If the magnetic field of the rotated flux rope and that of the overlying arcades became roughly parallel, the breakout reconnection would diminish. Second, the free magnetic energy transferred from the filament channel to the flux rope could be insufficient to overcome the strapping forces provided by the overlying arcade field. Targeted numerical experiments are needed to clarify the circumstances distinguishing successful from unsuccessful eruptions.
We conclude that plasmoids, associated jets, and fan-loop heating (including a flare arcade) in this event are all due to reconnection during the filament eruption rather than nanoflaring. Future high-resolution observations from DKIST and Solar Orbiter are expected to shed more light on dynamic fine-scale features in eruptions, such as reconnection jets and plasmoids, and provide greater insight into the causes of failed eruptions.
References
- Alexander et al. (2006) Alexander, D., Liu, R., & Gilbert, H. R. 2006, ApJ, 653, 719, doi: 10.1086/508137
- Antiochos et al. (1999) Antiochos, S. K., DeVore, C. R., & Klimchuk, J. A. 1999, ApJ, 510, 485, doi: 10.1086/306563
- Antolin et al. (2021) Antolin, P., Pagano, P., Testa, P., Petralia, A., & Reale, F. 2021, Nature Astronomy, 5, 54, doi: 10.1038/s41550-020-1199-8
- Cho et al. (2009) Cho, K.-S., Lee, J., Bong, S.-C., et al. 2009, ApJ, 703, 1, doi: 10.1088/0004-637X/703/1/1
- Dahlin et al. (2019) Dahlin, J. T., Antiochos, S. K., & DeVore, C. R. 2019, ApJ, 879, 96, doi: 10.3847/1538-4357/ab262a
- De Pontieu et al. (2014) De Pontieu, B., Title, A. M., Lemen, J. R., et al. 2014, Sol. Phys., 289, 2733, doi: 10.1007/s11207-014-0485-y
- DeForest (2017) DeForest, C. E. 2017, ApJ, 838, 155, doi: 10.3847/1538-4357/aa67f1
- Fuselier et al. (2011) Fuselier, S. A., Trattner, K. J., & Petrinec, S. M. 2011, Journal of Geophysical Research (Space Physics), 116, A10227, doi: 10.1029/2011JA016888
- Guidoni et al. (2016) Guidoni, S. E., DeVore, C. R., Karpen, J. T., & Lynch, B. J. 2016, ApJ, 820, 60, doi: 10.3847/0004-637X/820/1/60
- Howard et al. (2008) Howard, R. A., Moses, J. D., Vourlidas, A., et al. 2008, Space Sci. Rev., 136, 67, doi: 10.1007/s11214-008-9341-4
- Karpen et al. (2012) Karpen, J. T., Antiochos, S. K., & DeVore, C. R. 2012, ApJ, 760, 81, doi: 10.1088/0004-637X/760/1/81
- Karpen et al. (2017) Karpen, J. T., DeVore, C. R., Antiochos, S. K., & Pariat, E. 2017, ApJ, 834, 62, doi: 10.3847/1538-4357/834/1/62
- Kliem et al. (2010) Kliem, B., Linton, M. G., Török, T., & Karlický, M. 2010, Sol. Phys., 266, 91, doi: 10.1007/s11207-010-9609-1
- Klimchuk (2015) Klimchuk, J. A. 2015, Philosophical Transactions of the Royal Society of London Series A, 373, 20140256, doi: 10.1098/rsta.2014.0256
- Kumar & Cho (2013) Kumar, P., & Cho, K.-S. 2013, A&A, 557, A115, doi: 10.1051/0004-6361/201220999
- Kumar & Cho (2014) —. 2014, A&A, 572, A83, doi: 10.1051/0004-6361/201323269
- Kumar et al. (2019a) Kumar, P., Karpen, J. T., Antiochos, S. K., Wyper, P. F., & DeVore, C. R. 2019a, ApJ, 885, L15, doi: 10.3847/2041-8213/ab45f9
- Kumar et al. (2018) Kumar, P., Karpen, J. T., Antiochos, S. K., et al. 2018, ApJ, 854, 155, doi: 10.3847/1538-4357/aaab4f
- Kumar et al. (2019b) —. 2019b, ApJ, 873, 93, doi: 10.3847/1538-4357/ab04af
- Kumar et al. (2021) —. 2021, ApJ, 907, 41, doi: 10.3847/1538-4357/abca8b
- Kumar et al. (2017) Kumar, P., Nakariakov, V. M., & Cho, K.-S. 2017, ApJ, 844, 149, doi: 10.3847/1538-4357/aa7d53
- Kumar et al. (2022) Kumar, P., Nakariakov, V. M., Karpen, J. T., Richard DeVore, C., & Cho, K.-S. 2022, ApJ, 932, L9, doi: 10.3847/2041-8213/ac6e3e
- Lemen et al. (2012) Lemen, J. R., Title, A. M., Akin, D. J., et al. 2012, Sol. Phys., 275, 17, doi: 10.1007/s11207-011-9776-8
- Lynch (2020) Lynch, B. J. 2020, ApJ, 905, 139, doi: 10.3847/1538-4357/abc5b3
- Lynch & Edmondson (2013) Lynch, B. J., & Edmondson, J. K. 2013, ApJ, 764, 87, doi: 10.1088/0004-637X/764/1/87
- Mason et al. (2019) Mason, E. I., Antiochos, S. K., & Viall, N. M. 2019, ApJ, 874, L33, doi: 10.3847/2041-8213/ab0c5d
- Nakagawa & Raadu (1972) Nakagawa, Y., & Raadu, M. A. 1972, Sol. Phys., 25, 127, doi: 10.1007/BF00155751
- Nakariakov & Melnikov (2009) Nakariakov, V. M., & Melnikov, V. F. 2009, Space Sci. Rev., 149, 119, doi: 10.1007/s11214-009-9536-3
- Nita et al. (2015) Nita, G. M., Fleishman, G. D., Kuznetsov, A. A., Kontar, E. P., & Gary, D. E. 2015, ApJ, 799, 236, doi: 10.1088/0004-637X/799/2/236
- Parker (1988) Parker, E. N. 1988, ApJ, 330, 474, doi: 10.1086/166485
- Priest & Titov (1996) Priest, E. R., & Titov, V. S. 1996, Philosophical Transactions of the Royal Society of London Series A, 354, 2951, doi: 10.1098/rsta.1996.0136
- Raouafi et al. (2016) Raouafi, N. E., Patsourakos, S., Pariat, E., et al. 2016, Space Sci. Rev., 201, 1, doi: 10.1007/s11214-016-0260-5
- Scherrer et al. (2012) Scherrer, P. H., Schou, J., Bush, R. I., et al. 2012, Sol. Phys., 275, 207, doi: 10.1007/s11207-011-9834-2
- Shibata et al. (1994) Shibata, K., Nitta, N., Strong, K. T., et al. 1994, ApJ, 431, L51, doi: 10.1086/187470
- Sterling et al. (2015) Sterling, A. C., Moore, R. L., Falconer, D. A., & Adams, M. 2015, Nature, 523, 437, doi: 10.1038/nature14556
- Swisdak et al. (2005) Swisdak, M., Drake, J. F., Shay, M. A., & McIlhargey, J. G. 2005, Journal of Geophysical Research (Space Physics), 110, A05210, doi: 10.1029/2004JA010748
- Takasao et al. (2012) Takasao, S., Asai, A., Isobe, H., & Shibata, K. 2012, ApJ, 745, L6, doi: 10.1088/2041-8205/745/1/L6
- Tsuneta et al. (2008) Tsuneta, S., Ichimoto, K., Katsukawa, Y., et al. 2008, Sol. Phys., 249, 167, doi: 10.1007/s11207-008-9174-z
- Wuelser et al. (2004) Wuelser, J.-P., Lemen, J. R., Tarbell, T. D., et al. 2004, in Society of Photo-Optical Instrumentation Engineers (SPIE) Conference Series, Vol. 5171, Telescopes and Instrumentation for Solar Astrophysics, ed. S. Fineschi & M. A. Gummin, 111–122, doi: 10.1117/12.506877
- Wyper et al. (2017) Wyper, P. F., Antiochos, S. K., & DeVore, C. R. 2017, Nature, 544, 452, doi: 10.1038/nature22050
- Wyper et al. (2021) Wyper, P. F., Antiochos, S. K., DeVore, C. R., et al. 2021, ApJ, 909, 54, doi: 10.3847/1538-4357/abd9ca
- Wyper et al. (2018) Wyper, P. F., DeVore, C. R., & Antiochos, S. K. 2018, ApJ, 852, 98, doi: 10.3847/1538-4357/aa9ffc
- Wyper et al. (2016) Wyper, P. F., DeVore, C. R., Karpen, J. T., & Lynch, B. J. 2016, ApJ, 827, 4, doi: 10.3847/0004-637X/827/1/4
- Zimovets et al. (2021) Zimovets, I. V., McLaughlin, J. A., Srivastava, A. K., et al. 2021, Space Sci. Rev., 217, 66, doi: 10.1007/s11214-021-00840-9
| Time (UT) | Activity | Observations |
| 12:30, 13:15 | Pre-eruption jets | AIA and STEREO |
| 14:05, 14:15 | Filament F1 slow rise | Observed partially in high-resolution SOT† and IRIS⋆ images, |
| complete eruption covered in AIA and STEREO | ||
| 14:41-14:53 | Blobs during the filament eruption, Preflare phase, | AIA, IRIS, STEREO |
| loops expansion/disappearance in AIA 171/193 Å, | ||
| flows near the null in AIA 94 Å, dome/fan contraction. | ||
| 14:55-15:38 | Multiple blobs and flows in the flare plasma sheet, filament fast rise, | AIA, STEREO |
| (P 70 s) during the filament eruption |
† Hinode SOT observation ends at 14:30 UT.
⋆ IRIS Observation ends at 14:53 UT.