ZJU-UIUC Institute, 718 East Haizhou Road Haining, Zhejiang 314400, China, pavelloskot@intl.zju.edu.cn
A Query-Response Causal Analysis of Reaction Events in Biochemical Reaction Networks
Abstract
The stochastic kinetics of biochemical reaction networks are described by a chemical master equation (CME) and the underlying laws of mass action. The CME must be usually solved numerically by generating enough traces of random reaction events. The resulting event-time series can be evaluated statistically to identify, for example, the reaction clusters, rare reaction events, and the periods of increased or steady-state activity. The aim of this paper is to newly exploit the empirical statistics of the reaction events in order to obtain causally and anti-causally related sub-sequences of reactions. This allows discovering some of the causal dynamics of the reaction networks as well as uncovering their more deterministic behaviors. In particular, it is proposed that the reaction sub-sequences that are conditionally nearly certain or nearly uncertain can be considered as being causally related or unrelated, respectively. Moreover, since time-ordering of reactions is locally irrelevant, the reaction sub-sequences can be transformed into the reaction event sets or multi-sets. The appropriately defined distance metrics can be then used to define equivalences between the reaction sub-sequences. The proposed framework for identifying causally associated reaction sub-sequences has been implemented as a computationally efficient query-response mechanism. The framework was evaluated assuming five selected models of genetic reaction networks in seven defined numerical experiments. The models were simulated in BioNetGen using the open-source stochastic simulator NFsim, which had to be modified to allow recording of the traces of reaction events. The generated event time-series were analyzed by Python and Matlab scripts. The whole process of data generation, analysis and visualization has been nearly fully automated using shell scripts. This also demonstrates the opportunities for substantially increasing the research productivity by creating automated data generation and processing pipelines.
\helveticabold1 Keywords:
biochemical reaction network, causal inference, dynamic system, event time-series, NFsim, query-response, state-space, stochastic simulation
2 Introduction
Biochemical reaction networks (BRNs) represent the systems of chemical species that are interacting through chemical reactions. The deterministic or stochastic models of these systems must be often analyzed numerically Gillespie (2007); Wolf et al. (2010); Warne et al. (2019); Loskot et al. (2019). The objective of these analyses is to generate the time trajectories of the system state represented by the copy counts of chemical species, or by the sequences of reaction events. The statistics of these trajectories then reveal the properties of a dynamic system including its stability and the transition to a steady-state, if it exists.
In addition to the properties inferred from the statistical observations, uncovering causality can yield additional important information about the system dynamics by relating causes to effects, and effects to causes. For instance, a procedure for establishing the causal relationships as the dependency between reactions in protein interaction networks was defined in Dang et al. (2015). Causal ordering of reactions is crucial in reconstructing the reaction pathways, and in inferring a topology of BRN Villaverde et al. (2013); Löwe et al. (2022). In Dang et al. (2015), the causality between reactions is defined as their dependency. The causal ordering can be achieved by comparing the correlation peaks, exploiting asymmetry of the conditional correlation matrix, and by examining the correlation network in a series of statistical independence tests Villaverde et al. (2013). Moreover, many inverse problems such as estimating the reaction rates implicitly involve the causal inferences Loskot et al. (2019). In Park and Kellis (2021), the genes causing a disease were identified by constructing a linear structural causal model (SCM), which also accounts for the confounding and differential effects.
It can be argued that it is much easier to causally relate the sub-sequences of reaction events than to causally relate changes in observed copy counts or concentrations of chemical species. A rigorous framework for deriving the reaction trajectories by solving the chemical master equation (CME) was presented in Sunkara (2009, 2019). The traces of reactions events were recorded, and subsequently used in analysis in Gilbert et al. (2019) and in Connolly et al. (2022). Moreover, as pointed out in Gilbert et al. (2019), the reaction traces uniquely define changes in the molecular copy counts. However, the opposite may not necessarily be true, since the copy counts are usually only recorded at predefined time intervals.
The reaction events are categorical random variables. The causal inference involving categorical data can be performed by a series of conditional independence tests Runge et al. (2019), or by using information-theoretic methods Hlaváčková-Schindlera et al. (2007). The reaction events obtained from simulating the BRN models represent time-series data. A comprehensive review of causal discovery in time-series data is provided in Moraffah et al. (2021) including the metrics for evaluating the causal inferences. In Soo and Rottman (2018), it is argued that causality in time-series must account for temporal trends and dependencies in order to reach a valid conclusion.
In general, causality in multivariate time-series is usually defined as Granger causality Hlaváčková-Schindlera et al. (2007). Other notions of causality in time-series include intervention causality and structural causality Eichler (2011); Runge et al. (2019). Granger causality was re-formulated in terms of the conditional probability distributions in Chikahara and Fujino (2018). In particular, provided that conditioning on observations changes the probability distribution, the corresponding random variables can be assumed to be causally related. The commonly agreed requirement for causality is that cause must precede the effect, and cause must contain unique information about the effect, which is not available from elsewhere Hlaváčková-Schindlera et al. (2007). Alternatively, a change in cause can be detected by its effect Eichler (2011). The causality in non-linear dynamical systems can be detected from observations assuming state-space representations Zhang et al. (2017); Runge et al. (2019). Different methods for determining the direction and the strength of direct linear and non-linear causal effects were compared by simulation in Papana et al. (2013). A supervised learning for determining the causal direction between random variables has been studied in Lopez-Paz et al. (2015). The stationary distribution obtained from solving a CME was converted into a SCM in Ness et al. (2019). Recently, the causality between categorical random variables was investigated in our paper Loskot (2022a).
Alternatively, the reaction event sub-sequences can be related assuming various similarity or distance metrics. The definitions of distance metrics between data sequences can be found, for example, in Vlachos et al. (2003); Cassisi et al. (2012); Batista et al. (2013). A distance measure suitable for categorical variables such as nucleotide bases was proposed in Zielezinski et al. (2017). These metrics can be used to classify data sub-sequences, to identify shapelets (i.e., frequently reappearing sequence patterns) Mueen et al. (2011), and to perform a matrix profile analysis of longitudinal data Yeh et al. (2018).
Mathematical models of BRNs and the corresponding methods of statistical inferences are comprehensively surveyed in Loskot et al. (2019). The algorithms for simulating BRNs are listed in Warne et al. (2019). The software tools for simulating and analyzing BRNs include, for example, COPASI Bergmann et al. (2017), CERENA Kazeroonian et al. (2016), and BioNetGen Harris et al. (2016). The latter provides a rule-based modeling to compactly describe BRNs involving molecules with multiple binding and modification sites. These BRN models can be effectively and exactly simulated at the level of reaction rules by tracking the corresponding copy counts of molecular complexes without the need to fully extract all chemical reactions, and to track the counts of individual species Faeder et al. (2009); Sneddon et al. (2011). A tool for visualizing the causal reaction pathways has been reported, for example, in Dang et al. (2015). The network-based and network-free simulations of BRNs are compared in Gupta and Mendes (2018). The time-scale aspects of the rule-based models of BRNs are investigated in Klinke II and Finley (2012).
In this paper, the causal associations between reaction event sub-sequences in well-stirred stochastic kinetic models of BRNs are investigated. The objective is to identify sub-sequences that can be considered to be causally or anti-causally related. Since the reactions are occurring at random with varying probabilities, their associations cannot be inferred directly from the structure of BRNs, but they must be estimated from the observed traces of reaction events. Consequently, it is proposed to define causality in terms of the empirical conditional probabilities. In particular, it is claimed that, if one reaction sub-sequence precedes another, and if the corresponding empirical conditional probability is close to 1, then these reaction sub-sequences are nearly certain, and thus, they can be considered to be causally related. On the other hand, if the empirical conditional probability is close to 0, then the corresponding reaction events are conditionally nearly uncertain, so they can be considered to be causally unrelated or even independent.
The proposed strategy of causal inference is implemented by a computationally efficient mechanism of causal and anti-causal queries and the corresponding responses. Moreover, since the exact ordering of reaction events is locally irrelevant, distance metrics between event sub-sequences can be considered by assuming the event sets or multi-sets instead of sub-sequences. The event sub-sequences with zero mutual distance are then assumed to be equivalent. The distance metrics can be also used to discover common patterns in the reaction event time-series by computing the relevant matrix profile.
Numerical examples were produced in NFsim, an open-source stochastic simulator of BRNs written in C++. This software admits the rule-based kinetic models, and generates trajectories of chemical species counts. However, this software had to be modified in order to allow recording of the reaction event histories Loskot (2022b). The generated sequences of molecule copy counts were discarded in our analysis of causal associations. The event time-series were processed and visualized by Python and Matlab scripts. The complete pipeline of data generation, processing and visualization was nearly fully automated using Bash shell-scripts. This enables generating extensive amount of numerical results with the minimum required manual interventions within relatively short times. The complete results for the five selected BRN models produced in the seven defined numerical experiments are summarized in Supplementary; in the main text, only the selected results for Model A are presented and discussed for illustration in Section 3.
3 Methods
A stochastic kinetic model of a BRN is normally defined by the set of chemical reactions including their reaction rates, and the set of corresponding molecular species including their initial counts. It constitutes a stochastic dynamic system, which is described by the vector state, , of molecule counts at time . The states undergo random transitions due to periodically reoccurring reaction events, , i.e.,
| (1) |
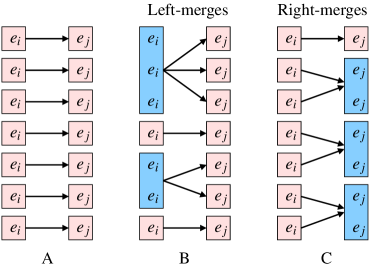
The reaction event is selected at random from chemical reactions with the probability dependent on the current state, . This makes the sequence of stochastic events, , to be Markovian. The sequential model (1) describes the dynamics of BRN exactly, i.e., it is an exact solution of the CME Gillespie (2007). Every defined chemical reaction binds some reactants with certain products; the reactants are consumed, and the molecule counts of products increase. Since often, , chemical species are involved in more than one reaction as depicted in Figure 1. The states are non-negative integer vectors, although its large components can be approximated as non-negative real numbers. Over any finite time interval, the changes in molecule counts are always finite. These constraints impose dependency between successive reaction events, , representing categorical or nominal random variables.
A classical analysis of BRNs assumes descriptive or inferential statistics of the state trajectory, . This paper departs from analyzing the molecule counts, and instead only considers the sequences of reaction events, , and completely ignores the states, . The sequence of reaction events, , transforming the state at time into a state at time can be arbitrarily reordered (in time) without changing the end-state, . However, such reordering of reactions may temporarily violate the non-negativity constraint or other limits imposed on the copy counts, . Consequently, the sub-sequences of events, , can be assumed to be multi-sets (the same events can appear multiple times, but their ordering is irrelevant), or they can be converted into ordinary sets (repeated events are discarded, and only the unique reactions are considered). These sets or multi-sets are denoted as, . The event sub-sequences can be created by a sliding-window partitioning of the original event time-series as indicated in Figure 2.
The sub-sequences or of categorical random variables can be studied by assuming their probability distributions, and also by defining various distance metrics. The former approach will be used to identify the causal relationships among event sub-sequences, whereas the latter approach enables the matrix profile analysis of the event time-series.
3.1 Causal Associations of Event Sub-Sequences
In general, given two event sub-sequences and of reaction events, the objective is to determine whether these sequences could be causally related. For causal learning, given a cause , the task is to determine, if can be its effect. For anti-causal learning, given the effect , the task is to determine the corresponding cause . The causal specificity implies that a single cause leads to a single effect, or a single effect has exactly one cause. If the cause is sufficient, then it is enough to cause or to prevent an effect, whereas a necessary cause appears in every sufficient cause Peters et al. (2017).
The first obvious condition is that, for both causal and anti-causal learning, the events in representing a cause must precede all events in a possible effect , i.e., it is sufficient that the intersection, , is an empty set. The second condition is that, if the sequences and are statistically independent, they cannot be causally associated. The independence can be formulated as a null-hypothesis, and then tested using, for example, chi-square independence tests. Since the statistical tests are always evaluated with a certain level of significance, the independence tests may yield false positives as well as false negatives. Moreover, in some scenarios, the independence must be tested conditioned on other random variables such as confounders.
Different strategies were considered in the literature to determine causal models of time-series data as discussed in Section 2. Fundamentally, provided that the causal effect is identifiable, it can be transformed into a probability expression containing only the observed variables Pearl (2009). However, causal effects in multiple time-series cannot be identified, provided that their SCM contains instantaneous effects Peters et al. (2017), i.e., causal networks cannot be inferred from steady-state data. Moreover, the unknown causal dependencies in SCM can be replaced with conditional distributions.
Consider now event time-series generated by model (1). The probability of events is conditionally dependent on the preceding events and the sequence of states , which have occurred between and , at times and , respectively. The conditional probability of interest is,
| (2) |
Removing the dependency on states in (2) by averaging occurs naturally, when the conditional probability between the reaction events is estimated empirically as a relative frequency of occurrence of events and over sufficiently long sequences of observed reaction events.
The conditional probability (2) is the likelihood that the events have occurred, provided that the events were observed. In order to causally relate to , i.e., to claim that is a cause of , or is an effect of , the Do-calculus framework of Pearl (2009) requires to enforce to occur; then, the conditional probability, , can be assumed instead. It is the probability that specific is observed, provided that has occurred. In this paper, it is claimed that the limiting cases of conditional probability (2), when it is either close to 1 or close to 0, can be interpreted as interventions within the Do-calculus framework.
Definition 1.
A sufficient condition for the event sub-sequences and , such that all events in have occurred before any event in , to have a cause-effect relationship is that their conditional probability, . In such a case, is said to be the cause of , and equivalently, is the effect of . For anti-causal association, i.e., finding a cause for given effect, it is sufficient that, .
Definition 2.
For the event sub-sequences and not to be causally related, it is sufficient that either one or more events in have occurred after any event in , or that their conditional probability, , and also, , in order to also rule out their anti-causal association.
However, there are also cases when causes , and at the same time, can cause . Moreover, causal relationships are generally asymmetric, and normally, . The conditional probability assumed in Definition 1 as being close to 1 indicates that, given , there are only a few possible event sub-sequences following . More importantly, Definition 1 cannot identify all event sub-sequences that are caused by , nor all event sub-sequences that are cause of .
In order to practically identify the pairs of event sub-sequences, which are causally related by Definition 1, the event time-series are first partitioned into sliding-window sub-sequences of events, such that the time index, , indicates the first event in the sub-sequence, . The sub-sequences are then split into two disjoint segments and (omitting the time index, , for brevity) of and events, respectively. These segments are referred to as the left and the right event sub-sequence, respectively.
The number of identified causally related event sequences can be increased by assuming smaller values of , and by introducing a notion of equivalent sub-sequences. In particular, denote as and the sets or multi-sets corresponding to the event sub-sequences and , respectively. Denote as the Hamming distance between and . Assuming the equal-length sequences and , their distance can be defined in multiple ways as follows.
| (3a) | |||||
| (3b) | |||||
| (3c) | |||||
| (3d) | |||||
| (3e) | |||||
| (3f) | |||||
Hence, always, (non-negativity), (symmetry), and , where denotes the cardinality of a set or the sequence length.
The metrics (3a)–(3f) allow considering the distances between sub-sequences of categorical or discrete-valued variables. The distance metrics can be used to cluster sub-sequences of reaction events, which affects the frequency of occurrence estimates of the conditional probabilities considered in Definition 1, and as illustrated in Figure 3. The distance metrics also enable matrix profile analysis of observed event time-series. The equivalence of event sub-sequences is defined as follows.
Definition 3.
The event sub-sequences and are said to be equivalent, provided that their distance, .
3.2 Frequency Analysis of Reaction Events
The most basic analysis assumes the frequency of occurrence of individual reaction events. Denote as the estimated probability, or equivalently, the relative frequency of occurrence of reaction in a very long sequence of observed reaction events. For simplicity of discussion, the reaction events are not separated into steady-state and a transition to steady-state. The reaction events can be then sorted and also clustered by values . In particular, let . The disjoint clusters of reaction events can be defined as,
| (4) |
In other words, the reaction clusters are defined, so that there is a relatively large decrease in the reaction probability between the subsequent clusters of reaction events and . In all BRNs investigated in this paper, the number of such clusters was equal to three, and in some cases, equal to two.
Furthermore, assuming again the reaction ordering, , it may be of interest to evaluate if there are a few frequently occurring reactions dominating the reaction dynamics in a BRN, or whether the reactions are more evenly distributed. Such a spread of reactions over the observed event sequence can be measured by a sample variance. It is computed for the event sub-sequence, , as,
| (5) |
where denotes the total number of reactions defined in the BRN. Alternatively, we can consider the random fraction of reaction types that appear in the event set , i.e.,
| (6) |
The spread of such a random variable can be measured as the median, and the quartiles Q1 and Q3, respectively.
3.3 Query-Response Causal Analysis
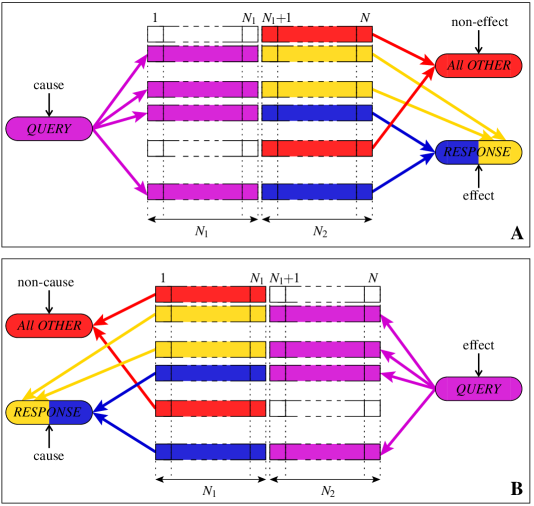
The discovery of causally related event sub-sequences by Definition 1 is performed in two steps. First, the distance metric is chosen in order to group equivalent sub-sequences of events by Definition 3. Then, a histogram of event sub-sequences is obtained to estimate the relevant conditional probabilities as a relative frequency of occurrence. Although this is a valid strategy, it is numerically very expensive, and it restricts the length and of the event sub-sequence that can be considered to relatively smaller values. In order to enable exploring a possibly very large number of event sub-sequences of length , the following two query-response procedures are proposed for finding the causally and anti-causally related event sub-sequences. Both procedures start from creating sliding window event sub-sequences of equal lengths . Each sub-sequence is then split into the first and the last events. The procedures are depicted in Figure 4, and they consist of the following steps.
Discovery of causal event sub-sequences
-
1.
The input query defines criteria for selecting the left sub-sequences . Let be such a set of initial time indexes of sub-sequences satisfying the query, and let be the complement of , i.e., is the set of time indexes of all sliding-window sub-sequences considered.
-
2.
The response is formed by exploring the right event sub-sequences corresponding to the time indexes in the set . The task is to find a common property or feature shared by as many selected sub-sequences as possible, while such property or feature must not be observed among any of the sub-sequences with the time indexes in the complement set .
-
3.
Denote such a set of time indexes of event sub-sequences, for which the property or feature identified in Step 2 is satisfied as , so that and (empty set). The response to the query defined in Step 1 is then the identified property or feature, and the set . The sub-sequences and associated with the set can be then assumed to be causally related.
Discovery of anti-causal event sub-sequences
-
1.
The input query defines criteria for selecting the right sub-sequences . Let be such a set of initial time indexes of sub-sequences satisfying the query, and let be the complement of , i.e., is the set of the time indexes of all sliding-window sub-sequences considered.
-
2.
The response is formed by exploring the left event sub-sequences corresponding to the time indexes in the set . The task is to find a common property or feature shared by as many selected sub-sequences as possible, while such a property or feature must not be observed among any of the sub-sequences with the time indexes in the complement set .
-
3.
Denote such a set of time indexes of event sub-sequences, for which the property or feature identified in Step 2 is satisfied as , so that and (empty set). The response to the query defined in Step 1 is then the identified property or feature, and the set . The sub-sequences and associated with the set can be then assumed to be anti-causally related.
Numerical examples considered in the next section assume the queries formulated as the minimum number of reaction events from a given reaction cluster that have occurred within the left or right event sub-sequence, respectively. The corresponding responses assume the intersection of all the left or the right event sub-sets or , respectively.
3.4 Matrix Profile of Event Time-Series
The canonical matrix profile effectively shows the minimum distances between the constant length sub-sequences in time-series data Mueen et al. (2011). In particular, for every sub-sequence, the matrix profile indicates the value of the smallest distance to any other sub-sequence, and possibly, also the location of such sub-sequence having the minimum distance. The calculation of matrix profile is greatly optimized in order to avoid many unnecessary computations, so it can be used for processing very long sequences of data. The small values of the mutual distance in matrix profile indicate common patterns (motifs), and large values point at the locations of rare patterns (discords). The matrix profile can be also used to identify the time instances where the distance-based sequence statistics have changed.
The choice of distance metric and the sub-sequence length are the two most important considerations in matrix profile analysis. In addition, instead of searching for the minimum distance values, the maximum distances may reveal the level of dissimilarity between different parts of time-series data. It is also useful to count multiplicities of the distance values to understand how they are distributed. However, interpreting matrix profile for categorical random variables is beyond the scope of this paper, so the corresponding numerical results are not reported.
3.5 Numerical Implementation and Software Tools
The devised causal framework is investigated assuming stochastic kinetic models (1) of five BRNs. The open-source BioNetGen software was chosen to perform the simulations; version 2.7.0 of this program was downloaded from Blinov et al. (2021). The BRN models for BioNetGen are described in an intuitive BNGL language Blinov et al. (2004); Harris et al. (2016). These models are stored as ordinary text files. The BNGL model description includes the lists of chemical species, reaction rates and other parameters, reaction rules, quantities to be recorded as observations, and the description of other model components. The BNGL file is processed by a Perl script distributed with BioNetGen to generate the model description file in a System Biology Markup Language (SBML) format. The SBML file can be then directly simulated in NFsim Sneddon et al. (2011).
The stochastic simulation algorithm (SSA) in network-free simulations is performed exactly and efficiently by assuming reaction rules while tracking the copy counts of molecular objects with multiple binding and modification sites Faeder et al. (2009). The reaction rules can be fully extracted into a combinatorially large number of reactions with corresponding chemical species to perform traditional network-based simulations Gupta and Mendes (2018). More importantly, the linear kinetic model (1) and the causal framework defined earlier in this section are still valid, provided that the reaction rules and molecular complexes are considered instead of the actual reactions involving individual chemical species.
The NFsim version 1.11 was downloaded from Sneddon et al. (2012), and the modified version 1.20 of this software was uploaded to Loskot (2022b). There are several issues with version 1.11 of NFsim. First, it cannot record the generated reaction events, since the dynamics of BRNs so far have always been elucidated from the observed copy counts rather than from the reaction events. Therefore, a new software feature was added to NFsim to allow recording the generated reaction events into a separate file. More specifically, since the reaction rules are not extracted during the network-free simulations, the recorded traces of reaction events are the reaction rules selected by the SSA. Consequently, the causal analysis is performed for sub-sequences of reaction rules rather than sub-sequences of individual reactions. Second, the original source code cannot be recompiled incrementally when only some source files have been modified, which slows down the code development substantially. Therefore, a new global make-file was created to allow the incremental compilings and to speed-up the code development. Third, the version 1.11 of NFsim was released a decade ago (in 2012), so it does not compile under more recent versions of C++ language. Hence, the original source code was further refactored to remove compiling errors under the more recent version of the gcc compiler. The updated version 1.20 of NFsim is now freely available for download from Loskot (2022b).
The generated event time-series were processed and visualized by the custom scripts written in Matlab and Python. The canonical matrix profile can be calculated using a Python library stumpy Law (2019). The overall process of performing the simulations, processing the recorded event time-series, producing the plots, and generating the LaTeX source code for inserting figures and tables into the supplementary file was largely automated using Bash scripts.
The BNGL model files are provided in models folder, the Matlab and Python scripts are available in scripts folder, and the samples of generated event history files are stored in data folder of the NFsim public repository uploaded to Github Loskot (2022b).
4 Results
Numerical results were produced for five selected rule-based models of BRNs in seven defined numerical experiments. The models and experiments are detailed below. The models are labeled by letters A–E as well as by their acronyms. The experiments are labeled by integers 1–7.
Each model was simulated once for 100s of simulation time, and the sequence of generated random reaction events was recorded into a comma-separated file (CSV) by NFsim. The field with reaction times was removed from the CSV file, since it is not relevant for the subsequent analysis. The event time-series were then processed and analyzed by multiple Matlab and Python scripts. The script names are listed in the Supplementary file including the corresponding figures and tables that were generated by these scripts.
It should be noted that, in general, finding the reliable SBML files for kinetic simulations of BRNs is challenging. These files are often incomplete, i.e., they do not define all initial molecule counts, reaction rates and other parameters required to faithfully and unambiguously represent the selected biochemical system, or, these files contain many errors of various kind, which are very difficult to remove, especially for larger models.
4.1 BRN Models
Model A (Multi-states): This is a rule-based model considered in Blinov et al. (2004), Colvin et al. (2009) and Colvin et al. (2010). The model represents an idealized multivalent ligand–receptor binding with multiple ligand-induced receptor aggregates. This is an example of a model with lower complexity consisting of only 5 species and 6 reaction rules.
Model B (Chemotaxis): This rule-based model has been proposed in Hansen et al. (2008) to study chemical signaling of chemotaxis in Escherichia coli, and to understand signaling adaptation to changes in chemical concentrations. The receptor enzymes involved in signaling act on small assistance neighborhoods (AN) of 5 to 7 receptor homodimers. The model contains 12 species and 41 reaction rules.
Model C (Chemotaxis-ext): This rule-based model is an extended version of previous Model B. It has the updated receptor topology with 37 species, but only 32 reaction rules.
Model D (TLBR): This rule-based model is a kinetic version of the Goldstein-Perelson model of trivalent ligand-bivalent receptor (TLBR) Yang and Hlavacek (2011); Sneddon et al. (2011). The model allows predicting the distribution of ligand-receptor aggregate sizes and configurations. This is the smallest model considered consisting of only 4 species and 6 reaction rules.
Model E (Multi-sites): This is a rule-based model that was assumed in Colvin et al. (2009) and further analyzed in Colvin et al. (2010) to test and compare the network-based simulations of BRNs. The model represents an idealized autophosphorylation of receptor tyrosine kinase (RTK) having multiple receptor binding sites. The model rules can be extracted into 68 species and 290 reactions.
4.2 Numerical Experiments
The numerical results presented here were selected to support the key observations. The complete numerical results that were generated for the five BRN models considered across all the experiments can be found in the Supplementary file.
Experiment 1:
The objective is to evaluate the model complexity in terms of the number of functions, species, parameters, reaction rules and the molecule types (Table 1). The models A and E defined by the BNGL file can be fully extracted over several iterations in order to enumerate all the combinations of reactions specified by the reaction rules. However, the reaction network extraction failed for the models B, C and D (investigating the reasons why the extraction algorithm failed to terminate is beyond the scope of this paper). The total number of groups, species and reactions in the extracted models A and E are listed in Table 1.
The wall-clock times to simulate the BRN models over 100s of simulation time, the number of randomly generated reaction events, and the number of unique reaction rules are compared in Table 2. These values demonstrate the great effectiveness of the network-free modeling and simulations. The reaction events are produced the fastest for model E, and at the slowest for model D.
The recorded event history files were processed to find unique sliding-window -tuples of reaction events and their counts (i.e., histograms). The resulting -tuple statistics can be found in supplementary Tables S1–S5 for the sliding window sub-sequences of , and reaction events, respectively. Moreover, the event time-series were split into 100 blocks of one second duration each. For models B–E (Chemotaxis, Chemotaxis-ext, Multi-sites, and TLBR), the probabilities of reaction -tuples are nearly constant within the blocks. On the other hand, model A (Multi-states) appears to experience a transition into a steady-state where the reaction probabilities become constant. Furthermore, the event -tuples can be naturally clustered by assuming their frequencies of occurrence as indicated in Tables S1–S5.
| Model | A | B | C | D | E |
| functions | - | 17 | 11 | - | - |
| parameters | 11 | 55 | 53 | 22 | 11 |
| groups | 6 | - | - | - | 5 |
| molecule types | 5 | - | - | 4 | 5 |
| species | 5 | 12 | 37 | 4 | 5 |
| ext. species | 11 | - | - | - | 68 |
| reaction rules | 6 | 41 | 32 | 6 | 17 |
| ext. reactions | 20 | - | - | - | 290 |
| ext. iterations | 5 | - | - | - | 10 |
| Model | A | B | C | D | E |
|---|---|---|---|---|---|
| reaction events | 133,513 | 57,621 | 53,457 | 17,238 | 2,353,366 |
| reaction types | 6 | 22 | 16 | 24 | 18 |
| walk-clock time [s] | 0.1 | 2.8 | 1.5 | 1.5 | 1.6 |
Experiment 2:
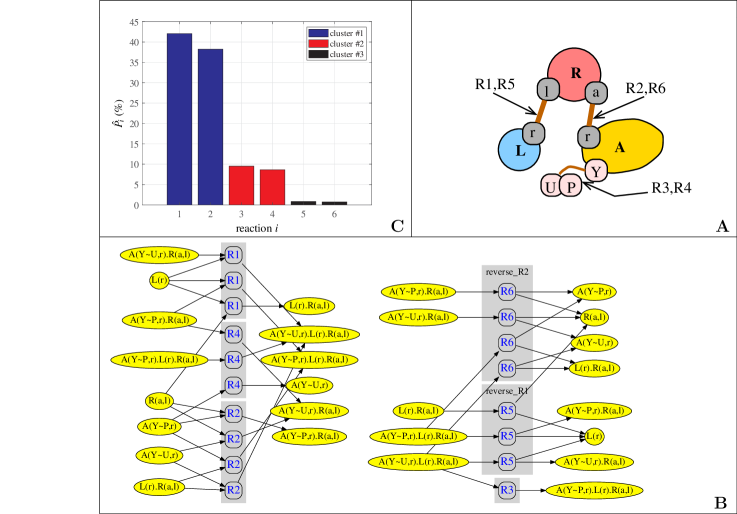
The objective of this experiment is to compare the frequency of occurrence of individual reaction rules. The long-term probabilities of individual reactions for Model A are shown in Figure 5A, and for other models, they are shown in Figures S2–S5. These probabilities can be used to naturally cluster the reaction rules. In particular, 3 reaction clusters can be defined for Models A, B and C, but only 2 such clusters are defined for Models D and E.
Experiment 3:
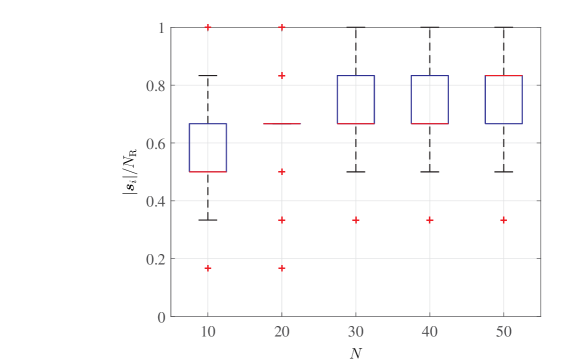
This experiment evaluates how many unique reaction events are occurring within the sub-sequences of reaction events. The median, the quartiles Q1 and Q3 as well as the outliers of the random variables, , are shown as box plots in Figure 6, for Model A, and in Figures S7–S10, for Models B–E. In general, it can be observed that the median is non-linearly and nearly monotonically increasing with the length of the reaction event -tuples until it eventually levels-off. Interestingly, for some values , the inter-quartile range collapses, and the median and the quartiles Q1 and Q3 coincide.
Experiment 4:
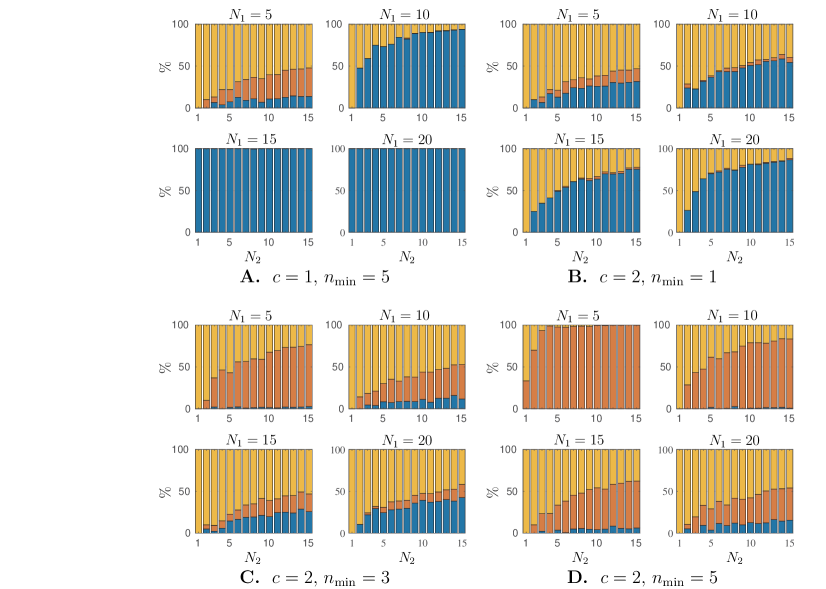
This experiment implements the proposed query-response method to determine causal relationships between the neighboring pairs of the reaction event sub-sequences. In particular, the query here is formed by the minimum number of reactions from a selected reaction cluster that must have occurred within the left sub-sequences of reaction events. The right sub-sequences of reaction events are first converted into the sets of unique reaction events. These sets can be then divided into three groups. The first group contains the reaction rules from the right sub-sequences of events corresponding to the left sub-sequences of events, which were selected by the query, and that do not appear in the reaction event sub-sequences outside (i.e., not selected by) the query. The second group are the reaction sets that only appear in the right event sub-sequences outside (i.e., not selected by) the query. The third group represents the reaction sets that are shared between the right sub-sequences within the query-selected as well as the query-not selected right sub-sequences.
Denote as , and , respectively, the relative sizes of these three groups, so that (see Figure 4A). The values (blue bars), (red bars) and (yellow bars) for Model A are shown as stacked bar plots in Figure 7. The experiments are labeled as “4-C-F”, where is the required minimum number of reactions from the reaction cluster, , to have occurred in each left sub-sequence of reaction events. The complete experimental results for all models and and are provided in Figures S11–S88 in the Supplementary.
The plots in Figure 7 suggest that both and are the important parameters in formulating the query. Ideally, the size of the response (the effects) matches the size of the query (the causes). This is the case when , i.e., the responses fully cover different queries, which is indicated by the full blue bars in Figure 7. When (tall red bars in Figure 7), none or only a few responses match the queries about the effects. Such responses indicate that most of the right event sub-sequences are causally unrelated to the query. Larger values (large yellow bars) correspond to cases when none or only a few event sub-sequences in the response can be considered to be either causally related or causally unrelated to the query, so these cases have the smallest information insight.
In general, it can be concluded that larger values of , which are used to formulate the query about the effects as well as larger values of , which are used to identify a common property or feature among the right event sub-sequences chosen by the query, shift the probability mass towards either the causal or non-causal event sets.
Experiment 5:
This experiment extends Experiment 4 in order to illustrate how to generate causal statements about the BRN considered. In particular, consider again Model A as an example. This model represents ligand-receptor (L-R) binding in the presence of adapter protein (A). The adapter protein contains tyrosine (Y), which can be in phosporylated (P) or unphosporylated (U) form Colvin et al. (2009). The model is referred to as being multi-site, since all species L, R and A contain dedicated binding sites (Figure 5B). There are only six reactions defined in this model. Specifically, R1 and R5 denote binding (forward reaction) and unbinding (reverse reaction) of ligand to receptor, respectively, whereas R2 and R6 denote binding (forward reaction) and unbinding (reverse reaction) of adapter to receptor, respectively. The phosporylation and unphosporylation are labeled as reactions R3 and R4, respectively. The completely expanded reaction rules are then shown in Figure 5C.
The examples of generated causal statements are summarized in Table 3. In particular, the query representing a cause is defined as the minimum number of reactions from the given reaction cluster , and that must have occurred within the reaction sub-sequences of events. The query size in Table 3 indicates how many of such reaction sub-sequences satisfy this condition, while only the unique sub-sequences are counted. The response representing the effect is formed by all subsequent sub-sequences of reaction events; only the unique such sub-sequences are again counted in Table 3 to indicate the size of the response. In addition, the minimum and the maximum numbers of all six reactions defined in Model A contained within the response event sub-sequences are reported in Table 3. For instance, it can be observed from Table 3 that some reactions are guaranteed to occur with a certainty (non-zero minimum counts) within the query response.
| query | query | response | min–max observed reactions | ||||||
|---|---|---|---|---|---|---|---|---|---|
| cluster | size | size | |||||||
| 5 | 1 | 2670 | 919 | 2–24 | 0–20 | 0–11 | 0–8 | 0–3 | 0–3 |
| 15 | 1 | 2645 | 913 | 2–24 | 0–20 | 0–11 | 0–8 | 0–3 | 0–3 |
| 5 | 2 | 1267 | 593 | 3–21 | 0–17 | 0–9 | 0–7 | 0–2 | 0–3 |
| 10 | 2 | 46 | 45 | 5–18 | 1–14 | 0–8 | 0–5 | 0–1 | 0–1 |
| 1 | 3 | 824 | 469 | 3–19 | 2–17 | 0–7 | 0–8 | 0–2 | 0–3 |
| 3 | 3 | 17 | 17 | 6–10 | 10–11 | 1–3 | 2–5 | 0–1 | 0–1 |
Experiment 6:
This experiment is similar to Experiment 4, however, now the query about causes is anti-causal as it selects the right reaction events as effects, and the returned response are the corresponding left reaction sub-sequences to be evaluated as possible reaction causes. The values , and , can be again defined to be the fractions of sizes of the left reaction event sets that are within the given query (blue bars), outside the given query (red bars), or lie in the intersection of these two groups (yellow bars) (cf. Figure 4B).
These experiments are labeled as “5-C-F” with the same definition for and as in Experiment 5. Interestingly, given and , the bar plots for Experiment 4 and 5 are similar but not identical. However, this is a consequence of how the queries are formulated, and how the responses with the common property or feature are determined in our examples, rather than a general rule.
Experiment 7:
Similarly to Experiment 5, which has been used to produce the examples of causal statements corresponding to Experiment 4, Experiment 7 generates anti-causal statements for Experiment 6. Model A described in Figure 5 is again considered as example. In particular, the query representing the effects is formed by the sub-sequences of reaction events containing at least the given number of reactions from the reaction cluster , and , respectively. The preceding sub-sequences of reaction events representing the cause contain a certain minimum and maximum number of reactions as shown in Table 4. The minimum counts are sometimes non-zero, so that the corresponding reactions are guaranteed to occur within the event sub-sequences corresponding to the cause.
| query | query | response | min–max observed reactions | ||||||
|---|---|---|---|---|---|---|---|---|---|
| cluster | size | size | |||||||
| 5 | 1 | 2670 | 887 | 3-24 | 0-18 | 0-12 | 0-8 | 0-3 | 0-3 |
| 15 | 1 | 2648 | 884 | 3-24 | 0-18 | 0-12 | 0-8 | 0-3 | 0-3 |
| 5 | 2 | 1264 | 590 | 3-21 | 0-18 | 0-12 | 0-8 | 0-2 | 0-3 |
| 10 | 2 | 39 | 38 | 6-15 | 4-11 | 0-6 | 2-6 | 0-1 | 0-2 |
| 1 | 3 | 879 | 455 | 3-16 | 3-17 | 0-8 | 0-8 | 0-2 | 0-3 |
| 3 | 3 | 16 | 16 | 7-14 | 7-13 | 0-4 | 0-2 | 0-2 | 0-2 |
5 Discussion
In this paper, BRNs were newly analyzed assuming the recorded traces of reaction events. The traces were produced by network-free simulations, so they represent the sequences of reaction rules rather than actual reactions. The reaction rules can be used to perfectly reconstruct changes in the copy counts of molecular objects having multiple binding and modification sites, so they contain complete information about the system dynamics. It is different from the previous strategy, where the dynamics of BRNs are deduced from traces of the species copy counts. Working with event traces also requires much less storage, since only a single reaction index needs to be recorded, whereas storing the complete system state is usually only done at predefined time instances in order to reduce the overall storage size.
The main objective of this paper is to identify causally or anti-causally related and causally unrelated event sub-sequences rather than to explicitly infer the system dynamics. The traditional approach for obtaining the SCM of a BRN assumes a steady-state distribution of molecule copy counts, and then defining the transformations between dependent random variables as demonstrated in Ness et al. (2019). The causality in the present paper assumes the empirical probabilities of sub-sequences of reaction rules over one or more reaction traces obtained from stochastic simulations of a given BRN. This approach allows inferring, with a very high probability, the causality between sub-sequences of reaction events, and also formulating causal statements such as “if the observed sub-sequence of reaction events contains a defined multiplicity of certain reactions, then, with near certainty, the subsequent sub-sequence of reactions will contain at least or at most some predefined number of other reactions”. The interesting problem for future research is how to reconcile the SCM models capturing causality among the molecule copy counts with the causal models defined for reaction event sub-sequences.
There are many definitions of causality in the literature. These definitions usually assume either interventions, or they determine the independences between random variables. For instance, causality between chemical reactions has been associated with their dependency in Dang et al. (2015). General causality in multivariate time-series has been studied extensively Hlaváčková-Schindlera et al. (2007); Eichler (2011); Runge et al. (2019). The basic consideration is whether the statistical associations such as correlations or conditional dependencies may be sufficient to claim causality under some conditions, and whether causality can be inferred solely from the observations without any prior knowledge. A short answer is that a causal discovery from data and from observed statistical associations are critically dependent on the structure of data. The event time-series described by linear model (1), which was assumed in this paper, involve categorical random variables.
The causal ordering of reaction event sub-sequences provides additional qualitative information about the dynamics of BRNs. Once causally related reaction sub-sequences have been identified, they can be interpreted as guaranteed changes in the species concentrations, i.e., as causal changes in the state of a BRN. This may allow identifying the components and modules of BRNs with more predictable dynamics. However, the reaction events can only be recorded in computer simulations. For in vivo and in vitro experiments, the reaction events must be inferred from the observed molecular concentrations. Moreover, it may not be completely known, which reactions are occurring in the given BRN. In such a case, the causally related reaction sub-sequences can be exploited as prior information on the multiplicities of possible reactions occurring between the observations.
In this paper, it was proposed to identify the causally related and unrelated reaction event sub-sequences by measuring their empirical conditional probabilities, and then identifying the cases when these probabilities are either very large or very small. The proposed method was implemented as a computationally efficient query-response mechanism for selecting the reaction event sub-sequences. Specifically, the sliding-window event sub-sequences are further split into the left and the right event sub-sequences, which may be then converted into sets or multi-sets. The causal query about the effects identifies a set of left reaction events, and the corresponding right events are then evaluated to identify their shared property or feature. It is crucial that this property or feature is not present in any other right event sub-sequences that were not selected by the query. The response to a given query is the list of event sub-sequences having the identified common property or feature. For anti-causal query about causes, the selected effects consisting of the right event sub-sequences are matched with their left event sub-sequences. The search is then performed to again identify a shared property or feature, which can be returned as the cause in the response to a given query. Furthermore, the reasoning in both causal and anti-causal query-responses can be inverted in order to identify non-causal associations instead.
The future work can consider more systematic approach to formulating complex queries about the reaction events, and devising computationally effective methods for searching shared properties or features among the event sub-sequences forming the response. The causal discovery may also exploit both the reaction events and the molecule copy counts. More importantly, once the causally related or unrelated event sub-sequences have been identified, the crucial question is how to interpret such information to better understand the functions or dynamics of a BRN, especially in the context of the biological system that this BRN represents. Moreover, causality could be also studied assuming deterministic models of BRNs, which has not been considered in this paper.
The distance metrics listed in Section 2 for the sequences, sets and multi-sets of reaction events allow defining equivalences between the events, and to perform the matrix profile analysis. The canonical matrix profile can be modified to not only show the minimum distance values, but to also provide the maxima and any other statistics of the distances including their multiplicities. It resembles a feature extraction mechanism where the original time-series are transformed into another time-series representation. Unfortunately, at present, the libraries implementing the canonical matrix profile are only optimized for the minimum Euclidean distance calculations. It would be extremely useful to provide a highly optimized implementation of the matrix profile algorithm allowing for arbitrary distance metrics and other statistics. There is also a need to have a general and fast computing framework for sliding-window processing of multivariate time-series data in Python and in other languages.
The NFsim software can be further modified to remove unused or rarely used features from the source code, and to refactor the source code for better readability, speed and efficiency. Lastly, as demonstrated in this paper, the data processing and visualization can be readily automated; however, also automating the interpretation of the produced results is much harder, but also much more interesting problem to consider in the future Loskot (2018).
6 Conclusion
The event time-series generated by the stochastic simulations of BRNs were used to discover causally related event sub-sequences. The causality was defined in terms of conditionally certain and conditionally uncertain reaction events. The causal, non-causal and anti-causal associations were determined by the computationally efficient query-response mechanism. In addition, since the ordering of reaction events is locally irrelevant, the event sub-sequences were transformed into the event sets or multi-sets. This can be exploited in defining various distance metrics between the event sub-sequences. The event sub-sequences having the zero distance are then assumed to be equivalent. The sequence equivalence increases the likelihood of identifying the causally related events. The defined distance metrics can be also used in the matrix profile analysis of the event time-series.
Producing the numerical results required to modify and update the popular stochastic simulator of BRNs NFsim. The reaction event time-series from the simulations of five models of BRNs were processed by Python and Matlab scripts within the seven defined numerical experiments. All tables and figures automatically generated by the scripts are summarized in Supplementary, whereas only the selected results are presented in the main paper.
Acknowledgment
This work was supported by a research grant from Zhejiang University.
Figures


References
- Batista et al. (2013) Batista, G. E., Keogh, E. J., Tataw, O. M., and Souza, V. M. (2013). CID: an efficient complexity-invariant distance for time series. Data Mining and Knowledge Discovery 28, 634–669. 10.1007/s10618-013-0312-3
- Bergmann et al. (2017) Bergmann, F. T., Hoops, S., Klahn, B., Kummer, U., Mendes, P., Pahle, J., et al. (2017). COPASI and its applications in biotechnology. Journal of Biotechnology 261, 215–220. 10.1016/j.jbiotec.2017.06.1200
- Blinov et al. (2004) Blinov, M. L., Faeder, J. R., Goldstein, B., and Hlavacek, W. S. (2004). Software for rule-based modeling of signal transduction based on the interactions of molecular domains. Bioinformatics 20, 3289–3291. 10.1093/bioinformatics/bth378
- Blinov et al. (2021) Blinov, M. L., Faeder, J. R., Hlavacek, W. S., Goldstein, B., Hogg, J., Harris, L., et al. (2021). BioNetGen source code, version 2.7.0. https://github.com/RuleWorld/bionetgen
- Cassisi et al. (2012) Cassisi, C., Montalto, P., Aliotta, M., Cannata, A., and Pulvirenti, A. (2012). Similarity Measures and Dimensionality Reduction Techniques for Time Series Data Mining (IntechOpen, London, UK). 71–96. 10.5772/49941
- Chikahara and Fujino (2018) Chikahara, Y. and Fujino, A. (2018). Causal inference in time series via supervised learning. In IJCAI’18. 2042–2048. 10.5555/3304889.3304943
- Colvin et al. (2009) Colvin, J., Monine, M. I., Faeder, J. R., Hlavacek, W. S., Hoff, D. D. V., and Posner, R. G. (2009). Simulation of large-scale rule-based models. Bioinformatics 25, 910–917. 10.1093/bioinformatics/btp066
- Colvin et al. (2010) Colvin, J., Monine, M. I., Gutenkunst, R. N., Hlavacek, W. S., Hoff, D. D. V., and Posner, R. G. (2010). RuleMonkey: software for stochastic simulation of rule-based models. BMC Bioinformatics 11, 1–14. 10.1186/1471-2105-11-404
- Connolly et al. (2022) Connolly, S., Gilbert, D., and Heiner, M. (2022). From epidemic to pandemic modelling. Frontiers in Systems Biology 2, 1–23. 10.3389/fsysb.2022.861562
- Dang et al. (2015) Dang, T. N., Murray, P., Aurisano, J., and Forbes, A. G. (2015). ReactionFlow: an interactive visualization tool for causality analysis in biological pathways. BMC Proceedings 9, 1–18. 10.1186/1753-6561-9-S6-S6
- Eichler (2011) Eichler, M. (2011). Causal Inference in Time Series Analysis (Wiley), chap. In Causality (eds W.A. Shewhart et al.). 10.1002/9781119945710.ch22
- Faeder et al. (2009) Faeder, J. R., Blinov, M. L., and Hlavacek, W. S. (2009). Systems Biology. Methods in Molecular Biology (Humana Press), vol. 500, chap. Rule-Based Modeling of Biochemical Systems with BioNetGen. 113–168. 10.1007/978-1-59745-525-1_5
- Gilbert et al. (2019) Gilbert, D., Heiner, M., Jayaweera, Y., and Rohr, C. (2019). Towards dynamic genome-scale models. Briefings in Bioinformatics 20, 1167–1180. 10.1093/bib/bbx096
- Gillespie (2007) Gillespie, D. T. (2007). Stochastic simulation of chemical kinetics. Annual Review of Physical Chemistry 58, 35–55. 10.1146/annurev.physchem.58.032806.104637
- Gupta and Mendes (2018) Gupta, A. and Mendes, P. (2018). An overview of network-based and -free approaches for stochastic simulation of biochemical systems. Computation 6, 1–20. 10.3390/computation6010009
- Hansen et al. (2008) Hansen, C. H., Endres, R. G., and Wingreen, N. S. (2008). Chemotaxis in Escherichia coli: A molecular model for robust precise adaptation. PLOS Computational Biology 4, 0014–0027. 10.1371/journal.pcbi.0040001
- Harris et al. (2016) Harris, L. A., Hogg, J. S., Tapia, J.-J., Sekar, J. A. P., Gupta, S., Korsunsky, I., et al. (2016). Bionetgen 2.2: advances in rule-based modeling. Bioinformatics 32, 3366–3368. 10.1093/bioinformatics/btw469
- Hlaváčková-Schindlera et al. (2007) Hlaváčková-Schindlera, K., Paluš, M., Vejmelka, M., and Bhattacharya, J. (2007). Causality detection based on information-theoretic approaches in time series analysis. Physics Reports 441, 1–46. 10.1016/j.physrep.2006.12.004
- Kazeroonian et al. (2016) Kazeroonian, A., Fröhlich, F., Raue, A., Theis, F. J., and Hasenauer, J. (2016). CERENA: ChEmical REaction Network Analyzer — A toolbox for the simulation and analysis of stochastic chemical kinetics. PLoS ONE 11, 1–15. 10.1371/journal.pone.0146732
- Klinke II and Finley (2012) Klinke II, D. J. and Finley, S. D. (2012). Timescale analysis of rule-based biochemical reaction networks. Biotechnology Prog. 28, 33–44. 10.1002/btpr.704
- Law (2019) Law, S. M. (2019). STUMPY: A powerful and scalable Python library for time series data mining. Journal of Open Source Software 4, 1504
- Lopez-Paz et al. (2015) Lopez-Paz, D., Muandet, K., Schölkopf, B., and Tolstikhin, I. (2015). Towards a learning theory of cause-effect inference. In ICML’15. vol. 37, 1452–1461. 10.5555/3045118.3045273
- Loskot (2018) Loskot, P. (2018). Automation is coming to research. IEEE Signal Processing Magazine 35, 140–138. 10.1109/MSP.2018.2811006
- Loskot (2022a) Loskot, P. (2022a). Discovering causality in event time-series. In SIGNAL 2022. 18–23
- Loskot (2022b) Loskot, P. (2022b). NFsim source code, version 1.20. https://github.com/ploskot/nfsim
- Loskot et al. (2019) Loskot, P., Atitey, K., and Mihaylova, L. (2019). Comprehensive review of models and methods for inferences in bio-chemical reaction networks. Frontiers in Genetics 10, 1–29. 10.3389/fgene.2019.00549
- Löwe et al. (2022) Löwe, S., Madras, D., Zemel, R., and Welling, M. (2022). Amortized causal discovery: Learning to infer causal graphs from time-series data. ArXiv:2006.10833 [cs.LG]
- Moraffah et al. (2021) Moraffah, R., Sheth, P., Karami, M., Bhattacharya, A., Wang, Q., Tahir, A., et al. (2021). Causal inference for time series analysis: problems, methods and evaluation. Knowledge and Information Systems 63, 3041–3085. 10.1007/s10115-021-01621-0
- Mueen et al. (2011) Mueen, A., Keogh, E., and Young, N. (2011). Logical-shapelets: An expressive primitive for time series classification. In ACM SIGKDD. 1154–1162. 10.1145/2020408.2020587
- Ness et al. (2019) Ness, R., Paneri, K., and Vitek, O. (2019). Integrating Markov processes with structural causal modeling enables counterfactual inference in complex systems. In NIPS’19. vol. 1275, 14234–14244. 10.5555/3454287.3455562
- Papana et al. (2013) Papana, A., Kyrtsou, C., Kugiumtzis, D., and Diks, C. (2013). Simulation study of direct causality measures in multivariate time series. Entropy 15, 2635–2661. 10.3390/e15072635
- Park and Kellis (2021) Park, Y. P. and Kellis, M. (2021). CoCoA-diff: counterfactual inference for single-cell gene expression. Genome Biology 22, 1–23. 10.1186/s13059-021-02438-4
- Pearl (2009) Pearl, J. (2009). Causal inference in statistics: An overview. Statistics Surveys 3, 96–146. 10.1214/09-SS057
- Peters et al. (2017) Peters, J., Janzing, D., and Schölkopf, B. (2017). Elements of Causal Inference (The MIT Press, Cambridge, Massachusetts)
- Runge et al. (2019) Runge, J., Bathiany, S., Bollt, E., Camps-Valls, G., Coumou, D., Deyle, E., et al. (2019). Inferring causation from time series in Earth system sciences. Nature Communications 10, 1–13. 10.1038/s41467-019-10105-3
- Sneddon et al. (2011) Sneddon, M. W., Faeder, J. R., and Emonet, T. (2011). Efficient modeling, simulation and coarse-graining of biological complexity with NFsim. Nature Methods 8, 177–185. 10.1038/nmeth.1546
- Sneddon et al. (2012) Sneddon, M. W., Hogg, J. S., Faeder, J. R., and Emonet, T. (2012). NFsim source code, version 1.11. https://github.com/msneddon/nfsim
- Soo and Rottman (2018) Soo, K. W. and Rottman, B. M. (2018). Causal strength induction from time series data. Journal of Experimental Psychology: General 147, 485–513. 10.1037/xge0000423
- Sunkara (2009) Sunkara, V. (2009). The chemical master equation with respect to reaction counts. In 18th World IMACS / MODSIM Congress. 703–707
- Sunkara (2019) Sunkara, V. (2019). On the properties of the reaction counts chemical master equation. MDPI Entropy 21, 1–18. 10.3390/e21060607
- Villaverde et al. (2013) Villaverde, A. F., Ross, J., and Banga, J. R. (2013). Reverse engineering cellular networks with information theoretic methods. Cells 2, 306–329. 10.3390/cells2020306
- Vlachos et al. (2003) Vlachos, M., Hadjieleftheriou, M., Gunopulos, D., and Keogh, E. (2003). Indexing multi-dimensional time-series with support for multiple distance measures. In KDD’03. 216–225. 10.1145/956750.956777
- Warne et al. (2019) Warne, D. J., Baker, R. E., and Simpson, M. J. (2019). Simulation and inference algorithms for stochastic biochemical reaction networks: from basic concepts to state-of-the-art. J. Royal Society Interface 16, 1–20. 10.1098/rsif.2018.0943
- Wolf et al. (2010) Wolf, V., Goel, R., Mateescu, M., and Henzinger, T. A. (2010). Solving research article the chemical master equation using sliding windows. BMC Systems Biology 4, 1–19. 10.1186/1752-0509-4-42
- Yang and Hlavacek (2011) Yang, J. and Hlavacek, W. S. (2011). Efficiency of reactant site sampling in network-free simulation of rule-based models for biochemical systems. Physical Biology 8, 055009. 10.1088/1478-3975/8/5/055009
- Yeh et al. (2018) Yeh, C.-C. M., Zhu, Y., Ulanova, L., Begum, N., Ding, Y., Dau, H. A., et al. (2018). Time series joins, motifs, discords and shapelets: a unifying view that exploits the matrix profile. Data Mining and Knowledge Discovery 32, 83–123. 10.1007/s10618-017-0519-9
- Zhang et al. (2017) Zhang, B.-G., Li, W., Shi, Y., Liu, X., and Chen, L. (2017). Detecting causality from short time-series data based on prediction of topologically equivalent attractors. BMC Systems Biology 11, 141–150. 10.1186/s12918-017-0512-3
- Zielezinski et al. (2017) Zielezinski, A., Vinga, S., Almeida, J., and Karlowski, W. M. (2017). Alignment-free sequence comparison: benefits, applications, and tools. Genome Biology 18, 1–17. 10.1186/s13059-017-1319-7
Supplementary Material
The numerical results were generated for 5 biochemical models labeled as A–E in 7 experiments labeled as 1–7.
The files are available at GitHub repository https://github.com/ploskot/nfsim/tree/update:
| data/ | sample history files produced from a single run of stochastic simulation |
|---|---|
| models/ | model definitions as BNGL files |
| scripts/ | Python and Matlab scripts for experiments |
Biochemical models
Model A: a multi-states system defined in models/modelA.bngl
References
- Blinov et al. (2004) Blinov, M. L., Faeder, J. R., Goldstein, B., and Hlavacek, W. S. (2004). Software for rule-based modeling of signal transduction based on the interactions of molecular domains. Bioinformatics 20, 3289–3291. 10.1093/bioinformatics/bth378
- Colvin et al. (2009) Colvin, J., Monine, M. I., Faeder, J. R., Hlavacek, W. S., Hoff, D. D. V., and Posner, R. G. (2009). Simulation of large-scale rule-based models. Bioinformatics 25, 910–917. 10.1093/bioinformatics/btp066
Model B: a model of chemotaxis defined in models/modelB.bngl
References
- Hansen et al. (2008) Hansen, C. H., Endres, R. G., and Wingreen, N. S. (2008). Chemotaxis in Escherichia coli: A molecular model for robust precise adaptation. PLOS Computational Biology 4, 0014–0027. 10.1371/journal.pcbi.0040001
Model C: an extended model of chemotaxis defined in models/modelC.bngl
References
- Hansen et al. (2008) Hansen, C. H., Endres, R. G., and Wingreen, N. S. (2008). Chemotaxis in Escherichia coli: A molecular model for robust precise adaptation. PLOS Computational Biology 4, 0014–0027. 10.1371/journal.pcbi.0040001
Model D: a model of trivalent ligand-bivalent receptor defined in models/modelD.bngl
References
- Sneddon et al. (2011) Sneddon, M. W., Faeder, J. R., and Emonet, T. (2011). Efficient modeling, simulation and coarse-graining of biological complexity with NFsim. Nature Methods 8, 177–183. 10.1038/nmeth.1546
- Yang and Hlavacek (2011) Yang, J. and Hlavacek, W. S. (2011). Efficiency of reactant site sampling in network-free simulation of rule-based models for biochemical systems. Physical Biology 8, 055009. 10.1088/1478-3975/8/5/055009
Model E: a multi-sites system defined in models/modelE.bngl
References
- Colvin et al. (2009) Colvin, J., Monine, M. I., Faeder, J. R., Hlavacek, W. S., Hoff, D. D. V., and Posner, R. G. (2009). Simulation of large-scale rule-based models. Bioinformatics 25, 910–917. 10.1093/bioinformatics/btp066
- Colvin et al. (2010) Colvin, J., Monine, M. I., Gutenkunst, R. N., Hlavacek, W. S., Hoff, D. D. V., and Posner, R. G. (2010). RuleMonkey: software for stochastic simulation of rule-based models. BMC Bioinformatics 11, 1–14. 10.1186/1471-2105-11-404
Experiments
Experiment 1: Python scripts script1.py and script2.py
Objective: find unique reaction -tuples and their counts, so they can be clustered by their frequency of occurrence; in addition, the -tuple statistics assume partitioning of events into 100 blocks of 1 second duration, and the minimum and maximum values across blocks are reported
Experiment 2: Matlab script mscript1.m
Objective: sort and cluster reactions by their frequency of occurrence
Experiment 3: Matlab script mscript2.m
Objective: the box plots of unique reactions within sliding-window event -tuples to visualize their statistics; it is assumed that reactions are sorted by their frequency of occurrence as in Figures 9–12
Experiment 4: Matlab script mscript3.m
Objective: assessment of reaction -tuples as effects for the query about -tuple as causes; the experiments and figures are labeled by the query, i.e., “”, where is the required minimum number of reactions from the reaction cluster occurring within reaction -tuples
Experiment 5: Matlab script mscript4.m
Objective: generate causal statements for Experiment 4
Output: Table 3 in the main text
Experiment 6: Matlab script mscript5.m
Objective: assessment of reaction -tuples as causes for the query about -tuples as effects; the experiments and figures are labeled by the query, i.e., “”, where is the required minimum number of reactions from the reaction cluster occurring within reaction -tuples
Experiment 7: Matlab script mscript6.m
Objective: generate anti-causal statements for Experiment 6
Output: Table 4 in the main text
|
-tuple |
Cluster |
Uniq. tuples |
Min freq. |
Max freq. |
Tuples total |
|---|---|---|---|---|---|
| 1 | 1–2 | 457–5618 | 473–5618 | 930–5618 | |
| 2 | 1–2 | 85–1281 | 92–1281 | 177–1281 | |
| 3 | 1–2 | 5–473 | 7–473 | 8–473 | |
| 4 | 1–1 | 1–126 | 1–126 | 1–126 | |
| 5 | 1–1 | 13–13 | 13–13 | 13–13 | |
| 6 | 1–1 | 1–1 | 1–1 | 1–1 | |
| 1 | 1–8 | 55–3355 | 74–3355 | 559–3355 | |
| 2 | 3–62 | 3–759 | 20–764 | 370–2284 | |
| 3 | 4–32 | 2–154 | 2–188 | 8–1026 | |
| 4 | 5–39 | 1–57 | 1–64 | 14–303 | |
| 5 | 16–44 | 1–3 | 1–38 | 20–505 | |
| 6 | 8–27 | 1–2 | 1–2 | 16–27 | |
| 7 | 21–21 | 1–1 | 1–1 | 21–21 | |
| 1 | 1–153 | 3–2090 | 15–2090 | 32–2090 | |
| 2 | 5–109 | 2–457 | 2–486 | 114–2349 | |
| 3 | 10–346 | 1–104 | 1–130 | 142–1153 | |
| 4 | 5–304 | 1–58 | 1–72 | 188–331 | |
| 5 | 138–266 | 1–3 | 1–40 | 266–1194 | |
| 6 | 78–78 | 2–2 | 2–2 | 156–156 | |
| 7 | 235–235 | 1–1 | 1–1 | 235–235 |
|
-tuple |
Cluster |
Uniq. tuples |
Min freq. |
Max freq. |
Tuples total |
|---|---|---|---|---|---|
| 1 | 1–22 | 6–537 | 42–539 | 62–1076 | |
| 2 | 1–19 | 3–64 | 14–123 | 25–1278 | |
| 3 | 1–15 | 1–40 | 1–42 | 1–294 | |
| 4 | 1–14 | 1–13 | 1–24 | 1–174 | |
| 5 | 1–7 | 1–5 | 1–9 | 1–53 | |
| 6 | 1–2 | 1–2 | 1–2 | 1–2 | |
| 1 | 1–283 | 3–21 | 8–27 | 12–1604 | |
| 2 | 1–186 | 2–12 | 2–14 | 12–372 | |
| 3 | 46–540 | 1–3 | 1–8 | 92–540 | |
| 4 | 59–259 | 1–2 | 1–2 | 118–259 | |
| 5 | 218–218 | 1–1 | 1–1 | 218–218 | |
| 1 | 1–29 | 2–5 | 2–5 | 3–83 | |
| 2 | 4–577 | 1–3 | 1–3 | 12–577 | |
| 3 | 15–2169 | 1–2 | 1–2 | 30–2169 | |
| 4 | 517–541 | 1–1 | 1–1 | 517–541 |
|
-tuple |
Cluster |
Uniq. tuples |
Min freq. |
Max freq. |
Tuples total |
|---|---|---|---|---|---|
| 1 | 2–16 | 7–538 | 40–548 | 155–1086 | |
| 2 | 1–13 | 5–148 | 5–180 | 5–960 | |
| 3 | 1–2 | 7–85 | 7–98 | 7–183 | |
| 4 | 1–5 | 3–38 | 3–51 | 3–218 | |
| 5 | 1–1 | 17–17 | 17–17 | 17–17 | |
| 1 | 1–267 | 3–17 | 8–43 | 12–1895 | |
| 2 | 38–127 | 2–3 | 2–11 | 76–276 | |
| 3 | 37–313 | 1–2 | 1–2 | 74–313 | |
| 4 | 132–192 | 1–1 | 1–1 | 132–192 | |
| 1 | 1–43 | 2–6 | 2–6 | 3–141 | |
| 2 | 2–552 | 1–3 | 1–3 | 6–552 | |
| 3 | 18–1931 | 1–2 | 1–2 | 36–1931 | |
| 4 | 377–487 | 1–1 | 1–1 | 377–487 |
|
-tuple |
Cluster |
Uniq. tuples |
Min freq. |
Max freq. |
Tuples total |
|---|---|---|---|---|---|
| 1 | 1–24 | 3–21 | 10–31 | 14–330 | |
| 2 | 1–22 | 1–9 | 1–11 | 1–146 | |
| 3 | 1–6 | 1–6 | 1–6 | 1–13 | |
| 4 | 1–4 | 1–3 | 1–3 | 1–6 | |
| 5 | 1–4 | 1–1 | 1–1 | 1–4 | |
| 1 | 1–206 | 1–3 | 1–3 | 2–206 | |
| 2 | 6–319 | 1–2 | 1–2 | 12–319 | |
| 3 | 146–321 | 1–1 | 1–1 | 146–321 | |
| 1 | 1–334 | 1–2 | 1–2 | 2–334 | |
| 2 | 332–332 | 1–1 | 1–1 | 332–332 |
|
-tuple |
Cluster |
Uniq. tuples |
Min freq. |
Max freq. |
Tuples total |
|---|---|---|---|---|---|
| 1 | 6–12 | 1775–6391 | 1889–7173 | 22221–40805 | |
| 2 | 1–6 | 21–1674 | 36–2144 | 47–11491 | |
| 3 | 1–5 | 21–116 | 21–137 | 21–373 | |
| 4 | 3–3 | 29–29 | 33–33 | 94–94 | |
| 1 | 27–1741 | 3–222 | 24–280 | 6725–23459 | |
| 2 | 5–1767 | 2–3 | 2–148 | 15–44984 | |
| 3 | 46–596 | 1–2 | 1–2 | 92–596 | |
| 4 | 472–588 | 1–1 | 1–1 | 472–588 | |
| 1 | 12–2695 | 3–3 | 3–33 | 36–13087 | |
| 2 | 816–5051 | 2–2 | 2–2 | 1632–10102 | |
| 3 | 20738–29570 | 1–1 | 1–1 | 20738–29570 |
[\FBwidth]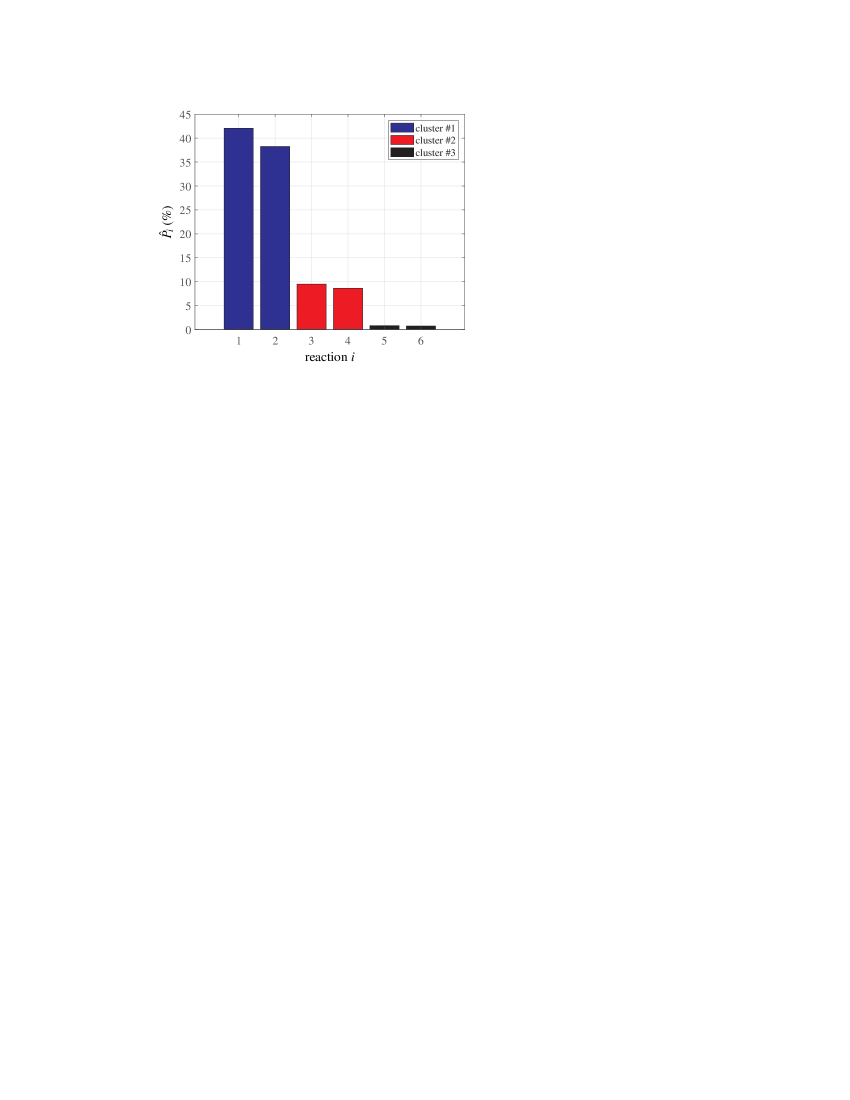 \ffigbox[\FBwidth]
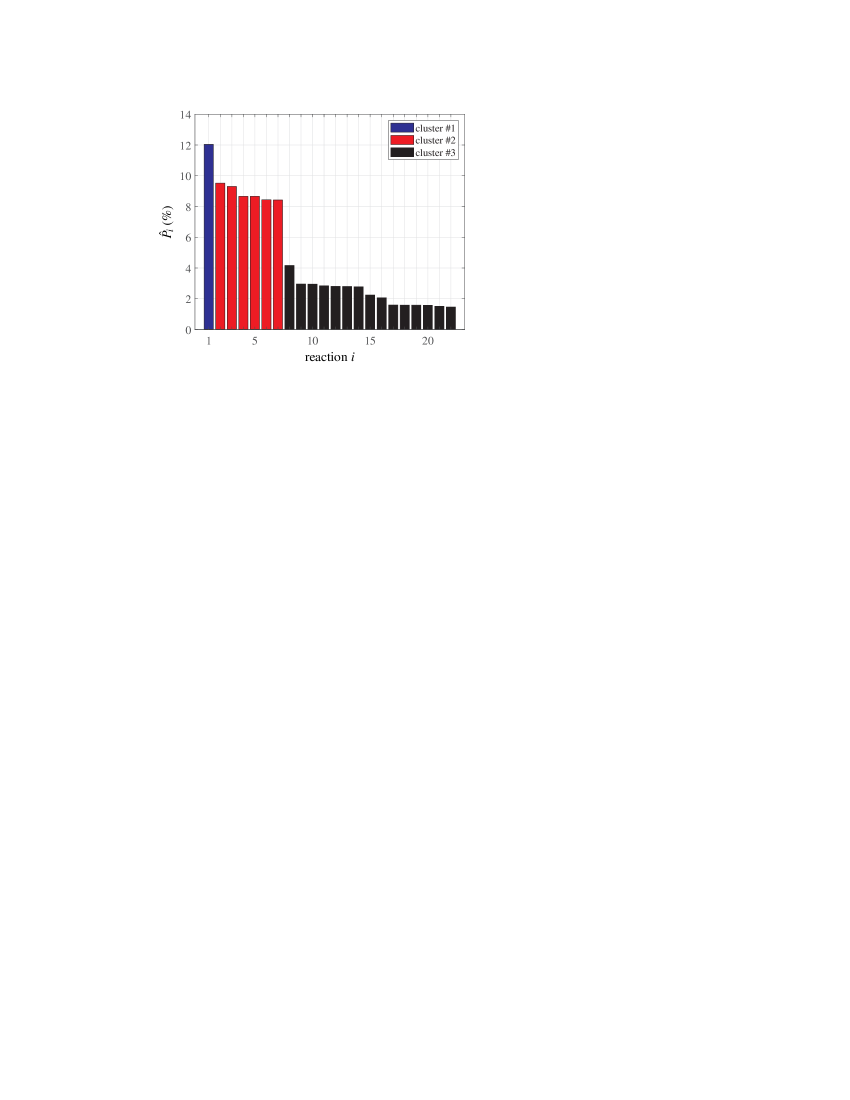
[\FBwidth]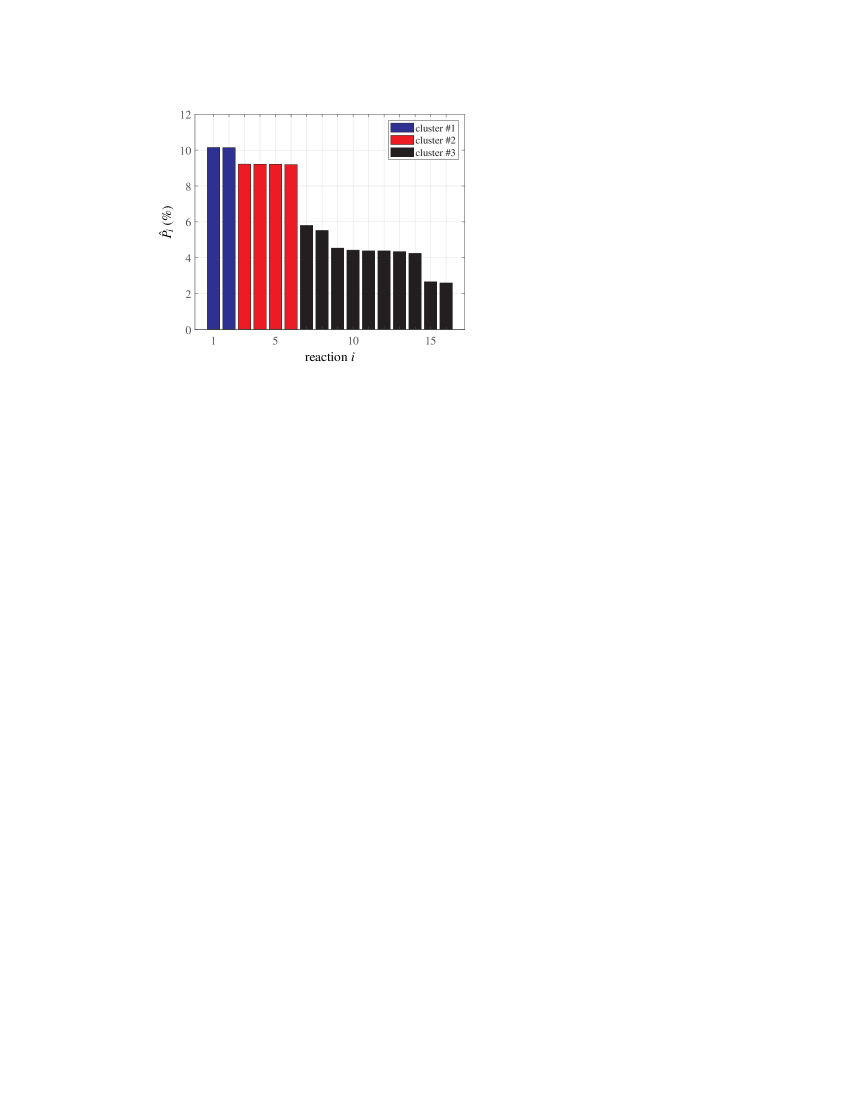 \ffigbox[\FBwidth]
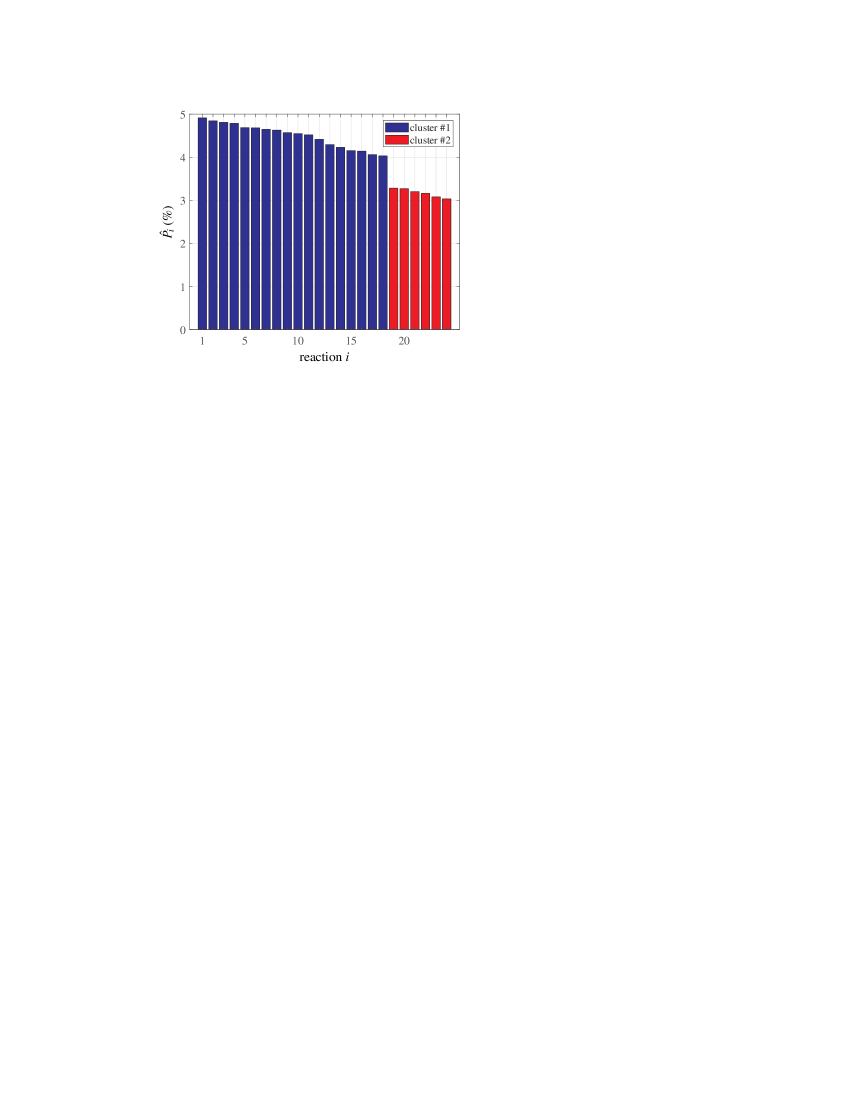
[\FBwidth]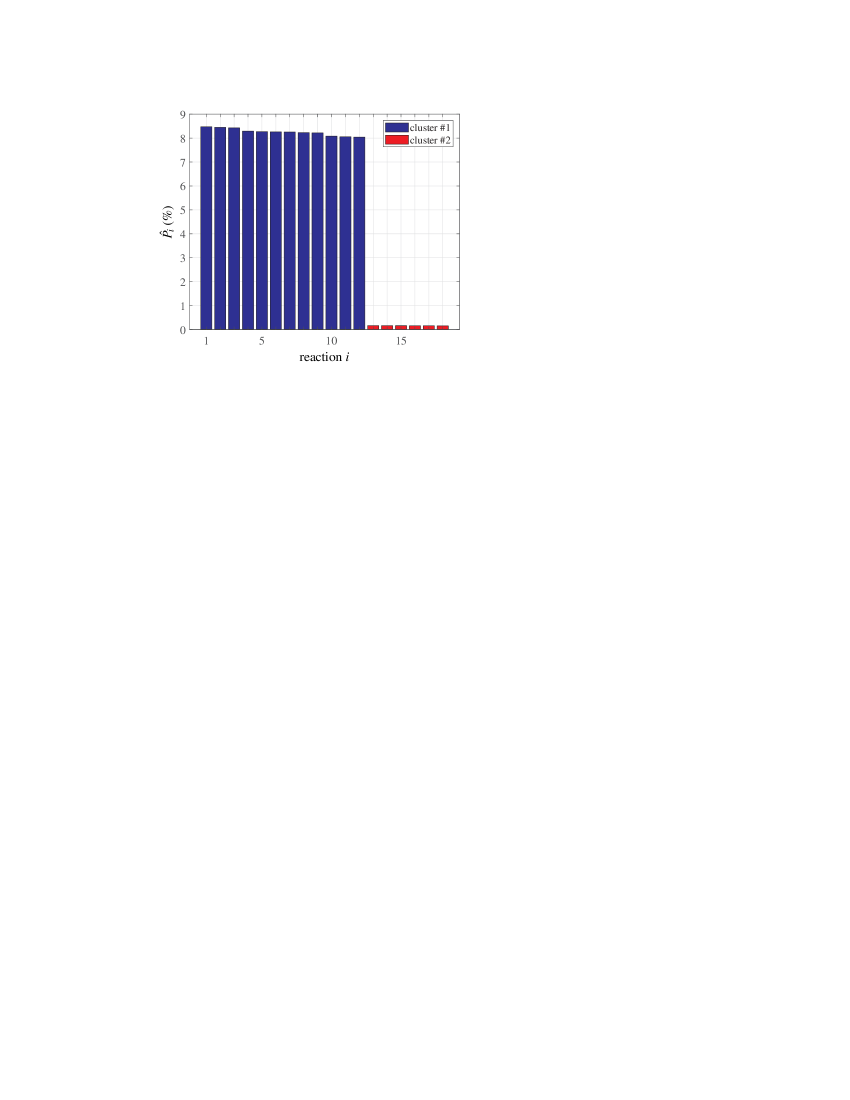
[\FBwidth]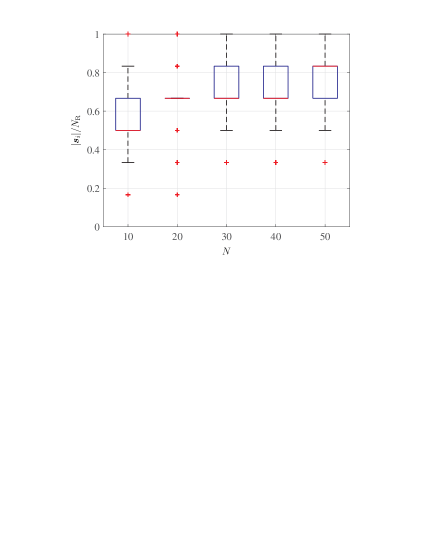 \ffigbox[\FBwidth]
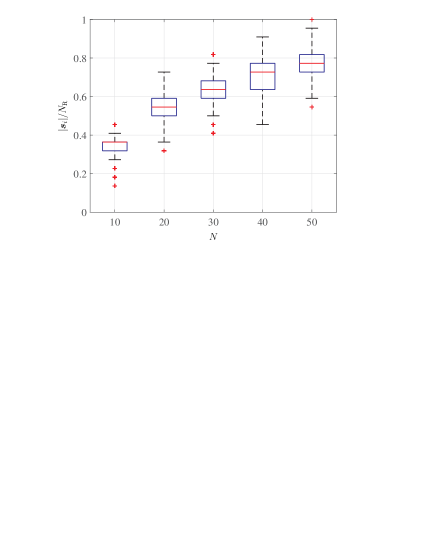
[\FBwidth]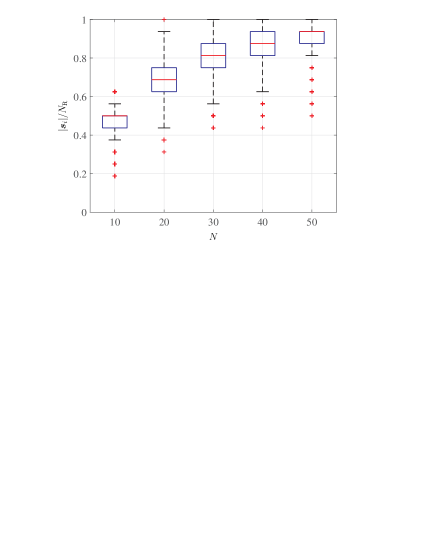 \ffigbox[\FBwidth]
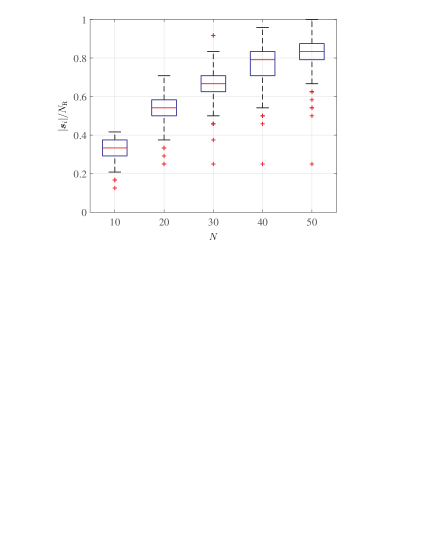
[\FBwidth]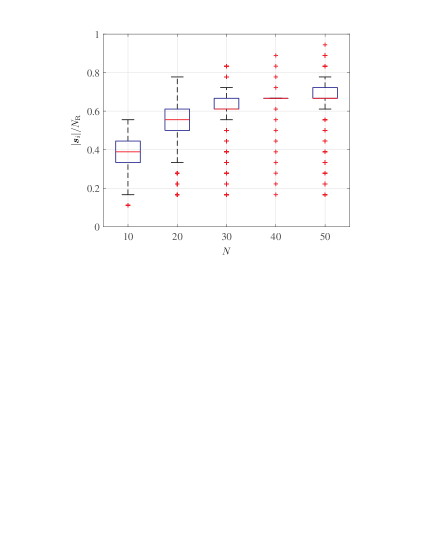
[\FBwidth]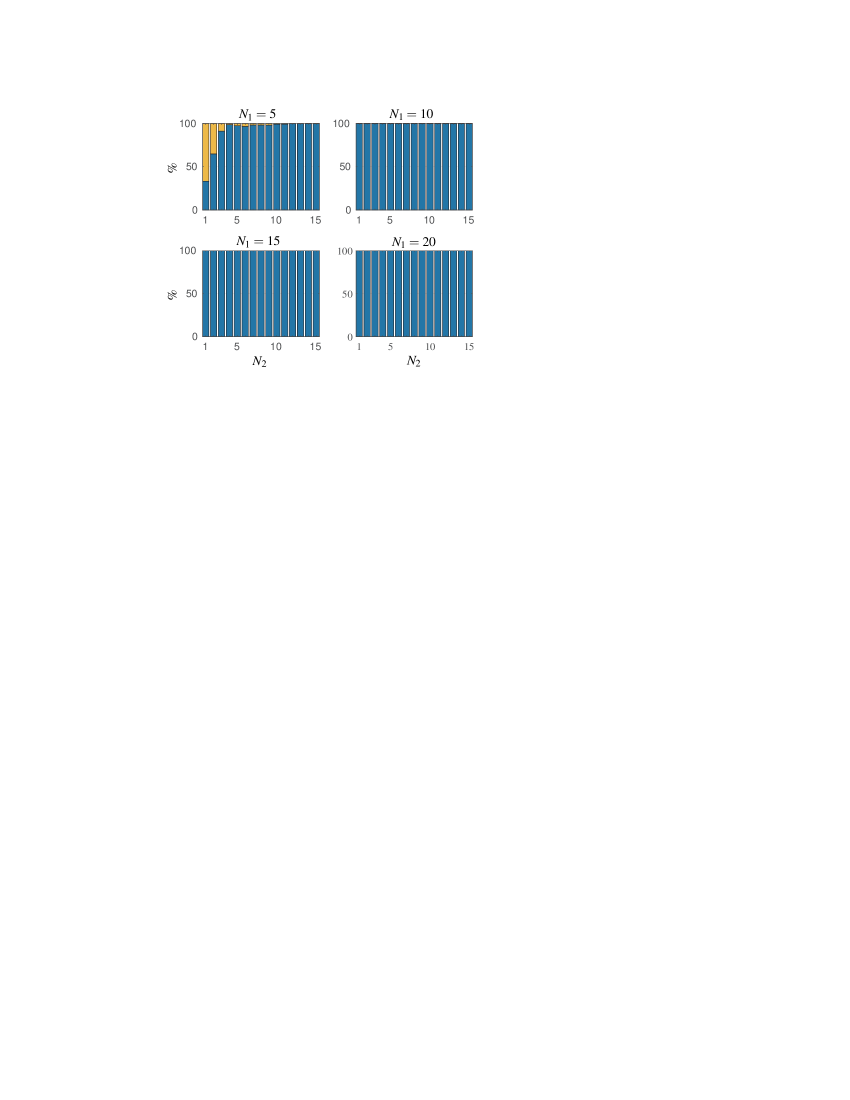 \ffigbox[\FBwidth]
[\FBwidth] \ffigbox[\FBwidth]
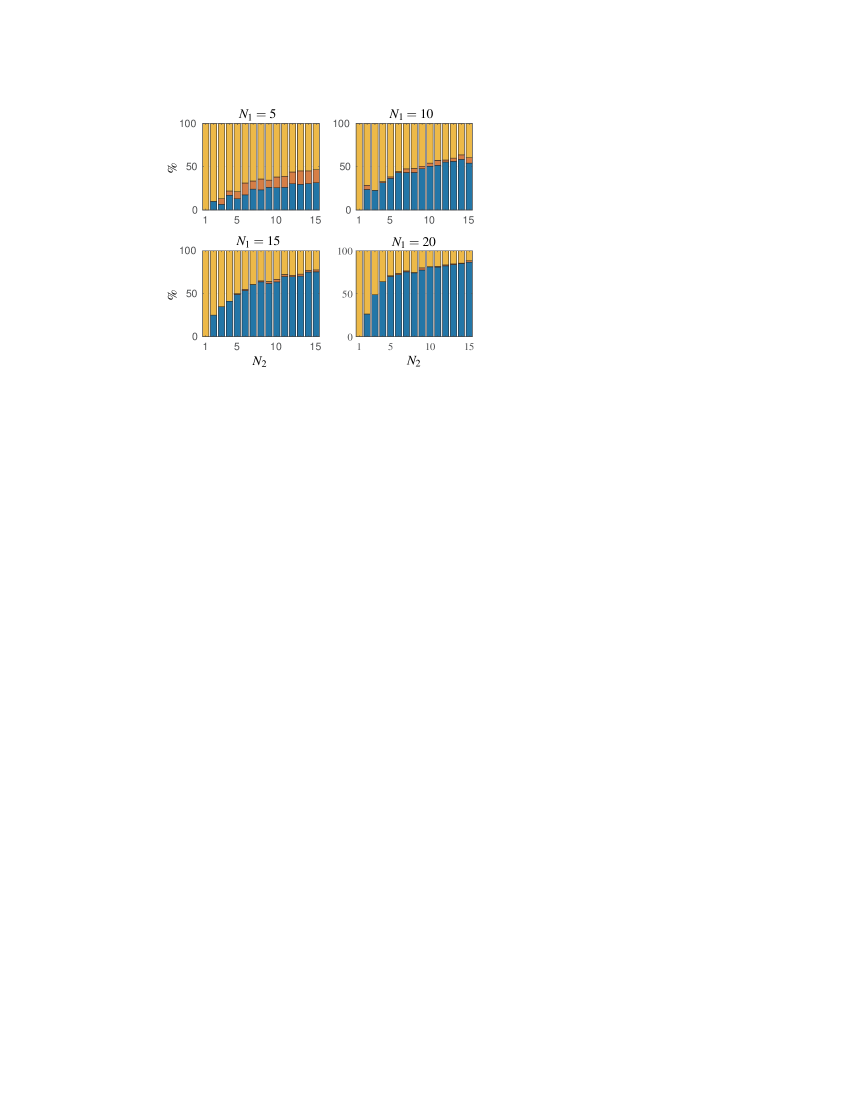
[\FBwidth] \ffigbox[\FBwidth]
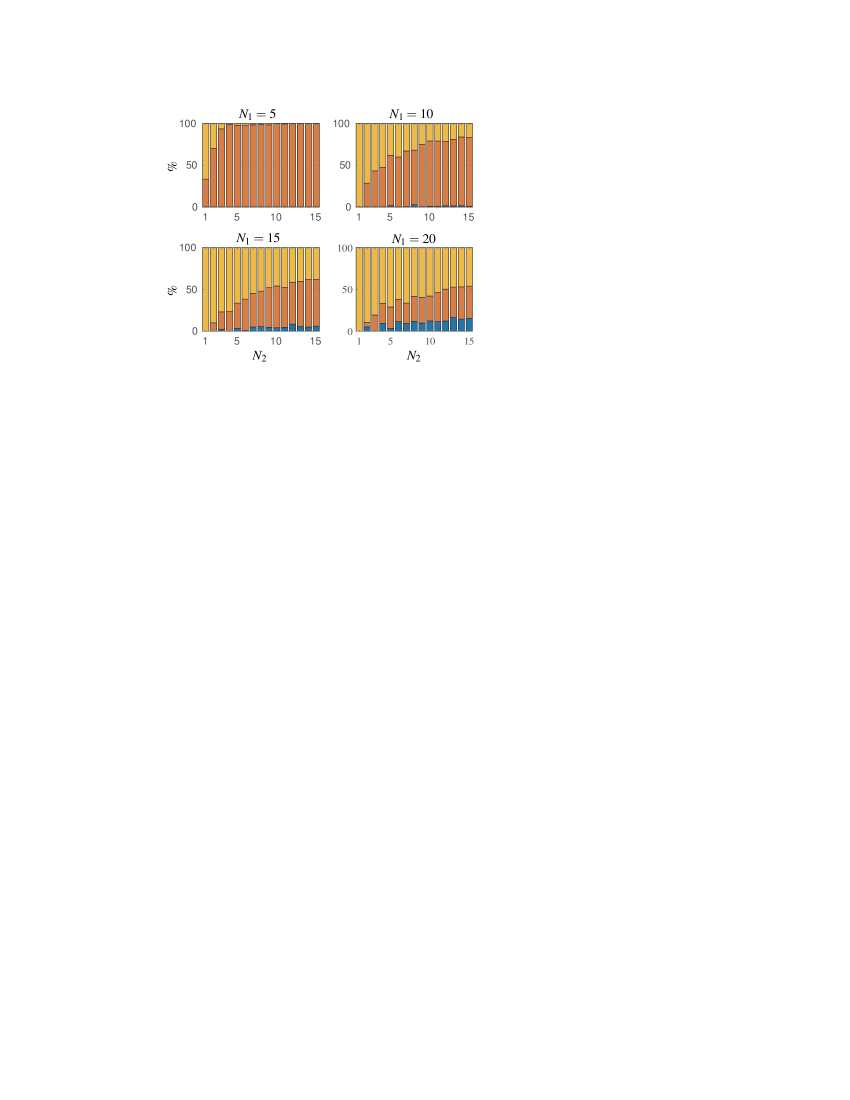
[\FBwidth] \ffigbox[\FBwidth]
[\FBwidth]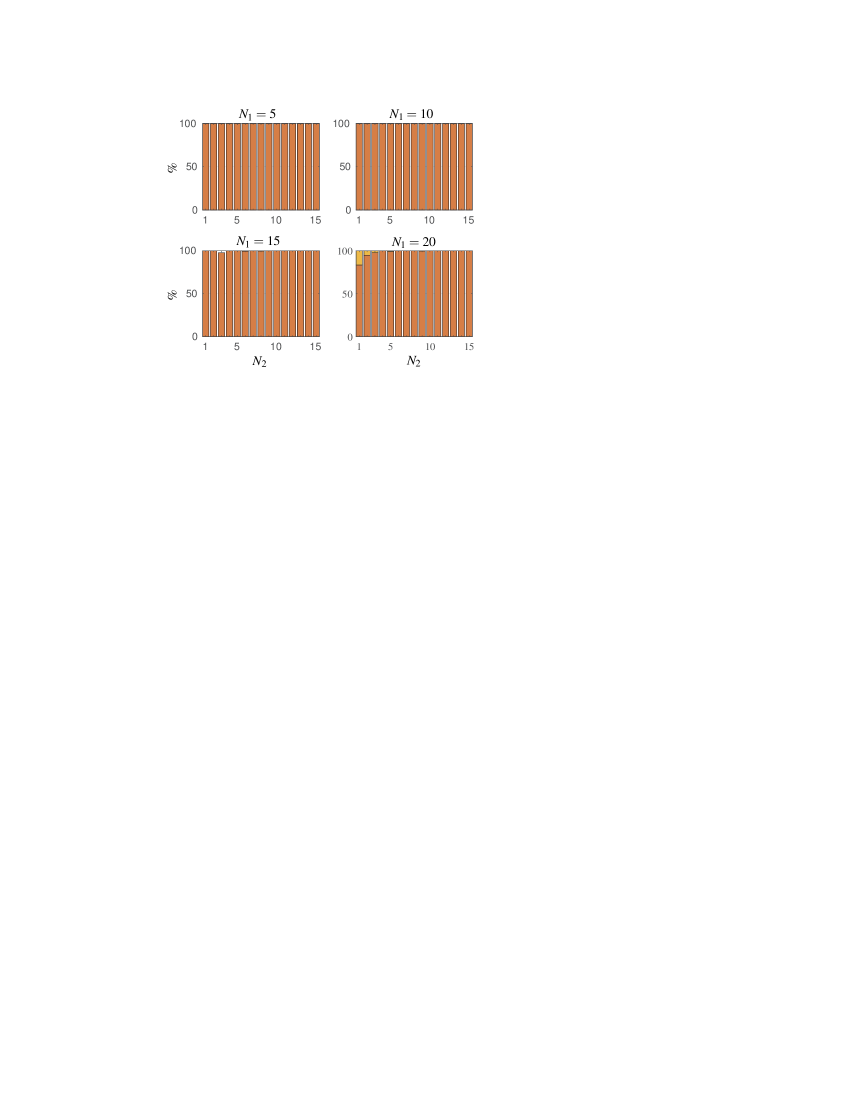
[\FBwidth]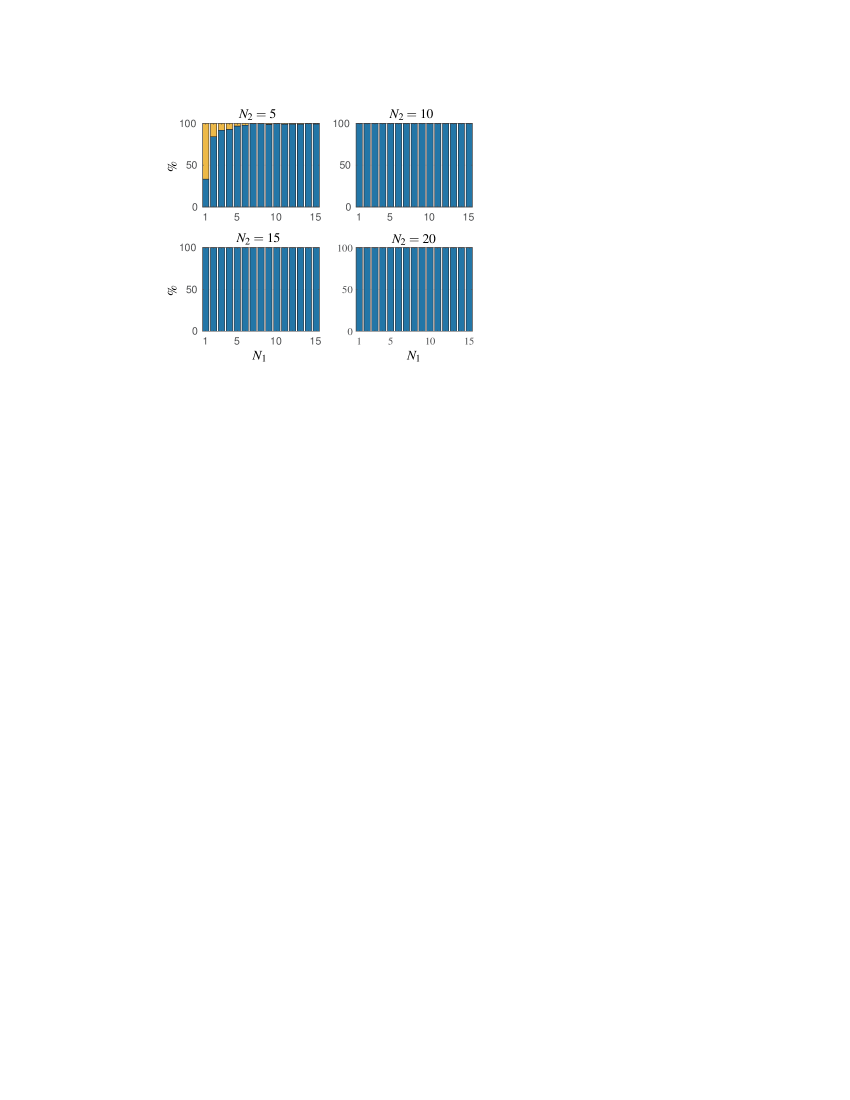 \ffigbox[\FBwidth]
[\FBwidth]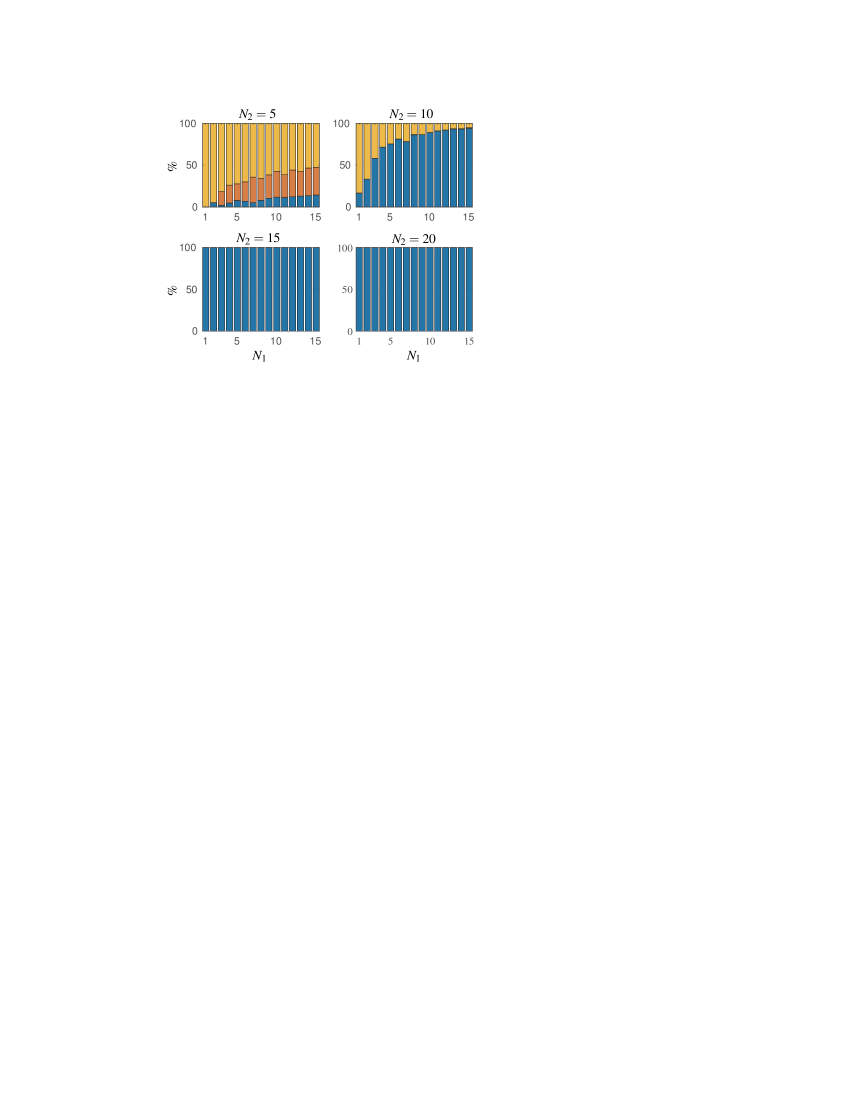 \ffigbox[\FBwidth]
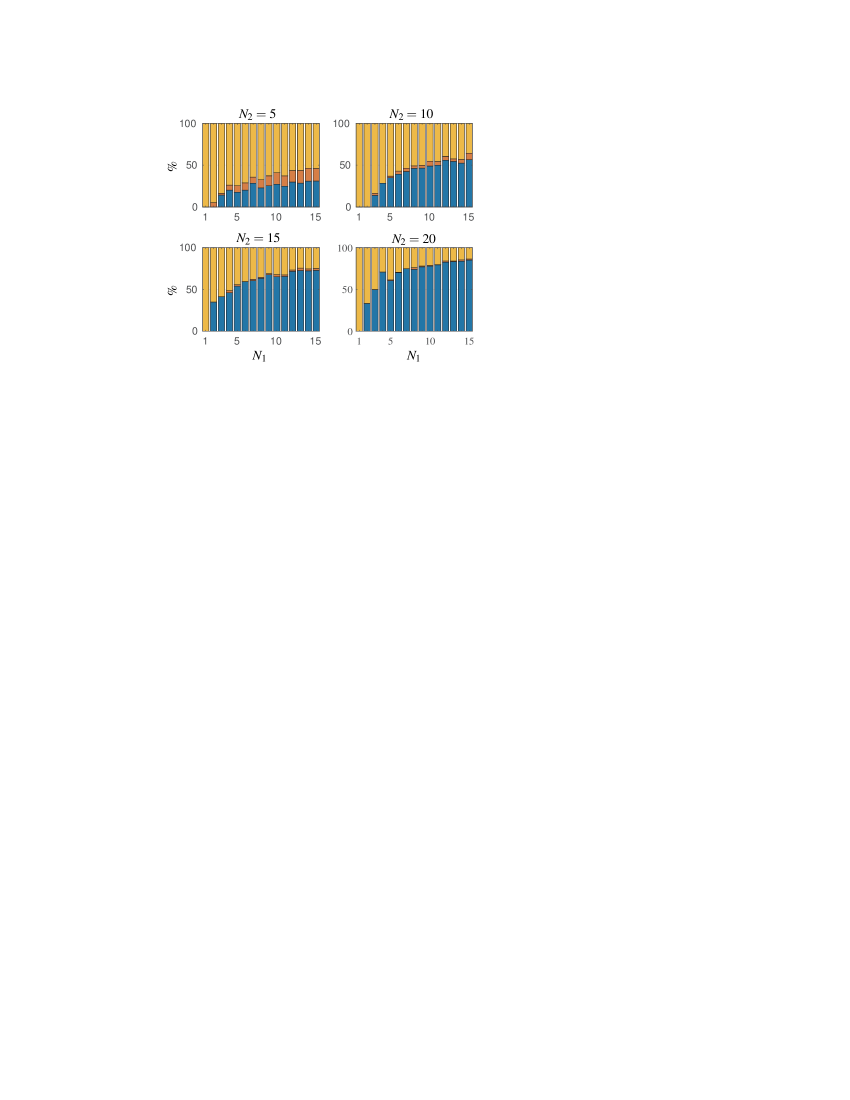
[\FBwidth] \ffigbox[\FBwidth]
[\FBwidth] \ffigbox[\FBwidth]
[\FBwidth]
[\FBwidth] \ffigbox[\FBwidth]
[\FBwidth] \ffigbox[\FBwidth]
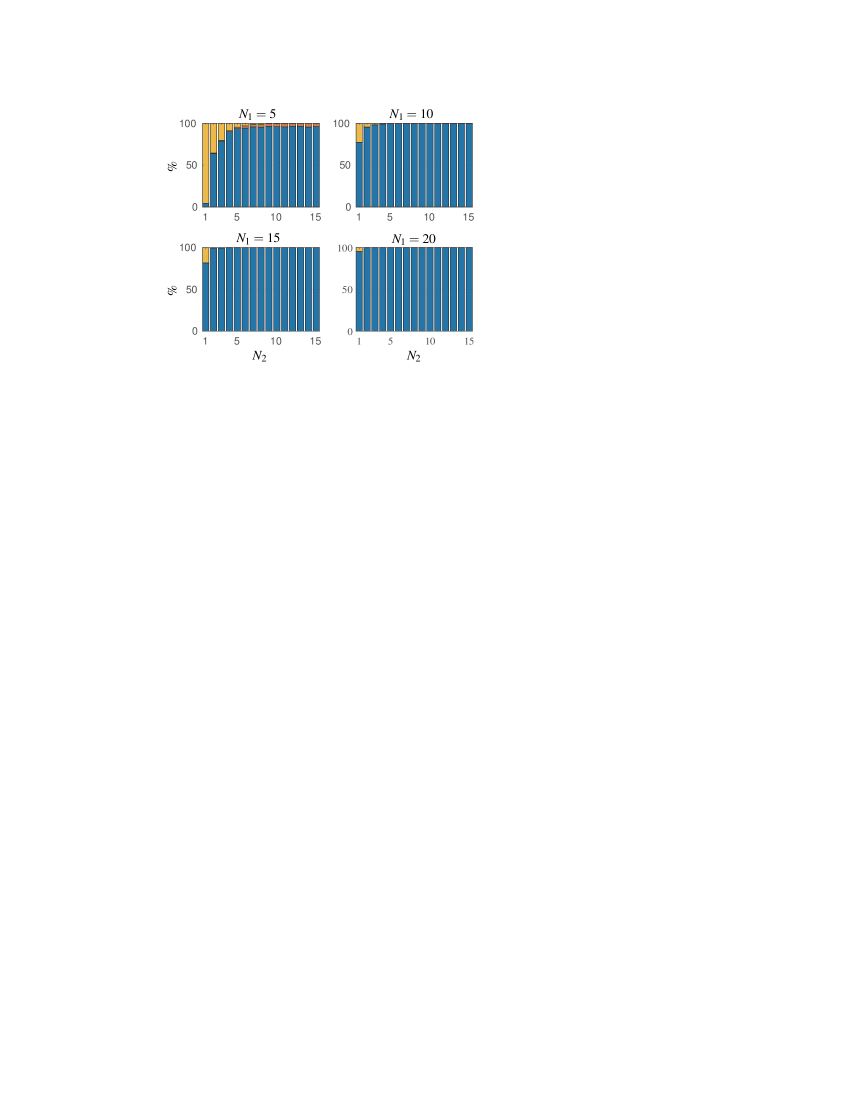
[\FBwidth] \ffigbox[\FBwidth]
[\FBwidth] \ffigbox[\FBwidth]
[\FBwidth]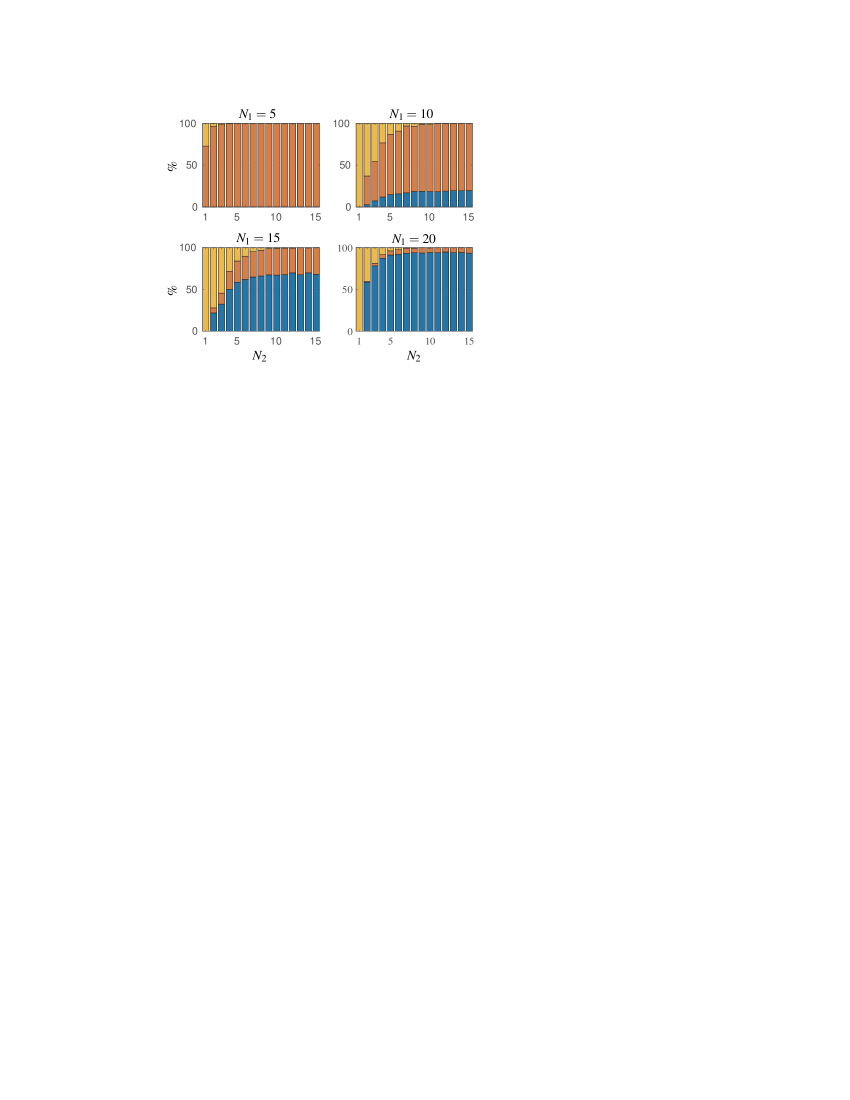
[\FBwidth]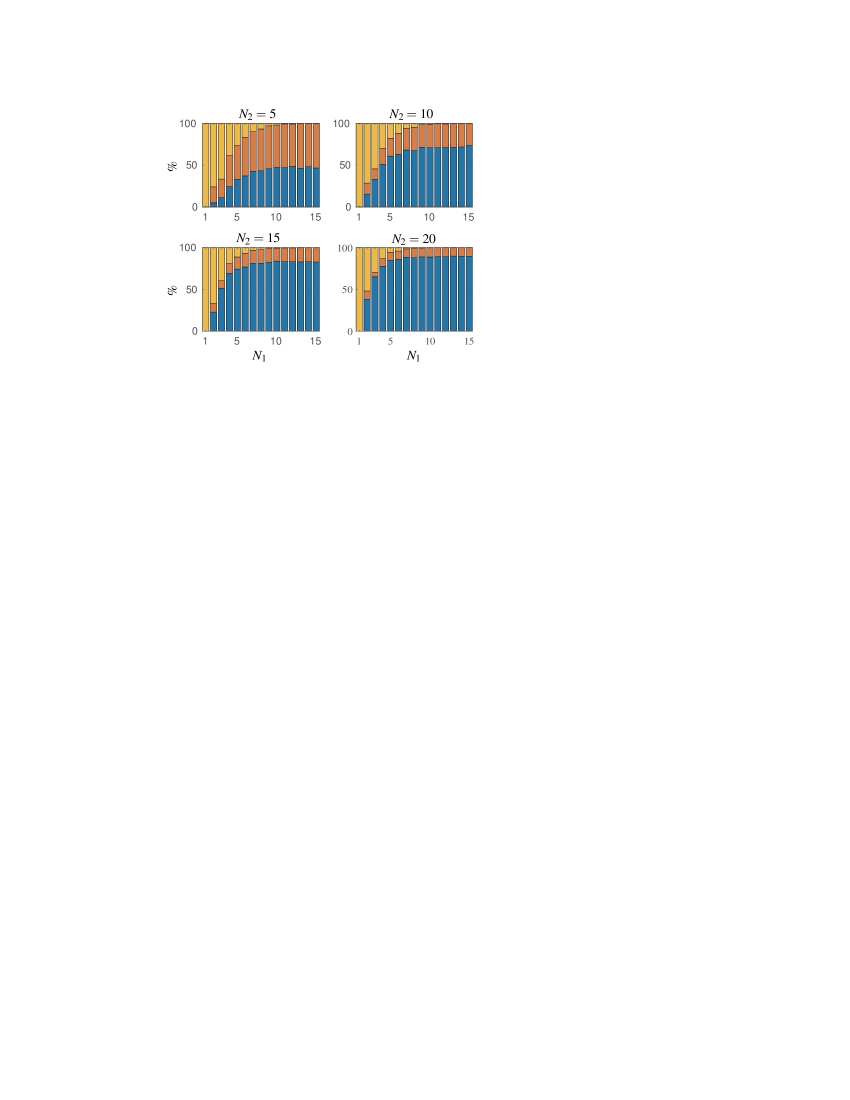 \ffigbox[\FBwidth]
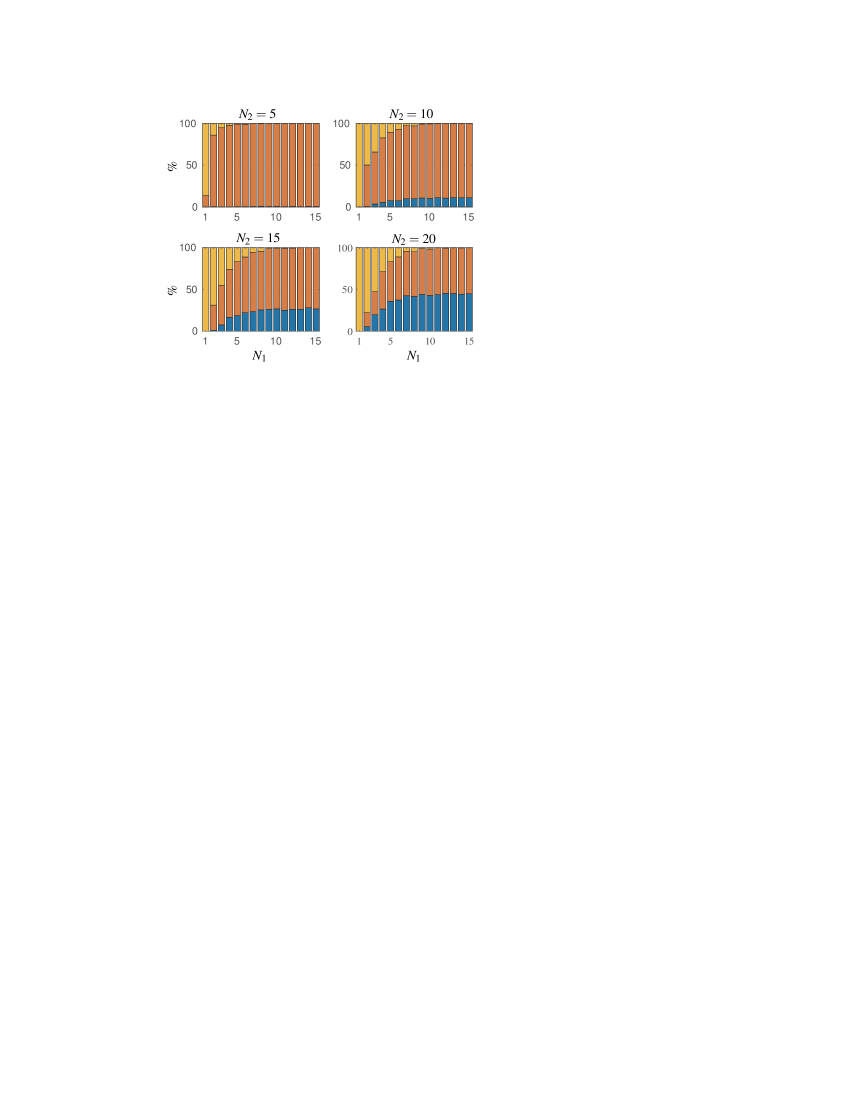
[\FBwidth] \ffigbox[\FBwidth]
[\FBwidth]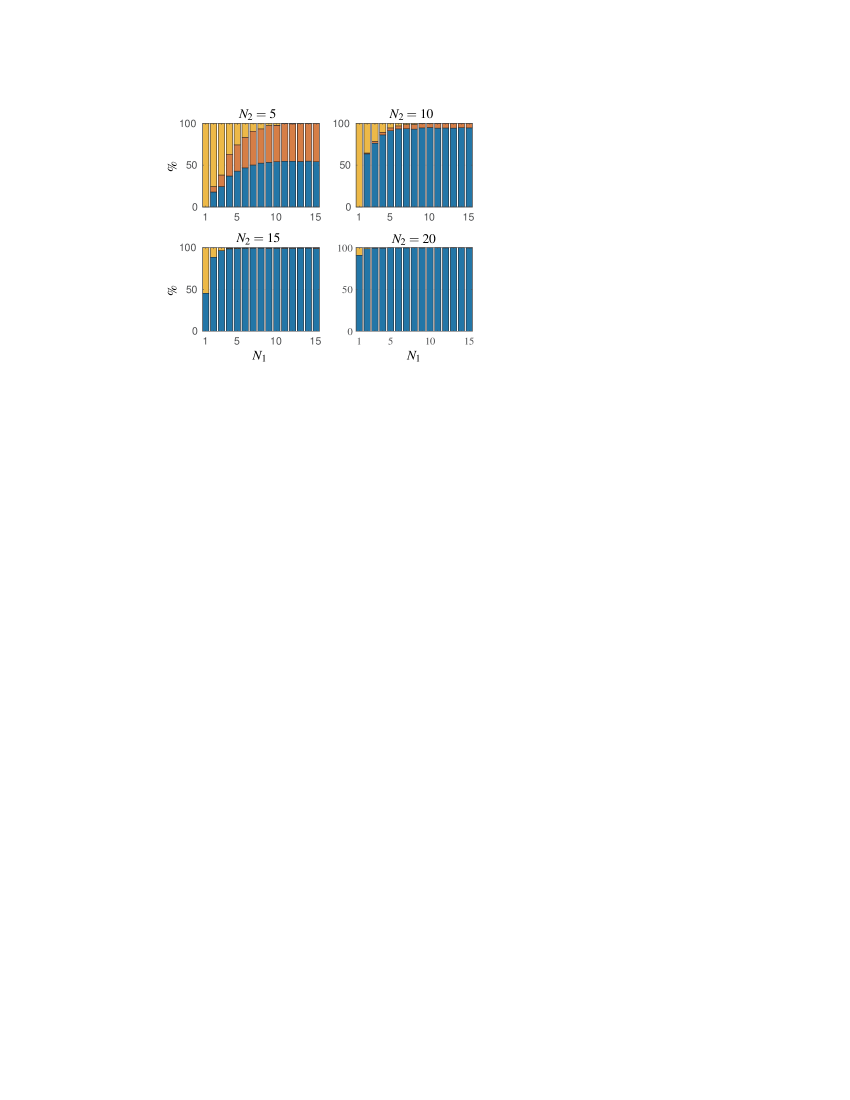 \ffigbox[\FBwidth]
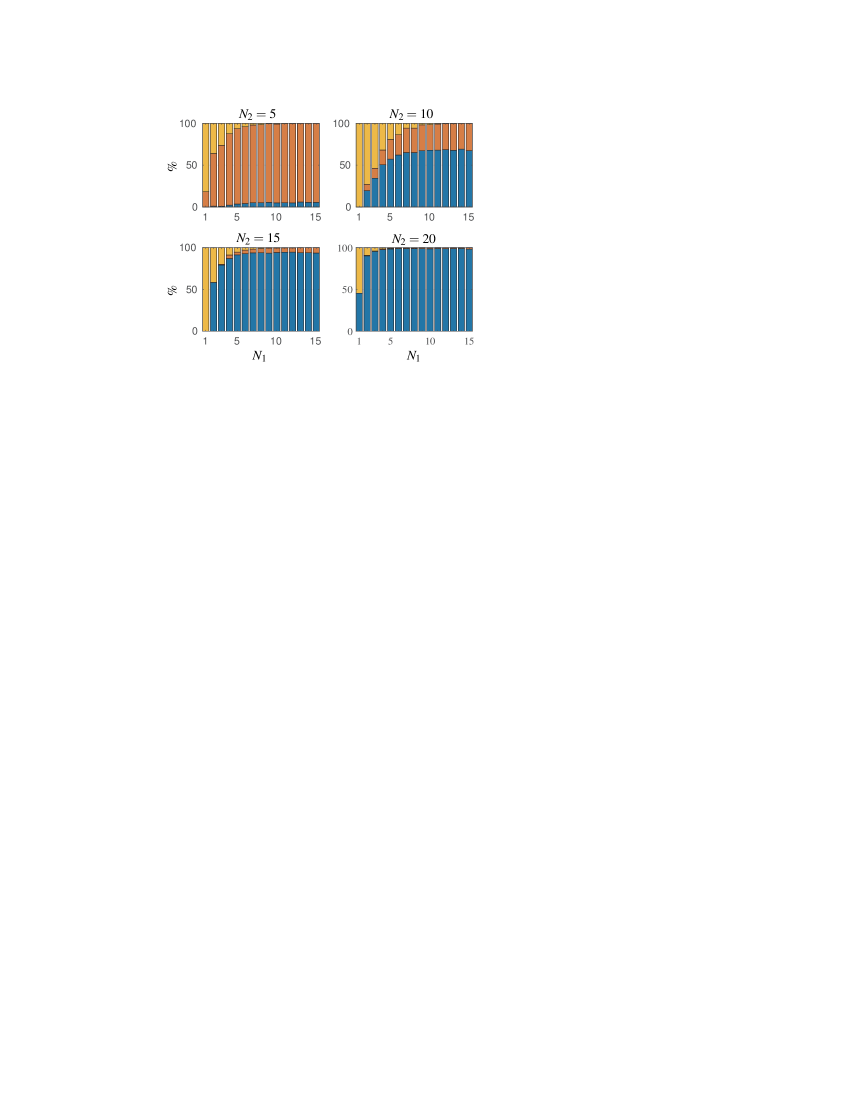
[\FBwidth] \ffigbox[\FBwidth]
[\FBwidth]
[\FBwidth] \ffigbox[\FBwidth]
[\FBwidth] \ffigbox[\FBwidth]
[\FBwidth] \ffigbox[\FBwidth]
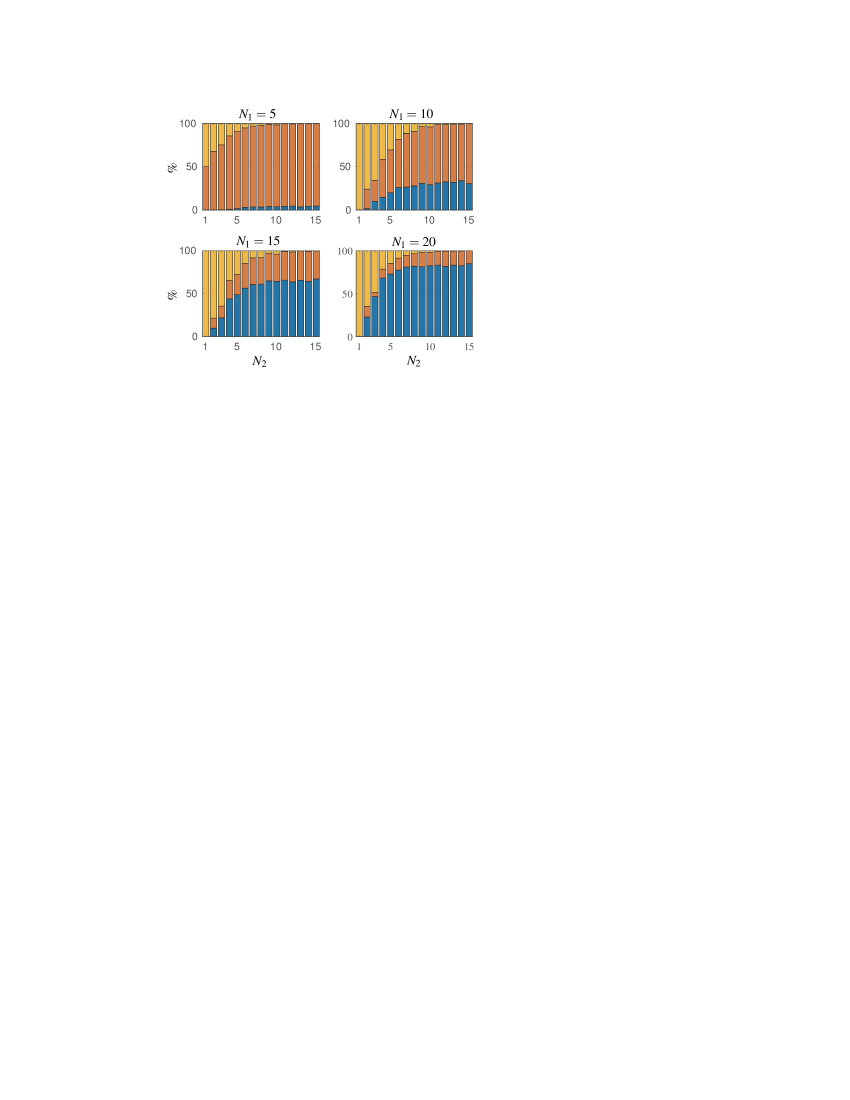
[\FBwidth] \ffigbox[\FBwidth]
[\FBwidth]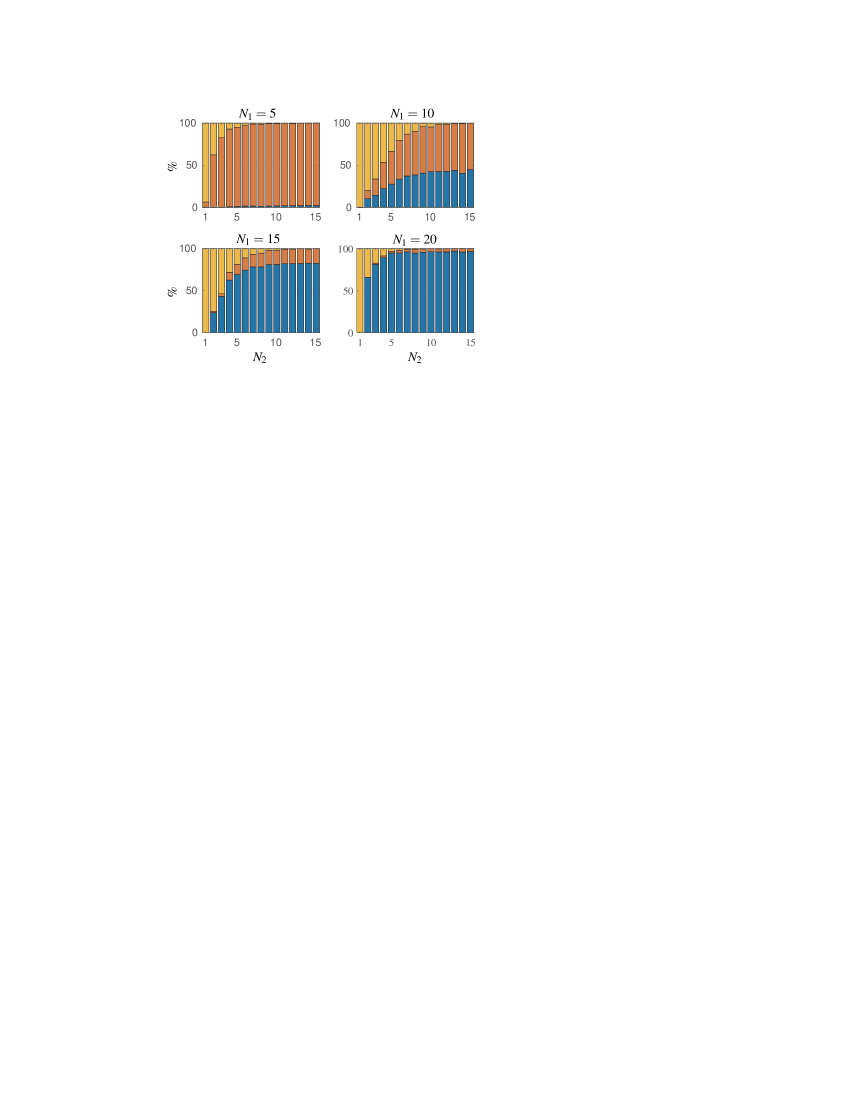
[\FBwidth] \ffigbox[\FBwidth]
[\FBwidth] \ffigbox[\FBwidth]
[\FBwidth]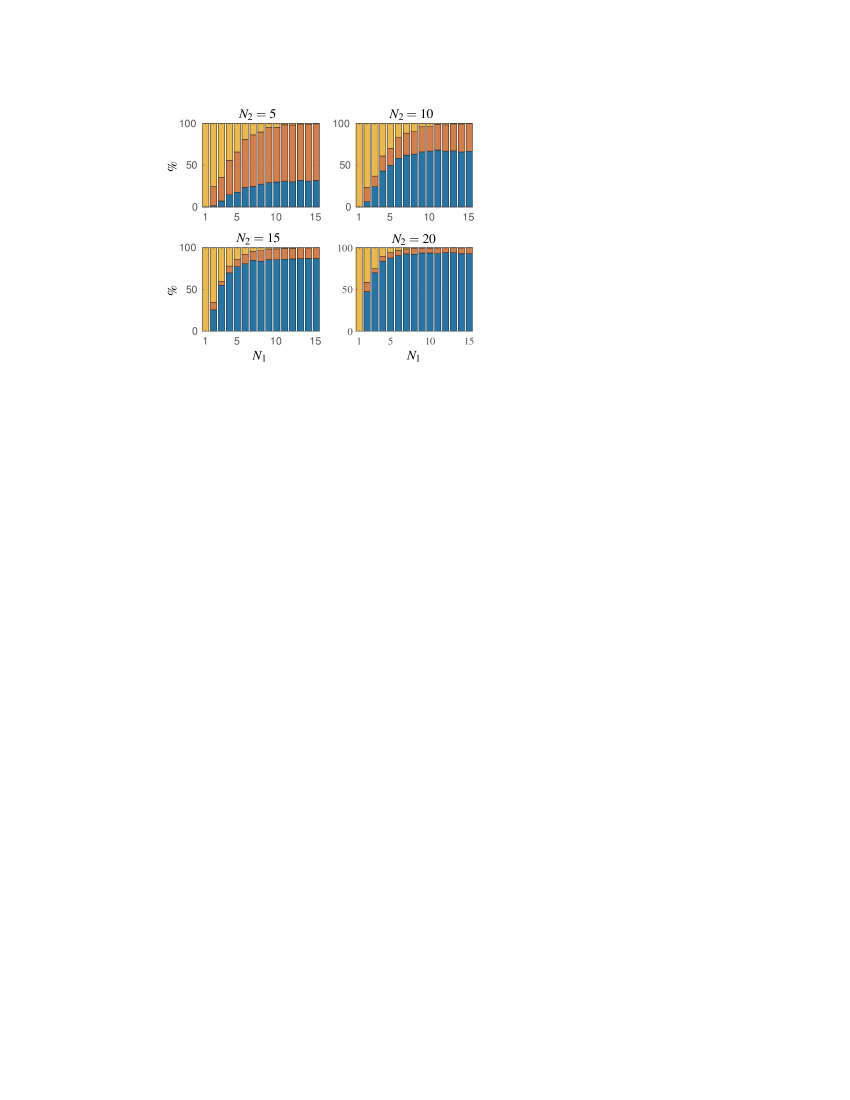 \ffigbox[\FBwidth]
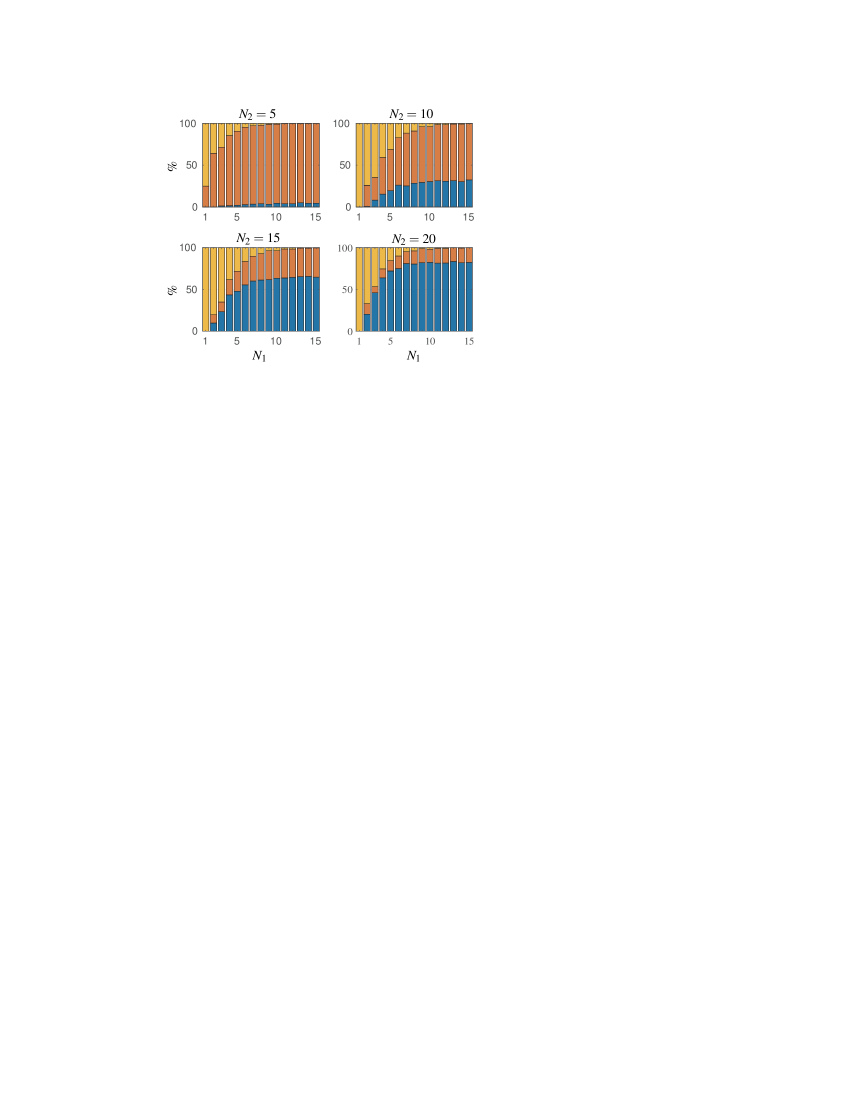
[\FBwidth] \ffigbox[\FBwidth]
[\FBwidth]
[\FBwidth]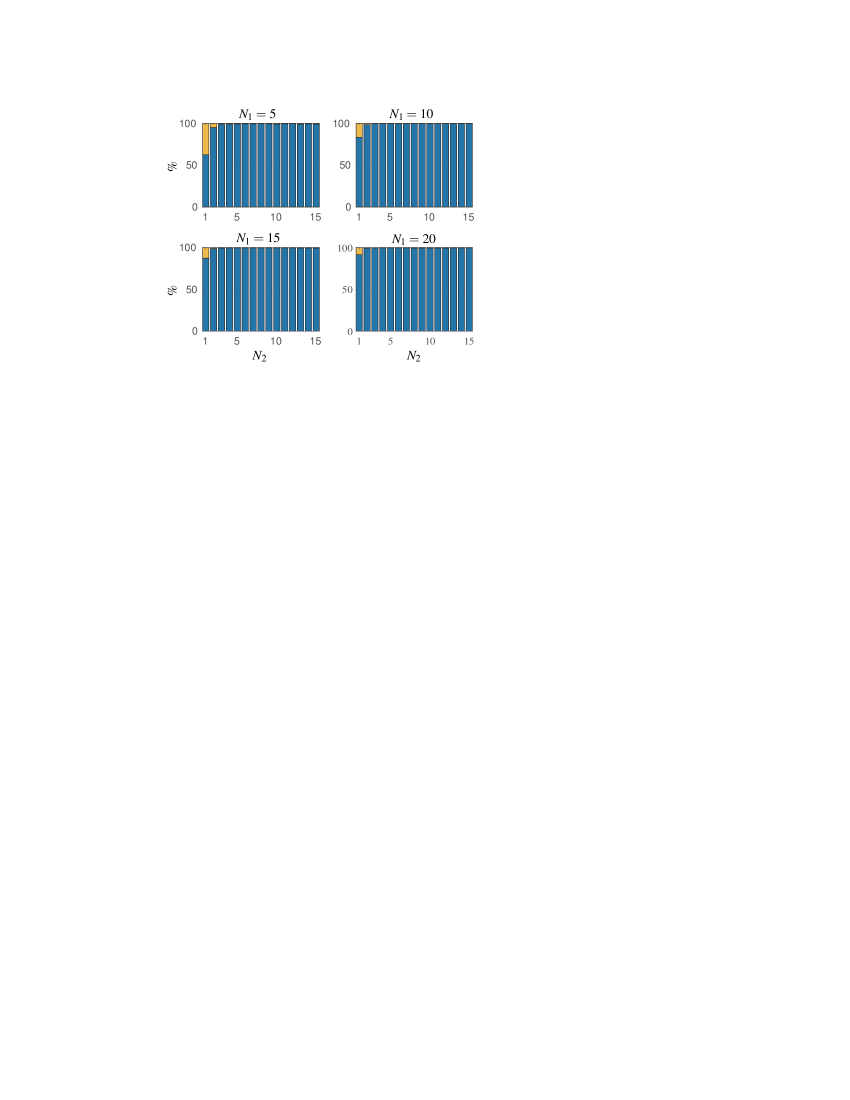 \ffigbox[\FBwidth]
[\FBwidth] \ffigbox[\FBwidth]
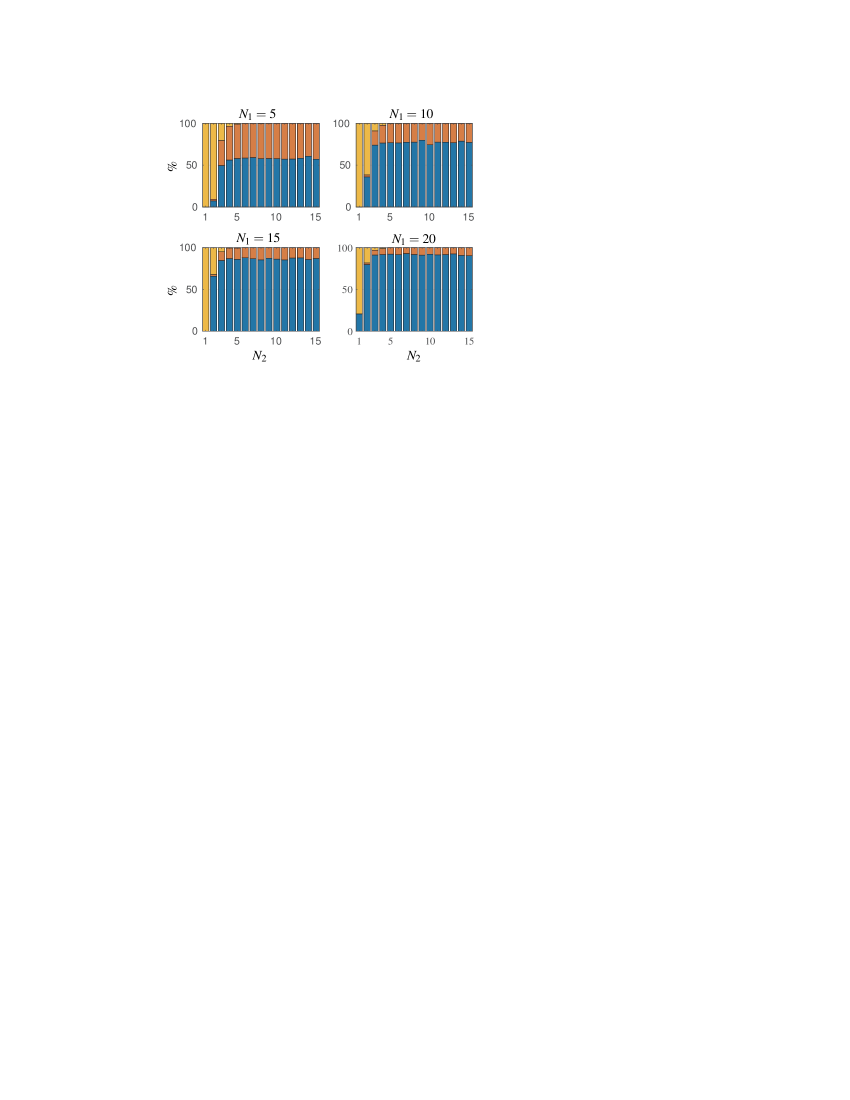
[\FBwidth]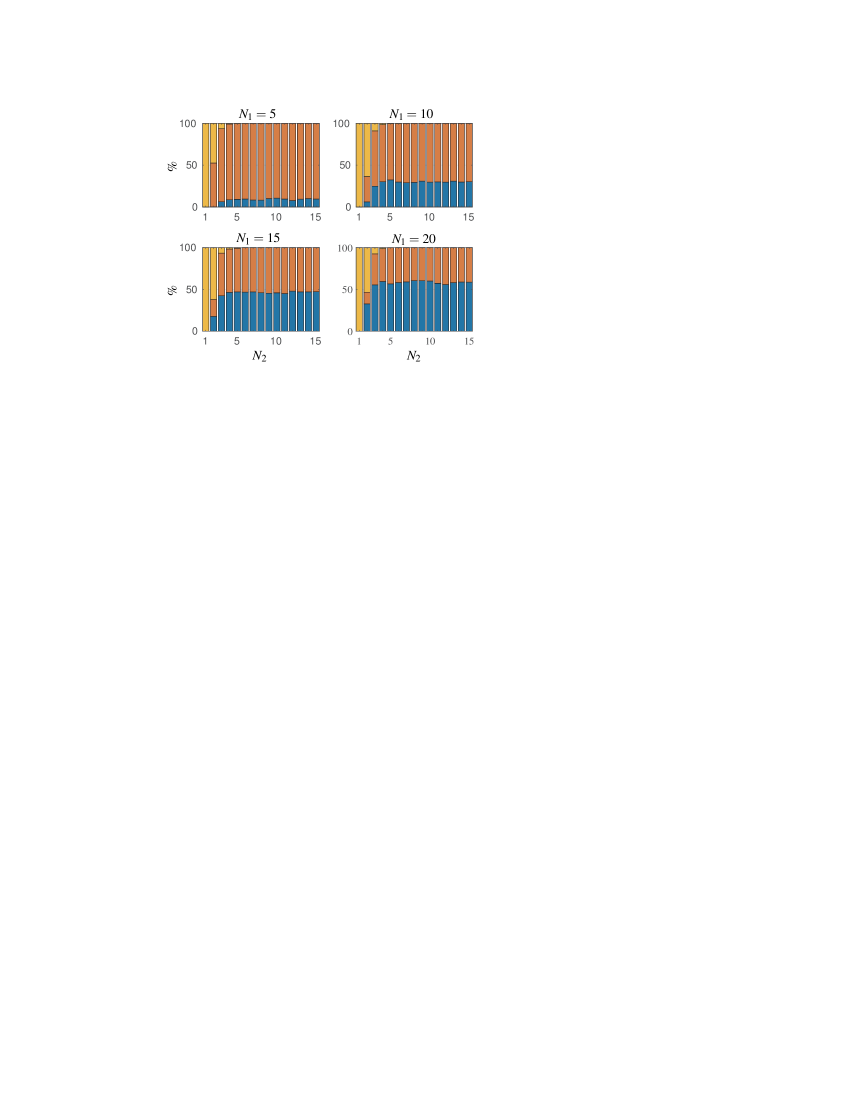 \ffigbox[\FBwidth]
[\FBwidth] \ffigbox[\FBwidth]
[\FBwidth] \ffigbox[\FBwidth]
[\FBwidth] \ffigbox[\FBwidth]
[\FBwidth] \ffigbox[\FBwidth]
[\FBwidth] \ffigbox[\FBwidth]
[\FBwidth] \ffigbox[\FBwidth]
[\FBwidth] \ffigbox[\FBwidth]
[\FBwidth] \ffigbox[\FBwidth]
[\FBwidth] \ffigbox[\FBwidth]