First-Principles-Based Insight into Electrochemical Reactivity in a Cobalt-Carbonate-Hydrate Pseudocapacitor
Abstract
Cobalt carbonate hydroxide (CCH) is a pseudocapacitive material with remarkably high capacitance and cycle stability. Previously, it was reported that CCH pseudocapacitive materials are orthorhombic in nature. Recent structural characterization has revealed that they are hexagonal in nature; however, their H positions still remain unclear. In this work, we carried out first-principles simulations to identify the H positions. Through the simulations, we could consider various fundamental deprotonation reactions inside the crystal and computationally evaluate the electromotive forces (EMF) of the deprotonation (). Compared with the experimental potential window of the reaction ( V (vs. saturated calomel electrode (SCE))), the computed (vs. SCE) value ( V) was beyond the potential window, indicating that deprotonation never occurred inside the crystal. This may be attributed to the strongly formed hydrogen-bonds (H-bonds) in the crystal, thereby leading to the structural stabilization. We further investigated the crystal anisotropy in an actual capacitive material by considering the growth mechanism of the CCH crystal. By associating our X-ray diffraction (XRD) peak simulations with experimental structural analysis, we found that the H-bonds formed between CCH planes (approximately parallel to -plane) can result in 1-D growth (stacked along with -axis). This anisotropic growth controls the balance between the total “non-reactive” CCH phases (inside the material) and “reactive” hydroxide (Co(OH)2) phases (surface layers); the former stabilizes the structure, whereas the latter contributes to the electrochemical reaction. The balanced phases in the actual material can realize high capacity and cycle stability. The results obtained highlight the possibility of regulating the ratio of the CCH phase versus the Co(OH)2 phase by controlling the reaction surface area.
1 Introduction
For clean energy applications, pseudocapacitors with Co-based anodes can be applied to large-scale power storage devices with excellent characteristics, such as fast charge–discharge, long life, and high capacity. 1, 2 Because of the balance between high capacity and cycle stability, cobalt carbonate hydroxide (CCH) 3, 4 has recently attracted increasing attention compared to conventional Co-based anode materials, such as cobalt oxide (Co3O4), 5, 6 cobalt hydroxide (Co(OH)2) 7, 8, mixture of cobalt carbonate and cobalt oxide (CoCO3/CoO) 9, and hybrid materials of ionic liquid and Co(OH)2. 10 In fact, it has been reported that a pristine CCH anode exhibits low capacity. 11 In addition, the “high-capacity CCH anode” is not obtained from CCH itself, but from Co(OH)2 formed in the CCH by calcination, 11, 3, 12 although the CCH contributes to high cycle stability due to its robust/resilient structure against the electrochemical reaction. XRD experiments have suggested the existence of mixed phases consisting of CCH and Co(OH)2. 11, 3 In charge–discharge cycles of “high-capacity CCH anode,” Co(II) and Co(III) states have been observed alternatively, suggesting that the Co(OH)2 is deprotonated to CoOOH, followed by deprotonation to CoO2, and vice versa. The electrochemical reaction in Co(OH)2 has been investigated by first-principles simulations 5, thus providing atomistic insight into the detailed mechanism. Analogous to this, it has been proposed that the abovementioned two step reaction is attributed to the high capacity of the CCH anode. 11, 3, 12 The abovementioned reaction mechanism can be considered as plausible, but hypothetical, i.e., there is no evidence of electrochemical reactions in the CCH anode at the atomic level because the CCH crystal structure still remains unclear 13, 4; therefore, similar first-principles/atomistic level simulations have not been applied yet.
In the high-capacity CCH anodes, their morphologies strongly affect their capacitance, i.e., capacity and cycle life. The best capacitance, so far, has been achieved for the CCH anode with an umbrella-like morphology controlled by the crystal growth time. 3, 4 This anode material has a well-controlled 1-D anisotropic morphology, including well-balanced CCH and Co(OH)2 phases; the former is responsible for the structural stability (i.e., long life cycle), while the latter is responsible for high capacity. Therefore, morphology of CCH anode balancing CCH and Co(OH)2 phases is critical for achieving outstanding capacitance properties. The morphology of CCH can be controlled by the crystal growth direction; the more 1-D anisotropic morphology results in less CCH phase/more Co(OH)2 phase, thereby leading to the larger reactive area, and hence, higher capacity. This anisotropy can be controlled by the packing ratio of carbonate ions in the crystal. However, the reason behind carbonate ion’s contribution in crystal growth is still unclear, because there was no detailed information on the atomic positions in the CCH crystal structure.
Thus, accurately identifying the CCH crystal structure is the first step toward the deeper understanding of “high-capacity” CCH anodes, which will be helpful for designing higher-capacity CCH anodes. For instance, if the position of carbonate ions is known, we should be able to consider the deprotonation site of the hydroxide phase formed by calcination. The CCH compound includes carbonate and hydroxide ions as well as hydrated water; its crystal structure is much more complex than those of oxides and hydroxides. Previously, an XRD analysis assuming an orthorhombic lattice identified CCH compound as Co(OH)(CO3)0.5 0.11H2O(JCPDS 48-0083). 14 However, recent sophisticated experiments suggested that CCH is a Co6(CO3)2(OH)8H2O with a hexagonal lattice. 13, 4 The crystal system has been identified, but the detailed information about atomic positions is yet to be identified: it is quite difficult to identify hydrogen (by neutron diffraction) and Co vacancy positions.
This study aims (i) to accurately identify the CCH crystal structure and (ii) to elucidate the relationship between the material morphology and the crystal growth; the first addresses the “bulk” aspect, whereas the second addresses the “material” aspect in a pseudocapacitor. Based on the resulting structures, we systematically investigated the capacitance properties of the CCH anodes (reductant), referring to those reported in previous studies. The EMF of the CCH anodes was evaluated by first-principles simulations to investigate the electrochemical reactivity. We found that the CCH crystal forms H-bond networks that can contribute to the cyclic stability; the H-bond inhibits the deprotonation reaction in the CCH crystal. Based on this finding, we considered the proton conduction mechanism and capacitance in the CCH anode. Eventually, we may conclude that the reaction site is not attributed to the CCH phase, but to the Co(OH)2 phase; CCH can be considered as the precursor of the Co(OH)2 phase, with wire-like morphology. To identify the crystal planes that contribute toward the crystal growth, we performed XRD peak simulations on the resultant crystal structure with the hexagonal lattice and assigned the plane indices. We found that the H-bonds are formed between the planes that contribute toward the 1-D crystal growth.
This paper is organized as follows: Section 2 starts with modeling of the CCH crystal structure to identify hydrogen and Co defect positions therein; to evaluate the EMF of the reaction using first-principles simulations, we hypothesize the CCH electrode reaction (deprotonation) based on the structural modeling of the oxide (dehydrogenation location identification), followed by the present first-principles simulations. In Section 3, the results of this work are presented, i.e., identification of the reductant structure, oxidant structure to evaluate the EMFs of the deprotonation, and the XRD simulation to assign the peaks to correct Miller indices. According to the results obtained, section 4 provides new insights into the storage performance of CCH-based electrodes. The conclusion drawn from the findings are provided in Section 5.
2 Methodologies
2.1 Outline
Exhaustive first-principles simulations for all possible atomic configurations were carried out, and CCH structures in reduced and oxidized forms were identified as the most stable structures. The electrochemical reactivity of the CCH anode was evaluated from the EMF value, which is defined as the energy difference between the reductant and oxidant. Furthermore, their structural changes provide critical information for understanding the cycle performance because they correlate well with each other. 8, 15, 16 The structural and computational modeling are outlined as follows:
-
(i)
According to the recent experiments on structural characterization of CCH anodes, 13, 4 we considered the CCH reductant to be Co6(CO3)2(OH)8H2O in the hexagonal space group (No. 189); however, its Co defect (VCo) and H positions have not been determined experimentally. (See Subsection 3.1.) This indicates that there are several possible arrangements of VCo and H positions therein. First-principles simulations are well-known for identifying unknown atomic positions in disordered structures. 17 Therefore, we exhaustively applied first-principles simulations to all the possible arrangements, identifying the reductant structure as the most stable one. (See Subsection 2.5.)
-
(ii)
To theoretically elucidate the electrochemical properties of the CCH anode, the most reliable approach is first-principles reaction dynamics simulations. However, due to its high computational cost, such simulations are not feasible. Instead, the present study adopted a static approach, i.e., we evaluated the EMF. To evaluate the oxidant energy, the oxidant structure should be modeled, but the modeling involves assuming a plausible electrochemical reaction. Before modeling the oxidant structure, we review the electrochemical reactions, which are hypothetically assumed as deprotonation reaction. 11, 3, 4, 12 (See Subsection 2.3.)
-
(iii)
According to the hypothetical reaction mechanism, we can model the oxidant structure by deprotonating the reductant structure. (See Subsection 2.4.) By applying the first-principles simulations to both the reductant and oxidant structures, the EMF () can be calculated from their energy difference computed using the first-principles geometry optimization. (See Subsection 2.5.) Upon comparing the predicted with the experimental values, we verified the reaction hypothesis.
-
(iv)
Actual CCH anodes have 1-D wire structures rather than the 3-D bulk structure. 11, 3, 4, 12 Therefore, we considered the anisotropic morphologies of the CCH anodes to understand “actual” capacitor properties from a more realistic viewpoint. The crystal growth mechanism can govern the morphology. The anisotropy of the crystal growth can be measured by the XRD pattern; the crystal grows toward crystal planes that corresponds to higher peak intensities in its XRD pattern. 18 In fact, previous characterizations of the CCH anodes were incorrect because they were characterized by assuming a lattice structure with an incorrect space group. 14 Therefore, we perform XRD simulations 19 for our predicted CCH reductant structure to obtain the accurate attribution of the XRD patterns to crystal planes. (See Subsection 2.6.) This revised XRD attribution can lead to a correct crystal growth mechanism. In addition, the detailed structural information about carbonate ions and surrounding atoms clarify the interactions between them. This detailed information can provide new insights into the morphology of the CCH anode and hence its electrochemical reactivity governing the capacitor properties, i.e., high capacity and cycle stability.
2.2 Modeling of CCH reductant structure
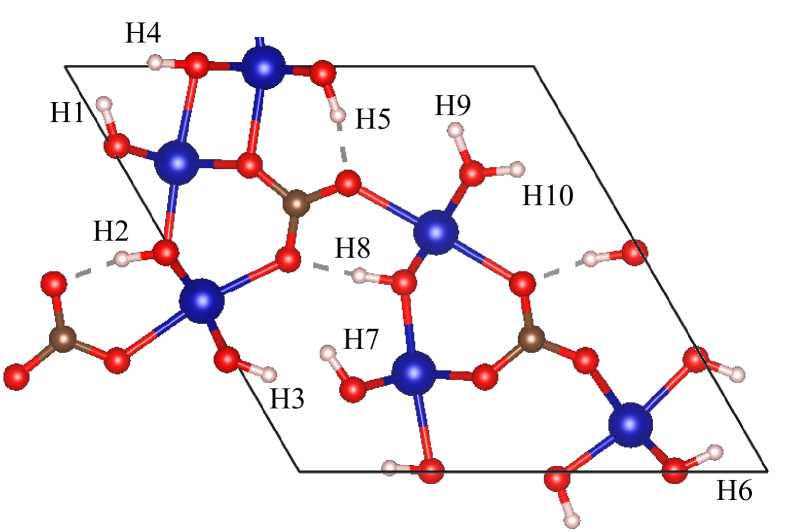
Figure 1 shows a unit cell of Co6(CO3)2(OH)8H2O obtained from experimental characterization 13, which is the starting point of our structural modeling. Its lattice information (lattice parameters and space group) is identified, but atomic positions therein are incomplete from the viewpoint of the Co-defect (VCo) and H positions. The atomic positions of Co, O, and C are identified, but there exist six Co positions with site occupancy numbers of 0.5 (light blue). This means that three Co positions are fully occupied and the remaining three are VCopositions. Ten H atomic positions are categorized into eight OH sites and one structural water (H2O) site. Through the first-principles simulations shown later, the structural model of reductant was determined by choosing the most stable structure from all the possible arrangements of the VCo and H positions. As shown below, we identify (i) the VCo and (ii) H positions considering physicochemically reasonable arrangements.
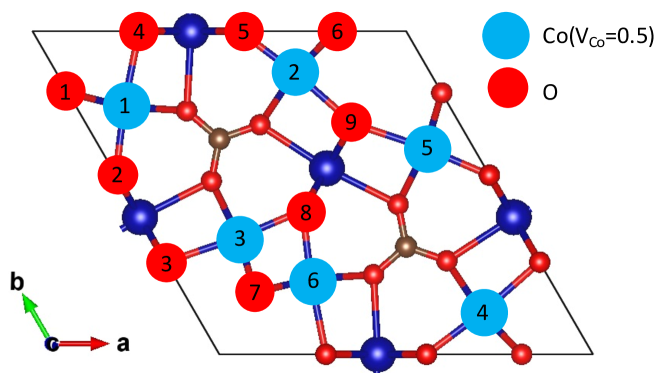
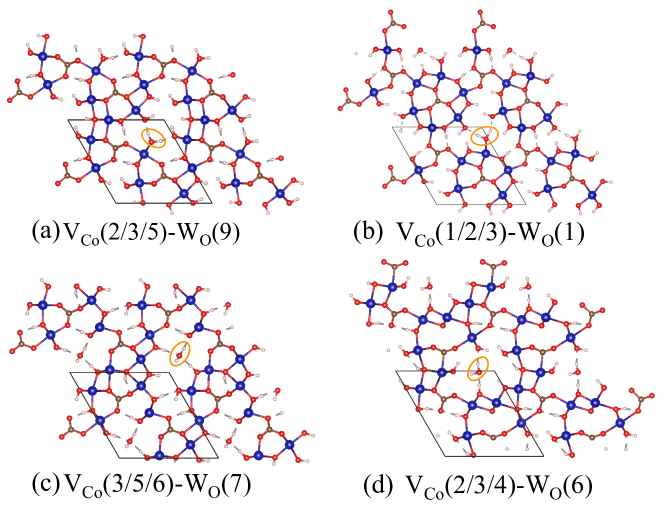
(i) Identification of the VCo positions: The vacancy patterns can be divided into two categories: (1) delocalized and (2) localized ones. According to the symmetry of the VCo patterns, we have two delocalized patterns, (1-1) VCo(2/3/5) and (1-2) VCo(1/2/3), and two localized ones, (2-1) VCo(2/3/4) and (2-2) VCo(3/5/6), where the three VCo positions are described in parentheses as numbers in Figure 1.
(ii) Identification of the H positions: For each of the above four VCo patterns (1-1)(2-2), the H positions are automatically determined if one H2O position is chosen from nine O positions, WO, appearing in Figure 1. Furthermore, as explained below, we consider their symmetries and impose constraint conditions from the viewpoint of the local charge-neutrality that isolated anions are ruled out in the reductant, and thus, 14 candidate structures are left, described as VCo()-WO():
-
(1-1)
VCo(2/3/5)-WO: As can be seen from Figure 2 (a), this case allows all the nine O sites because neither symmetry nor local charge-neutrality rule out any WO possibility.
-
(1-2)
VCo(1/2/3)-WO: Figure 2 (b) shows VCo(1/2/3) has three-fold symmetry; therefore, WO are classified into three equivalences: {WO(1), WO(6), WO(7)}, {WO(2), WO(5), WO(8)}, and {WO(3), WO(4), WO(9)}. Therefore, we may consider only three inequivalent WO.
-
(2-1)
VCo(2/3/4)-WO(6): Looking at Figure 2 (c) and then comparing every O valency with the VCovalencies, the local charge-neutrality restricts possible candidates for the structural water site to only one O site, WO(6). Otherwise, O6 atom becomes isolated OH-.
-
(2-2)
VCo(3/5/6)-WO(7): Similar to the VCo(2/3/4) case, the WO(7) is only the possible O site for the structural water, looking at the valencies of Co3 and Co6 vacancies. (See Figure 2 (d).)

Note that when optimizing these initial structural models by first-principles simulations (Subsection 2.5), the degree of spatial freedom is restricted such that H atoms in OH-/H2O are placed parallel/perpendicular to the plane, which avoids undesirable steric hindrance.
2.3 Hypothesis of deprotonation
reaction and EMF
The electrochemical reaction of the CCH anode has been inferred from experiments based on cyclic voltammetry (CV) measurements. 3 The CV measurements have provided the reaction EMF by observing the CV peaks appearing in the potential window, V versus the SCE potential reference. The result suggests the following deprotonation reaction:
| (1) |
Equation (1) is an electrochemical (elementary) reaction of Co(OH)2 rather than CCH itself, indicating that Co(OH)2 forms in the CCH anode. The corresponding half reaction in the CCH anode for deprotons per unit cell () is given as:
| (2) | ||||
where is the CCH electrode potential versus the standard hydrogen electrode (SHE). Hereafter, all the electrochemical potentials are measured referring to SHE. For , all the Co+2 ions are oxidized to Co+3, with the reaction rate being 1. The cathodic half-reaction is assumed to be the Pt electrode reaction in an alkaline solution (KOH):
| (3) |
where is the Pt electrode potential. Eventually, the overall reaction is obtained:
| (4) |
where is the deprotonation potential.
Herein, we establish relationships between the electrochemical potentials. The deprotonation potential in Eq. (4) is a sum of the anodic potential in Eq. (2) and the cathodic one in Eq. (3):
| (5) |
The has been measured by the CV experiment as the peak of EMF referring to the SCE potential. 20 We convert the experimentally set (vs. SCE) to a computationally tractable (vs. SHE) via
| (6) |
where is the SCE electrode potential measured by SHE. Substituting Eq. (5) with experimental values ( V and V) 20 into Eq. (6), we obtain the EMF (vs. SCE) for the CCH anode as
| (7) |
Thus, the value can be evaluated from the one that can be computed by first-principles simulations, as shown in the next subsection.
2.4 First-principles evaluation of deprotonation EMF and oxidant modeling
The value can be converted into the deprotonation energy, , for deprotons, using
| (8) |
where is Faraday’s constant. Referring to the overall reaction in Eq. (4), the is given as
| (9) |
where and are the total energies of the reductant (CCH) and the oxidant (CCHH) with deprotons, respectively, and is the chemical potential of the hydrogen atom.
Although the above three energies are computable, as shown in the next subsection, the evaluation of involves modeling the oxidant structure. In this study, we model the oxidant by removing one hydrogen atom from the most stable reductant, VCo(2/3/5); ten possible deprotonation sites are shown in Figure 3. For our purpose, as shown later, the case suffices to evaluate . Note that our concern is whether or not the deprotonation reaction occurs inside the CCH bulk. In other words, we investigate whether or not lies in the range of the experimental potential window, V (vs. SCE).
2.5 First-principles geometry
optimization
Our first-principles simulations based on density functional theory (DFT) were performed using Vienna ab initio simulation package (VASP) 21, 22. The valence electron-core interactions were described by projector augmented wave (PAW), 23 where the valence electrons were treated as Co(3s74s2), O(2s22p4), C(2s22p2), and H(1s1). We adopted the GGA-PBE exchange-correlation functional 24 and applied the GGA+U method to describe the localized Co- orbitals with the Hubbard correction value obtained from the value applied to cobalt oxide 25; we also added the Grimme D3 correction 26 with the Beck-Johnson damping 27 to the GGA+U functional to reproduce the noncovalent interactions. The cutoff energy of the plane-wave basis expansion was set to 700 eV; a k-point mesh of was used for integration in reciprocal lattice space using the Monkhorst-Pack scheme 28; These values were found to converge within 1 meV/atom. The convergence criteria for the geometry optimization were set to eV and 0.01 eV/Å for energy and force, respectively. All the lattice parameters were fixed to be the experimental values 13 during the geometry optimization, i.e., only the atomic positions were optimized by our first-principles simulations. To accelerate the convergence in the geometry optimization, we first optimized the H positions, followed by all the atomic positions, which suppress a high degree of spatial freedom in the geometry optimization.
2.6 XRD pattern prediction
Previously, XRD peaks of the CCH electrodes were incorrectly assigned to crystal plane indices because the CCH crystal structure was assumed to be an orthorhombic lattice.blue 14 To re-assign the XRD peaks to plane indices of the hexagonal lattice, we performed XRD simulations for the computationally determined CCH hexagonal structure using the VESTA software. 19 Since the strongest XRD peaks indicate the direction of the crystal growth, new XRD alignments can provide a new insight into 1-D anisotropic CCH electrodes exhibiting high capacity. 3, 12
3 Results
3.1 Identification of reductant
To identify the reductant structure, we performed the DFT simulations for all the possible arrangements of VCo and H2O, i.e., 14 patterns of VCo()-WO() shown in Figure 2, followed by exploring the most stable one. Table LABEL:tab.opt_hyd lists four pairs of the VCo and WO positions, and each of them provide the most stable structure among each category. The most stable structure among the four arrangements is set to be zero energy; the corresponding structures are shown in Figure 4. The most stable structure was (1-1) VCo(2/3/5)-WO(9), where the VCo positions are delocalized, as shown in Figure 4(a). This structure is stabilized by three hydrogen bonds: two are formed between two H atoms in OH and two O atom in CO, and one is formed around VCo surrounded by two CO. The second most stable structure is (1-2) VCo(1/2/3)-WO(1), with only one hydrogen bond formed around one CO. which is shown in Figure 4(b). Therefore, VCo(1/2/3)-WO(1) has higher energy than VCo(2/3/5)-WO(9) by 0.47 eV; as a result, it cannot be thermodynamically synthesized because of its synthesis temperature (368 K) 3. The other two localized structures, (2-1) VCo(3/5/6)-WO(7) and (2-2) VCo(2/3/4)-WO(6), have much higher energies than the most stable structure, (1-1) VCo(2/3/5)-WO(9). This can be attributed to the fact that Coulomb repulsions between more localized VCo pairs are greater than those between delocalized ones, irrespective of H-bonds.
| Category | VCo() | WO() | /eV |
|---|---|---|---|
| 1-1 | 2/3/5 | 9 | +0.00 |
| 1-2 | 1/2/3 | 1 | +0.47 |
| 2-1 | 3/5/6 | 7 | +0.89 |
| 2-2 | 2/3/4 | 6 | +5.42 |
Herein, we investigate the relative stability of VCo(2/3/5) with respect to different sites of H2O, WO() (), listed in Table LABEL:tab.water. The three structures, VCo(2/3/5)-WO(6)/-WO(1)/-WO(5), are more stable than (1-2) VCo(1/2/3)-WO(1), but less stable than (1-1) VCo(2/3/5)-WO(9). VCo(2/3/5)-WO(6)/-WO(1)/-WO(5) have higher energies than VCo(2/3/5)-WO(9) by eV, respectively. Similar to VCo(1/2/3)-WO(1), these metastable phases are not synthesized thermodynamically due to their synthesis temperatures. Three delocalized VCo patterns, VCo(2/3/5)-WO(2)/-WO(4)/-WO(8), are less stable than the localized VCo(3/5/6)-WO(7) due to the presence of highly sterically hindered structural water sites. Thus, we conclude that the CCH reductant has the VCo(2/3/5)-WO(9) structure, which is thermodynamically synthesizable. Its structural stability can be attributed to the abovementioned H-bonds.
| WO() | /eV |
|---|---|
| 9 | +0.00 |
| 6 | +0.15 |
| 1 | +0.32 |
| 5 | +0.42 |
| 3 | +0.51 |
| 7 | +0.68 |
| 8 | +0.96 |
| 2 | +1.37 |
| 4 | +5.47 |
3.2 Identification of oxidant
| Hdep | (vs.SCE)/V |
|---|---|
| 7 | 3.05 |
| 10 | 3.08 |
| 3 | 3.08 |
| 2 | 3.26 |
| 1 | 3.27 |
| 8 | 3.30 |
| 6 | 3.34 |
| 9 | 3.52 |
| 4 | 4.06 |
| 5 | 4.89 |
To investigate the electrochemical reactivity of CCH, we obtained oxidant structures by removing H atoms from the reductant structure, VCo(2/3/5)-WO(9), where the deprotonation sites (Hdep) are numbered as in Figure 3. For computing the oxidant and reductant energies through the DFT simulations, Eq. (8) is applied to evaluate their DFT-evaluated electromotive forces (EMFs) of deprotonation reactions () occurring inside CCH crystals, which are listed in Table LABEL:tab.del_hyd. According to these computational results, all the deprotonation reactions require V. Compared with the computed EMFs, the experimental EMFs () are estimated to be less than V because the CV measurements for the CCH capacitors report the potential window of V when the deprotonation reaction occurs.
The difference between and implies that the deprotonation reaction occurs not inside the CCH crystal, but on the surface. Note that approximates to a definite EMF () because should be defined as the energy difference between the reductant and transition state in the electrochemical reaction (i.e., activation energy), whereas is just the energy difference between the reductant (before reaction) and oxidant (after reaction) energies, according to Eq. (8). However, since necessarily underestimates , the present values are sufficient to prove whether or not the deprotonation reaction occurs inside the CCH crystal. Actually, it is quite hard to perform an exhaustive first-principles transition state calculations 17 for all the Hdep sites due to their computational costs.
The deprotonation inside the CCH bulk necessitates breaking both the H-bond and the O-H covalent bond, which involves high energy of an eV order, while the electrochemical reaction in actual CCH electrodes occurs at less than V(vs. SCE). In other words, the CCH bulk itself is stable against an electrochemical reaction. The electrochemical stability in the CCH bulk can be attributed to the H-bonds formed by all the H atoms with the neighboring O atoms, as shown in Figure 3.
The computational results shown here suggest that a single phase of pristine CCH electrode has a low capacitance. 4 In contrast, some CCH-based electrodes have been reported to exhibit high capacity. 3, 12 The difference between high- and low-capacity CCH electrodes can be attributed to their different morphology and constituent phases. According to the experimental characterization, 3 the high-capacity CCH electrodes consist of not only a pristine CCH phase but also hydroxide (Co(OH)2) phase. Thus, we investigate the crystal growth mechanism of CCH based on XRD analysis, which is the key to understand how actual CCH electrodes are synthesized.
3.3 Crystal growth designated by XRD peaks
In terms of capacity, there are two types of CCH-based electrodes: CCH-based electrodes with high capacity 3 and low capacity 11, 4 are synthesized with NO and Cl- counterions for cobalt ions (NA- and CA-CCH), respectively. They have different morphologies that arise from different crystal growth directions and degrees of crystallinity. Differences in the crystal growth directions and degrees of crystallinity for CCH can be explained from observed XRD patterns.
In fact, previous studies characterized XRD patterns of the CCH-based electrodes, but their XRD analyses were based on an incorrect lattice ansatz, an ortholombic lattice. 14 The correct lattice of CCH has been recently found to be a hexagonal lattice. 13 Note that the crystal growth direction of a pristine CCH crystal has been found to be -axis. Thus, the XRD patterns of the actual CCH electrodes should be reassigned into Miller indices.
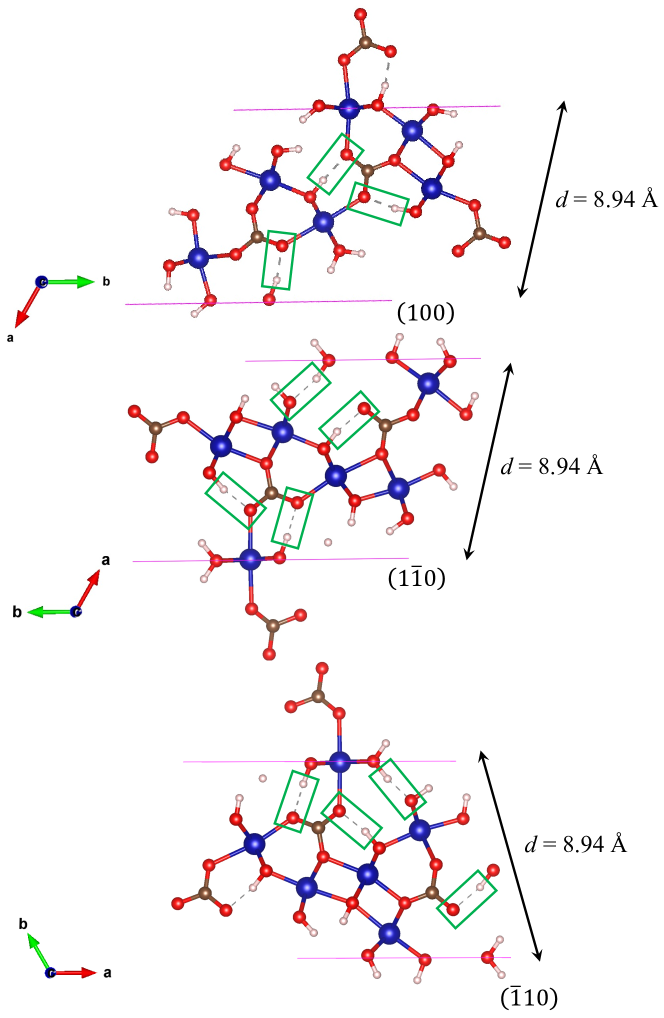
In order to correctly assign XRD peaks to Miller indices, we performed the XRD simulation based on the correct CCH crystal structure obtained computationally, where its unit cell came from NA-CCH 13 and occupancy of structure water site was set to be . Note that our assignment of lattice planes is different from the previous one, 18 because the correct CCH structure is different from previously characterized ones. Then, we examined which plane contribute the morphology difference of NA- and CA-CCH electrodes from the XRD simulation results. It is well known that a XRD peak position identifies certain lattice planes, whereas the relative peak intensity shows an amount of the planes formed in a sample material. Figure 5 shows the XRD peaks in terms of relative intensity where the strongest value is set to be 100.

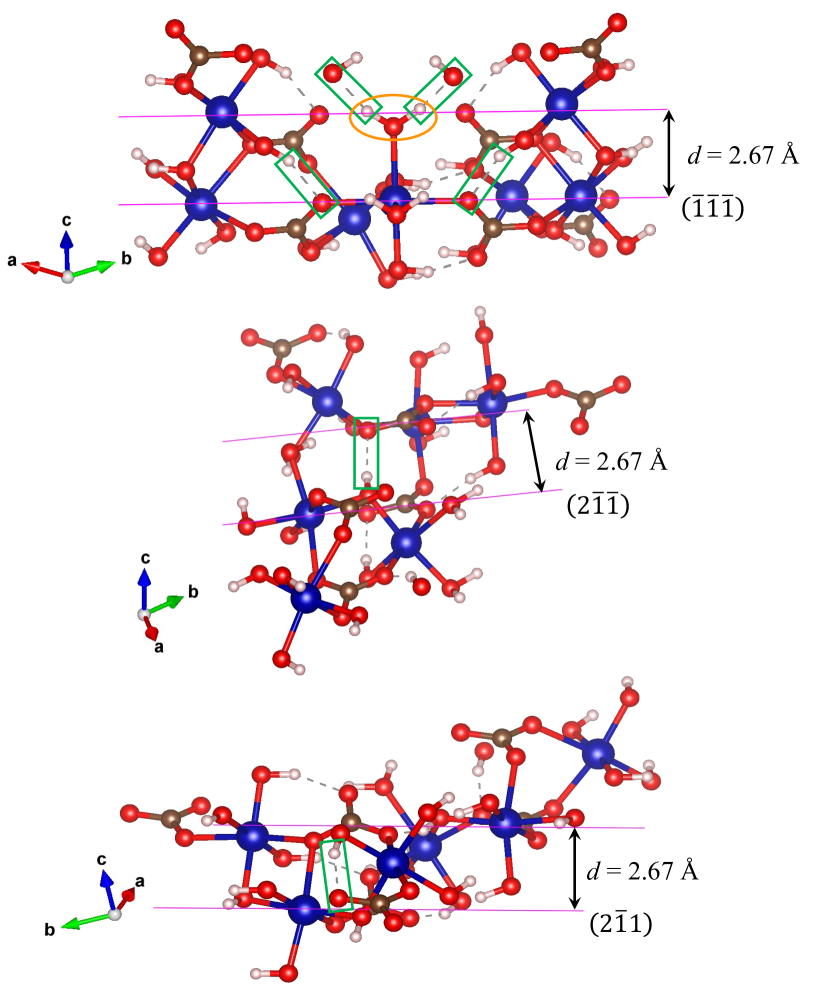
Here we focus on the two peaks at and ; the former is related to the crystal growth direction almost parallel to axis, whereas the latter to that toward -plane, as shown below. Note that each of the peaks consists of several lattice planes with different intensities, but our concern is only main peaks having their intensities more than 20% of the strongest intensity. Eventually, the peaks at and correspond to sets of lattice planes (1) and (2) , respectively; their structures are given in Supporting Information (SI). Note that only representative lattice planes appear in Figure 5, whereas their equivalent planes are omitted. (1) Looking at the former planes, we can see that H-bonds (encompassed with green rectangular) are formed on -planes connecting the planes (Figure S-1). These H-bonds can promote the 2D crystal growth (- and -axis directions). The above finding is similar to the and planes. (2) For the latter, H-bonds are formed so as to connect the planes, whose direction is almost parallel to -axis (Figure S-2). These H-bonds can work for the 1D crystal growth (-axis direction), which can be called “H-bond-driven 1D crystal growth”. This holds for the and planes as well. Thus, a comparison between and can tell us about the crystal growth direction.
The NA- and CA-CCH electrodes have different surfaces with specific lattice planes, which is caused by the difference in their different crystal growth directions. To investigate their difference, we make a comparison of their intensities. For that purpose, we adopt a ratio of the peak intensity at to that at :
| (10) |
Recall that the simulated XRD peaks are computed for an isotropic CCH bulk. In contrast, anisotropic CCH electrodes have different values from the bulk, though they have the same as the bulk. Thus, the NA-CCH and CA-CCH electrodes have different values from the bulk. Table LABEL:tab:peakRatio lists at and and for the bulk and the NA- and CA-CCH electrodes (obtained from Figure 1 (b) in Ref. 18). It is found that the NA- and CA-CCH electrodes have and , respectively. As we mentioned, relatively stronger peaks mean more amount of the corresponding planes than others formed in a material. Thus, the plane set is formed more than the set in NA-CCH. This means that NA-CCH exhibits the 1D crystal growth toward -axis. In contrast, is formed more than in CA-CCH, indicating that the crystal growth direction of CA-CCH is more 2D than NA-CCH. Here we also see that the value of CA-CCH is almost same as that of the bulk NA-CCH. This indicates that in CA-CCH, the 1D crystal growth toward -axis is balanced with the 2D one inside -planes. In other words, the CA-CCH structure is 3D, similar to the bulk NA-CCH structure. To sum up, the NA-CCH electrode is 1D, whereas the CA-CCH one is 3D, which can be attributed to the H-bonds formed therein.
| NA-CCH 18 | 60 | 100 | 1.7 |
| CA-CCH 18 | 80 | 35 | 0.44 |
| bulk NA-CCH(present study) | 100 | 44 | 0.44 |
We have investigated why the directions of H-bonds in NA-CCH are different from those in CA-CCH. NO and CO are used as cobalt counter anions to synthesize NA- and CA-CCH, respectively. Their difference in reactants gives rise to that in occupancy of structural waters. 18 It has been observed experimentally that NA-/CA-CCH with a higher/lower H2O occupancy grow one/two-dimensionally, implying that the structural waters inhibit the 2D crystal growth. 18 As shown in Figure S1, a structural water (encompassed with an orange ellipse) forms two H-bonds between the planes. The -axis H-bond involving the structural water is considered to promote the one-dimensional crystal growth of NA-CCH. In contrast, the structural water in CCH can be regarded as a growth inhibitor in the 2D direction.
In addition to the peak intensities, the peak broadening provides an insight into the capacitance difference between the NA- and CA-CCH electrodes. NA-CCH was found to have broad peaks in the overall angle range. 18 The presence of these broad peaks can be attributed to the size of crystals and defects in the NA-CCH electrodes. The Co(OH)2 phase is present in the NA-CCH electrode. 3 Since the NA-CCH crystal growth direction is -axis, 13 Co(OH)2 layers are anisotropically stacked along the -axis direction, when synthesizing the NA-CCH electrode with CCH precursors. The Co(OH)2 is considered to be the phase: it has two polymorphs, -Co(OH)2, where the phase is metastable and transformed easily into the phase. 29 This indicates that -Co(OH)2 rather than -Co(OH)2 is synthesized using the CCH precursor. Thus, we focus on the crystal growth and electrochemical reaction of the pristine -Co(OH)2 phase as well. The pristine -Co(OH)2 crystal has pore layers, and hence OH- ions enter into the pore layers, thereby leading to the deprotonation reaction in the crystal. In contrast, it has been observed from TEM images that plate surfaces contact with interlayers during the crystal growth to form the aggregated bulk electrode, i.e., thick plate structures of -Co(OH)2 aggregate into the -Co(OH)2 bulk electrode. 8 The contact site of the interlayer and plate surface can be prevent OH- ions from entering into the interlayer where the deprotonation reaction occurs. The Co(OH)2 phase is formed from the crystal surface by decarboxylation reaction between CCH and OH-. The pore layers of deprotonation sites in the -Co(OH)2 are oriented to electrolyte. Eventually, more anisotropic -Co(OH)2 is synthesized than pristine -Co(OH)2.
4 Discussion
4.1 Morphology-driven storage
properties
Table LABEL:tab:perform lists storage properties (capacity and cycle life) of high- and low-capacity CCH electrodes, NA-CCH 3 and CA-CCH 11, 4, as well as pristine -Co(OH)2 electrodes for comparison, which has been reported in previous studies. Their differences can be interpreted in terms of their morphologies, as shown below.
| electrode | morphology | capacity | cycle life |
|---|---|---|---|
| @[electron density] | @[charge density]/(cycles) | ||
| /Fg-1@Ag-1 | /%@Ag-1 | ||
| CCH@NF 12 | umbrella-like NWA | 1227[@2.25] | 93.7[@4.0](10000) |
| CCH@NF 3 | umbrella-like NWA | 1381[@2.0] | 93.5[@40.0](5000) |
| CCH@SS 4 | nanorod-assembled | 165.6[@0.1] | 100.0[@0.5](1000) |
| -Co(OH)2 7 | porous film | 1473[@2.0] | 88.0[@6](1000) |
| -Co(OH)2@CFP 8 | nano plate | 800[@2.0] | 95.7[@2](8000) |
First, we investigate the CA-CCH electrodes. As mentioned previously, the CA-CCH electrodes are composed of single crystals, where the Co(OH)2 phases hardly exist inside the crystal. In addition, the CA-CCH electrodes have less defect with smaller surface areas (relative to bulk region) than the NA-CCH. This implies that OH- ions in the electrolytic solution are hindered from diffusing into the inside region in the CCH crystal. In other words, the OH- ion diffusions just occur in restricted surface areas. These conjectures would give rise to the low capacitance of 165 F/g in the CCH electrode aggregated on a stainless-steel substrate forming nanorod-assembled hierarchical structures 4, as shown in Table LABEL:tab:perform. This assembled structure consists of 1-D aggregated rod, whereas each rod unit is two-dimensionally grown. The 2-D morphology causes the deprotonation reaction to occur only around the surface regions; therefore, the reaction become reversible, leading to the “perfect” cycle life, as shown in Table LABEL:tab:perform.
In contrast, the NA-CCH electrodes have significantly different morphologies from the CA-CCH ones: NA-CCH is composed of not only CCH but also Co(OH)2 phases, i.e., multiphase, with small crystal sizes and defects, compared to NA-CCH. 18, 3, 12 The smaller crystal sizes lead to the wider surface areas compared to the bulk region, increasing the diffusion sites of OH- ions on the surface and hence forming the Co(OH)2 phase. The surface defects and grain boundaries also enhance the OH- diffusions inside the single crystals and on the single-crystal surfaces located in the polycrystals, respectively. Specifically, grain boundaries may promote the formation of the Co(OH)2 phase. Eventually, the high capacity of NA-CCH can be attributed to the above characteristic morphologies. The 1-D morphology enhances the deprotonation reaction occurring at the Co(OH)2 phases. Therefore, the NA-CCH morphology leads to higher capacity, but lower life cycle, compared to those of CA-CCH. However, NA-CCH partially contains the CCH phase, which make the electrode more stable than the pristine Co(OH)2 phase. This is the reason why NA-CCH has longer life cycles (%) than the pristine -Co(OH)2 electrode. In contrast, the pristine -Co(OH)2 electrode has longer life cycles ( %) than the NA-CCH electrodes (%), but in turn has a significantly lower capacity ( F/g). In general, there exist a counterbalance between capacity and life cycle.
4.2 Further details for NA-CCH
Within the framework of the NA-CCH electrodes, their morphologies significantly vary depending on their growth times, which affects their storage performance. For instance, as per Liu et al., 3 the CCH precursors were grown on NF substrates and the morphologies of the NA-CCH electrodes controlled the growth times of 6 and 10 h (designated as NA-CCH@NF-6h and NA-CCH@NF-10h, respectively). Both the electrodes have ewire structures having larger surface areas perpendicular to their substrates, compared to the CA-CCH electrodes. However, upon comparing them, a remarkable difference in the wire orientations was found relative to the substrate.
NA-CCH@NF-10h has an umbrella-like nanowire structure, which corresponds to that listed in Table LABEL:tab:perform. In contrast, NA-CCH@NF-6h has a nanoneedle structure oriented perpendicular to the substrate. According to experimental observations based on XRD and TEM, the NA-CCH@NF-6h structure is more uniaxially-anisotropic than the NA-CCH@NF-10h one, hence the former has wider surface areas on the sides perpendicular to the substrate than the latter.
Their structural/morphological difference results in the difference in the storage performance. Actually, NA-CCH@NF-6h has a higher capacity (1548 F/g(@2 A/g)) than NA-CCH@NF-10h (1381 F/g(@2 A/g)) at the initial stage of charge-discharge cycle. This can be explained as follows: NA-CCH@NF-6h and NA-CCH@NF-10h are almost identical to each other in terms of the broadness of the XRD peak patterns. This implies that they have almost same defect structures. Therefore, the capacity difference between NA-CCH@NF-6h and NA-CCH@NF-10h can be attributed to their difference in the surface areas; during the initial cycles, the OH- ions react with the CCH surface and further diffuse into the inside crystal. This reaction in NA-CCH@NF-6h enhances the capacity, but rapidly degrades the cycle stability, giving rise to the deformation of the structure. Because of its 1-D morphology, the unstable structure in NA-CCH@NF-6h can be attributed to the less hydrogen bonds and chemical bonds with CO than the pristine CCH crystal (Figure 2 (a)). In the middle stage of the charge-discharge cycle, the structural change inhibits the OH- ions from diffusing into the interlayers inside the crystal. Finally, the NA-CCH@NF-6h electrode melts down, losing the storage performance.
Recently, the storage performance has been reported for a CCH electrode similar to the NA-CCH@NF-10h one, exhibiting a high capacity of 1227 F/g(@2.25 A/g) and high cycle stability of 93.7 % (@4 A/g) after 10,000 cycles. 12 The CCH phase contributes to the cycle stability due to its hydrogen and chemical bonds, whereas the Co(OH)2 phase enhances the capacity albeit the less stability. The above high performance was achieved by counterbalancing the two phases. This study has highlighted the possibility of regulating the ratio of the CCH phase versus the Co(OH)2 phase by controlling the reaction surface area.
5 Conclusion
We performed exhaustive first-principles simulations to identify a hexagonal CCH structure, especially for atomic positions of cobalt vacancies and hydrogen atoms. The resultant structure is a structural model of reductant in the electrochemical reaction of CCH-based electrodes. This was used to explore the oxidant structure. The reductant and oxidant structures help us evaluate the EMF of the deprotonation reaction. The computed EMF value of V (vs. SCE) was much larger than that expected from the experimental potential window of V (vs. SCE). This indicates that the deprotonation reaction never occurs inside the CCH bulk, and therefore, the reaction sites are restricted to the surface regions in the pristine CCH electrode. The detailed information about the atomic positions revealed that the chemical and hydrogen bonds are formed between the planes, which prevent the hydroxide (OH-) ions diffusing into the inside crystal. We also performed the XRD simulation to assign XRD peaks to the Miller indices based on the computed structure with the correct hexagonal lattice. The reassigned Miller indices revised the crystal growth direction to be specified by the planes.
According to the above computational findings, we investigated how some CCH electrodes achieve a better storage performance than pristine Co(OH)2 electrodes. The revised crystal growth direction clarified the morphologies formed in the high-capacity CCH electrode synthesized with the NO counterion. The results help us understand the importance of both counterbalancing the coexisting CCH and Co(OH)2 phases and controlling their morphologies (e.g., forming an umbrella-like morphology) for achieving the best storage performance.
6 Acknowledgments
The computations in this work have been performed using the facilities of Research Center for Advanced Computing Infrastructure (RCACI) at JAIST. K.O. is grateful for the final support from JST SPRING (JPMJSP2102). R.M. is grateful for financial supports from MEXT-KAKENHI (22H05146, 21K03400, and 19H04692), from the Air Force Office of Scientific Research (AFOSR-AOARD/FA2386-17-1-4049; FA2386-19-1-4015). K.H. is grateful for financial support from MEXT-KAKENHI, Japan (JP19K05029, JP21K03400, JP21H01998, and JP22H02170), and the Air Force Office of Scientific Research, United States (Award Numbers: FA2386-20-1-4036).
References
- Fleischmann et al. 2020 S. Fleischmann, J. B. Mitchell, R. Wang, C. Zhan, D. en Jiang, V. Presser, and V. Augustyn, Chemical Reviews 120, 6738 (2020).
- Liang et al. 2021 R. Liang, Y. Du, P. Xiao, J. Cheng, S. Yuan, Y. Chen, J. Yuan, and J. Chen, 11, 1248 (2021).
- Lin et al. 2017 X. Lin, H. Li, F. Musharavati, E. Zalnezhad, S. Bae, B.-Y. Cho, and O. K. S. Hui, RSC Adv. 7, 46925 (2017).
- Shu et al. 2021 C. Shu, Y. Liang, Z. Zhang, and B. Fang, European Journal of Inorganic Chemistry 2021, 1659 (2021).
- Deng et al. 2009 M.-J. Deng, F.-L. Huang, I.-W. Sun, W.-T. Tsai, and J.-K. Chang, Nanotechnology 20, 175602 (2009).
- Mirzaeian et al. 2020 M. Mirzaeian, N. Akhanova, M. Gabdullin, Z. Kalkozova, A. Tulegenova, S. Nurbolat, and K. Abdullin, Energies 13, 5228 (2020).
- Kong et al. 2010 L.-B. Kong, M.-C. Liu, J.-W. Lang, M. Liu, Y.-C. Luo, and L. Kang, 15, 571 (2010).
- Deng et al. 2017 T. Deng, W. Zhang, O. Arcelus, J.-G. Kim, J. Carrasco, S. J. Yoo, W. Zheng, J. Wang, H. Tian, H. Zhang, X. Cui, and T. Rojo, Nature Communications 8 (2017), 10.1038/ncomms15194.
- Ji et al. 2015 X. Ji, S. Cheng, L. Yang, Y. Jiang, Z. jie Jiang, C. Yang, H. Zhang, and M. Liu, Nano Energy 11, 736 (2015).
- Choi et al. 2013 B. G. Choi, M. Yang, S. C. Jung, K. G. Lee, J.-G. Kim, H. Park, T. J. Park, S. B. Lee, Y.-K. Han, and Y. S. Huh, ACS Nano 7, 2453 (2013).
- Ghosh et al. 2015 D. Ghosh, M. Mandal, and C. K. Das, Langmuir 31, 7835 (2015).
- Liu et al. 2021 Q. Liu, Y. Chen, J. Ma, X. bo Xiong, X. rong Zeng, and H. Qian, 421, 127452 (2021).
- Bhojane et al. 2019 P. Bhojane, A. L. Bail, and P. M. Shirage, Acta Crystallographica Section C Structural Chemistry 75, 61 (2019).
- Porta et al. 1992 P. Porta, R. Dragone, G. Fierro, M. Inversi, M. L. Jacono, and G. Moretti, J. Chem. Soc., Faraday Trans. 88, 311 (1992).
- Simon and Gogotsi 2008 P. Simon and Y. Gogotsi, 7, 845 (2008).
- Kim et al. 2018 C. Kim, I. Kim, H. Kim, M. K. Sadan, H. Yeo, G. Cho, J. Ahn, J. Ahn, and H. Ahn, 6, 22809 (2018).
- Toma et al. 2020 T. Toma, R. Maezono, and K. Hongo, 3, 4078 (2020).
- Xu and Zeng 2003 R. Xu and H. C. Zeng, The Journal of Physical Chemistry B 107, 12643 (2003).
- Momma and Izumi 2011 K. Momma and F. Izumi, J Appl Cryst 44, 1272 (2011).
- CRC Handbook 2007 CRC Handbook, CRC Handbook of Chemistry and Physics, 88th Edition, 88th ed. (CRC Press, 2007).
- Kresse and Furthmüller 1996 G. Kresse and J. Furthmüller, Phys. Rev. B 54, 11169 (1996).
- Kresse and Joubert 1999 G. Kresse and D. Joubert, Phys. Rev. B 59, 1758 (1999).
- Blöchl 1994 P. E. Blöchl, Phys. Rev. B 50, 17953 (1994).
- Perdew et al. 1996 J. P. Perdew, K. Burke, and M. Ernzerhof, Physical Review Letters 77, 3865 (1996).
- Wdowik and Parlinski 2007 U. D. Wdowik and K. Parlinski, Phys. Rev. B 75, 104306 (2007).
- Grimme et al. 2010 S. Grimme, J. Antony, S. Ehrlich, and H. Krieg, The Journal of Chemical Physics 132, 154104 (2010).
- Johnson and Becke 2006 E. R. Johnson and A. D. Becke, The Journal of Chemical Physics 124, 174104 (2006).
- Monkhorst and Pack 1976 H. J. Monkhorst and J. D. Pack, Phys. Rev. B 13, 5188 (1976).
- Gaunand and Lim 2002 A. Gaunand and W. Lim, Powder Technology 128, 332 (2002).
Supplemental Materials: First-Principles-Based Insight into Electrochemical Reactivity in a Cobalt-Carbonate-Hydrate Pseudocapacitor
7 Hydrogen bonding between specific planes.
NA-CCH and CA-CCH are known as Cobalt Carbonate Hydroxide (CCH) electrode materials which have different crystal growth directions (NA-CCH : one-dimensional, CA-CCH : two-dimensional). Both materaials have very different capacitor properties due to its molphology difference. We found that the difference in crystal growth direction can be explained by the hydrogen bonding direction. For NA-CCH, more number of the three crystal planes () in Figure S 2 are formed than that of the three crystal planes () in Figure S 1. On the other hand, CA-CCH shows opposite trend. Therefore, the hydrogen bonding of NA-CCH would be dominantly formed to -axis direction than inner plane direction. Conversely, hydrogen bonding in the inner plane direction would be dominant for CA-CCH.
Furthermore, this difference of hydrogen bonding direction would be explained by the difference of occupancy ratio of structural water site. As shown the -axis directional hydrogen bonding in Figure S2, structural water site (orange-colored ellipses) forms two hydrogen bonding between () plane. NA-CCH has higher occupancy ratio of the structural water site than CA-CCH. Therefore, hydrogen bonding site provided by structural water site would promote one directional crystal growth of NA-CCH.